GOM Oil Production fuels US June Increase

A Guest post by Ovi

All of the Crude plus Condensate (C + C) production data for the US state charts comes from the EIAʼs Petroleum Supply monthly PSM. 
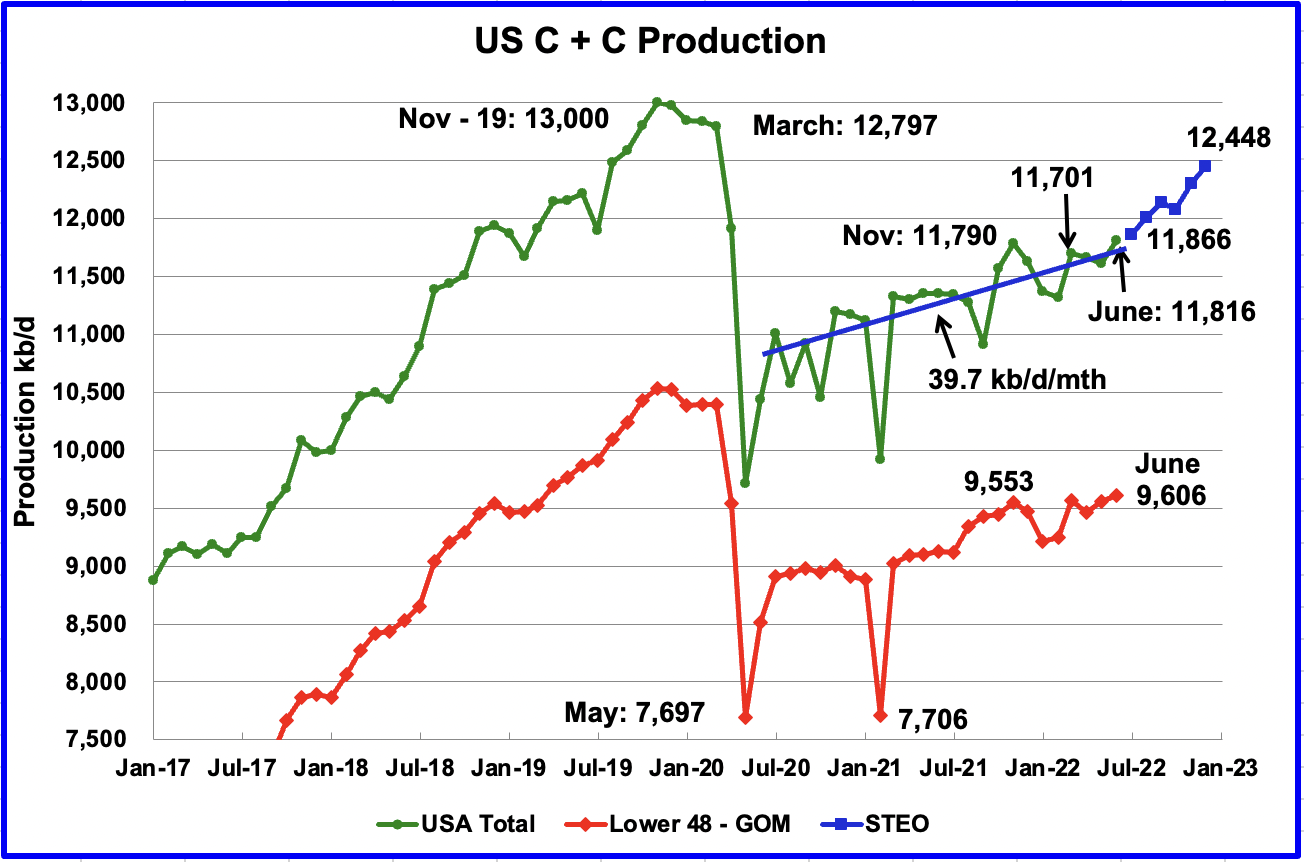
U.S. June production increased by 201 kb/d to 11,816 kb/d. Of the 201 kb/d increase, the largest increase came from the GOM, 183 kb/d. June’s production was a new recent high at 26 kb/d higher than November 2021 which was producing at a rate of 11,790 kb/d.

Read More
US February Oil Production Surprises to the Downside

A guest post by Ovi

All of the oil (C + C) production data for the US state charts comes from the EIAʼ’s Petroleum Supply monthly PSM. 

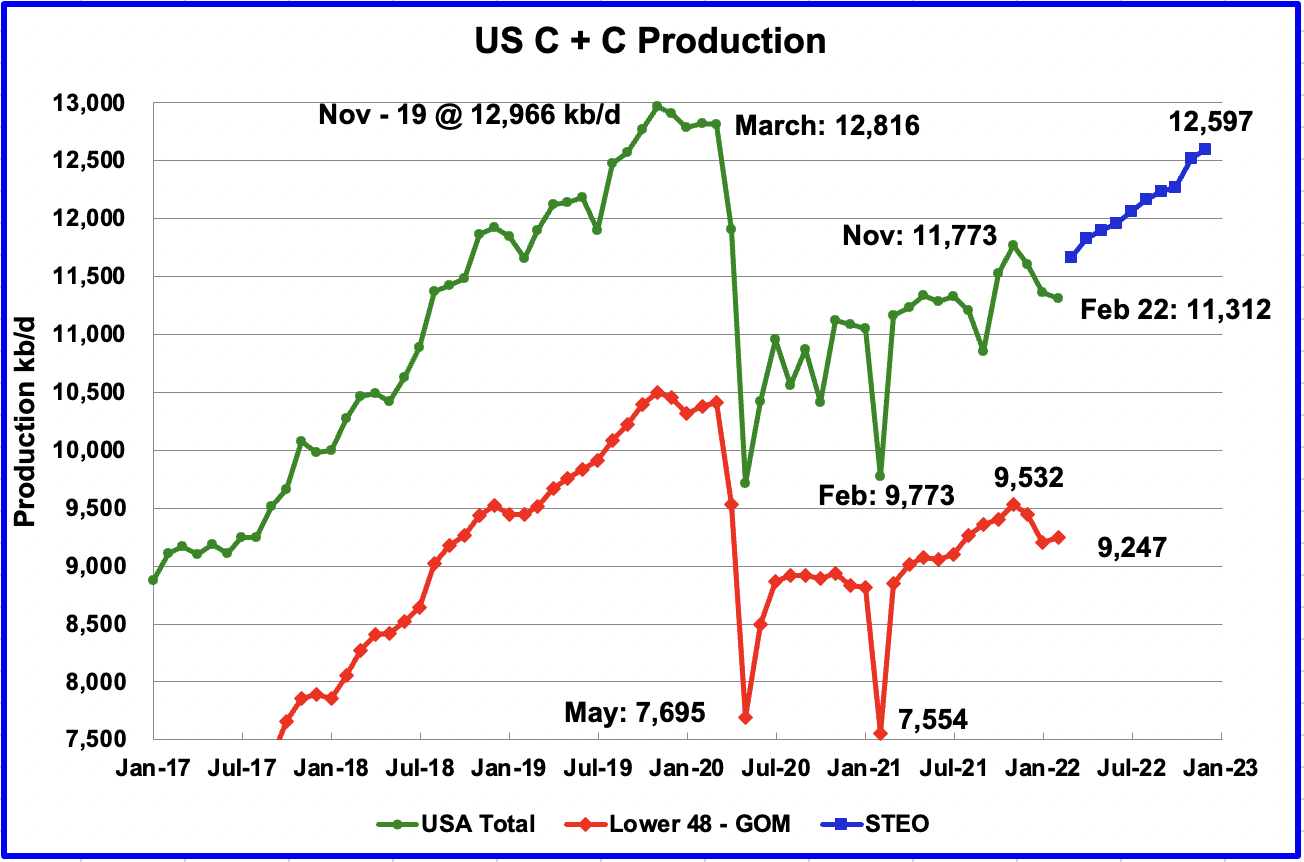
U.S. February production decreased by a surprising 50 kb/d to 11,312 kb/d. Relative to November 2021 production of 11,773 kb/d, it has dropped by 461 kb/d. The main declining states were Texas 27 kb/d and ND 23 kb/d.  The major decliner was the GOM which dropped by 93 kb/d. Of the top 3 states, only New Mexico increased its production.

Read More

US January Production Drop Surprises

A guest post by Ovi

All of the oil (C + C) production data for the US state charts comes from the EIAʼ’s Petroleum Supply monthly PSM

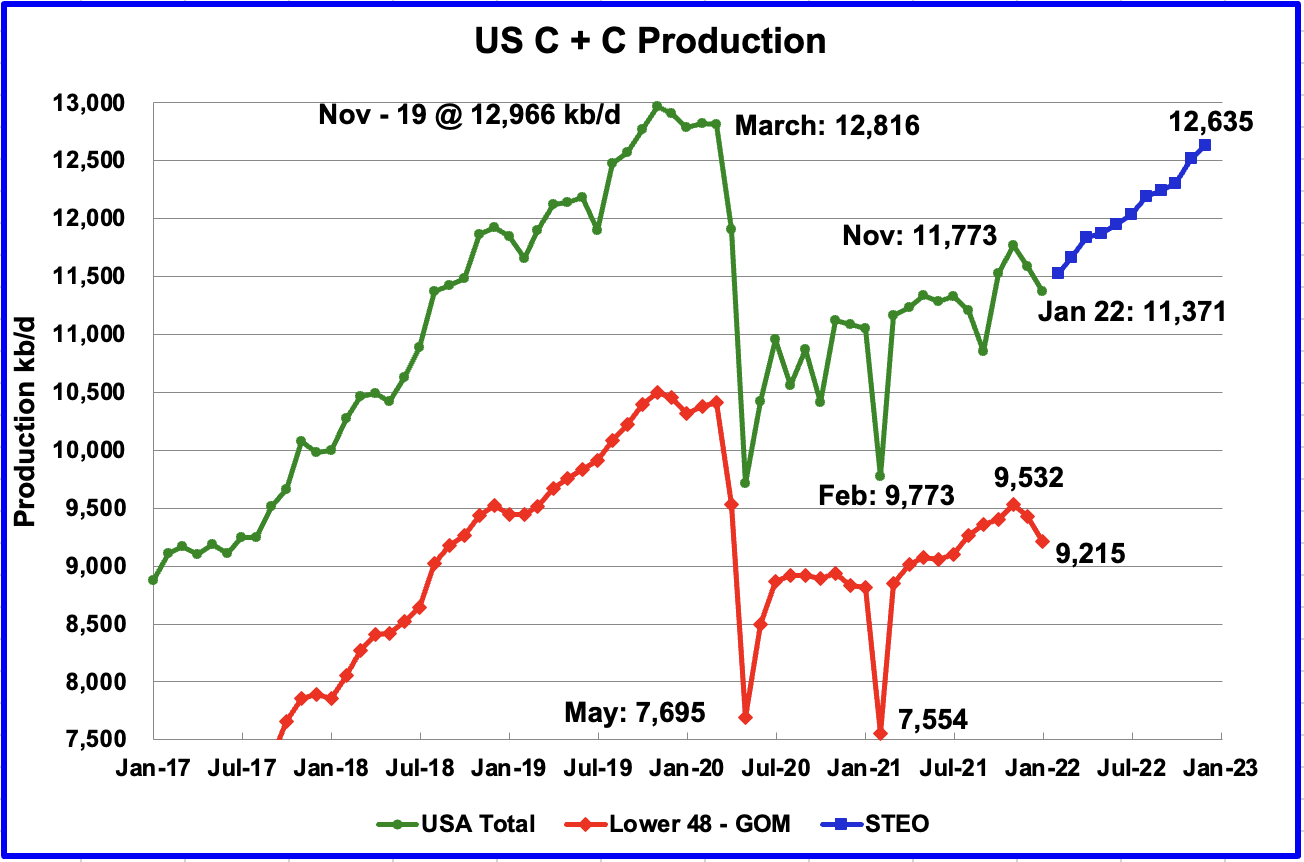
U.S. January production decreased by a surprising 216 kb/d to 11,371 kb/d. In December production dropped by 206 kb/d. The main declining states were Texas 120 kb/d, New Mexico 31 kb/d, and ND 24 kb/d.  Of the top 10 states, only Colorado increased its production.

Read More