Revisiting the IEA’s World Energy Outlook 2013

I was going over the IEA’s World Energy Outlook 2013 and noticed a few things you might find interesting. Exactly what is their opinion on Peak Oil? Here, cut and pasted from the report.

IEA 2

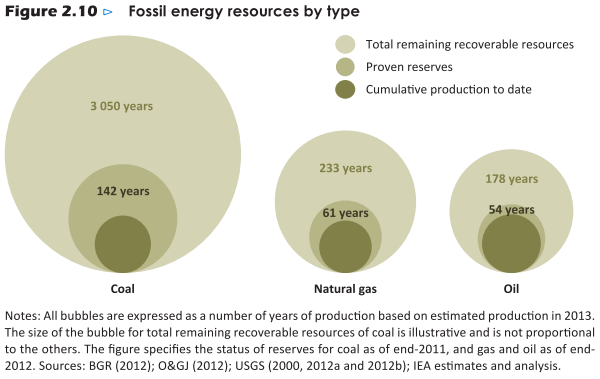
 Got that? The URR is great enough to delay any peak until after 2035. Here is one of their graphs that indicate how much they think is left, coal, gas and oil.

IEA 1

Okay 54 years of proven reserves. That puts the peak out to well past mid century. Likely well past 2100 if you count those remaining recoverable resources. And just who has all this oil?

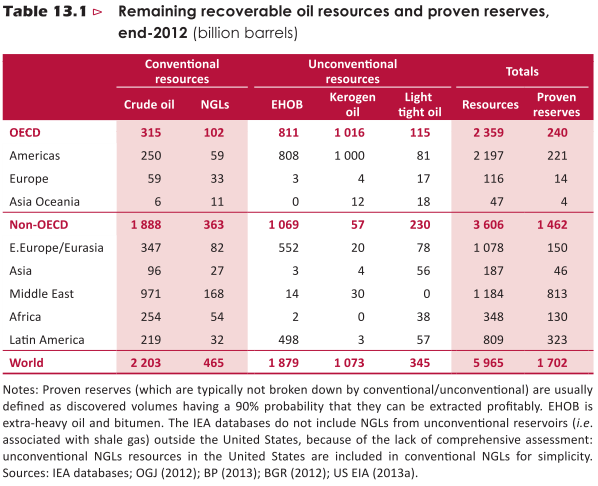
IEA 10

2.2 trillion barrels of conventional crude oil resources. However only 1.7 trillion barrels of that has a 90% probability of being recoverable. Of this the Middle East has the lions share, 971 billion barrels of resources with a 90% probability of recovering 813 billion barrels of that.

Read More

OPEC Update and EIA Short Term Energy Outlook

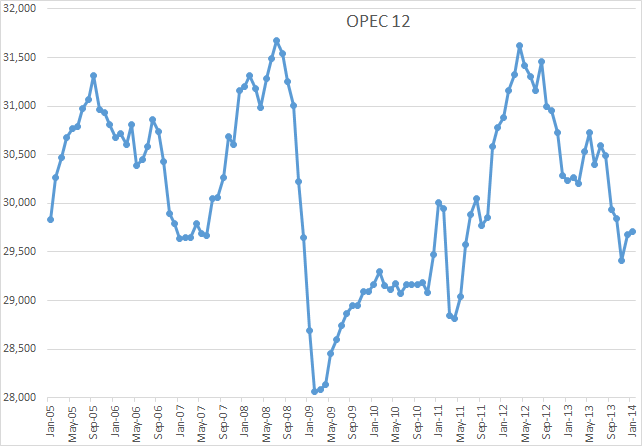
The OPEC Monthly Oil Market Report is just out with OPEC crude only production numbers for January 2014. OPEC Crude production was up 28,000 bp/d in January but that was after December production had been revised upward by 240,000 bp/d. November production was revised down by 51,000 bp/d.

OPEC 12

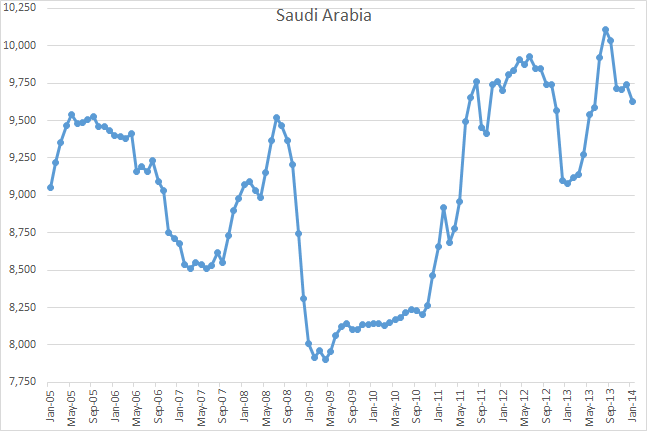
Of course Saudi is always the one to watch because it is generally believed that they have spare capacity. I think they had spare capacity back in 2011 but are now producing flat out, just like every other OPEC producer.

Saudi Arabia

Saudi crude production was down 115,000 bp/d in January but that was after December production had been revised upward by 119,000 bp/d and November revised up 52,000 bp/d. I think that surge upward early in 2013 is a telling indication. That was Manifa coming on line.

Libya had the biggest gain in January, up 270,000 bp/d to 510,000. I guess peace may be breaking out in a few places there. Without Libya’s gain OPEC production would have been down by 242,000 bp/d.

Charts of all 12 OPEC nations can be found here: OPEC Charts.

Read More

EIA Quarterly Crude + Condensate Production Data

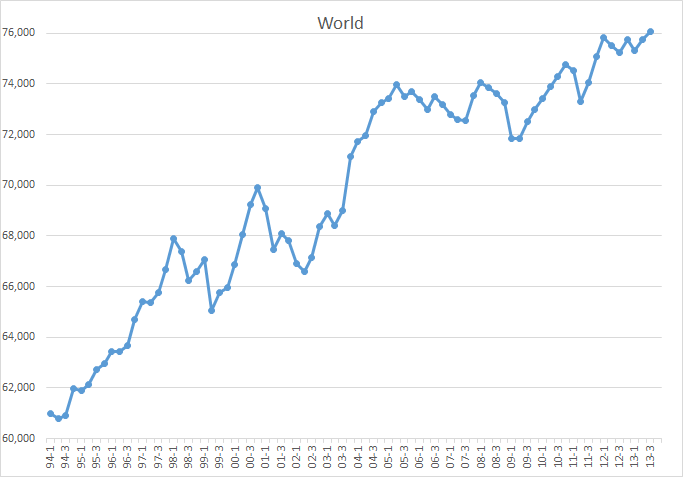
The EIA publishes all kinds of energy production data but I collect and chart only Crude + Condensate data. But that comes in three flavors, monthly, quarterly and yearly. I decided to chart the quarterly data and see if that looks any clearer than the monthly data.

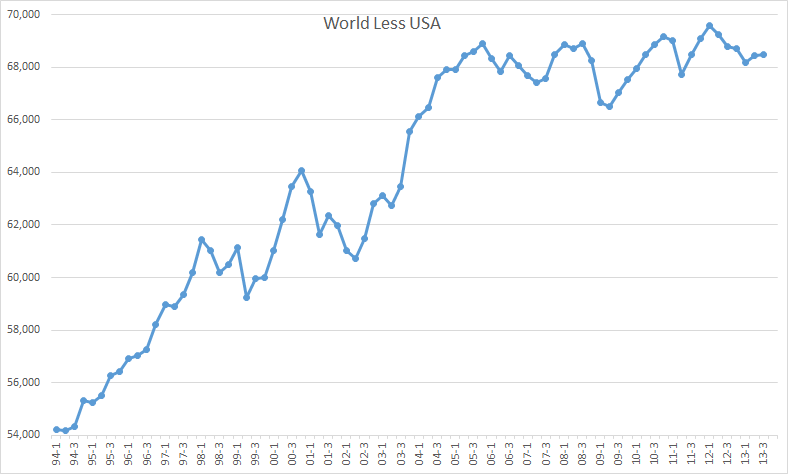
Quarterly C+C production in kb/d. The last quarter, 3rd, ends September 2013.

World

World C+C production has increased 2 million barrels per day since the 2nd quarter of 05. Who were the big gainers that caused this 2 million barrel per day increase?

World Less USA

Turns out it was all USA.
Read More