September Non-OPEC and World Oil Production Drops

By Ovi

The focus of this post is an overview of World oil production along with a more detailed review of the top 11 Non-OPEC oil producing countries. OPEC production is covered in a separate post.

Below are a number of Crude plus Condensate (C + C) production charts, usually shortened to “oil”, for oil producing countries. The charts are created from data provided by the EIA’s International Energy Statistics and are updated to September 2024. This is the latest and most detailed/complete World oil production information available. Information from other sources such as OPEC, the STEO and country specific sites such as Brazil, Norway, Mexico and China is used to provide a short term outlook. 

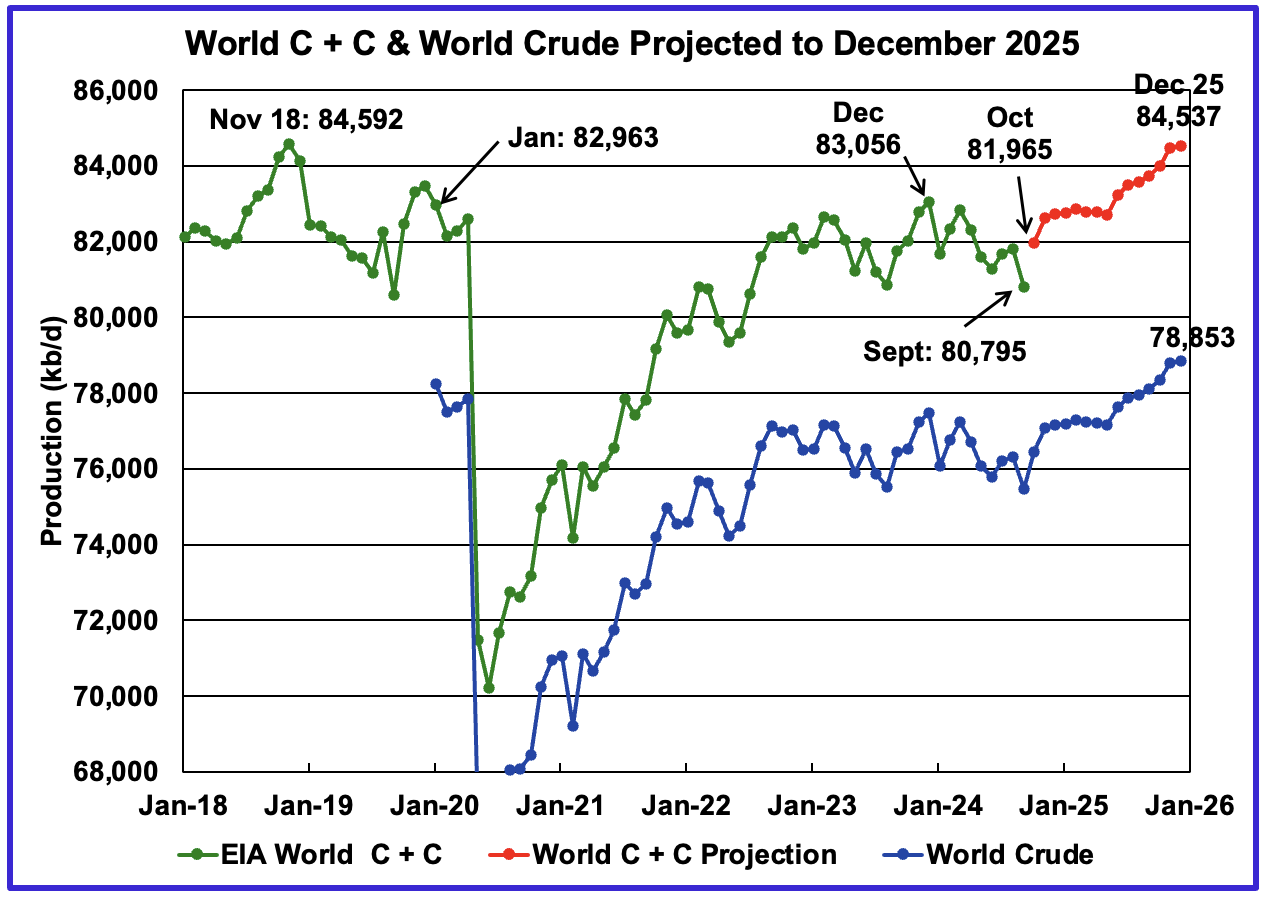
World oil production decreased by 1,014 kb/d in September to 80,795 kb/d, green graph. The largest decreases came from Libya, 350 kb/d, and Canada, 244 kb/d. October’s World oil production is projected to increase by 1,170 kb/d to 81,965 kb/d. Of that increase, Libya is expected to contribute close to 550 kb/d as its internal politics/oil dispute is settled.

Read More

All September Non-OPEC Oil Production Increase from US

A Guest Post by Ovi

Below are a number of Crude plus Condensate (C + C) production charts, usually shortened to “oil”, for Non-OPEC countries. The charts are created from data provided by the EIA’s International Energy Statistics and are updated to September 2022. This is the latest and most detailed world oil production information available. Information from other sources such as OPEC, the STEO and country specific sites such as Russia, Brazil, Norway and China is used to provide a short term outlook for future output and direction for a few countries and the world. The US report has an expanded view beyond production by adding rig and frac charts.

September Non-OPEC oil production increased by 229 kb/d to 49,962 kb/d. All of the increase came from the US, 289 kb/d. The largest offsetting decrease came from Norway 144 kb/d. Note that August output was revised down from 49,879 to 49,733 kb/d. This means that the September increase relative to the original August estimate is 83 kb/d.

October is expected to add 527 kb/d. This appears to be optimistic based on a few country charts below which project October production. Brazil +97 kb/d, Canada -600 kb/d, Kazakhstan +235 kb/d, Norway +100 kb/d and Russia +124 kb/d for a net of -44 kb/d. Maybe the EIA is not aware of the Canadian drop in October. The positive increments add 556 kb/d.

Read More

August Non-OPEC Oil Production Increases

A guest post by Ovi

Below are a number of Crude plus Condensate (C + C) production charts, usually shortened to “oil”, for Non-OPEC countries. The charts are created from data provided by the EIA’s International Energy Statistics and are updated to August 2022. This is the latest and most detailed world oil production information available. Information from other sources such as OPEC, the STEO and country specific sites such as Russia, Brazil, Norway and China is used to provide a short term outlook for future output and direction for a few countries and the world. The US report has an expanded view beyond production by adding rig and frac charts.

August Non-OPEC oil production increased by 138 kb/d to 49,879 kb/d. The largest increases came from Norway 147 kb/d and Brazil 124 kb/d. The largest offsetting decrease came from Kazakhstan 179 kb/d. 

Read More

June Non-OPEC Oil Production Rises from U.S. and Russia Boost

A guest post by Ovi

Below are a number of Crude oil plus Condensate (C + C ) production charts for Non-OPEC countries created from data provided by the EIA’s International Energy Statistics and updated to June 2022. This is the latest and most detailed world oil production information available. Information from other sources such as OPEC, the STEO and country specific sites such as Russia, Brazil, Norway and China is used to provide a short term outlook for future output and direction for a few countries and the world. The US report has an expanded view beyond production by adding rig and frac charts.

June Non-OPEC production increased by 178 kb/d to 48,990 kb/d. The largest increases came from Russia, 510 kb/d and the U.S., 201 kb/d. The largest offsetting decreases came from Kazakhstan, 381 kb/d and Norway, 285 kb/d. 

Read More

US Recovery Boosts October Non-OPEC Oil Production

A guest post by Ovi

Below are a number of oil, crude plus condensate (C + C ), production charts for Non-OPEC countries created from data provided by the EIA’s International Energy Statistics and updated to October 2021. Information from other sources such as OPEC, the STEO and country specific sites such as Russia, Brazil, Norway and China is used to provide a short term outlook for future output and direction for a few countries and the world.

Read More