A Guest post by Ovi
All of the Crude plus Condensate (C + C) production data for the US state charts comes from the EIAʼs November Petroleum Supply monthly PSM which provides updated information up to September 2022.
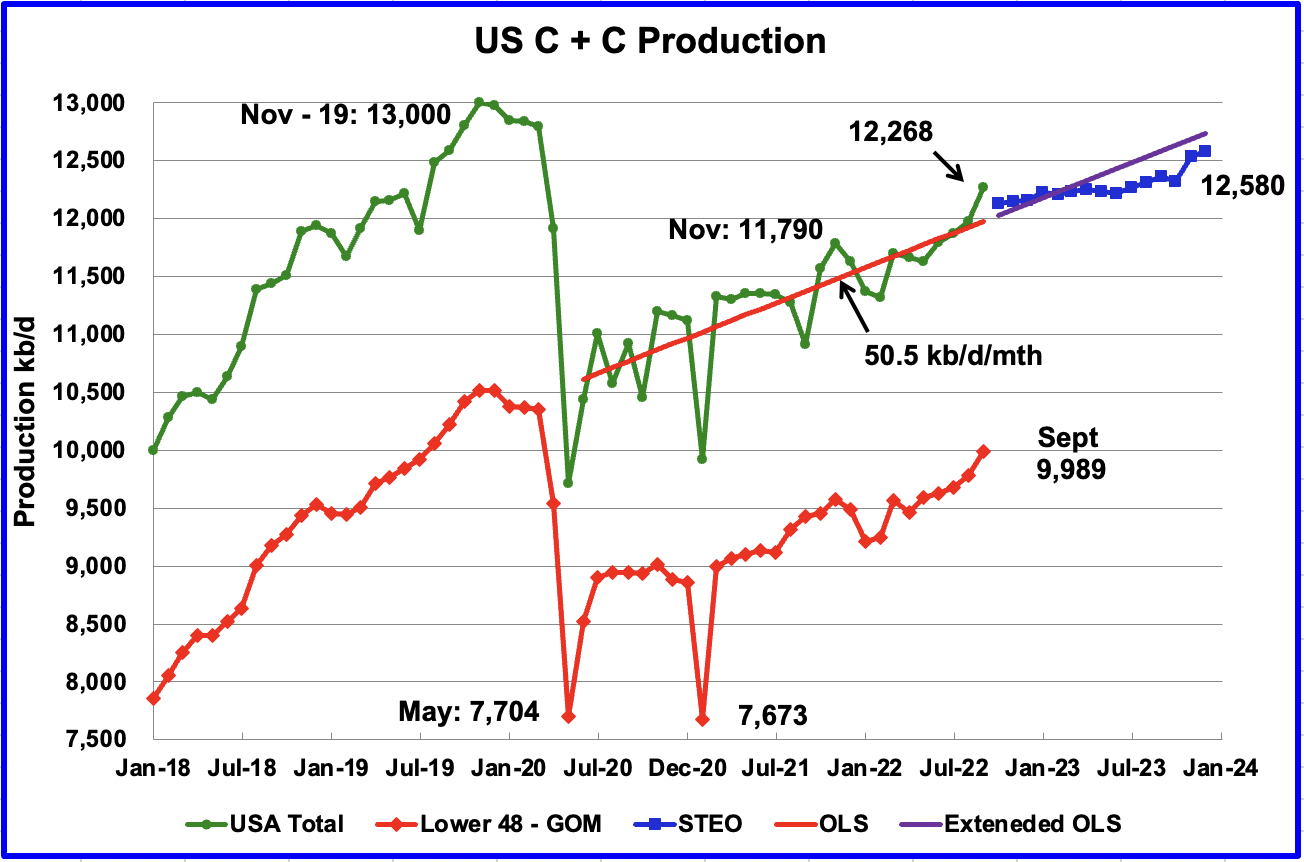
U.S. September production increased by 289 kb/d to 12,268 kb/d. It should be noted that August’s oil production was revised up by only 4 kb/d in the current September report. The large increase over the August update is real. For September, the states with the largest increase were Texas 90 kb/d, New Mexico 75 kb/d and North Dakota 43 kb/d. The Gulf of Mexico added 64 kb/d.
Read More