EIA Short Term Energy Outlook, Tight Oil Report, and IEA Oil Market Outlook, May 2023

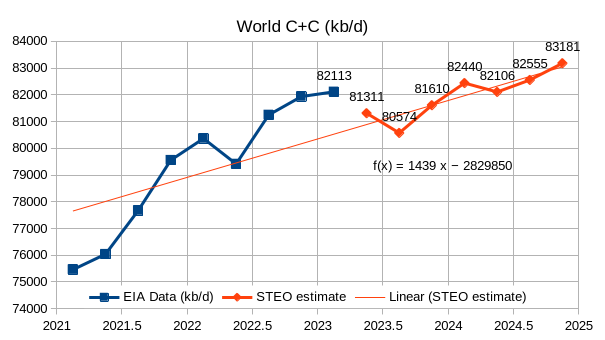
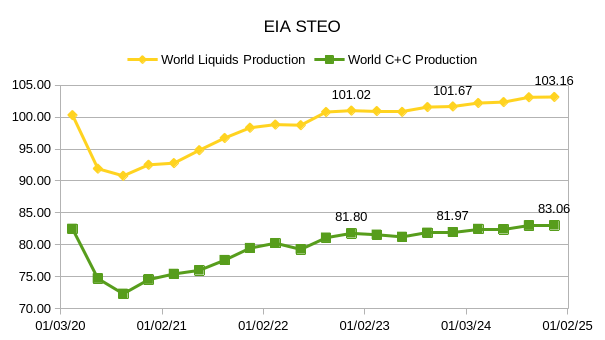
The EIA’s Short Term Energy Outlook (STEO) was published in early May. The report that follows compares World Petroleum Liquids output from the STEO with estimates from OPEC’s Monthly Oil Market Report (MOMR) from May and the IEA’s Oil Market Report (OMR) from February 2023 with an update on World liquids output based on the summary of the May report with my estimate on quarterly output in 2023 based on the annual estimate for 2023 published in May 2023 and the quarterly numbers published in February 2023.

Figure 1
Read More

EIA Short Term Energy Outlook and Annual Energy Outlook 2023

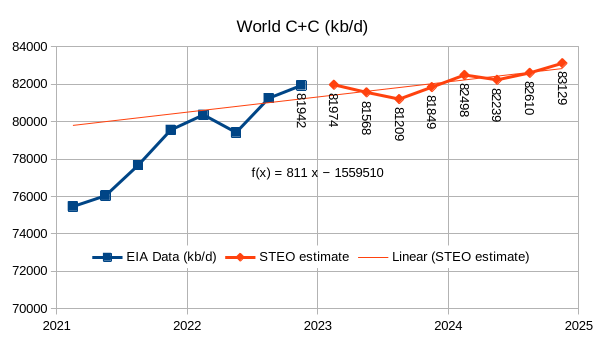
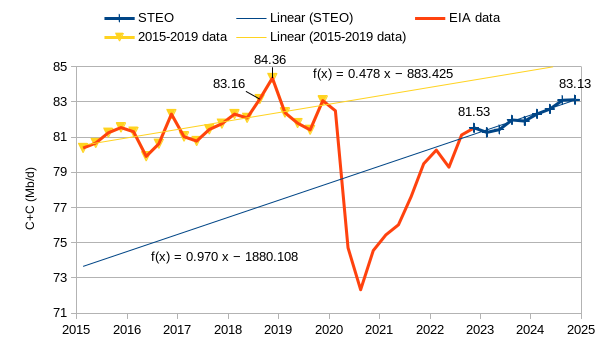
The EIA updated the Short Term Energy Outlook (STEO) in March and also released the 2023 version of the Annual Energy Outlook in March. This post will take a brief look at both of these reports with a focus on Crude plus Condensate (C+C) Output for the World, OPEC and Non-OPEC in the case of the STEO through the fourth quarter of 2024 and US C+C output for three oil price cases from 2022 to 2050, reference (medium oil price), high and low oil price cases.

Figure 1
Read More

US October Oil Production Pushed Higher by New Mexico

A guest post by Ovi

All of the Crude plus Condensate (C + C) production data for the US state charts comes from the EIAʼs December Petroleum Supply monthly PSM which provides updated information up to October 2022.

U.S. October production increased by 69 kb/d to 12,381 kb/d to a New post pandemic high.  It should be noted that September’s oil production increase of 289 kb/d to 12,268 kb/d which was reported last month and was considered high, was revised further up by 44 kb/d to 12,312 kb/d in the current October report. For September, the state with the largest increase was New Mexico 41 kb/d, along with a number of small increases from the smaller producing states.

Read More

Permian Pushes US September Oil Production to Post-Pandemic High

A Guest post by Ovi

All of the Crude plus Condensate (C + C) production data for the US state charts comes from the EIAʼs November Petroleum Supply monthly PSM which provides updated information up to September 2022.

U.S. September production increased by 289 kb/d to 12,268 kb/d.  It should be noted that August’s oil production was revised up by only 4 kb/d in the current September report. The large increase over the August update is real. For September, the states with the largest increase were Texas 90 kb/d, New Mexico 75 kb/d and North Dakota 43 kb/d. The Gulf of Mexico added 64 kb/d.

Read More