GOM Production and Other News

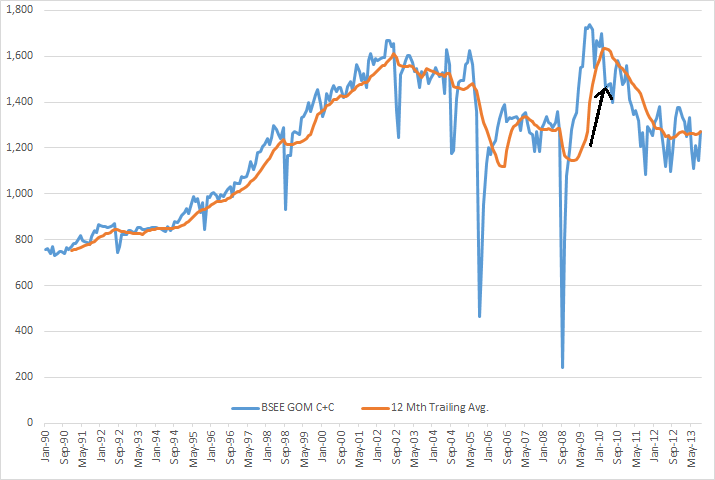
Not much happening on the Peak Oil front these days. I checked out the BSEE Gulf of Mexico production. Data is in kb/d with the last data point September 2013.GOM Production

Average production from the GOM has been relatively flat for the last two and one half years at about 1.260 million barrels per day. The arrow marks April 2010, the month of the Deepwater Horizon disaster.

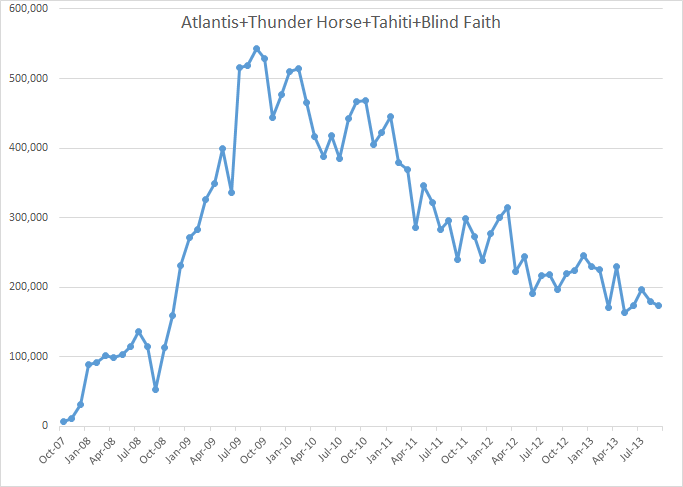
The big deepwater plays continue to decline. I guess they are bringing on other wells in order to keep production flat.

Atl+TH+Tahiti+BF

The above chart is combined liquids production of Atlantis, Thunder Horse, Tahiti and Blind Faith. The last data point is September 2013.

Read More

Problems and Politics Keeping Crude Oil Production Well Below Expectations

OPEC December Crude Output Falls to 2-Year Low: Survey

Venezuelan Policies

Venezuelan production dropped 235,000 barrels a day to 2.45 million this month, the survey showed. The South American country pumped the least crude since October 2011. Resources have been diverted from energy sector into social welfare programs, sending production lower.

Petroleos de Venezuela SA, the state oil company, was purged after a two-month oil strike intended to oust President Hugo Chavez from power in 2003. Nicolas Maduro, who became president in March when Chavez died, has continued his predecessor’s policies.

“It’s hard to see how the situation in Venezuela gets any better,” said Bill O’Grady, chief market strategist at Confluence Investment Management in St. Louis, which oversees $1.4 billion. “Funds have been used to prop up the government instead of maintaining the oil industry since the PDVSA strike in 2003. It’s clear the country is on an unsustainable path.”
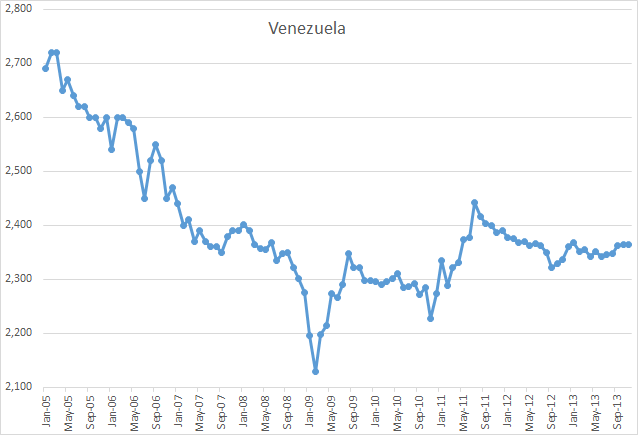
Venezuela

Data for the above graph is from the latest OPEC MOMR published last month and includes data through November 2012. It has Venezuela crude only production at 2,364,000 bp/d in November so it differs considerably from the Bloomberg report above. That report may be using production reported by Venezuela themselves which they reported as 2,854,000 bp/d for November or 490,000 kb/d above what the OPEC MOMR’s “secondary sources” said they produced.

Read More
When Will US Light Tight Oil (LTO) Peak?

Ron Patterson has graciously allowed me to cross post this here.  It originally was posted at oilpeakclimate.blogspot.com 

ltofig3/

The rapid rise in oil output since 2008 has the mainstream media claiming that the US will soon be energy independent.  US Crude oil output has increased about 2.8 MMb/d (56%) since 2008 and about 2 MMb/d is from the shale plays in North Dakota ( Bakken/Three Forks) and Texas (Eagle Ford). My modeling suggests that a peak from these two plays may be reached by 2016, other shale plays (also known as light tight oil [LTO] plays) may be able to fill the gap left by declining Bakken and Eagle Ford output until 2020, beyond that point we will see a rapid decline.

There are two main views:

  1. There will be little crude plus condensate (C+C) output from any plays except the Bakken/Three Forks in North Dakota and Montana and the Eagle Ford of Texas.
  2. The other LTO plays will come to the rescue when the Bakken and Eagle Ford reach their peak and keep LTO near these peak levels to about 2020 with a slow decline in output out to 2040.

Where are these “other LTO plays”?  There are a couple of these in Oklahoma and Texas (in the Permian basin, Granite Wash, Mississippian basin), the Appalachian, the Niobrara in Colorado, and others (see slide 17 of the USGS presentation link below).  Is it possible for these LTO plays to offset future declines in the Bakken and Eagle Ford?  I hope to answer that in this post.

Read More