More David Archibald on LTO plus Net Imports

David Archibald has recently revised his peak date for shale oil. The below was contained in a recent post I received from him:

Ron,

For what it is worth, just to let you know that I have recanted on my estimate of US LTO production.

This is from reading the presentations put out in September by the US independents.   I started with the EOG presentation and then worked through the others that EOG referred to.  If Hubbert-type analysis works for LTO, it may be too early to apply it.

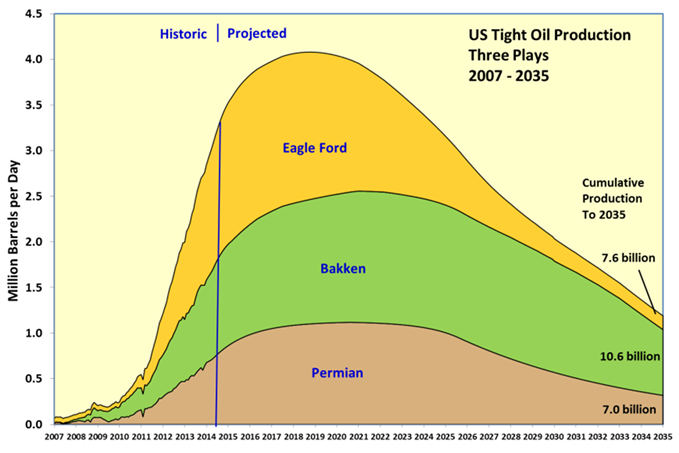
The rig count for the Bakken etc may be down to flat but the fraccing units are pumping a lot more sand and the economics of fraccing have improved a lot over the last two years.  That in turn means that the resource is larger at a given IRR cutoff.  This is currently my best guess of the three major plays:

David New 3

Others are appearing such as SCOOP in Oklahoma.

 I tried to make the graph useful by putting in the cumulative production to 2035 so that people can mentally adjust it for what they think EUR might be.  The Permian has a lot of NGLs and natural gas which means that the energy produced is about twice as large as the oil component.    The reason I didn’t make the Permian as peaky as the Eagle Ford for example is that there at lot of stacked plays in the Permian.  Once companies have got acreage and got one horizon working, they don’t have to be in a rush to develop the others.

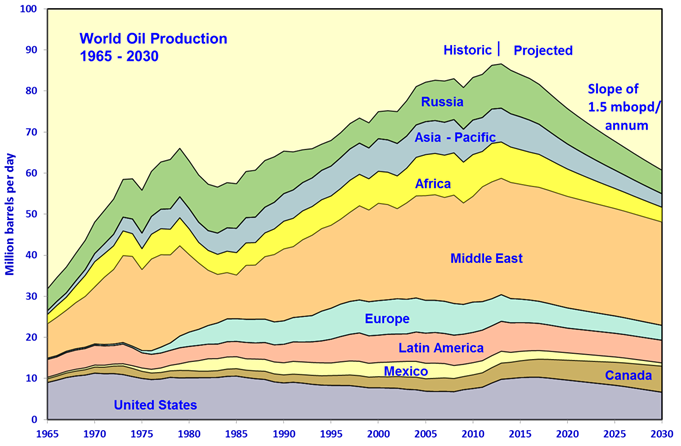
 The US LTO boom is worth about two to three years of conventional oil decline:David New 4
With further demand destruction, the US will become energy independent.
Read More
Bakken and N.D. Update for July

North Dakota has released their Bakken and North Dakota production numbers for July.

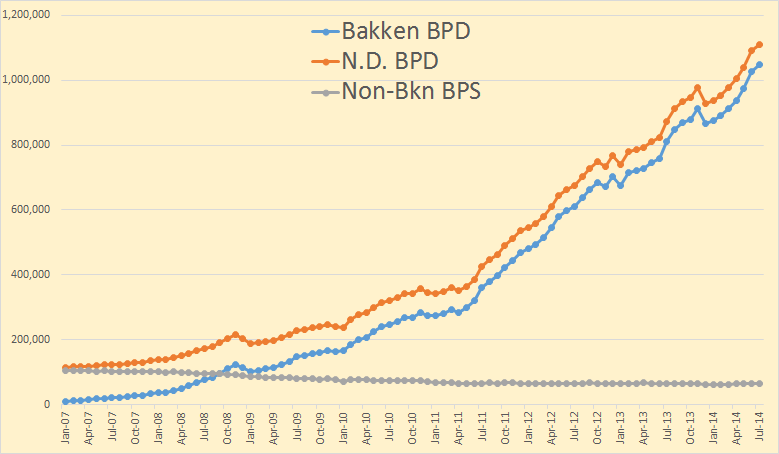
Bakken Barrels Per Day

Bakken production was up 19,456 bpd while all North Dakota production was up 18,134 barrels per day. This means that North Dakota production outside the Bakken fell by 1,322 bpd or a little over 2%.

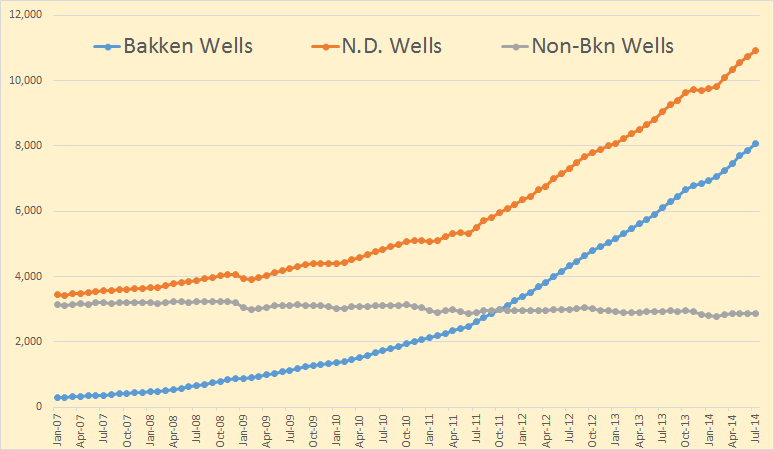
Bakken Wells

Bakken wells producing increased by 195 to 8,065. North Dakota wells increased by the same amount to 10,952 so non-Bakken wells were unchanged at 2,860.

Read More

Who’s Got Liquids? plus Further to the Bakken

This is another Guest Post by David Archibald

Who’s Got Liquids?

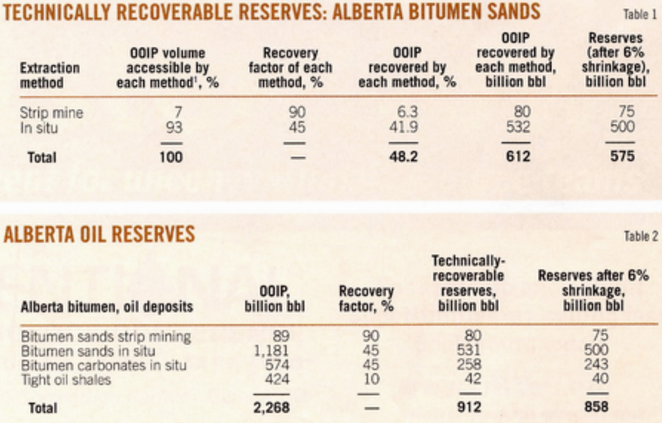
An article by Canadian consultant Mike Priaro in the 7th July, 2014 edition of Oil andGas Journal, “Grosmont carbonate formation increases Alberta’s bitumen reserves”, included the following tables:

David 1

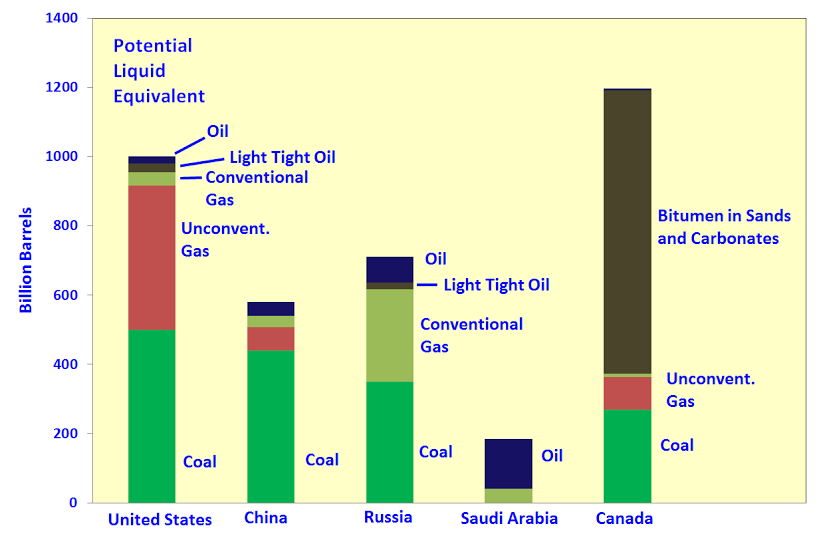
Mr Priaro’s estimate of Canada’s recoverable bitumen is 818 billion barrels. Almost all of that is in Alberta. Combined with their coal resources, Alberta has the biggest fossil fuel resource on the planet. I have updated my estimate of what some of the major countries have in the way of fossil fuels in this table:

David 2

The highest value fuels are those that can be used as liquids in transport. High quality coal produces 2.2 barrels of liquids through a FT plant. In the following graphic I have used a factor of 2x to convert coal to its oil equivalent. Six thousand cubic feet of gas has the energy equivalent of one barrel of oil. Natural gas can be used directlyin some transport applications. Putting it through an FT plant to make diesel, for example, would lose at least 30% of its initial energy. Natural gas has traditionally traded at the oil price in the US and conceivably might return to close to that level in a tight market. So in the following graph, natural gas in TCF is divided by six to produce its oil equivalent in billions of barrels. This is the graph:

David 3

Read More

Global and Russian Energy Outlook to 2040

Like BP, OPEC, the EIA and the IEA Russia also publishes an annual energy outlook. It is called the Global and Russian Energy Outlook to 2040. It is published by The Energy Research Institute of The Russian Academy of Sciences and The Analytical Center for The Government of The Russian Federation. I have no idea who these guys are but their titles sound impressive and they seem to be Russian think tanks funded by the Russian Government. But that is just an assumption of mine.

It is a very large 175 page PDF file that appears to be very scholarly and well researched. However they appear to be very optimistic in their prediction of the future oil supply out to 2040.  In one scenario they are not optimistic at all for coal production however.

The report has three scenarios, the Baseline Scenario where business as usual continues until 2040. The New Producers Scenario where oil prices collapse due to overproduction and The Other Asia Scenario which is based on peak coal and the effect this will have on China and India. In that scenario they assume China coal production will peak within the next ten years. The Baseline Scenario assumes adequate supplies of coal will be available however. Only in the Other Asian Scenario do they figure in peak coal. All three scenarios assume plenty of oil will be available through 2040.

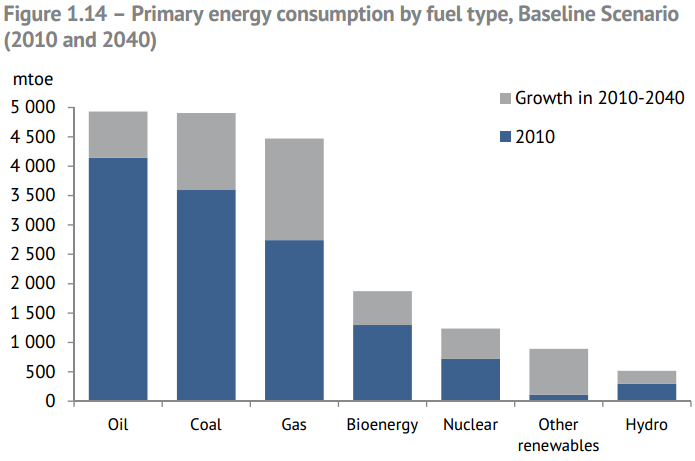
Russia Take Energy GrowthObviously they don’t see any peak in oil production out to 2040, only growth. However they have coal and gas growing even more. And they seem to be very optimistic about “other” renewables. I don’t know exactly what that might be.

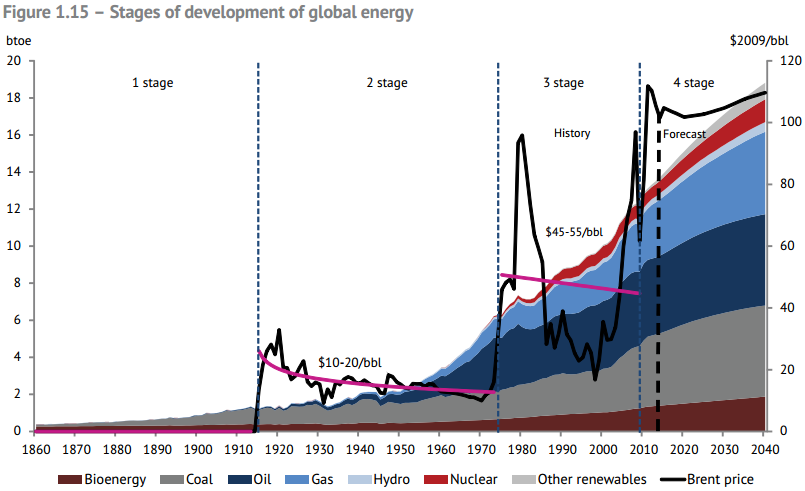
Russia's Take Price

And here is their take with an oil price overlay. It appears they think, because production increases right along with demand, that the oil prices will remain flat.

Read More

Oil Field Models, Decline Rates and Convolution

This post is by Dennis Coyne

The eventual peak and decline of light tight oil (LTO) output in the Bakken/ Three Forks play of North Dakota and Montana and the Eagle Ford play of Texas are topics of much conversation at the Peak Oil Barrel and elsewhere.

The decline rates of individual wells are very steep, especially early in the life of the well (as much as 75% in the first year for the average Eagle Ford well), though the decline rates become lower over time and eventually stabilize at around 6 to 7% per year in the Bakken.

What is not obvious is that for the entire field (or play), the decline rates are not as steep as the decline rate for individual wells. I will present a couple of simple model to illustrate this concept.

Much of the presentation is a review of ideas that I have learned from Rune Likvern and Paul Pukite (aka Webhubbletelescope), though any errors in the analysis are mine.

A key idea underlying the analysis is that of convolution. I will attempt an explanation of the concept which many people find difficult.

At Wikipedia there is a fairly mathematical presentation of the concepts which often confuses people.  There are a couple of nice visuals to convey the concept as well see this page.

In the visual below a function f (in blue) is convolved with a function g (in red) to produce a third function (in black) which we could call h where h=f*g and the asterisk represents convolution, just as a + symbol is used to represent addition.

Convolution of box signal with itself2.gif
Convolution of box signal with itself2” by Convolution_of_box_signal_with_itself.gif: Brian Amberg
derivative work: Tinos (talk) – Convolution_of_box_signal_with_itself.gif. Licensed under CC BY-SA 3.0 via Wikimedia Commons.

I think the best way to present convolution is with pictures. Chart A below shows a relationship between oil output (in barrels per month) and months from the first oil output for the average well in an unspecified LTO play.

This relationship is a simple hyperbola of the form q=a/(1+kt), where a and k are constants of 13,000 and 0.25 respectively, t is time in months, and q is oil output.

Chart A is often referred to as a well profile. The values for the constants were chosen to make the well profile fairly similar to an Eagle Ford average well profile. EUR30 is the estimated ultimate recovery from this average well over a 30 year well life.

blog140617/
Read More