The IEA Oil Market Report, full issue, is now available to the public. Some interesting observations:
Non-OPEC oil supplies are nevertheless seen sharply lower in December. Overall supplies are estimated to have slipped by more than 0.6 mb/d from the month prior, to 57.4 mb/d. A seasonal decline in biofuel production, largely due to the Brazilian sugar cane harvest, of nearly 0.4 mb/d was the largest contributor to December’s drop. Production in Vietnam, Kazakhstan, Azerbaijan and the US was also seen easing from both November’s level and compared with a year earlier. Persistently low production in Mexico and Yemen were other contributors to the year-on-year decline.
As such, total non-OPEC liquids output slipped below the year earlier level for the first time since September 2012. A production surge in December 2014 inflates the annual decline rate, but the drop is nevertheless significant should these estimates be confirmed by firm data. Already in November, growth in non-OPEC supply had slipped to 640 kb/d, from as much as 2.9 mb/d at the end of 2014, and 2.4 mb/d for 2014 as a whole. For 2015, supplies look likely to post an increase of 1.4 mb/d for the year, before contracting by nearly 0.6 mb/d in 2016. A prolonged period of oil at sub-$30/bbl puts additional volumes at risk of shut in as realised prices fall close to operating costs for some producers.
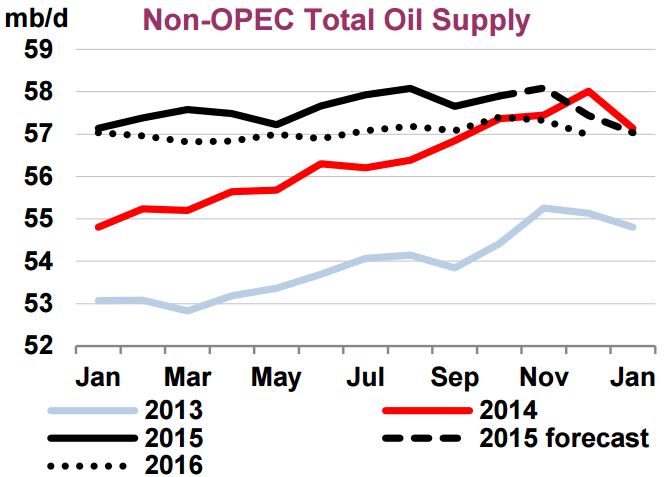
The IEA has every month of 2016 Non-OPEC production below the year over year 2015 production.