Waiting for Godot was a two act play by Samuel Beckett where two men kept waiting for Godot and they just kept waiting and waiting and waiting… And no, I don’t think we will be kept waiting and waiting like the characters in that play. Peak oil is about to arrive, in my opinion anyway.
Way back in 2005 we thought it likely that crude oil production had peaked at just under 74 million barrels per day. During the preceding three years C+C production had risen by 6,481,000 barrels per day or 2,160,333 barrels per day per year. The reason for that dramatic increase was a doubling in the price of oil from $25 per barrel in 2002 to $54.43 in 2005.
So oil production depends, to a great extent, the price of oil. The more money the more oil. However… The C+C data in all charts below are in thousand barrels per day.
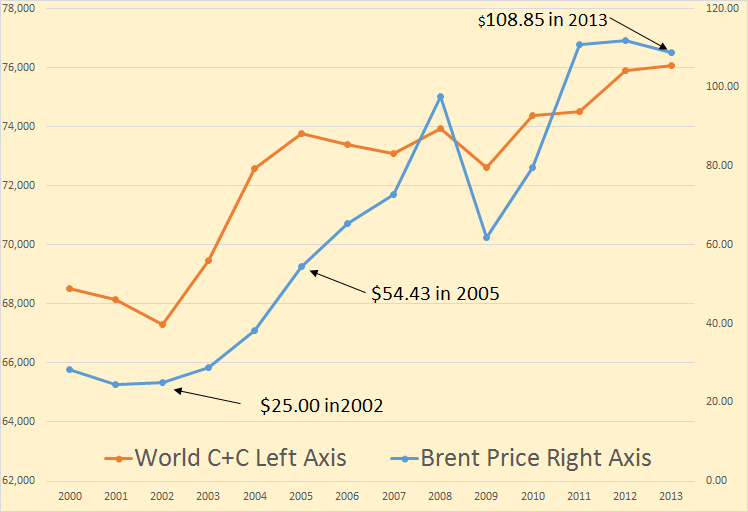
You can see that another doubling of Brent oil price in the next 8 years brought only 2,283,000 bp/d of new oil on line, or an average of 285,375 bp/d per year.
So where did the increase in C+C come from between 2002 and 2005, and where has it come from since.
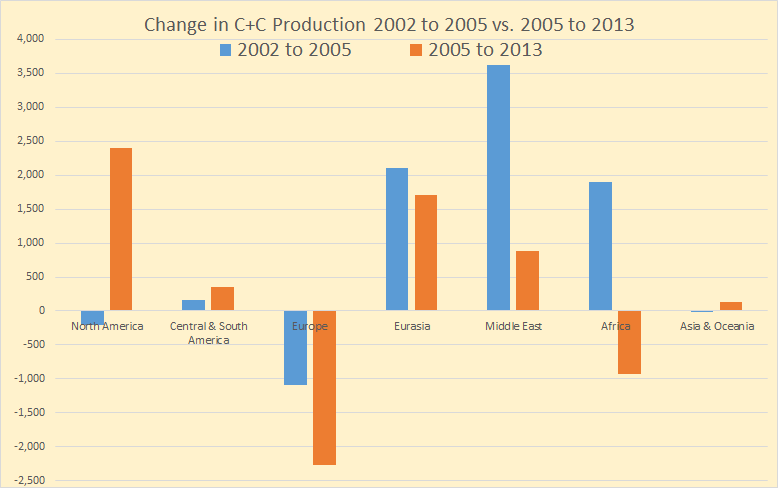
You can see the major addition to World C+C between 2002 and 2005 was from Eurasia, (FSU) the Middle East and Africa. The only major decline was from Europe, primarily the North Sea. Since 2005 the major gainers were North America followed by the Middle East and Eurasia, which we used to refer to as FSU. But 8 years is a long time, what has happened during those 8 years.
Read More
