Just How Accurate Are The EIA’s Predictions?

The EIA recently published the February edition of their Short-Term Energy Outlook. If you follow this month to month, and I do, you will notice their prognostications change a little every month. And over several months those small changes can add up to some rather dramatic changes. Nevertheless, below are several charts with their current oil production projections.

The EIA STEO only gives monthly data for total liquids. All C+C data is quarterly and annually. The monthly projected data begins in February 2016. Projections for quarterly and annual data begins January 2016.

ST Non-OPEC Liquids

The EIA says Non-OPEC total liquids dropped .5 million barrels per day in December and another .36 mbd in January. But then, other than another short drop in the first quarter of 2017, they see things leveling out for the next two years.
Read More

Texas Oil and Gas Production Declining

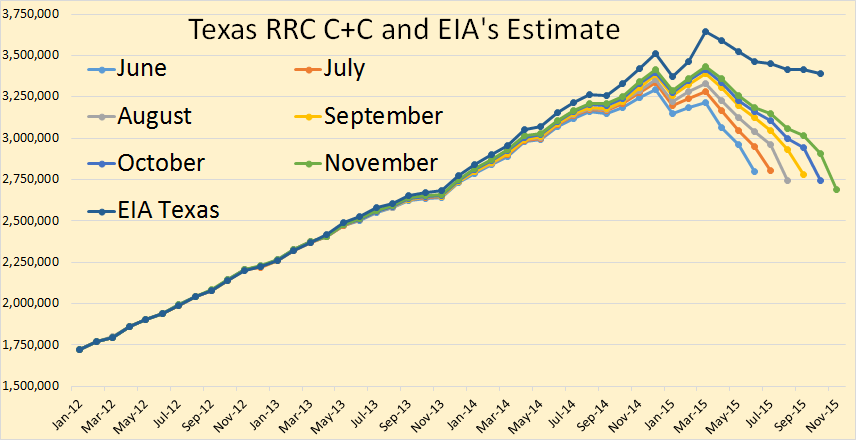
The Texas RRC Oil and Gas Production Data is out. This data is  always incomplete. But we can get some idea of what the trend is by comparing it with previous months. This is what I have done in the charts below. If the latest months data is below the previous months data then the trend is down. But if the latest months (incomplete) data is above the previous months (incomplete) data the trend is up.

All RRC data is through November 2015 but the EIA data is only through October. The oil data is in barrels per day.

Texas C+C

The trend is definitely down. The scale makes it difficult to gauge the month to month change but I have the exact month to month change here in barrels per day. Of course this only gives you a general idea of what is happening. The final change could be either less or greater than the numbers indicate here. But the EIA data should be very close.

Jun. to Jul.  7,245
Jul. to Aug. -63,827
Aug. to Sep. 34,507
Sep. to Oct. -33,486
Oct. to Nov. -52,802
Jun. to Nov. -108,363

EIA Dec. to Oct. -121,000

Read More

The Case For Peak Oil

All charts below were created with data from JODI, the EIA and OPEC MOMR. It is in thousand barrels per day and the last data point is September 2015.

JODI World C+C

World crude oil production has taken off during the last two years due primarily to US shale oil production and higher output from OPEC. However very high oil prices has enabled many other countries to increase drilling rigs and production.

Read More

World Energy 2014-2050 (Part 3)

This is a guest post by Political Economist

Solar Correction

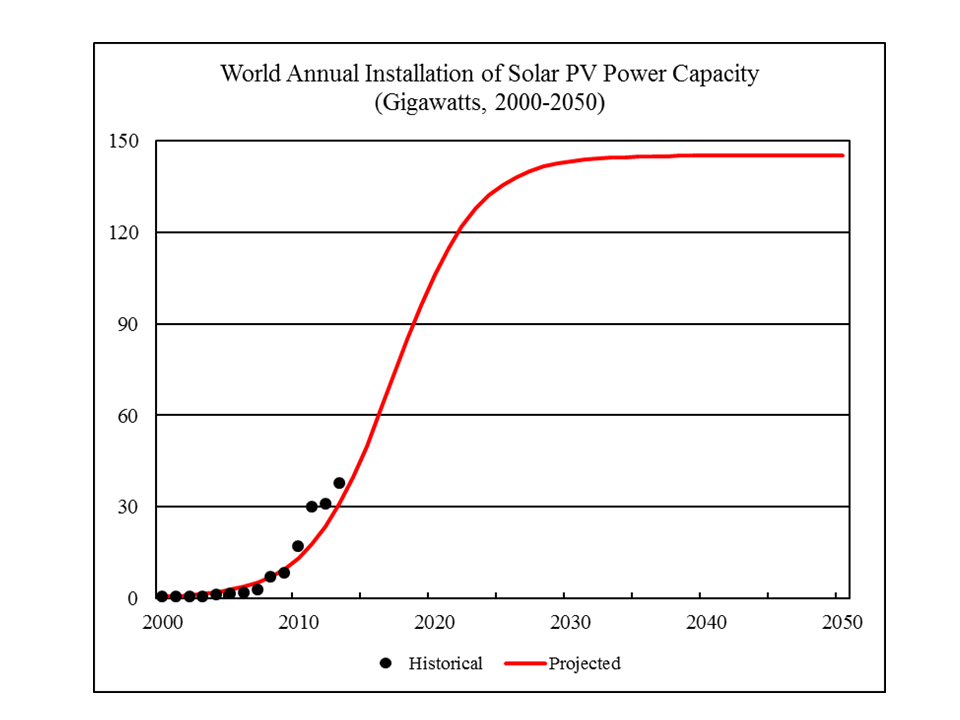
As I reviewed my spreadsheet, I identified a copy and paste error resulting in a mis-calculation of the solar projection.  This affects the projection of annual installation of Solar PV capacity (see Part 2).

The correct projections of annual installation of Solar PV capacity are shown below:

 photo SolarCorrection070414_zps407c310d.png

Under the current projection, solar PV annual installation is projected to rise from 38 gigawatts in 2013 to 106 gigawatts by 2020.  Beyond 2020, the growth will slow down.  After 2030, it will plateau and approach 145 gigawatts (not 108 gigawatts as previously stated).

Again, please note this does not imply that solar electricity generation will peak.  Instead, it assumes that the GROWTH of solar electricity generation will peak and plateau.  In other words, it assumes that at some point in the future, solar electricity generation growth will become linear rather than exponential.  (I had an interesting discussion with Dennis on this after the post of Part 2)

I made corrections of the projected primary energy consumption and world GDP in accordance with the solar PV correction.  These are shown below.

Total Primary Energy Consumption

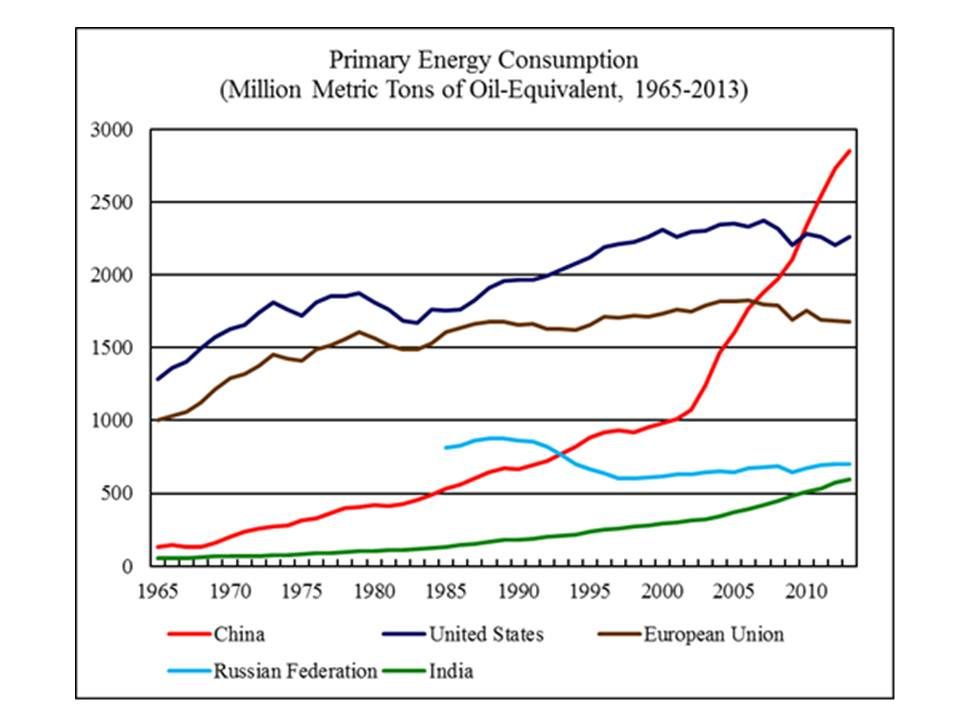
According to BP Statistical Review of World Energy 2014, world primary energy consumption reached 12,730 million metric tons of oil-equivalent, 2.3 percent higher than world primary energy consumption in 2012.  Figure 24 shows the primary energy consumption by the world’s five largest energy consumers from 1965 to 2013.

 photo PrimaryEnergy062114-1_zpsf37768e7.jpg
Read More

Just How Good Are The EIA’s Predictions?

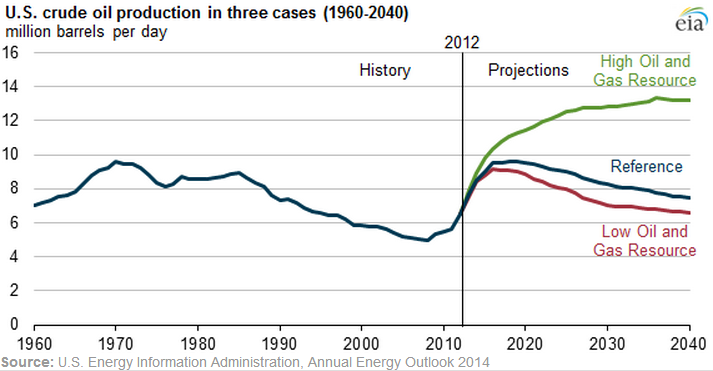
Folks here know that I like to post charts created from oil production data. But there has been a dearth of data lately. But not to worry, the data should start coming fast and furious later this week.  However in the meantime I decided post a little about what the EIA expects in the future. They published the below comments and chart April 7, 2014. Bold mine.
Petroleum & Other Liquids

In the Annual Energy Outlook 2014 (AEO2014) Reference case, crude oil* production rises from 6.5 million barrels per day (MMbbl/d) in 2012 to 9.6 MMbbl/d before 2020, a production level not seen since 1970. Tight oil production growth accounts for 81% of this increase, and sees its share of national crude oil production grow from 35% in 2012 to 50% in 2019. In the High Oil and Gas case, U.S. crude oil production reaches 11.3 MMbbl/d in 2019 and reaches 13.3 MMbbl/d in the mid-2030s.

Under the Reference case, the import share of U.S. petroleum and other liquid fuels falls to about 25% during the last half of the current decade before rising again to 32% by 2040. In comparison, the High Oil and Gas Resource case projects that net U.S. oil imports will continue to decline through the mid-2030s and remain at or near zero between 2035 and 2040.

EIA 2014 Projection

 In the High Oil and Gas Resource case, tight oil plays an even more prominent role in driving national production growth, accounting for nearly two-thirds of total U.S. production by 2035, versus less than half of total U.S. production in the Reference case. Tight oil development is still at an early stage, and the outlook is highly uncertain. In EIA’s view, there is more upside potential for greater gains in production than downside potential for lower production levels. The High Oil and Gas Resource case assumes improvements in tight oil production technology beyond those in the Reference case, as well as higher well productivity rates.

Other assumptions reflected in the High Resource case include:

  • Identification of additional tight oil resources
  • 50% higher Estimated Ultimate Recovery (EUR) for tight/shale oil and natural gas wells
  • 50% lower well spacing per acre for tight/shale oil and natural gas wells, with diminishing EUR for closely-spaced wells
  • A 1% annual increase in the EURs for tight/shale oil and natural gas wells reflecting both abundant resources and technology advances
  • Additional resources in Alaska and Lower 48 offshore fields

Read More