Norway Oil and Gas: Reserves, Production and Future Projection

A guest post by George Kaplan

Norwegian oil production peaked in 2000 to 2001; gas production may be peaking about now. Oil hit a low in 2013 and then recovered towards a new local peak, probably concurrent with the gas.

Drilling and Development

The most surprising thing I find with their industry is that the drop in oil price made almost no difference the drilling activity shown here (all data here and below taken from the NPD – Norwegian Petroleum Directorate – which provides more data than just about any other such organisation).
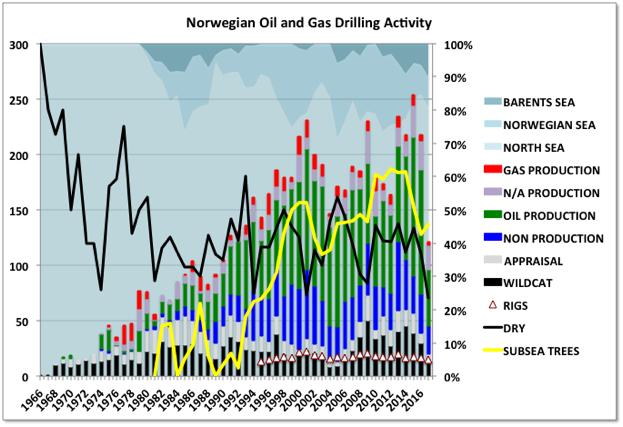
chart/

The chart shows numbers of wells drilled, as stacked bars, and number of operating rigs (unstacked) against the left hand axis, other curves are ratios of total against the right axis. Read More
UK Oil Production, Reserves and Future Projection

A Guest Post by George Kaplan

Production History and Reserves

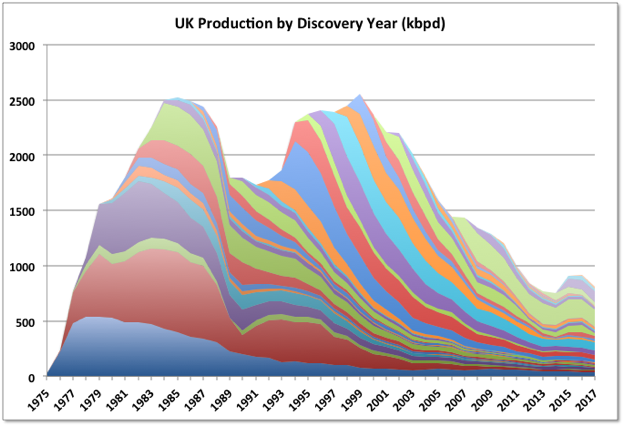
UK oil production peaked in 1999. The peak was probably pushed out a couple of years because of the major production interruptions following the Piper Alpha disaster. Production declined quickly until around 2011, then the high oil price allowed more brownfield and then greenfield developments that created a third local peak in 2016. Production is declining again this year but there are several large projects due that will create another peak in 2018 or 2019 (nearly equal to the 2016 one). After that terminal decline is likely. The chart below shows C&C production split according to the year of first production of the field.

chart/

Like all such all diagrams, this shows that the largest fields were developed first and declined the slowest. Read More

World Energy 2017-2050: Annual Report

A Guest post by:

Dr. Minqi Li, Professor
Department of Economics, University of Utah
E-mail: minqi.li@economics.utah.edu

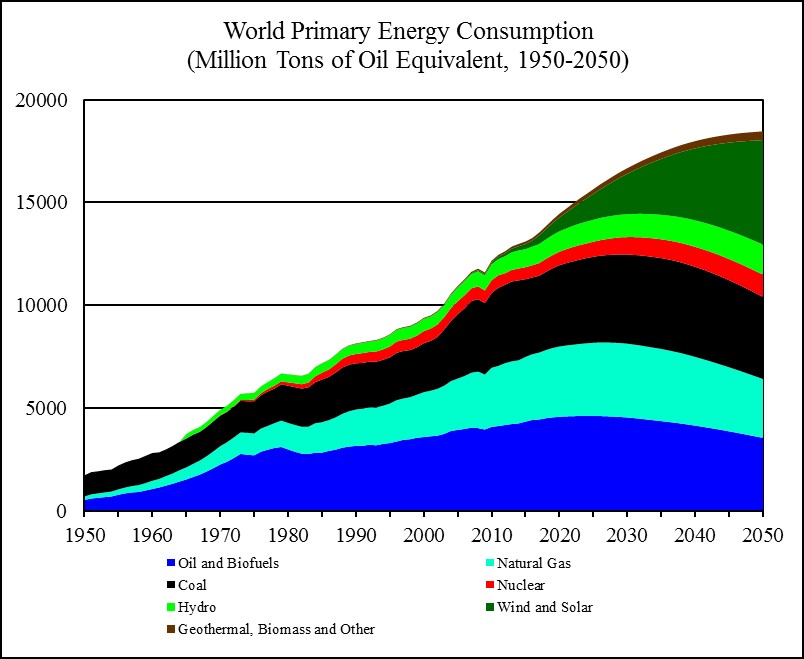
This Annual Report evaluates the future development of world energy supply and its impact on the global economy as well as climate change. The report projects the world energy supply and gross world product (global economic output) from 2017 to 2050. It also projects carbon dioxide emissions from fossil fuels burning and the implied global average surface temperature from 2017 to 2100.

chart/

Figure 18
Sources: World historical oil, natural gas, and coal consumption from 1950 to 1964 is estimated from carbon dioxide emissions (Boden, Marland, and Andres 2017); world primary energy consumption and its composition from 1965 to 2016 is from BP (2017); world primary energy consumption and its composition from 2017 to 2050 is based on this report’s projections. Read More

Oil Price Volatility and US EIA Data

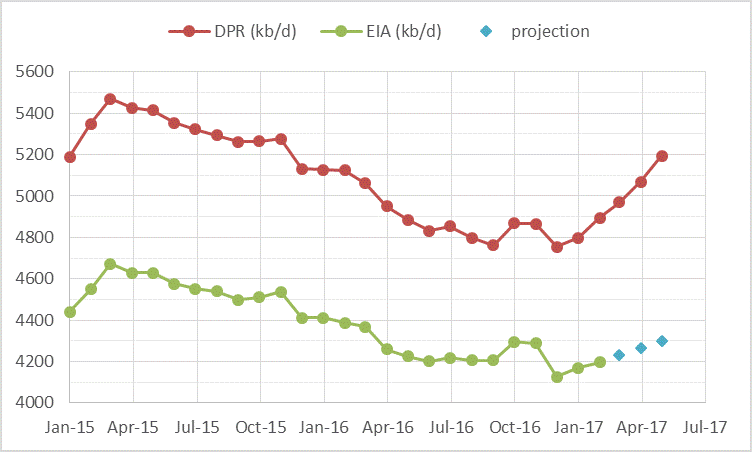
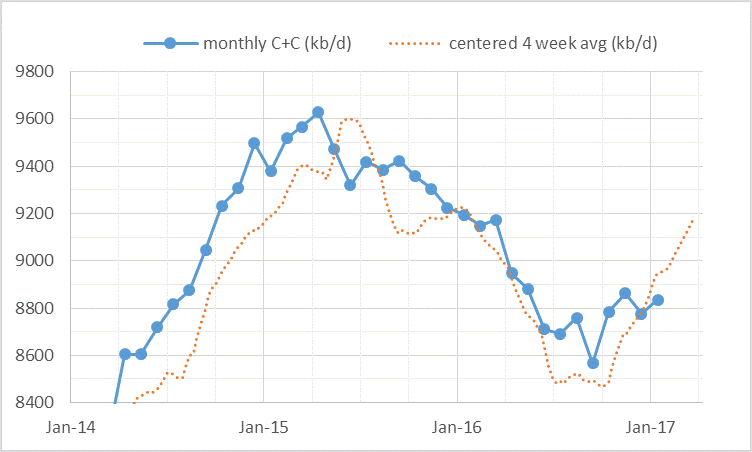
A number of news media pieces have recently suggested that oil prices may fall due to soaring output in the US.  Output from US light tight oil (LTO) may not rise as quickly as some EIA reports may suggest. One source of confusion is that the EIA creates many reports and some are more reliable than others. The two charts below cover US LTO and US crude plus condensate (C+C) output.

US LTO Output from the EIA Drilling Productivity Report (DPR) and EIA Tight Oil (LTO) estimates in kb/d.

chart/

US EIA monthly C+C output and centered 4 week average output in kb/d.

chart/

Read More