EIA’s Electric Power Monthly – May Edition with data for March

This is a guest post by islandboy.

Any comments not related to petroleum (politics, renewable energy, or coal for example) should be in this thread, there will be a separate Open thread for Petroleum (oil and natural gas) discussion.

chart/

chart/

The EIA released the latest edition of their Electric Power Monthly on May 25th, with data for March 2017. March data includes some milestones which are significant in that these circumstances have not existed for a very long time, if ever. Read More

Coal Shock Model

This is a guest post by Dennis Coyne.

The views expressed do not necessarily reflect the views of Ron Patterson.

blog1603/

The eventual peak in World fossil fuel output is a potentially serious problem for human civilization. Many people have studied this problem, including Jean Laherrere, Steve Mohr, Paul Pukite (aka Webhubbletelescope), and David Rutledge.

I have found Steve Mohr’s work the most comprehensive as he covered coal, oil, and natural gas from both the supply and demand perspective in his PhD Thesis. Jean Laherrere has studied the problem extensively with his focus primarily on oil and natural gas, but with some exploration of the coal resource as well. David Rutledge has studied the coal resource using linearization techniques on the production data (which he calls logit and probit).

Paul Pukite introduced the Shock Model with dispersive discovery which he has used primarily to look at how oil and natural gas resources are developed and extracted over time. In the past I have attempted to apply Paul Pukite’s Shock Model (in a simplified form) to the discovery data found in Jean Laherrere’s work for both oil and natural gas, using the analysis of Steve Mohr as a guide for the URR of my low and high scenarios along with the insight gleaned from Hubbert Linearization.

In the current post I will apply the Shock model to the coal resource, again trying to build on the work of Mohr, Rutledge, Laherrere, and Pukite.
Read More

World Energy 2014-2050 (Part 3)

This is a guest post by Political Economist

Solar Correction

As I reviewed my spreadsheet, I identified a copy and paste error resulting in a mis-calculation of the solar projection.  This affects the projection of annual installation of Solar PV capacity (see Part 2).

The correct projections of annual installation of Solar PV capacity are shown below:

 photo SolarCorrection070414_zps407c310d.png

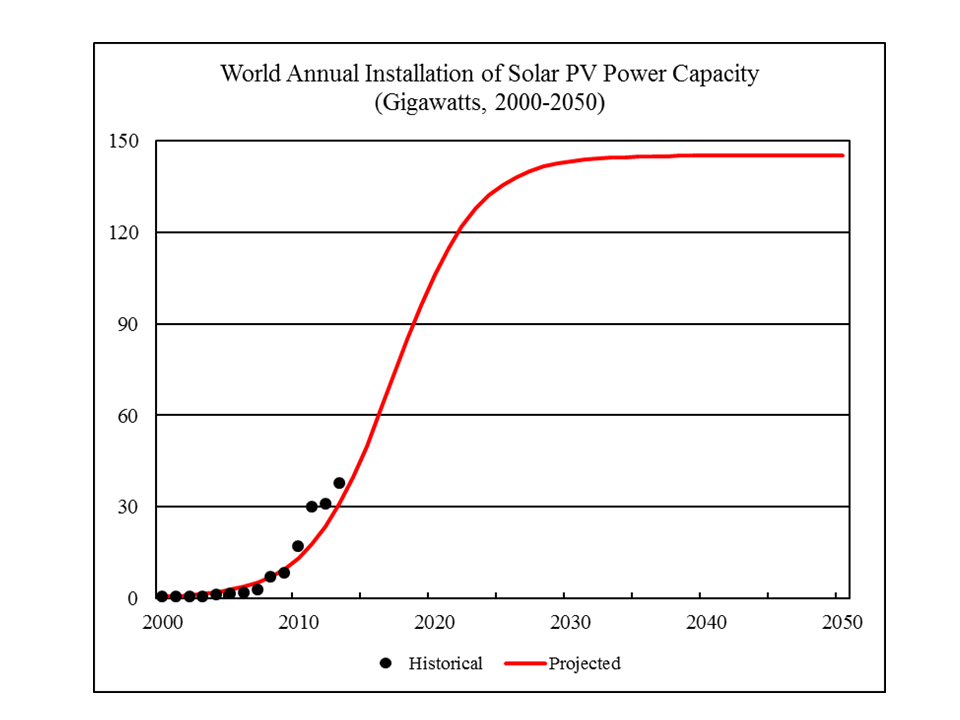
Under the current projection, solar PV annual installation is projected to rise from 38 gigawatts in 2013 to 106 gigawatts by 2020.  Beyond 2020, the growth will slow down.  After 2030, it will plateau and approach 145 gigawatts (not 108 gigawatts as previously stated).

Again, please note this does not imply that solar electricity generation will peak.  Instead, it assumes that the GROWTH of solar electricity generation will peak and plateau.  In other words, it assumes that at some point in the future, solar electricity generation growth will become linear rather than exponential.  (I had an interesting discussion with Dennis on this after the post of Part 2)

I made corrections of the projected primary energy consumption and world GDP in accordance with the solar PV correction.  These are shown below.

Total Primary Energy Consumption

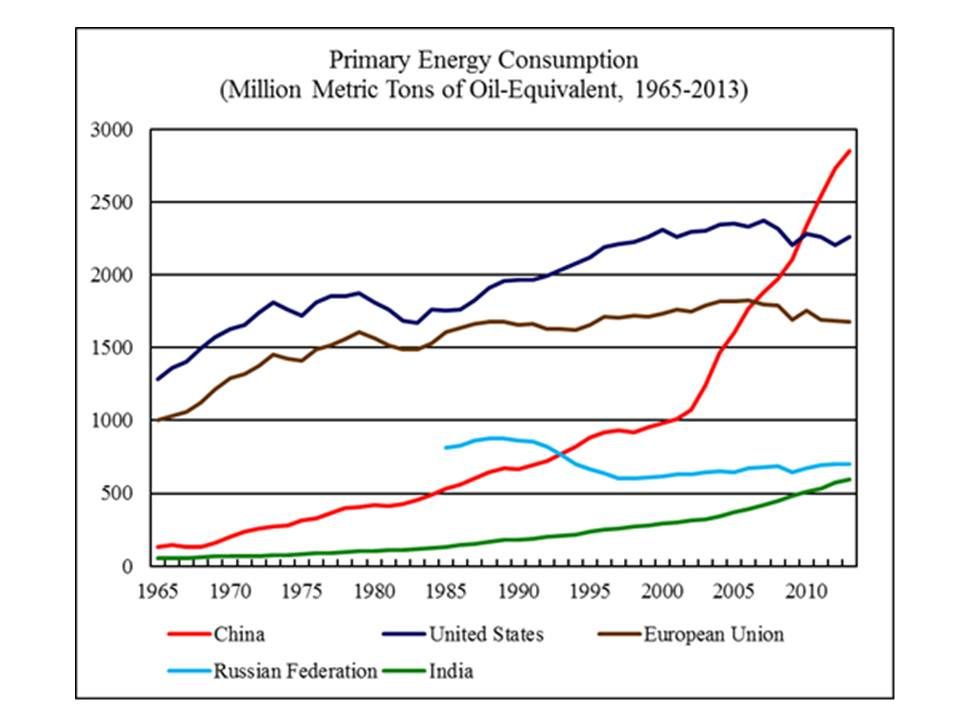
According to BP Statistical Review of World Energy 2014, world primary energy consumption reached 12,730 million metric tons of oil-equivalent, 2.3 percent higher than world primary energy consumption in 2012.  Figure 24 shows the primary energy consumption by the world’s five largest energy consumers from 1965 to 2013.

 photo PrimaryEnergy062114-1_zpsf37768e7.jpg
Read More