EIA’s Electric Power Monthly – August 2017 Edition with data for June

A Guest Post by Islandboy

chart/

The EIA released the latest edition of their Electric Power Monthly on August 24th, with data for June 2017. With all the data for the first half of 2017 now available the half year performance of the various sectors can be assessed. As reported on the web site utilitydive.com “Coal tops gas as leading generation source in first half of 2017“. PV Magazine on their news web page chose to highlight that, “Renewables generate (almost) as much U.S. power as nuclear during H1 2017“. The highlights of the first half of 2017 include (See the YTD row of Table 2 below for data):

• Coal generated slightly more than Natural Gas
• Nuclear generated slightly more than All Renewables
• Conventional hydro generated slightly more than Wind and Solar combined
• Non-Hydro Renewables generated more than conventional hydroelectric
• Carbon neutral and zero emission sources combined generated more than either gas or coal Read More

World Energy 2017-2050: Annual Report

A Guest post by:

Dr. Minqi Li, Professor
Department of Economics, University of Utah
E-mail: minqi.li@economics.utah.edu

This Annual Report evaluates the future development of world energy supply and its impact on the global economy as well as climate change. The report projects the world energy supply and gross world product (global economic output) from 2017 to 2050. It also projects carbon dioxide emissions from fossil fuels burning and the implied global average surface temperature from 2017 to 2100.
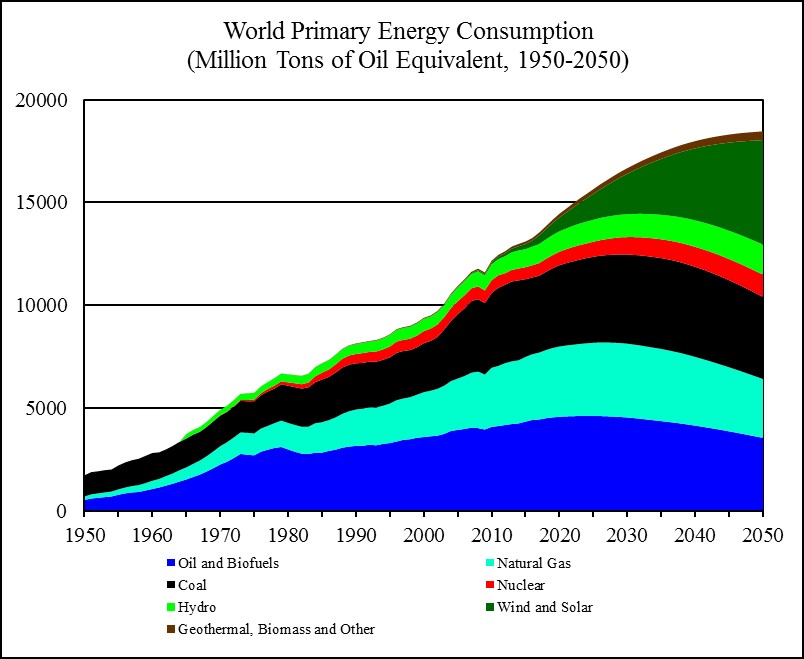
chart/

Figure 18
Sources: World historical oil, natural gas, and coal consumption from 1950 to 1964 is estimated from carbon dioxide emissions (Boden, Marland, and Andres 2017); world primary energy consumption and its composition from 1965 to 2016 is from BP (2017); world primary energy consumption and its composition from 2017 to 2050 is based on this report’s projections. Read More