OPEC February Production Data

The following OPEC charts were created with data from the OPEC Monthly Oil Market Report. All OPEC charts are through February 2019 and is in thousand barrels per day.

OPEC crude oil production was down 221,000 barrels per day in February. That was after December production had been revised downward by 13,000 bpd and January production revised down by 40,000 bpd.

OPEC 14 crude oil production now stands at 30,549,000 barrels per day. That is the lowest since February 2015. The peak was November 2016 at 33,347,000 bpd. So OPEC production is down 2,798,000 bpd from that point.

There is little doubt that if Libya, Iran and Venezuela had no political problems then OPEC production would exceed that 2016 peak. Iran’s problems will likely be settled in the next couple of years. They will likely recover quite quickly. Libya will take a bit longer to recover to full production if and when their problems are settled. However it will likely take Venezuela a decade or more when and if their problems are ever settled. But it is likely they will collapse even further, closer to zero production, before their situation even starts to turn around.

Major decliners in February were Iraq, Kuwait, Saudi Arabia and Venezuela. Everyone else was either relatively flat or up slightly.

Read More

Brazil Reserves and Production Update, 1H2018

A Guest Post by George Kaplan

Brazil C&C Production

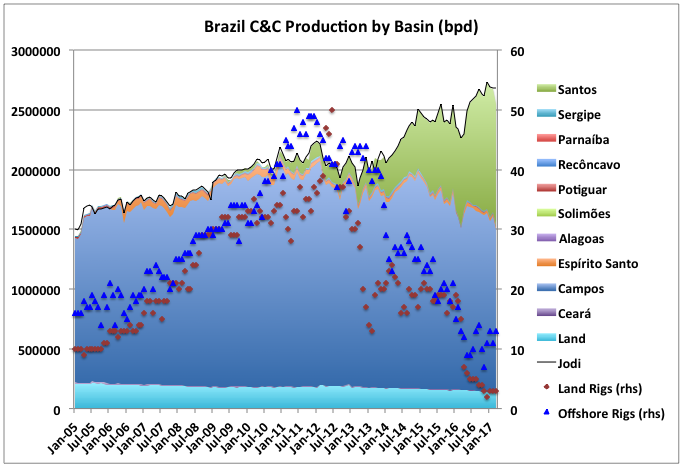
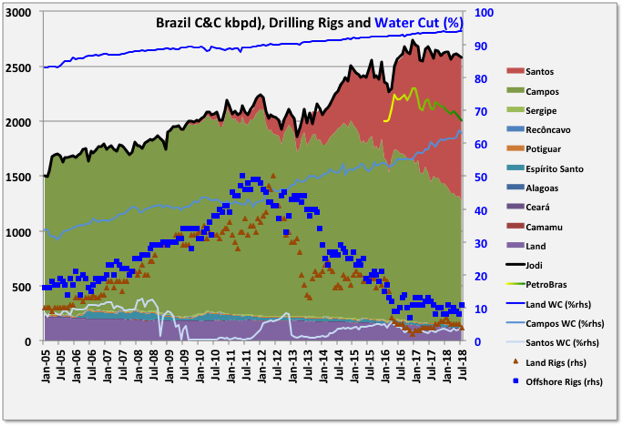
Brazil and Petrobras show something in common with US LTO: even with a lot of debt and desire, and a strong resource base it is difficult to raise production in the face of high decline rates. It may also be a lesson for the world as oil prices rise and activity picks up; it is by far the most active conventional oil region with many major projects at various stages of completion, but facing delays and schedule crowding so oil production has continued a slow decline, contrary to expectations from last year. In July new production again did not quite match overall decline, mostly because of delays in start-ups of FPSOs planned for this year, and at 2575 kbpd was down 14 kbpd or 0.5% m-o-m and 48 kbpd or 1.8% y-o-y (data from ANP).

chart/

Two FPSOs were started in 2017: Lula Sul (P-66) at 150 kbpd nameplate and Pioneiro de Libra, an extended well test project on the Mero field, at 50 kbpd. Both are now about at design throughput. Two other FPSOs completed ramp up in 2017. In 2018 three FPSOs have started up: Atlanta a small early production system at 20 kbpd, Bezios-1 (P-74) in the Santos basin at 150 kbpd and FPSO Cidade de Campos dos Goytacazes on the Tartaruga Verde field in Campos, also at 150 kbpd. There were three other FPSOs due for the Buzios field (P-75, 76 and 77) but at least one is delayed till next year. There are now four planned FPSOs remaining to be started up this year, all in the fourth quarter: P-75 and P-76 plus P-67 (Lula Norte) and P-69 (Lula Extremo Sul) in the Lula field (each 150 kbpd nameplate). Even for a company the size of Petrobras that seems a very tight schedule for commissioning large, complex plant, so one or two may slip to next year and all may be so late as to make little difference to this year’s numbers. See Reuters for more details.

Into next year there may be problems with shortage of deep water drilling rigs, Petrobras cancelled some following the price crash and there have been reports of them looking for available rigs now: no rig, no well, no oil no matter what the available surface processing capacity. Offshore rig numbers, by Baker Hughes, have averaged around ten over the last couple of years, unless they add numbers then the overall ramp-up will remain as it has been and production will stay about flat.

FPSOs P-68 (Berbigao & Sururu) and P-70 (Atapu) are due next year, together with any delayed from this, but the ramp-up from this year’s FPSOs is likely to dominate production growth. There are none due for 2020. Note Petrobras projects have a hull name (P-), a vessel name (often named after a city), a field name (sometimes two or three) plus, often, a separate name (e.g. MV-) from the leasing company, and they often change these during development by reassigning hulls to different destinations, so my apologies if I’ve got some of the above wrong.

There’s been a lot of activity since 2016 despite the price crash and Petrobras debt and corruption problems, and yet production has slightly declined. Typically the large FPSOs at around 150 kbpd take 14 to 22 months to ramp up (see below), adding 8 or so production wells and 4 to 6 injection wells, but two are needed per year to overcome decline rates, and that may be increasing with higher overall production and some of the newer Santos vessels reaching end of plateau. It’s also noteworthy that the mature Campos fields have been showing accelerated decline and a marked jump in water cut recently, although the overall basin decline will be ameliorated by the start-up of the latest FPSO.

Petrobras production is falling faster than overall production, partly from sales of older fields but also because it has a lower ownership ratio of the new (growing) fields than of the mature (declining) ones.

chart/

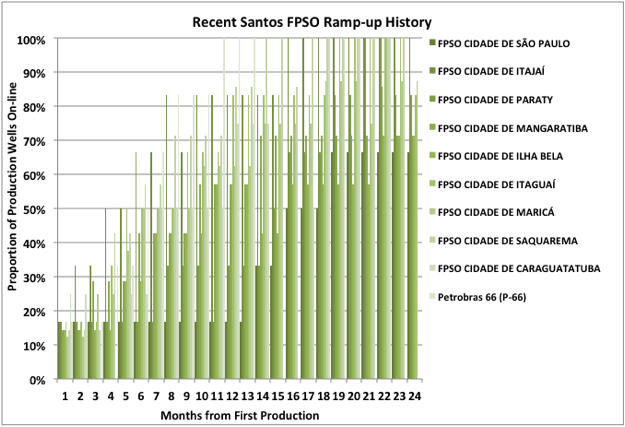
The chart above shows how recent production wells have been added. I haven’t found any data for injection wells.
Read More

World Oil 2018-2050: World Energy Annual Report (Part 2)


A guest post by Dr. Minqi Li, Professor

Department of Economics, University of Utah
E-mail: minqi.li@economics.utah.edu

July 2018

This is Part 2 of the World Energy Annual Report in 2018. This part of the Annual Report provides updated analysis of world oil production and consumption, evaluates the future prospect of world oil supply and considers the implications of peak oil production for global economic growth.

chart/

(See Figure 18 near end of paper) Read More

Recent Production: Colombia, Mexico and Brazil

A Guest Post by George Kaplan

Colombia

Colombia production is holding a plateau over the past year after a large decline in the last part of 2015 and first half of 2016. August value was 858 kbpd (down 0.04% y-o-y).

chart/

Colombia oil reserves at the end of 2016 were 1.66 Gb (down 16.8% from 2 Gb in 2015 which followed a drop from 2.31 Gb in 2014). At the average 2016 production rate of 885 kbpd this gave an R/P of 5.1 years, the lowest for any significant producing country. Most of their production is heavy oil. Ecoptrol, which accounts for more than three quarters of Colombia’s crude and natural gas reserves and output, estimated about 45% of their decline was due to the “pronounced fall in oil prices”. Read More

Brazil: Reserves and Production

Guest Post by George Kaplan

Brazil is a major oil producing country, but in 2016 was still a net importer, though imports dropped significantly and they have been a slight exporter overall so far this year. It is one of the few countries that have consistently grown production over recent years, and possibly the only non-OPEC country that will show overall growth of conventional crude in the ten years to (say) 2022.

Production

Brazil ANP or anp (Agência Nacional do Petróleo, Gás Natural e Biocombustíveis) publishes Excel files for monthly production on all wells. In theory it should be easy to extract field data from these, in practice not so much. The files are downloaded from a database but not always consistently, sometimes in field units sometimes SI, sometimes one month per file sometimes more, around 2010 onshore and offshore was split but naming conventions weren’t always followed, handling of wildcat wells seems a bit arbitrary, and spelling conventions can change. However after more effort than I expected I did download the data and split it by basin and field.

The total production fits Jodi data well except for three periods: 2005 when the reports stated, and doesn’t make much difference; 2010 when ANP split offshore and onshore reporting and the well files are a complete mess; and 2017, which may indicate that some of the data is revised (this should become evident as more releases are made over the next months).

chart/

Read More