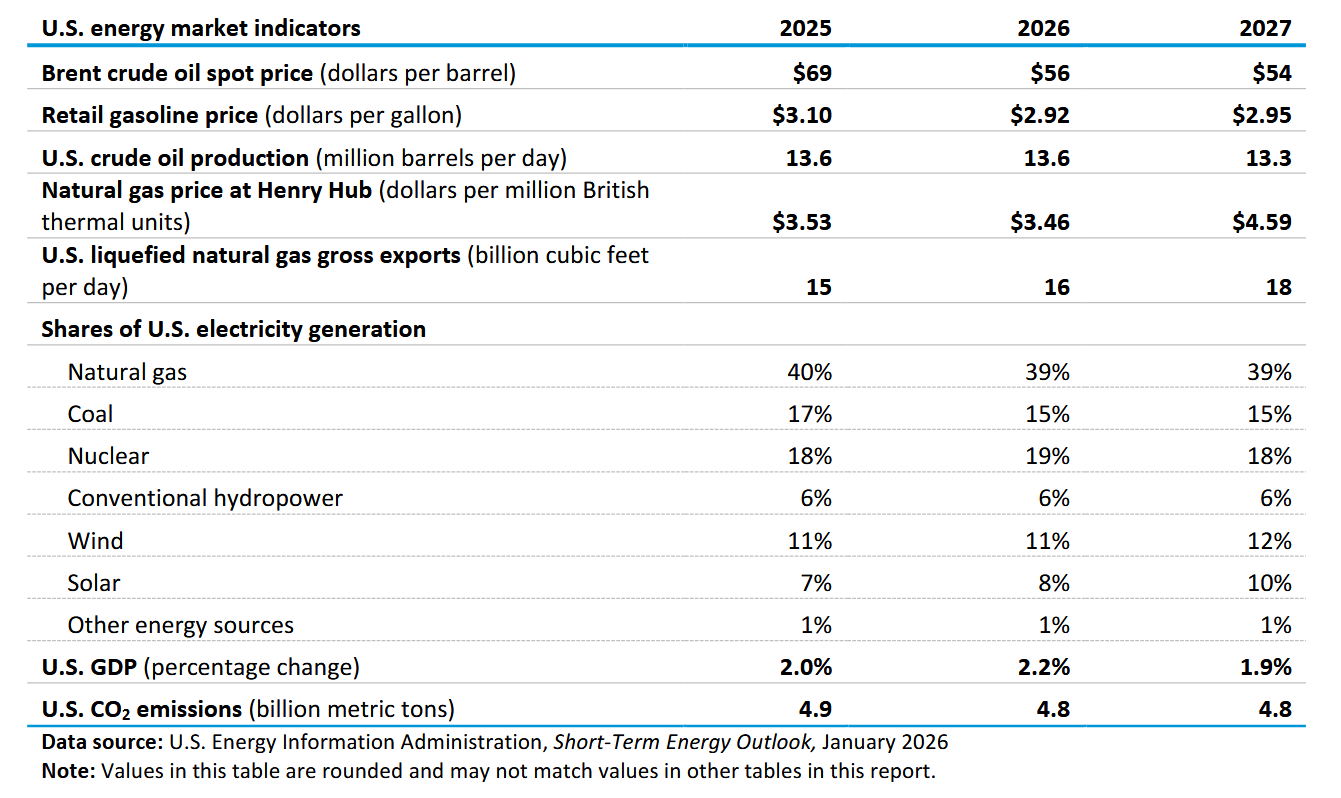
The EIA Short Term Energy Outlook (STEO) was published recently. A summary in chart form.
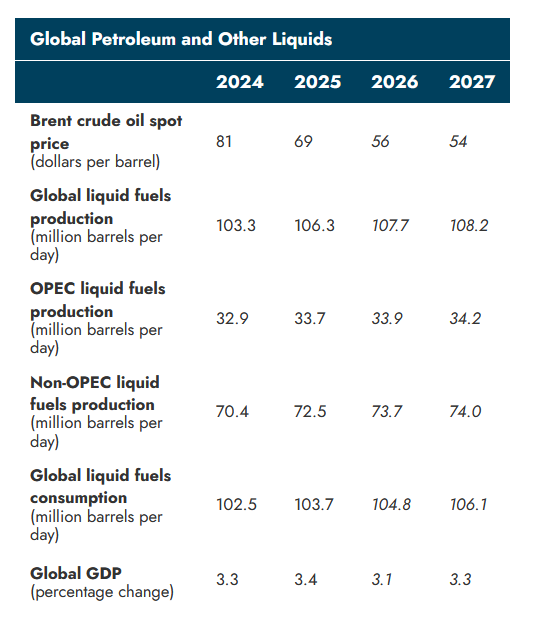
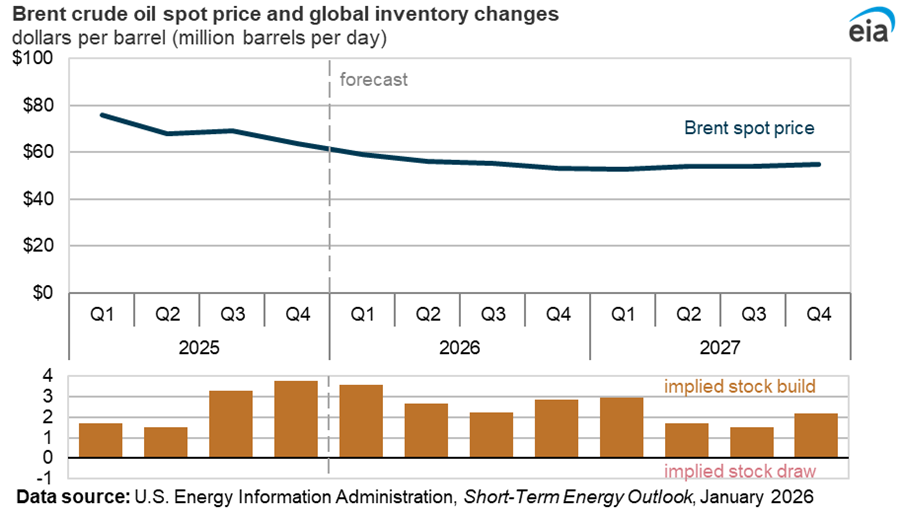
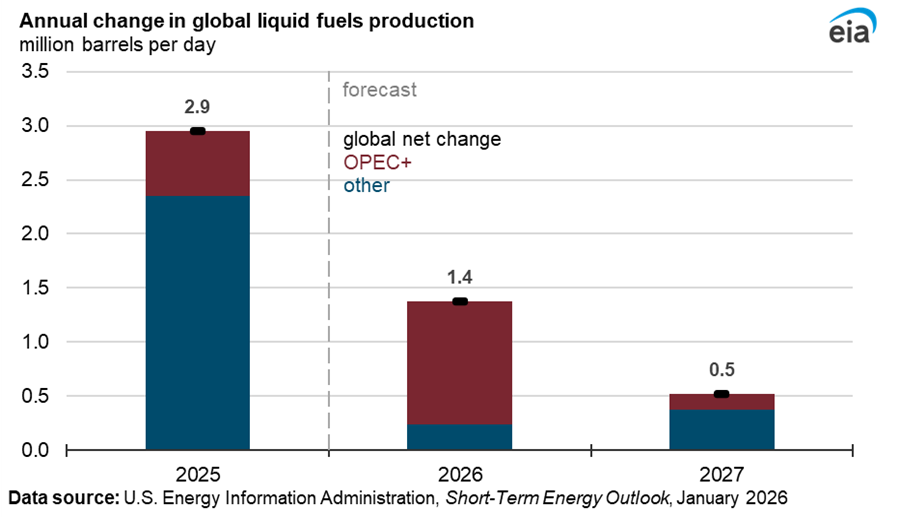
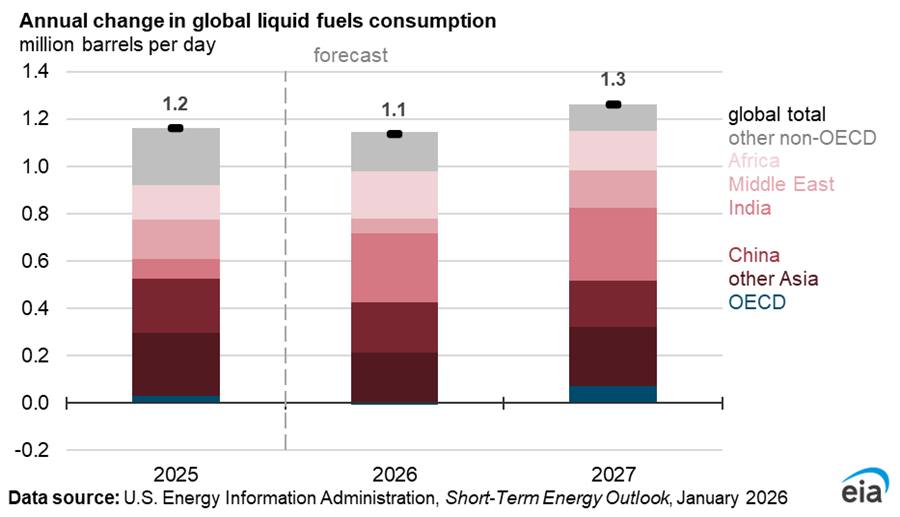
Note the difference between changes in production vs. consumption. For 3 years from 2025 to 2027 the EIA expects average production increases of 1.6 Mb/d each year (4.8 Mb/d total increase over the 3 year period from 2025 to 2027) while consumption of petroleum liquids only increases by 3.6 Mb/d over the same 3 year period (an average increase of 1.2 Mb/d each year). The resulting stock build in petroleum liquids results in falling oil prices from 2025 to 2027.
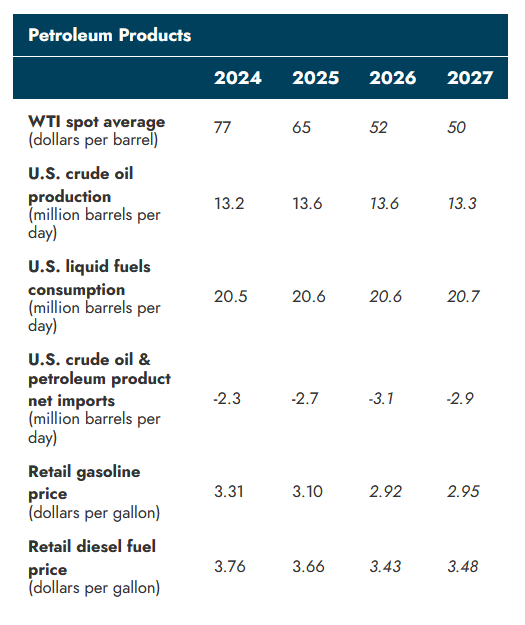

US crude output is flat in 2026 and falls in 2027 based on current EIA estimate. WTI oil price annual average in 2026 is $52/b and in 2027 is $50/b.


A large increase in Henry Hub natural gas price is expected in 2027.


The EIA expects WTI spot prices will be lower than the current futures strip by roughly $15/b in 2027.

Liquid fuel stocks build over the 2025 to 2027 period.


Most of the increase in US marketed natural gas output (98.7%) over the 2025 to 2027 period is exported as LNG based on the STEO estimates.

Most of the increase in US electrical generation from 2025 to 2027 comes from increased wind and solar output. Solar share increases from 7% in 2025 to 10% in 2027 and the share of wind power increases from 11% in 2025 to 12% in 2027.
The share of coal power decreases from 17% in 2025 to 15% in 2027 and natural gas power share decreases from 40% in 2025 to 39% in 2027.


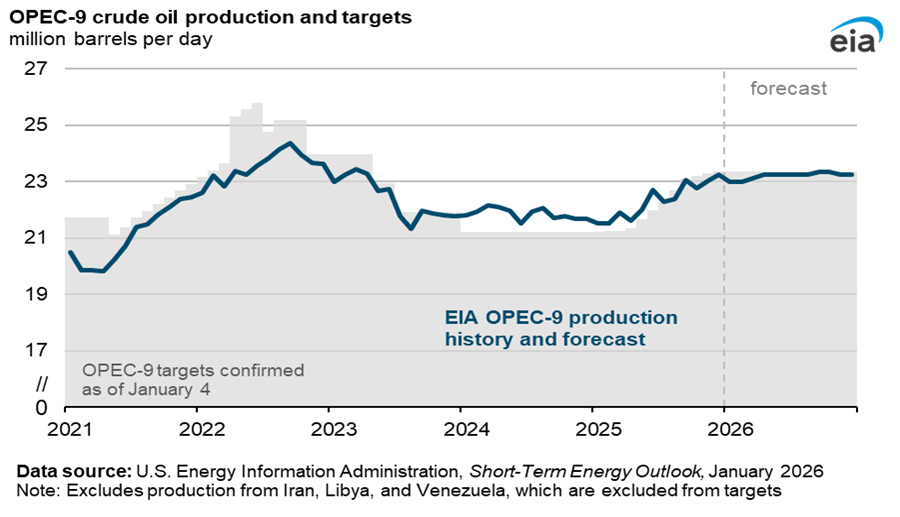
Tight oil output starts to fall in 2026, especially in the Permian Basin which has been the source of most tight oil output increases since 2023.

Note that most of the growth in shale gas output since 2023 has come from the Permian Basin.

Much of the increase in Lower 48 natural gas production from the end of 2025 to the end of 2027 comes from Appalachia and Haynesville, note that the EIA chart has the forecast dotted line in mid 2024 rather than late 2025, it should be moved to the right on the chart by 14 or 15 months.
78 responses to “Short Term Energy Outlook, January 2026”
Dennis,
I have not much followed you New Englanders’ electricity situation much as that big transmission line from Canada JUST came into service a few days ago.
I figgered – with one HUGE qualification – that having ~1,000 Megawatts of juice would suffice to tide you Yankees over during winter cold snaps.
Well … that qualification may have just reared its ugly head.
If I recall correctly, when that line was planned/regulated/set in motion, some critics pointed out that in extreme circumstances, the provider (Hydro Quebec, I believe) would not be compelled to export their juice if local needs required the domestic market be first satisfied.
Sounds reasonable … prioritizing one’s own folks.
Sceptics pointed out that it was at precisely during extreme events (such as this current brutal cold) that imported juice would be MOST needed.
So, about 1 hour ago (3:30 PM EST) Canadian juice went bye bye … like zero coming in.
Wholesale electric shot up from ~$200/Mwh to ~$500/Mwh … and rising.
Oil (!!!) burning is off the charts at almost 7,000 Mw, about 40% of your total generating capacity!
As this is on an ‘off day’ – Saturday – the coming week(s) loom especially precarious for you folks … adequate oil (!!!) supply being paramount.
Bundle up.
No snark intended.
Coffeeguyzz.
Severe weather often leads to problems with electricity. Heat is mostly provided with natural gas, oil, and wood in New England especially during winter. Severe cold weather tends to be more of a problem in the mid-south where preparations for severe cold weather are often not up to snuff.
I personally have a wood stove for heat which comes in handy when electricity fails.
DC has got himself covered but to hell with everyone else especially the poor. He is a typical cold hearted lib.
Ervin,
That comment is absurd on so many levels. I know I probably shouldn’t reply to trolling, but…
-being prepared for a power outage doesn’t hurt anybody else;
-renewables, about which we’ve been hearing similar complaints here, are generally cheaper than FF, not more expensive (though oil company propaganda seems to have turned many folks in the UK against onshore wind, which is far cheaper than offshore).
-democrats are far better at providing for poor and working people, including LIHEAP subsidies (which the latest US Presidential budget tries to eliminate!), distributed generation/efficiency, Medicaid, Affordable Care, etc., etc.
Conservatives know perfectly well that their party is cold hearted, but they figure that some people might be fooled by complaints about “liberals” being cold hearted, but… no one is fooled.
-subsidies for FF are a very, very expensive and ineffective way to help the poor (most FF is consumed by the middle class and wealthy) – far better to …focus help to the poor, who are vulnerable to a wide range of financial problems: just a car repair or medical bill can turn their lives upside down.
https://www.youtube.com/watch?v=dNS2hXKaN5Y
Coffeeguyzz,
Hot and cold weather, and other outliers, affect everyone at the same time. The solution to the problem is to plan in advance and build resilience, not a mad short term scramble for stop-gap measures when the crisis begins.
What New England really needs to deal with cold weather is better insulation and other energy efficiency measures.
The Day Ahead pricing for New England electricity users hit $965/Mwh yesterday at 1500 local time … by far the highest that I have ever seen going back ~ten years of watching.
Currently (0800 EST) the DA is at $721.
For those interested, the Day Ahead/Cleared category provides the vast amount of power – and pricing – that end users ultimately consume/pay for.
Coupla months down the road, these nosebleed prices will show up on New Englanders’ bills.
Could rival – even surpass – California’s highest-in-the-nation costs.
Tragic, tragic set of circumstances.
Oh well …
… and not to pick on the New England folks, PJM RTO has $1,000+ Mw pricing now as well with spikes above $2,300.
Interesting times.
Ervin.
Lots of folks in Northern New England have wood stoves, probably rich and poor alike, mostly in more rural areas (which is most of Northern New England.)
It seems many on the right are quite cold hearted, happy to see US citizens killed, and children separated from their parents to make the US whiter.
Near the bottom there is a graph ‘US electricity power sector generating capacity’
which has a curious entry ‘Other’ which has overtaken both nuclear and hydroelectricity.
Are they counting storage as a source of electricity? Biofuel and geothermal can’t be providing much.
I have seen storage being counted as an energy capacity source before. That doesn’t sit right with me. Seems like double counting.
Thank you DC.
Hickory,
Not sure what “other” is comprised of. I ignore the “capacity” numbers and focus on the electricity generated on the right side of that chart. The amount of electricity generated by “other” is negligible. Looks like the “other capacity” category includes battery storage which the STEO has at 45 GW at the end of 2025 and at 87.5 GW at the end of 2027. I agree this is not generating capacity, but just energy storage much like pumped hydro that can be utilized by the grid when wind, solar, hydro, and other variable resources have low ouput and can be used to fill in. They also can store excess wind and solar output when more is supplied than the system can utilize so it is certainly useful.
See chart at link below
electricity capacity
this US electricity source plot states a painful truth only Trump dare to point out:
the more wind and solar, the higher the cost and the more West becoming dependent on China
Carney’s “workers of the world unite” banner also applies to electricity generation. It is a good dream like the neocons dream of one world under a “fair/democratic rule of law” — we like it and search a way to the dream, but to put a banner and use power to scare everyone to do it will only commit suicide.
Carney and Trump were delivering the same uneasy “inconvenient truth” : after 20 years the left extreme hit the real “inconvenient truth”, we have to face reality and give up idealism banners/compliances.
If you’re a grid manager (ISO, etc) you care at least as much about peak power capacity (MWs) as you do about overall energy output (MWhs).
You need to be able to handle peak demand, and you need to have some flexibility in your power output: batteries are just as good as peaker power plants. Better, actually, because they can provide instant response (measured in single digit milliseconds, not minutes or hours). They also absorb surplus power that would otherwise be curtailed and transfer that power to points when it’s needed – a very valuable service. They also don’t use any power idling, waiting until needed. It absolutely makes sense to count them as part of capacity additions.
Batteries are underpricing and replacing FF peaker plants.
DC- yes, and very important point that you make on this-
It is the actual production that matters, rather than nameplate capacity.
Hickory,
Yes, when comparing most types of generation it’s important to adjust capacity figures by the average capacity factor.
But, not when it comes to batteries: again, peak power during peak demand is just as important to a grid manager as the total energy available. If you can’t meet peak demand you’re in trouble.
So, for instance, US nuclear has a high capacity factor (about 90%). But, that doesn’t help need peak demand, because nuclear isn’t really dispatchable (almost all nuclear plants have trouble varying their output). So, for instance we see the Luddington, Michigan pumped storage (energy storage) plant which was designed to allow nuclear to handle variation in demand (especially the daytime peak).
I have always been of the opinion as to emphasise what we can “get away” with when integrating renewables into the energy system (usually that means electricity).
At the core level you could use a river to power industry, like Richard Arkwright did with his early textile factories. Or primitive wood based wind power to complement peat energy to high degree, like in the hight of Dutch supremacy. Or solar power to power anything, like limited personal consumption, batteries or supplements to power balance in the public space. I guess Nick G values that solar power panels can be put up at a resonable cost. And currently at a low cost with a long lifespan (20 years +/-).
How much you could stretch the introduction of renewables without comprising economic principles is debatable. What I can say, is that investment of renewables is upfront and therefore could be better towards the end of the lifespan. No clear cut answers here, since all of resource extraction are getting a technology boost for the ones with the scale able to invest in it fully.
https://www.dailymail.co.uk/news/article-15494273/donald-trump-new-weapon-discombobulator-maduro-raid-venezuela.html
Trump uses secret weapon….”The Discombobulator” in Venezuela.
If it is secret, why is he talking about it?
Causes enemies equipment to stop working, causes victims brain to feel like it is imploding, nosebleeds and vomittinig….incapacitating them
If true, I hope this weapon does not get replciated around the world.
If true, you can bet that most countries will have them within a decade. Mounted on robots.
It’s probably a microwave based device like ADS used years ago. You can effectively use them to act as crowd control, mission killing drone swarms or disabling power grids.
Despite the pearl clutching about Russia knocking out power in Ukraine lately (a thing they could have done all along until pushed), NATO and the US especially have knocking out utilities to cities down to a fine art. Ask the Serbs.
Wouldn’t worry about it being a thing the can put on drones. THOR is about the size of a freight container and that’s the mobile system.
https://www.dailymail.co.uk/news/article-15493935/Pentagon-US-allies-UK-defence-America-strategy-China-security.html
USA pivots to dominance of Western Hemisphere (The Monroe Doctrine … sorry The Donroe Doctrine ).
People in Eastern Hemisphere should be concerned.
Potentially no more policing of the seas from US Navy ( would need to get microchips sorted out first I would think).
For example, The Strait of Hormuz?
It’s so they can repatriate all those soldiers in CONUS to complete the fascist coup you guys are just letting happen. Rest of the world is breathing a sigh of relief as the US folds in on itself and implodes.
I would be really worried about the boomerang effect happening to you guys more than China getting pummelled in an imaginary war that even Hegseth said would lead to the USN losing a CVBG in the opening half hour.
North Dakota crude output down on cold weather snap
HOUSTON, Jan 20 (Reuters) – North Dakota’s oil production was estimated to be down by between 125,000 barrels per day (bpd) and 150,000 bpd due to extreme cold weather and related operational challenges, the state’s pipeline authority said on Monday.
https://www.reuters.com/business/energy/about-12-north-dakotas-oil-output-shut-down-by-cold-weather-2025-01-20/
The IEA has been reasonably accurate in its predictions over the last couple of years, be it on the conservative side.
If they are correct going forward then 2026 will be another peak over 2018.
However they clearly show a dramatic decline in production increases. Perhaps by 2028 the declining production from the countries in decline will at long last exceed those still able to increase production.
https://unu.edu/inweh/news/world-enters-era-of-global-water-bankruptcy
Peak oil is easy to mitigate, if a country has billions to invest in wind turbines and electricity infrastructure. And you don’t mind a few thousand poor people dying of cold.
But when there is no water, no body can fix that.
100 million hectares: Cropland damaged by salinization alone
Most people think water scarcity and food scarcity is what happens to other people. Little do they know, that they eat food that often comes from countries where people go hungry and those countries have been using up their water sources to export food to the rich.
https://water.org/our-impact/where-we-work/mexico/
https://www.planetearthandbeyond.co/p/openai-is-headed-for-bankruptcy
Another brilliant post from Andre! Patting meself on me big back!
The “Canary in the Coal Mine?”
OpenAI now placing advertisements in their lower tier subscriptions.
Something Mr. Altman previously said they wouldn’t do!
This, plus diversifying into porn, are signs of a desperate company.
AI is dead man walking. Check out all the CEOs for Microslop, NVIDIA, Google basically saying we need to use it properly or we’re ruined.
Desperation.
Definitely check out Ed Zitron’s takes on this. No one man has done more to blow open this whole rotten facade than that guy, and it’s really sad the MSM is mostly just taking this crap at face value from the PR guys in Big Tech.
This year is the year it goes and pops.
Google is the only AI player that can really afford to do what it is doing. Well NVidia too, I guess, because they are getting all the cash. I think a crash will come when OpenAI runs out of cash.
I work with AI full time and the tech is amazing. It is turning the software industry on its head. I can program at a productivity level I wouldn’t have dreamed of a couple of years ago. Also I (like many others) am using AI based tools to build more AI based tools, so the rate of improvement itself is rapidly growing. New products come out literally every day.
Programming with AI is like that movie Rain Main. The systems are capable of unbelievable intellectual feats but at the same time they are totally unreliable and can’t be left unattended.
Al,
Is it fair to say that AI automates programming, leaving the primary role of the programmer as quality control?
Nick G
Yes, AI automates programming. Human control has to be pretty close. But there is no point in typing in 200 lines of code that an AI can generate in a few seconds.
It particularly useful when you are dealing with software libraries you don’t often use, or are fiddly to use. For example, Python has stunning chart creation features (look at the demos of plotly: https://plotly.com/python/ ) but writing the code is a pain. AI is great for this, and the good ones know ALL the libraries.
Also AIs can design and create entire websites in seconds. It’s already killing the profession of website designer.
AI is good as a sparring partner for high level architecture. It knows all the best practices and design patterns the internet can offer. The only issue is that the AI always tells you your ideas are great, even if you prompt it to be critical. It’s surprisingly hard to ignore and probably misleads many people.
AI is helpful for debugging because it can read and analyze large log files quickly. But It often jumps to the wrong conclusions.
People worry about the carbon emissions, but data centers are maybe 1% of human carbon emissions. A bigger problem is that the bubble could easily pop and crash the American economy.
Nice insights Alim
“Is it fair to say that AI automates programming, leaving the primary role of the programmer as quality control?”
And there in lies the profitability problem.
It is only profitable if it replaces the human that has to quality control it.
I use Copilot on a daily basis now, it rarely gets anything 100% correct and requires human intervention and fact checking, and you don’t know where it got its info from..
After several sequential prompts trying to get it to fix previous problems it sometimes spits out complete garbage.
A fascinating technology no doubt.
IMO, it should be domain specific technology, so you don’t need these massive data centers.
I use this LLM for Python, I use this LLM for Java, I use this LLM for my companies Financial data.
Andre,
If I read Alimbiquated comments correctly, he’s saying that he can do the same work in much less time – perhaps 4x as much work in the same time. That’s an enormous increase in labor productivity. A large company may be able to reduce it’s programming staff by 75%.
Increases in labor productivity are what drive economic growth: old industries increase production with the same staff, or they shrink and new industries grow.
Hi Nick G,
invest heavily in OpenAI and Nvidia and test out that hypothesis!
I am not a qualified investment professional, invest at your own risk.
PS: LLMs in their current state can do impressive things, they can’t replace the human that needs to monitor and augment them.
There needs to be an Einstein Relativity level breakthru in the algorithms IMO as the companies are hitting the limits of throwing more data at it.
This is a good thing as you don’t want everyone losing their job.
“ invest heavily in OpenAI and Nvidia and test out that hypothesis!”
Well, the hypothesis is that AI might accelerate labor productivity improvements for *users* of AI products. That doesn’t guarantee that the producers of AI will make money.
As an experiment, I have spent the last couple of days creating a system that creates AI slop videos for Youtube automatically. The video topic is fairly serious, involving corporate financial planning. The videos are short and address a specific topic.
The goal is to do it free of charge. I am doing it on a Linux system with locally run tools only. I don’t know much about Linux but I have an AI help me install and manage the tools I need. The IT department is too slow, and I suspect they just ask AI too when I ask them for help.
I specified a general topic for the videos, and let an AI produce a detailed list of 20 videos on that topic to generate. The list has a title, a subtitle and a brief content description. It also created descriptions of the general style of the music, voiceover and vocabulary and visuals of the final videos, based on the imagined persona of the presenter and viewer.
To automate the video production itself, I am using a new automation system I have never used before. No problem, I let an AI design the automation workflow. I have a basic idea of what is needed, but the AI deals with the details and the technical implementation, including error handling etc. There are systems that take over your system entirely, but for safety reasons I prefer to just follow instructions and build it myself.
For each video I need 5 to 10 slides or short animations that are the segments of the short video, complete with script, voiceover and sound background. In addition there’s a standard intro and outro. The workflow tool assembles the AI generated content and style descriptions from the previous step and passes it on to a set of AIs as prompts. These AIs produce the music, the text of the presentation, the voiceover based on the text, and the visuals.
The workflow tool then gathers all these fragments and assembles them into a finished video, using another free tool. Then it publishes them on Youtube.
I’m not only not building any of this stuff, I am not even building what is building it. I am three layers deep in AIs prompting AIs to prompt AIs to operate open source tools that create, assemble and publish the results. The output is scheduled so I don’t even have to push a button to make it happen.
I’m just doing this as a proof of concept, but you can be sure that there are thousands of people doing it to generate free income right now. Youtube is scrambling to demonitize them, but they are legion.
And it isn’t just Youtube. Everything from scientific journals to porn sites is being flooded with this gunk. And the tools are literally getting more powerful every day.
Michigan Sues Oil Giants
The state of Michigan is suing major oil companies and an industry association, alleging that they colluded to hamper the adoption of renewable energy and electric vehicles (EVs).
I found this comment interesting.
The suit noted that in the 1970s, Exxon developed the first hybrid gas-electric vehicle technologies and in 1978 Exxon publicly showed an electric motor integrated into a hybrid gas-electric propulsion system, installed in a Chrysler Cordoba and in 1979, Exxon partnered with Toyota to develop a hybrid gas-electric vehicle using a Toyota Cressida chassis.
“But Exxon never marketed that innovative hybrid engine technology and consistently has deferred meaningful investment in its lithium-ion and graphite-based battery technologies for EVs,” the lawsuit said, adding Exxon’s internal research in 1979 “predicted that renewable energy would increasingly become a competitive threat to fossil fuels.”
https://www.reuters.com/sustainability/boards-policy-regulation/michigan-sues-oil-companies-saying-they-colluded-restrain-ev-competition-2026-01-23/
Ovi
How much tax payer money is that silly Woman spending on her left wing crusade?
There are hundreds of electric and hybrid models out there today. Most Americans don’t want to buy them. There is nothing to stop them if they wanted to. Why should car companies be forced to sell cars people don’t want to buy?
https://www.autosinnovate.org/posts/papers-reports/Reading%20the%20Meter%2010-3-2024.pdf
This is what lefties do, if people don’t do what they want they come up with rediculous conspiracy theories.
Only now am I considering buying an electric car but they charging infrastructure is still a major negative. Most restaurants and country pubs do have charging points. Motorway charging is more expensive than diesel. Many others are often broken.
I can do 500 miles in my diesel car and fill up anywhere in 3 minutes.
Iver
This is just a political stunt on the part of Nessel. In 2018, she convinced the current governor Whitmer to shut down Line 5 which delivers oil to Michigan and the US Mid West. That case is going nowhere and is coming up against some serious deadlines shortly. This is just a variation on that anti oil theme.
I am wondering if she is testing the gubernatorial waters. There is a race this year to replace the governor in Michigan.
I have been very clear, the idea of an all electric car is totally crazy. I have long believed the best idea is a PHEV with a range of 75 to 100 miles. That would almost guarantee 80% of miles or possibly higher would be all electric. More importantly that vehicle should be cheaper than a BEV. With one BEV battery, a company can make four to five PHEVs. Also this gets rid of the range anxiety fear.
I have a friend who owns a RAV 4 hybrid. She averages 36 mpg in town, which is most of her driving. My Mazda CX-5 gets 22 mpg in town. That gives you an idea of the gains that can be made with a plain hybrid.
I have read that Samsung is close to producing a solid state battery that could be in production by 2028. Not sure how that will impact the BEV and PHEV market.
https://www.electronicdesign.com/technologies/power/article/55134766/electronic-design-samsung-sdis-long-life-solid-state-batteries-claimed-to-have-highest-energy-density
Ovi
There are several firms working on solid state batteries, including Honda.
Geely may be the first with a production model.
https://www.techradar.com/vehicle-tech/hybrid-electric-vehicles/650-miles-from-one-charge-volvos-parent-company-beats-tesla-to-the-punch-with-first-production-ready-solid-state-battery
In the mean time I may very well look at the Rav 4, I’m not in a particular rush.
Interesting analysis of India. It compares today’s India with China when t had the same per capita GDP.
India is much more electrified and uses much more renewable energy than China did at that stage of its development. It’s a bearish look at fossil fuel.
https://ember-energy.org/latest-insights/indias-electrotech-fast-track-where-china-built-on-coal-india-is-building-on-sun/
Of course, coal is still the main form of electricity generation.
https://ember-energy.org/countries-and-regions/india/
The Indian coal industry has a lot of political power, but they’re at a disadvantage against renewables on many specs: cost, speed, pollution, modularity, etc. They can slow down a transition but they can’t stop it.
There are many similar transitions. Peak ICE is in the rear-view mirror. We have peak gas furnace:
“ Are heat pumps really outselling gas furnaces now?
Yes, and it’s not even close. In the first half of 2025, electric heat pumps outsold gas furnaces by 25%.
This represents a definitive tipping point. Heat pumps have outsold gas furnaces every year since 2021. Looking at the 20-year trend: heat pump sales increased 115% while gas furnace sales decreased 11%.
Market size and growth:
U.S. heat pump market: $11.2 billion in 2024
Projected CAGR: 8.4% (2025-2034)
Cold-climate heat pumps: 11.23% CAGR
Despite this momentum in new sales, gas furnaces maintained a 45.1% share of total residential heating equipment in 2024. Even more telling: fewer than 20% of U.S. households currently use a heat pump.
This gap between existing infrastructure and new sales represents a massive replacement opportunity.”
https://leads4build.com/insights/hvac-statistics-trends
Nick G
What is the make and model of your heat pump?
How much did it cost to install the system?
Do you have solar panels on your roof?
How much was the system to install?
You still have not told us what your background is?
Iver,
it’s a Bosch – it cost about $8,500. With a $1,500 rebate it was $7k installed. Goes down to -7C.
Primary push has been efficiency: inspecting with a thermal camera (FLIR has a nice consumer model), plugging leaks, adding insulation, replacing bad windows, adding laminated glass layers to good windows, cellular shades, smart thermostat, HVAC balancing, LED lighting (reduces both lighting power and AC heat load), etc.
No PV yet – haven’t had time, and isn’t highest priority. If you have PV it’s good to remember that your experience has very, very little to do with how solar works in a grid. It can feel like you’re learning valuable lessons about solar, and…not so much. Mark Twain writes that it’s not what you don’t know that’s the problem, it’s what you do know that just ain’t so. That applies here.
Important to remember that consumer responsibility is very valuable, but not as important as the systemic changes needed: consumers don’t control the grid, or the choices available on the market (e.g., CAFE was essential to cutting US light vehicle fuel consumption in half).
Background is operations analysis – the operational sibling of financially based management and consulting – think McKinsey.
Nick
Quick look at U.K. sales of heat pumps versus gas boilers.
Heat pumps sold 100,000. Gas boilers sold 1,500,000.
Without vast numbers of houses installing solar and battery backup the grid will become more unstable.
Take a close look at charts
https://www.energy-charts.info/charts/power/chart.htm?l=en&c=DE&week=02
https://www.energy-charts.info/charts/power/chart.htm?l=en&c=DE&week=24&year=2025
Solar and wind are totally unreliable and the cost of filling in the gaps is huge. People like you claim they are cheap but you don’t want to play your part by helping stabilise the grid you want.
Grid scale batteries only last for max of 4 hours when sometimes solar and wind output is below 20% capacity for days
Iver,
Interesting differences between the US and the UK. Seems like about 5% of homes in the UK have AC, while it’s 88% in the US. Heat pumps provide both heat and AC, but if you don’t care about AC then you lose half the benefit of a heat pump. Further, the UK’s smaller homes means narrow hot water pipes are better than wide air ducts, so boilers are more common and boilers are harder to adapt to heat pumps (they need wider pipes and bigger radiators to make the change). Plus UK homes are older and so are draftier, with less insulation and single pane windows: that means bigger and more expensive heating systems. OTOH, boilers can eliminate separate hot water heaters, so the cost difference between US and UK heat pumps is smaller than it looks.
On the whole, the UK will have a harder time switching, which is too bad.
Now, a few thoughts about solar and wind..
Residential solar is about 3x as expensive as utility solar. It’s still a good idea (for instance, you reduce transmission, distribution and transformer expenses), but it’s not really where you want to build the majority of your PV. Unless maybe you’re in Australia, where very long distances make transmission and distribution really, really expensive.
You seem to be thinking that residential battery systems have longer discharge specs. And, sure, you can do that, but it’s expensive! That’s why utility scale batteries usually stick to about 4 hours – that’s the cost-effective sweet spot, at least at the moment. Eventually we’ll need 24 hour batteries, but that’s a little ways off.
Solar and wind output at or below 20% isn’t really that big a deal. IIRC, Germany tends to average 10% solar capacity factor and 18% wind CF, and they make that work. You just need to build more capacity. Remember, grid “overbuilding” is normal. For instance, the US grid CF is roughly 40% – that builds in reserve, especially for handling peak periods.
Eventually, of course, we’ll probably need storage for a week or even two: that’s a ways off. When it happens it will coincide with quite a bit of surplus wind and solar power that will likely be used to electrolyze H2 from water. The H2 will likely be stored in cheap underground storage, just like NG is now. That’s Germany’s plan – they call it Wind-Gas.
Solar really is reliable. It does have wide variance between night and day and summer and winter, but…you can rely on it: the sun comes up every day. You can forecast what it’s going to do with very good accuracy, years ahead. Wind is rather harder, but it’s possible to forecast surprising well, which makes it easier to manage than you might think.
Solar and wind are inversely correlated: when one is low, the other tends to be high. That means that grid planners will prioritize generation source diversity (something that’s very hard in a very small application, like a residence).
Geographical diversity also helps: over a wide area, like you see in the US, or the EU, the variance/reliability of solar and wind is surprisingly good: comparable to coal plants, for instance.
DSM: A good, cheap source of quite a lot of battery reserve is vehicles. The US has about 250M light vehicles: if they each had 100kWh of storage, that’s 25 terawatt-hours of storage, or enough to provide 50% of the US grid’s output for four days! Further, 100kWh of storage gives light vehicles about 2 weeks of storage, meaning they can stop charging for days at a time to help out the grid. They’re like to represent about 25% of electricity demand, so at least 25% of demand is susceptible to easy Demand Side Management. IOW, if supply drops by 25% cars can easily help the grid compensate. This, of course, is a fairly longterm consideration.
Iver,
See
https://www.iea.org/commentaries/global-heat-pump-sales-continue-double-digit-growth
https://www.bbc.co.uk/news/articles/c0lx24l117zo
IMO, currently the most interesting story in the global oil game ( close to Venezuela, Permian basin decline? )
UK wants to fund Ukraine war with proceeds from seizing shadow fleet vessels.
“Should we do more on shadow shipping? Yes we should, and I’ve now identified further military options that we can use to target shadow shipping,” he told the defence committee.
https://www.yahoo.com/news/articles/european-coastal-countries-warn-russias-124348484.html
European coastal cities warn Russia’s shadow fleet.
Hitting Iran and Venezuela ( Russia, Iran, Venezuela are the shadow fleets )
I’m sorry but this looks like a coordinated effort by NATO to take Putin out.
https://www.yahoo.com/news/articles/spain-escorts-shadow-fleet-vessel-095923024.html
Spain escorts shadow fleet vessel
The Growing Gap Between Fossil Fuel Use and Finds By Kurt Cobb – Jan 26, 2026
Oil and gas discoveries have fallen sharply over the past decade while global consumption remains near record highs.
Current discovery volumes replace only a fraction of the oil and gas burned each year, creating a widening structural gap.
Even with long development lags, declining discoveries point toward an approaching peak and eventual decline in fossil fuel production.
Herbert Stein was an American economist who served in both the Nixon and Ford administrations. He is probably most famous for formulating Stein’s Law, namely, “If something cannot go on forever, it will stop.” This is, of course, an obvious statement. But I think it cannot be stated too often in a global society that believes in infinite economic growth.
I propose to take a subset of that growth to demonstrate Stein’s point. The subset is world oil and natural gas consumption versus discoveries. It turns out that Rystad Energy, a major consulting firm at the heart of the global oil and gas industry, has taken note of the fact that “just 25–30% of the oil consumed each year is currently being offset by new discoveries.”
Annual conventional discovered volumes once averaged more than 20 billion barrels of oil equivalent (boe) per year in the early 2010s, but these have fallen to nearly one-third of that, with analysis by Rystad Energy showing global discoveries have averaged slightly over 8 billion boe annually since 2020 despite several standout frontier finds in Namibia, Suriname and Guyana. Despairingly, the yearly average declines further to about 5.5 billion boe between 2023 and September this year [2025].
For the uninitiated, “barrels of oil equivalent” means Rystad has converted natural gas discoveries into their equivalent in terms of the energy content of barrels of oil. One barrel of oil contains the energy equivalent of about 6,000 cubic feet of natural gas.
All these numbers mean something only when you compare them to current consumption worldwide. According to the U.S. Energy Information Administration (EIA), for oil in 2024, consumption was 82 million barrels per day or 29.9 billion barrels for the year. (I’m using the EIA’s own definition of oil, which is crude oil including lease condensate.) Natural gas consumption for 2023 (the last year for which totals are available) was 144.9 trillion cubic feet or 24.1 billion barrels of oil equivalent.
https://medium.com/@joseph.e.julian/a-conversation-with-david-deutsch-that-physics-hasnt-had-yet-c28bcea06d38
Ron,
Finally read your book. Good job. Very thought provoking.
https://www.amazon.com.au/Blind-Blatantly-Obvious-Ron-Patterson-ebook/dp/B0FJGZR2FZ/ref=sr_1_1?crid=147TPNEUT2Q2D&dib=eyJ2IjoiMSJ9.q8euVn0KNbHwSf0sdH2JzmV5x7p_LstwCjMYf1BgeAM79eWFBI2k8M3ClGSDBF-vLBeWny8Vm8AJrYHw7qJ3H1HhcT2o-FqoXd938dmNa0HLzZEm2G9uKvCdA795_0xAd9XO3LRiOi_TbQW716UM2jtHQPD0JnT3RGB0A2nzdfAZZSoAYyHTlAKGhXxq8GJpc2sLP6lzDCYmI2hXXvdPhRYoUmCYVCI1CYyDKwWUeBmsOH7_hGvSGUVIER3VmnHcfxpdg2VdXNiAnhH73HaxyYyU8dnLOp3-MEVJgF39URM.hCxcEVktCBORzWJ1DwJKILN3k8BrR8-UgdP13DSLXS0&dib_tag=se&keywords=Ron+Patterson&qid=1769636496&sprefix=ron+peterson%2Caps%2C340&sr=8-1
In the above linke, MMT is proposed to fix Hugh Everett and David Deutsch many world theory.
They say the math of Everett is correct, what he got wrong is the multiple universes fall apart.
Only the coherent universe remains.
Not sure what to make of that.
Thanks Andre. What Everett, and the idiots that believed him, got wrong was they over looked the fact that what they were proposing was expentiail. They propose that multiple universe, by the thousands, are being created by the thousands every second. But then if that is the case, then those universes are doing the same thing. Every one of those universes are also creating thousands of new universes every second. The expansion of new universes would forever be increasing. The whole idea is stupid if you just think about it for a few minutes.
Sean Carrol and David Deutsch are both materialists but they still buy into this ignorant Everett scenario. Go figure. My opinion of them has greatly deminished because of this very stupid many worlds theory.
Hey, how about leaving a review on Amazon. It would be greatly appreciated.
Ron
I can’t post a comment on Amazon or it will reveal my true identity…LOL!
Definitely worth a read for people who have been reading Ron for years for the cost of a coffee ….
I think what they are saying is Everett’s model is mathematically correct, but having multiple universes seems preposterous.
Everetts took the math literally, and did not collapse anything.
This MMT uses Everett’s model, but the multiple universes dissappear because they aren’t coherent (survival of the fittest).
I am not agreeing with this, I am not qualified to evaluate it. Just thought you might be interested in the research.
https://www.dailymail.co.uk/sciencetech/article-15510223/humanity-insects-fall-silent.html
If I remember, Ron mentions this trend in his book.
“A pivotal warning came from a German study that tracked flying insect biomass in protected areas over nearly 30 years.
By 2016, researchers found populations had collapsed by more than 75 percent, even in regions shielded from industrial activity.”
Rystad recently started a youtube channel on energy. Definitely worth a listen.
https://youtu.be/ohtVfMkTwC0
They talk about ‘molecules’ and ‘electrons’, moving into a energy-based way of conversing rather than just oil and solar/wind.
The latest is on small modular nuclear reactors for baseload power…with the flagship molten salt reactor being built in Texas. Texas seems quite agnostic about energy, and once a tech is proven, seems able to access boatloads of capital.
https://mishtalk.com/economics/trump-pushes-quick-fixes-to-boost-venezuela-oil-output-can-they-work/
Trump pushes quick fixes to boost Venezuela oil output
There are some people who think that wind and solar are cheap. But what happens when wind and solar are producing only 10% of their installed capacity?
Sure you can have batteries for peaking or for 3, 4 or 6 hours but 48 hours or more?
Now you are looking at maintaining 80% of the gas and coal plants at a considerable cost but they will only earn money 20 or 30% of the time.
Just like in Germany there are left wing people who are just yearning to pay 200% more for their electricity.
The grid engineer who does not bother posting here anymore explained the costs very clearly
Iver,
Please read my comment above, carefully. It answers your question.
Nick G
Repeatedly saying the same thing doesn’t make it come true. What you are doing is classic self brain-washing. You can’t engage in working through real actual problems, because you don’t want to face them.
Germany doesn’t deal with zero solar at 5pm in winter or 5% output capacity of wind. It just burns vast amounts of COAL AND GAS.
What would dealing with these vastly unreliable energy sources actually look like?
Firstly massive overbuilding would be necessary by a factor of 4 or 5. Germany already has 2 and is nowhere near zero coal and gas.
Then the entire country needs to store enough electricity to prevent grid collapse.
Any idea what that would cost. Costs of batteries are hardy falling anymore, it’s called diminishing returns
https://www.parkers.co.uk/electric-cars/cost-to-change-ev-battery/
Hydrogen? Really? Any idea what it would cost to produce electricity from a hydrogen plant?
No did not think so.
Germany and Denmark and the U.K have very high amounts of wind and the highest electricity prices. Having gone up by 150 and 200% over the last 15 years. This is only the start, massive battery storage and hydrogen if we are stupid enough.
Anyone who says wind and solar are cheap is simply a liar.
Ignorant scum who campaigned against nuclear, preventing a really efficient supply chain over the last 30 years have brought us to this.
Iver, I’ll agree that wind/solar isn’t cheap once you figure in the cost of energy storage to replicate the 24/7 energy delivery of fossils but maybe cheap isn’t a realistic expectation when fuels needed for uranium extraction will also be in decline.
Iver,
“Repeatedly saying the same thing doesn’t make it come true.”
Right back atcha. You’ve been saying the same thing, with no evidence for quite a while.
“Germany doesn’t deal with zero solar at 5pm in winter or 5% output capacity of wind. It just burns vast amounts of COAL AND GAS.”
If you thought about it, you’d realize this isn’t relevant. Germany’s solar and wind started at a low level, and has been growing fast (21% for 2025 vs 2024). It will take a few years before it eliminates all coal and gas. OTOH, German coal consumption was around 430M tonnes per year 40 years ago, and it’s now about 50M. That’s a 88% reduction!
You can look this stuff up easily enough – it would help you get a good feeling for what’s really happening.
“Now you are looking at maintaining 80% of the gas and coal plants at a considerable cost”
Nah. Please re-read what I wrote – Germany is absolutely not planning to keep gas and coal plants at very low levels of utilization.
“massive overbuilding would be necessary by a factor of 4 or 5. Germany already has 2 and is nowhere near zero coal and gas.”
No, that’s not how overbuilding works. At the moment wind and solar covers about 60% of German electrical consumption. That means it would need to increase wind and solar by about 70% to start to be overbuilt (making the simplifying assumption that wind & solar are your only low-carbon power sources, which they’re not). It needs an expansion of about 2.5x its current size to be overbuilt by 50%. The US grid is overbuilt now by about 125%.
“Costs of batteries are hardy falling anymore, it’s called diminishing returns”
Battery costs are still dropping – manufacturing experience and technical improvements can reduce costs indefinitely – look at solar, which dropped by 90% from 1980 to around 2005, and then dropped another 90% from 2005 to now. And it’s still dropping…
We may use massive batteries. We may use grid DSM with vehicles (G2V), or use vehicle to grid (V2G). We may go straight to hydrogen. Please, re-read my comment above.
“ Any idea what it would cost to produce electricity from a hydrogen plant?”
Well, the whole process would probably be about 40% efficient. If you implement it using cheap surplus power (which you would have plenty of after you overbuild wind & solar) you might start with 2 cents per kWh for your power, and end up with H2 that produces power for 5 cents per kWh. It’s not that important because you’d probably only use it for about 5% of the power that flows through the grid – remember that long periods (a week or two) of low wind and solar are fairly rare, especially after they’re reduced by overbuilding, geographic diversity, supply source diversity and daily variation is mostly handled by batteries.
“Germany and Denmark and the U.K…electricity prices…gone up by 150 and 200% over the last 15 years”
Isn’t it fairly clear that the primary cause of rising power prices in Europe is the switch from cheap Russian piped gas to expensive LNG?
What’s your source for prices? Is it residential or industrial pricing? Spot or contract?
https://davidturver.substack.com/p/uk-industrial-electricity-prices-highest-in-europe
Uk forced coal plants to shut down which produced cheap electricity this is the result
Nick G obviously does not know the difference between installed capacity, peak demand and annual electricity production and most importantly what is the minimum combined production of wind and solar which determines how much over build and backup you need to construct.
How do you start educating someone like that
Not only have oil, coal and gas consumption continued to increase but tragic levels of deforestation, soil erosion and pollution. All these things spreed up the breakdown of the climate processes we know.
https://e360.yale.edu/features/1.5-degrees-tipping-points
We are at peak food now so enjoy it.
China new coal powered plants built 2000-2025
https://pbs.twimg.com/media/G_5NiK3bUAcY15-?format=jpg&name=small
US oil Production
The EIA did not release US November Oil Production today. It is normally issued on the last working day of the month.
Rig Report for the Week Ending January 30
The rig count drop that started in early April 2025 when 450 rigs were operating rose again this week. Drilling continues at a steady rate with WTI moving into the mid $60s/b.
– US Hz oil rigs rose by 1 to 368, down 82 since April 2025 when it was 450. It was also up 6 rigs from the low of 362 first reached in the week ending August 1. The rig count is down 18% since April 2025.
– New Mexico Permian was unchanged at 92. Lea and Eddy were unchanged at 59 and 33, respectively.
– Texas dropped 1 to 166. Texas Permian dropped by 2 to 129. Midland and Martin were unchanged 23 and 25 respectively. Culberson and Crane counties, both in the Texas Permian, lost 1 rig each.
– Eagle Ford was unchanged at 29.
– NG Hz rigs rose by 1 to 108.
A Rig
Frac Spread Report for the Week Ending January 30
The frac spread count dropped by 15 to 148, a record low since February 2021. It is not clear if this large drop is due to severe cold weather or low oil prices or a combination of both. From one year ago, it is down by 42 spreads and is down by 67 since March 28.
A Frac
How U Laterals Save Cash
“The U-laterals enabled the company to eliminate the top-hole sections on half of the new wells being drilled, which saved rig time, Wolff explains. Fewer wells also reduced the number of surface separators and other wellhead equipment and reduced pad space, allowing more of the pad to be reclaimed, an important factor in environmentally conscious Colorado. Each lateral targeted distinct zones, enabling multibench development with a minimal number of wells on the pad.”
https://www.aogr.com/magazine/frac-facts/u-shaped-architectures-deliver-more-reservoir-exposure-access-to-multiple-benches
Ovi,
That is an outstanding article on so many levels.
It clearly describes umpteen advances in the various aspects of the drill process which have unfolded over recent years (and continue to be improved).
Big reason why so many of we operational wonks have been proud Cornicopians for so long … and proven to be correct, don’tchano.
The Appalachian Basin will be especially good grounds for the U shapes as the leases are not geometric.
Staggered lateral lengths will be able to economically touch much more rock from a single wellbore.
One outfit claimed their prospective Ohio Marcellus locations have more than doubled to over 200 when they continue to drill the U.
CG,
Yeah, appreciating innovation is extraordinarily important in understanding history and guesstimating the future.
Ovi,
Mike Shellman looked at some of the actual productivity results for U shaped wells in the Permian basin and the results looked quite bad. Unfortunately he deleted some of his forum posts so that is now not available. Some of the stuff at the american oil and gas reporter is marketing hype similar to what is found at investor presentations, Mr. Shellman likes to poke holes in some of those cornucopian fantasies.
See https://www.oilystuff.com/groups
Dennis
The impression I got from the article was that the big savings came from not moving the rig and starting a new well, which I captured in the comment above.
Ovi,
The point I was attempting to make is that these U shaped wells have lower productivity, as is also the case with longer lateral wells in general, yes there will be cost savings as well and the technical expertise to accomplish this is amazing. Depletion will continue, obviously, it will be interesting to see how low oil price levels affect activity in the future.
The Committee also reaffirmed that it will continue to monitor adherence to the production adjustments decided upon at the 38th OPEC and non-OPEC Ministerial Meeting (ONOMM) held on 5 December 2024, and the additional voluntary production adjustments announced by some participating OPEC and non-OPEC countries as agreed upon in the 52nd JMMC held on 1 February 2024.
OPEC meeting Feb. 1 2026
https://www.opec.org/pr-detail/1633590-1-february-2026.html
A partial US Oil Production Report has been posted
https://peakoilbarrel.com/us-november-report/
Ovi, all this big work you do appears to go unnoticed and unappreciated here on POB. I am sorry; too many anti-oil, politically oriented comments about Trump negate the importance of your work. Too many big egos seeking relevance; too many wackos, like Nick G, now control the forums content. Too many internet experts trying to prove how smart they have become, because of the internet.
Whatever. Tight oil and gas is NOT a video game to play on the computer. We are decades away from renewable energy making a dent in our future; in the mean time you have to be dumb as a cedar post not to be pulling for it.
Dennis, thanks. On the issue of short lateral, U-Turn wells in tight oil basins across America, their use is entirely a function of how important remaining rock is in core areas. Nobody wants to wander off into goat pasture, they’d rather stay in the cores and drill uneconomic U-Turn wells that, below $60 WTI, will never pay out. They are a pain in the ass to drill, set pipe on, and stimulate. They work in good areas, in the best of benches, marginally…so what?
Or lie about it.
Jesus. Its often incredible to me the extent to which people will WISH for something to happen in the face of realized production data, and ignorance of well economics.
https://www.oilystuff.com/group/operational-stuff/discussion/caf54fe4-b603-4053-b864-4492fd0f1325
Ovi, follow this thread on associated gas production from the Delaware Basin, please. You don’t like my politics, I get that, but this is good stuff. I have been around a long time and have access to data, and facts. I am an oilman from Texas who cares about his country.
Projected associated gas production from the Permian Basin, including high initial GOR areas in both sub-basins, is greatly over exaggerated. This associated gas thing from the Permian Basin will be a bigger waste of money than the first go around where the tight oil sector lost $200B and still has $200B of debt on the books. And as associated gas goes, so goes C+C production in the United States.
You and I are on the same page…the Delaware Basin of the Permian is carrying all of U.S production increases, most of the world C+C increases, it will not, however, provide the gas feedstock for AI, or LNG exports; that is all a lie. Its called associated gas for a reason; the biggest tight oil play in North America is getting very, very old and very, very tired.
https://www.oilystuff.com/group/gassy-stuff/discussion/cec8799f-15fe-4d52-a32a-fce0613b676b
I did not make this shit up. Its real data. There is really only one way to interpret this stuff.
Keep up the good work.
Thank you Mr. Shellman, great comment.
There is a new post on Fluid Catalytic Cracking on Mike Shellman’s Oilystuff for those interested in refining.
https://www.oilystuff.com/group/oil-natural-gas-refining-stuff/discussion