Comments not related to oil or natural gas production in this thread please. Thanks.
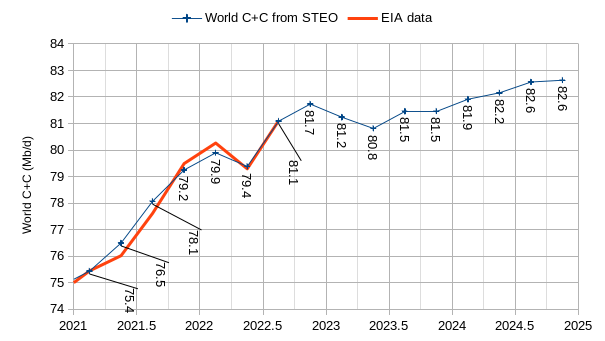
Short Term Energy Outlook, February 2023
The Short Term Energy Outlook (STEO) was published by the US Energy Information Administration (EIA) on February 7, 2023. For most nations except the US and total OPEC crude oil output the forecast for future production is for total liquids only. In this month’s post I will try to estimate the crude plus condensate (C+C) output indicated by the STEO total liquids estimate for the top 10 non-OPEC producers and the World minus the top 10 non-OPEC producers. I will focus on quarterly output so that we can compare with recent OPEC estimates for World supply and demand in 2023. The estimate for C+C uses historical output of both C+C and total liquids and uses the average of the ratio of C+C to total liquids for the past 12 quarters (2019Q4 to 2022Q3) for the top 10 non-OPEC producers (except the US where a C+C forecast is provided) and for the World minus the top 10 non-OPEC producers. In most of the charts that follow the units on the vertical axis are kb/d of C+C output.
Open Thread Non-Petroleum, February 24, 2023
Comments not related to oil or natural gas production in this thread please. Thanks.
OPEC Update, February 17, 2023
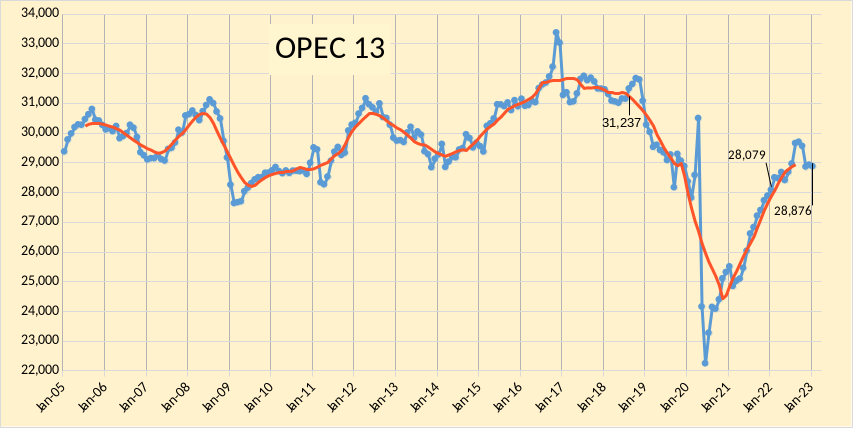
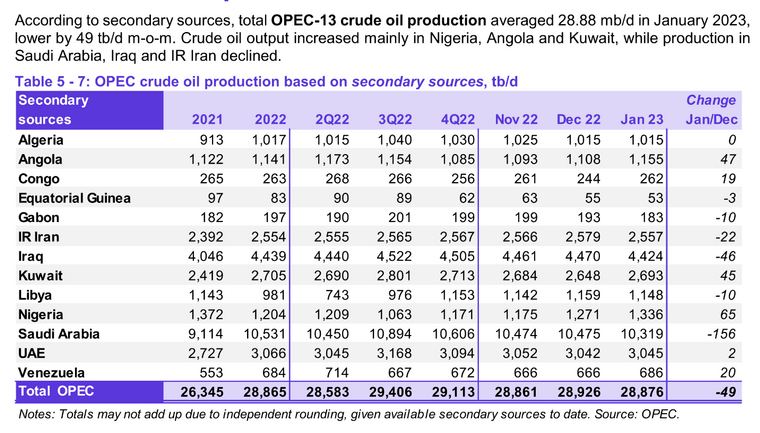
The OPEC Monthly Oil Market Report (MOMR) for February 2023 was published recently. The last month reported in most of the OPEC charts that follow is January 2023 and output reported for OPEC nations is crude oil output in thousands of barrels per day (kb/d). In most of the OPEC charts that follow the blue line is monthly output and the red line is the centered twelve month average (CTMA) output.
Predicting Stratospheric Winds
Last week the USA shot down a suspected Chinese balloon with an air-to-air missile. The balloon itself was obviously just following the stratospheric jet stream and was not completely controllable in terms of navigation [1]. This brings up an interesting issue, as the state-of-the-art in atmospheric science has never been able to predict which direction the jet streams will follow at any future time. Nowhere is this more evident than with the stratospheric winds that encircle the Earth along the equator, known as the QBO. Scientists have been able to heuristically gauge when this wind will reverse it’s direction (hence the name Quasi-Biennial Oscillation) but have never been able to explain why it reverses. The first time they were able to systematically measure it was via the launching of instrumented weather balloons (radiosondes) in the 1950’s.
The QBO is visualized by the following animation: