North Dakota Bakken/Three Forks Scenarios

blog1402fig1/

Figure 1

Edit(2/10/2014) For anyone interested a spreadsheet with the TRR scenario can be downloaded here just click on down arrow near the upper left to download spreadsheet.

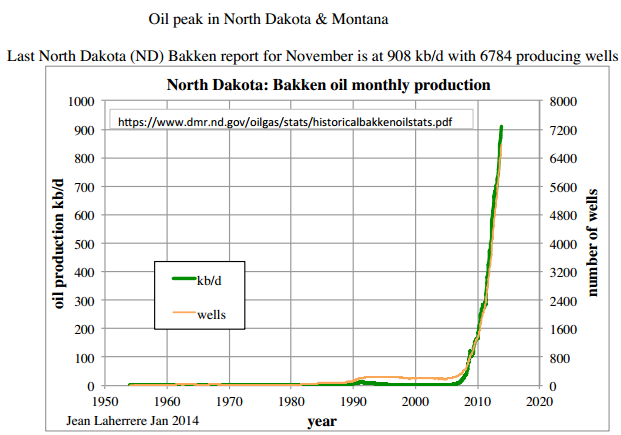
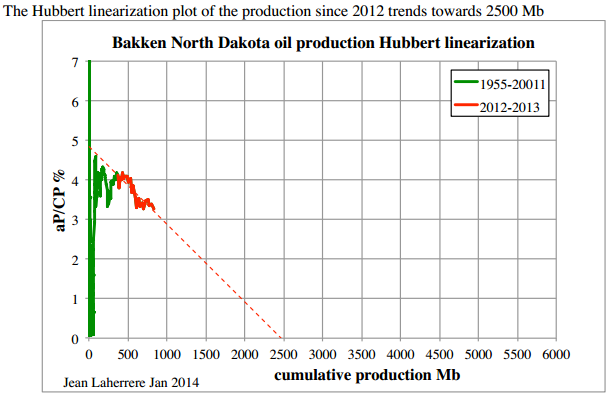
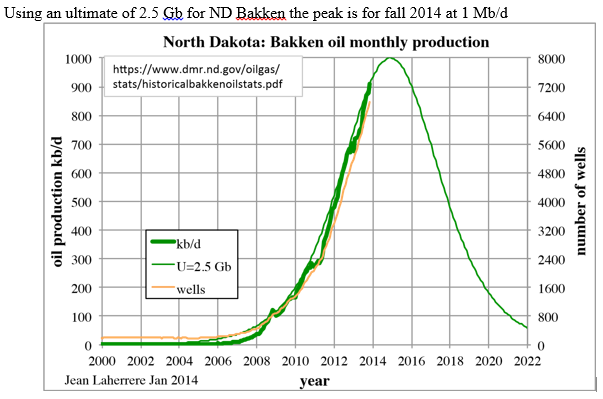
 A recent post at Peak Oil Barrel by Jean Laherrere suggested an ultimate recoverable resource(URR) for the North Dakota Bakken/Three Forks of about 2.5 Gb based on Hubbert Linearization.  This conflicts with a recent (April 2013) USGS mean (F50) TRR estimate of 8.4 Gb. (See my earlier blog post.) 

I decided to update my scenarios based on the range of USGS TRR estimates from F95=6 Gb to F5=11.3 Gb for the North Dakota(ND) Bakken/ Three Forks.  Note that at year end 2011 there were 2.6 Gb of crude proven reserves in ND and at the end of 2007 about 0.5 Gb, I will assume all of this reserve increase came from the Bakken/ Three Forks, so 2.1 Gb of proven reserves added to 0.35 Gb of oil produced from the Bakken/ Three Forks gives us 2.45 Gb for a minimum URR.  The Hubbert Linearization points to about 0.05 Gb of undiscovered oil whereas the USGS suggests 3.5 to 8.9 Gb of undiscovered technically recoverable resource(TRR) in the North Dakota Bakken/Three Forks.

Note that Mr. Laherrere has forgotten more about geology than I know. He may have information that I don’t have access to or has read the USGS April 2013 Bakken/Three Forks assessment and found that the report was not credible.  I have assumed in my analysis that the USGS analysis is correct, if it is not then my analysis will also be flawed.  I would love to hear from Mr. Laherrere about the specific problems he sees with the USGS analysis, I no doubt would learn much.

Read More

EIA Quarterly Crude + Condensate Production Data

The EIA publishes all kinds of energy production data but I collect and chart only Crude + Condensate data. But that comes in three flavors, monthly, quarterly and yearly. I decided to chart the quarterly data and see if that looks any clearer than the monthly data.

Quarterly C+C production in kb/d. The last quarter, 3rd, ends September 2013.

World

World C+C production has increased 2 million barrels per day since the 2nd quarter of 05. Who were the big gainers that caused this 2 million barrel per day increase?

World Less USA

Turns out it was all USA.
Read More

US Crude Storage, Production and Other Peak Oil News

There has been a dearth of oil production data lately so I have been scratching to find something to post. So I have gathered this and that in hopes of making it interesting.

US stocks had the first uptick in nine weeks, gaining 990 kb. (See the slight uptick in the blue line.) But they still stand at their lowest point in 21 months.

Stocks

Incidentally the EIA’s Weekly Petroleum Status Report had US crude oil production down last week. Their estimate of production went from 8,159 kb/d to 8,052 kb/d. That was the first decline in nine weeks. Of course that is really just a guess by the EIA.

Based on the weekly US production data I have charted US production through Januay 2014. The data through November 2013 is from the EIA’s Monthly Energy Review. The data for December and January is from the Weekly Petroleum Status Report, link above. That data is through January 17th. I have estimated the rest of the month.

Read More

Update: OPEC January MOMR with December Production Data

The OPEC January Monthly Oil Market Report is out with crude only production data through December 2012. Total OPEC crude only was 29,223,000 barrels per day, down 20,000 barrels per day. But that was after November production was revised down by 170,000 bp/d. So December production was down 190,000 bp/d from what they originally reported last month.

OPEC 12


Big movers were Iraq and Libya. Iraqi November production was revised down by 132,000 bp/d and their December production was down another 55,000 bp/d meaning they were down 187,000 from what was originally reported last month.

Iraq

Read More