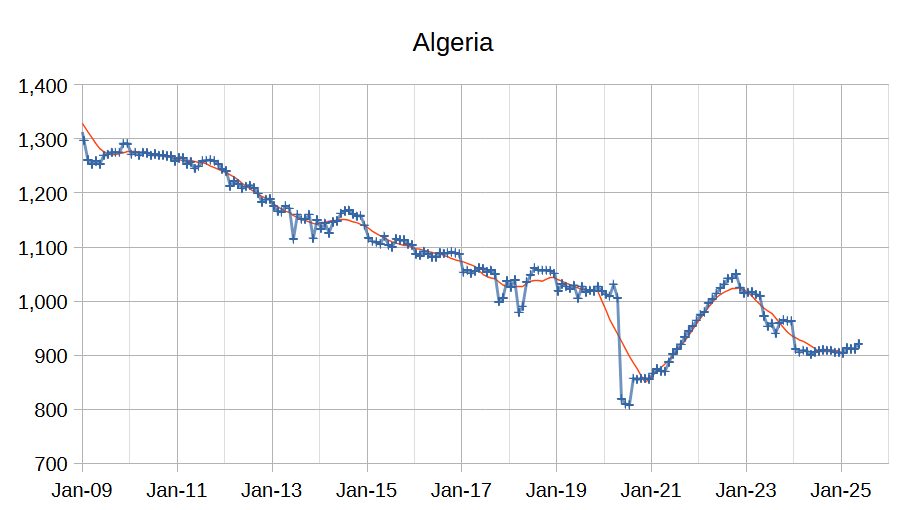
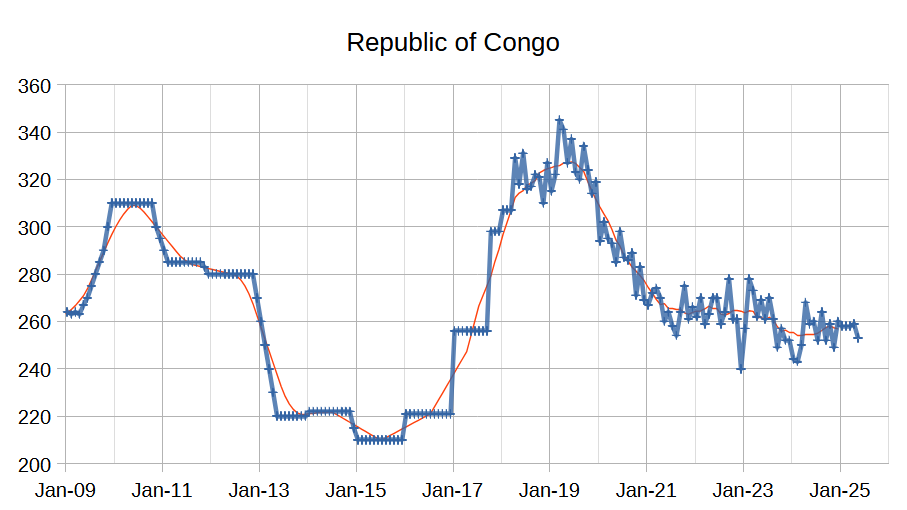
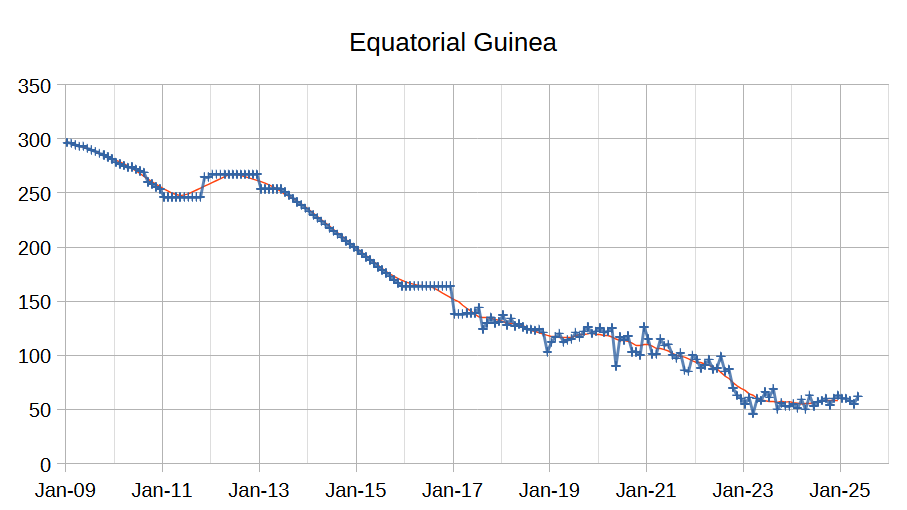
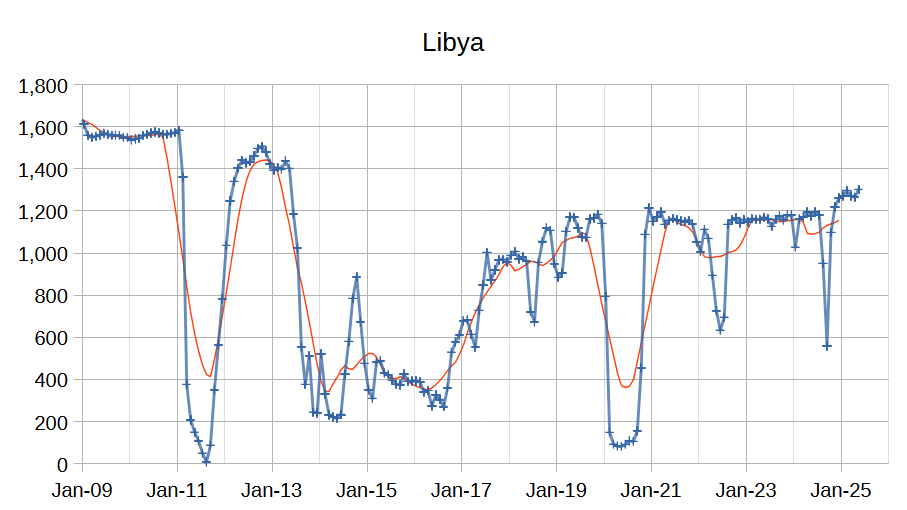
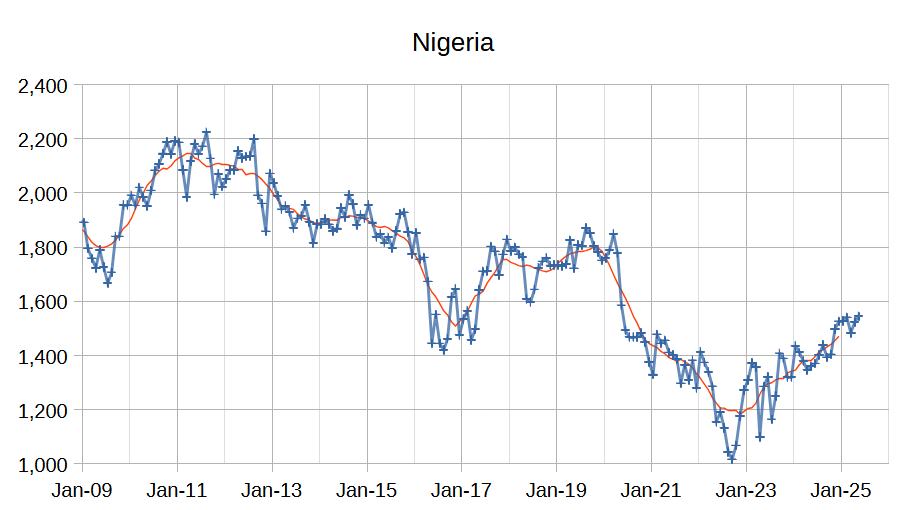
The OPEC Monthly Oil Market Report (MOMR) for June 2025 was published recently. The last month reported in most of the OPEC charts that follow is May 2025 and output reported for OPEC nations is crude oil output in thousands of barrels per day (kb/d). In the OPEC charts below the blue line with markers is monthly output and the thin red line is the centered twelve month average (CTMA) output.

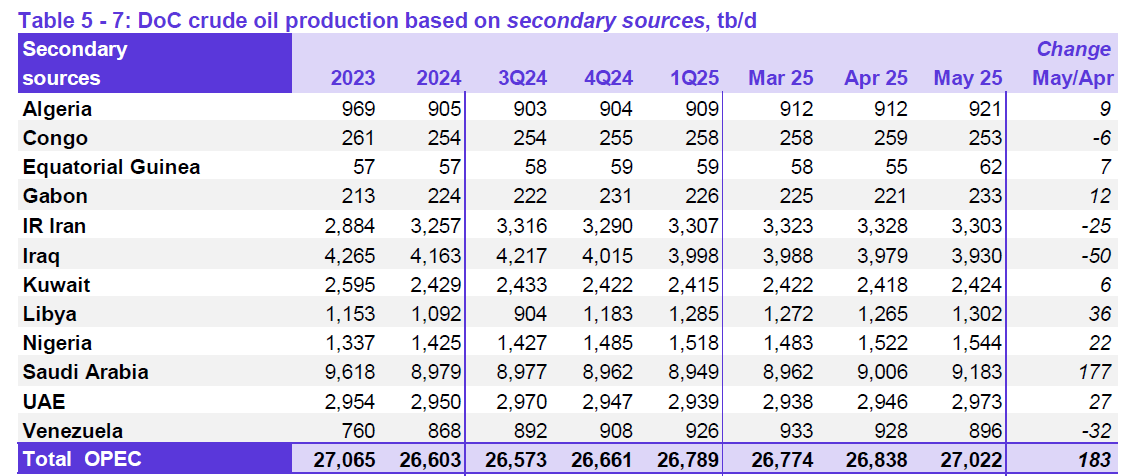
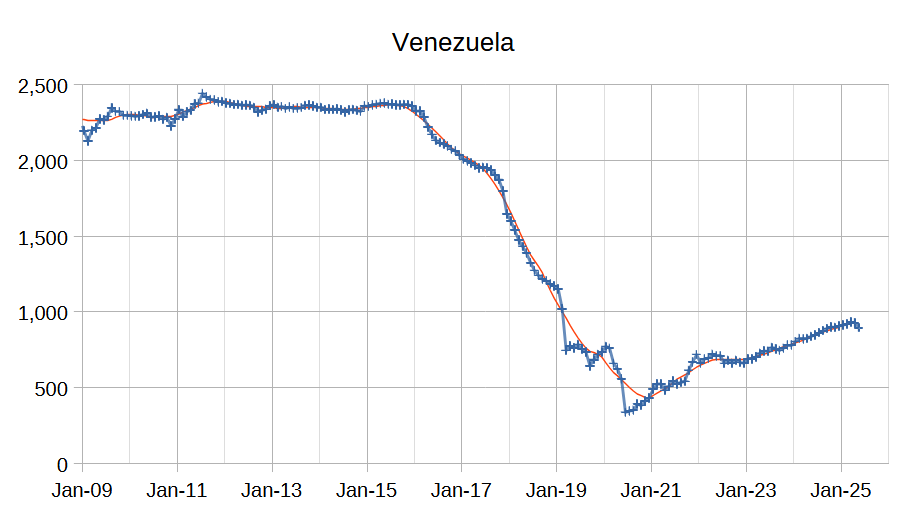
Output for March 2025 was revised higher by 2 kb/d and April 2025 output was revised higher by 128 kb/d compared to last month’s report. OPEC 12 output increased by 183kb/d with the largest increases from Saudi Arabia (177 kb/d), Libya (36 kb/d), UAE (27 kb/d), and Nigeria (22 kb/d). Iraq (50 kb/d), Venezuela (32 kb/d), and Iran (25 kb/d) saw decreased crude output, other OPEC members had small increases or decreases of 12 kb/d or less.
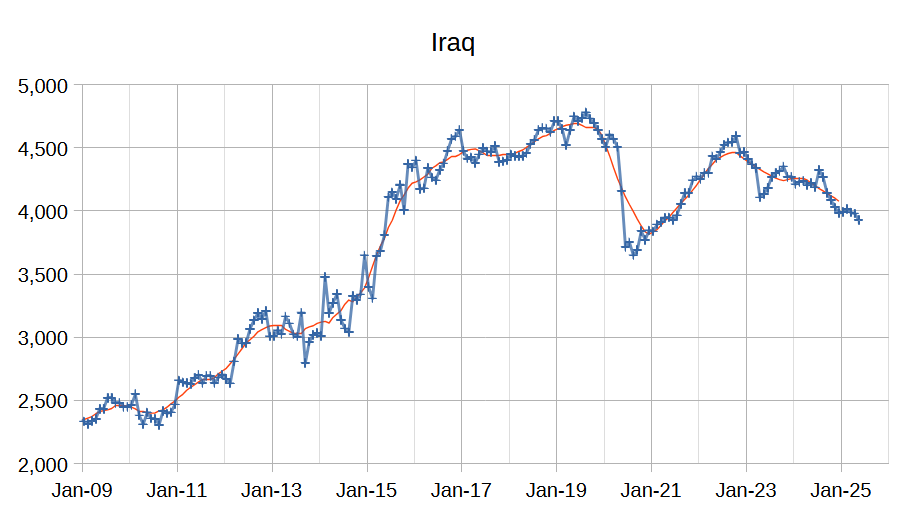
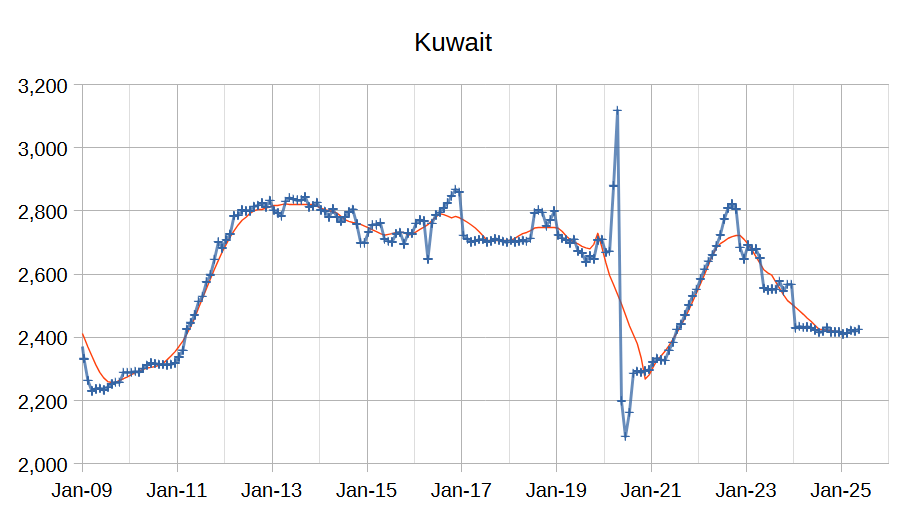
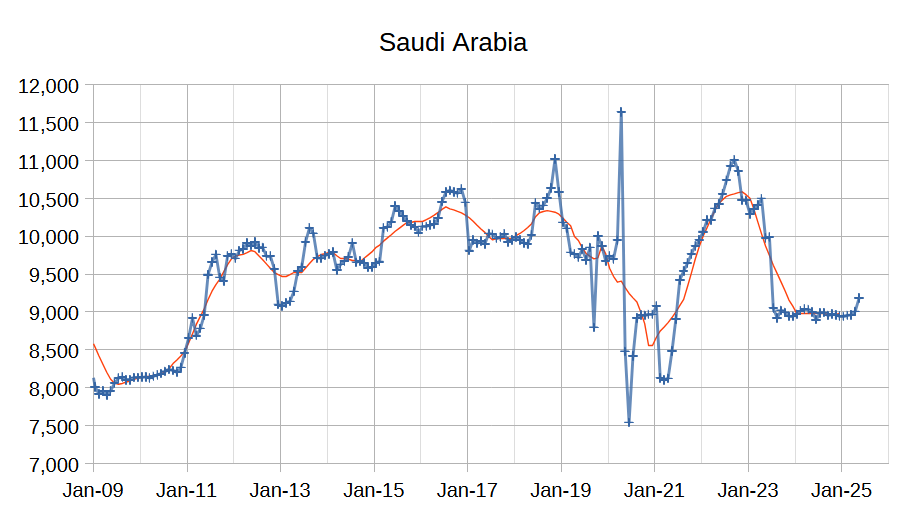
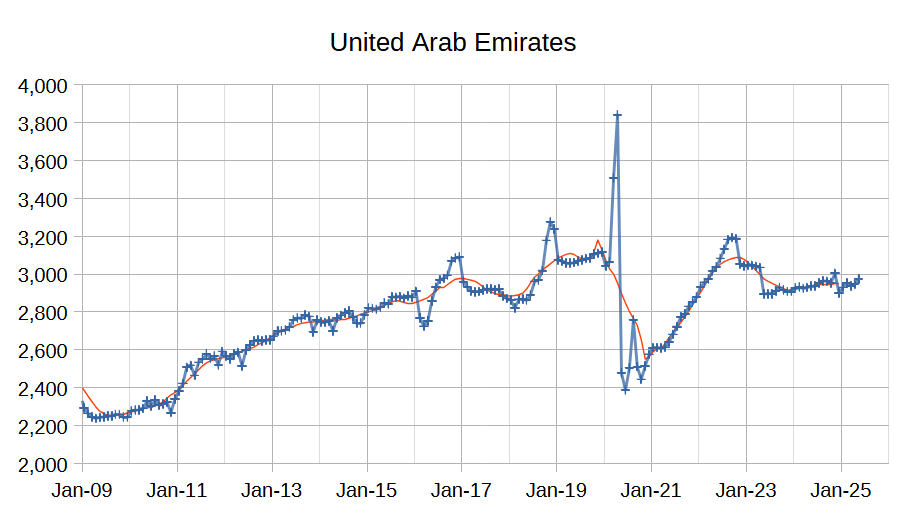
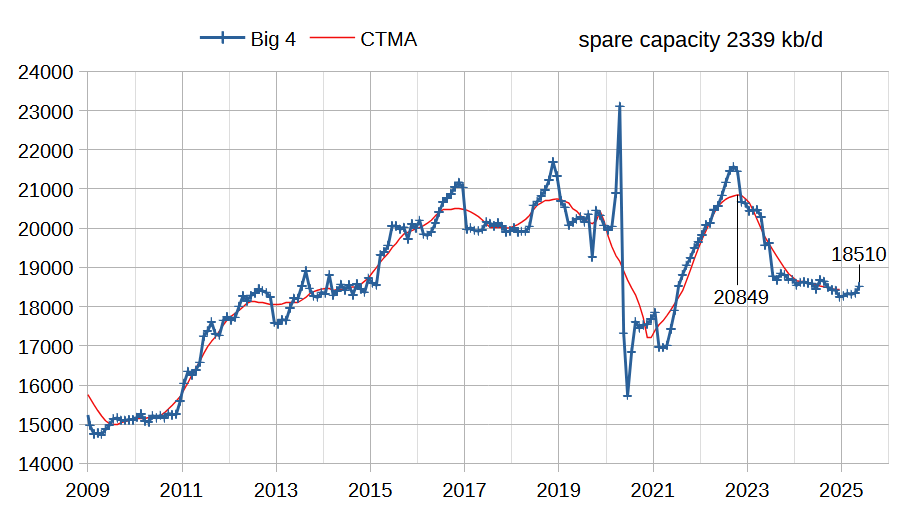
The chart above shows output from the Big 4 OPEC producers that are subject to output quotas (Saudi Arabia, UAE, Iraq, and Kuwait.) After the pandemic, Big 4 average output peaked in 2022 at a centered 12 month average (CTMA) of 20849 kb/d, crude output has been cut by 2339 kb/d relative to the 2022 CTMA peak to 18510 kb/d in May 2025. The Big 4 may have about 2339 kb/d of spare capacity when World demand calls for an increase in output. OPEC has announced plans to increase output at about 400 kb/d each month from June to October 2025, which would increase output by about 2000 kb/d and reduce OPEC spare capacity to only 339 kb/d, based on my estimate of OPEC spare capacity. Note that in May output only increased by 177 kb/d, if we assume output increases by only 200 kb/d and continues for 10 months we would also have spare capacity reduced to 339 kb/d. If we assume all spare capacity is held by Saudi Arabia, the spare capacity is reduced to about 1400 kb/d and could reach zero in 7 months if Saudi Arabia increases output by 200 kb/d over each of the next 7 months.
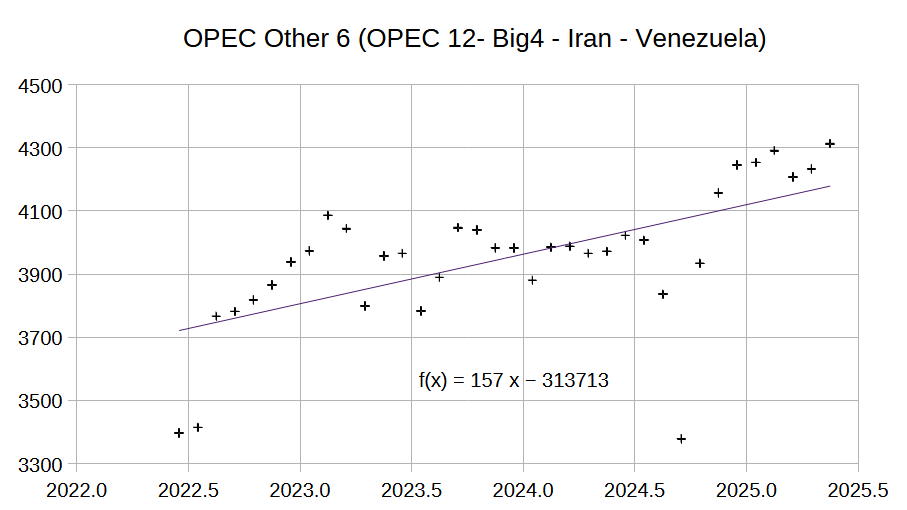
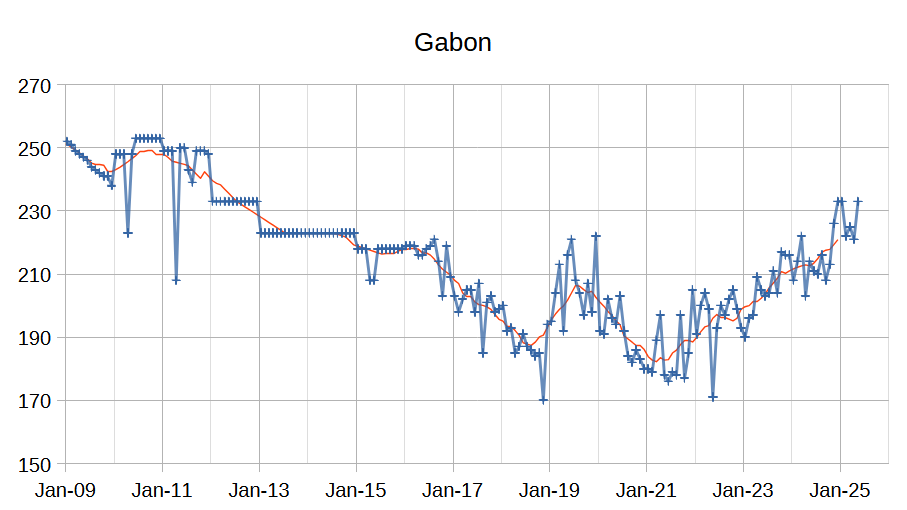
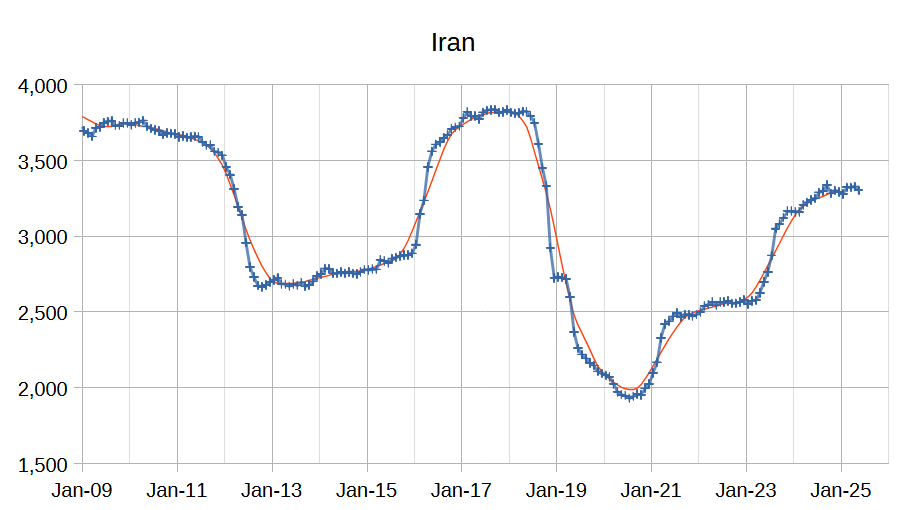
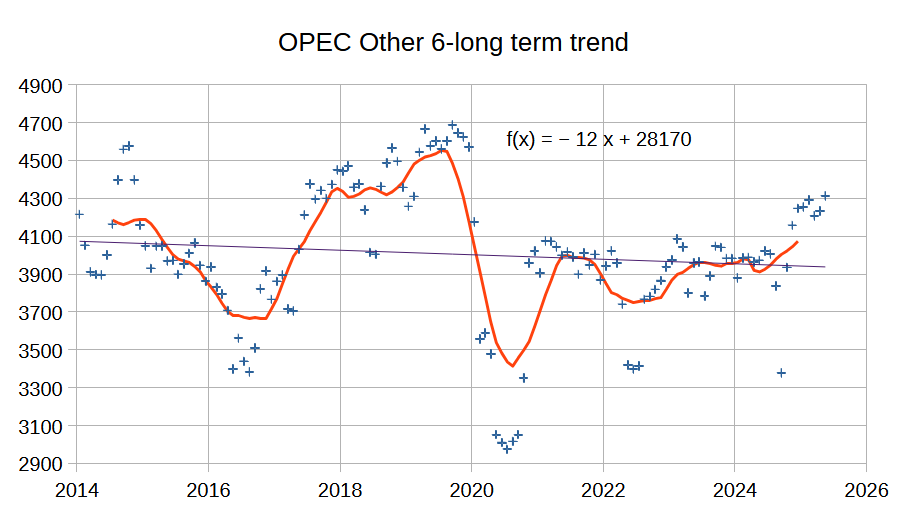
The chart above shows the average annual increase for the Other 6 OPEC group which excludes the Big 4 and Iran and Venezuela whose output has risen over the past 3 years by roughly 440 kb/d which I believe will fall to zero in the future. The chart below shows the long term trend for the OPEC Other 6 which is roughly flat. Much of the increase for the OPEC Other 6 over the past 3 years has been from Libya and Nigeria and I expect future increases will be close to zero. Also note that Iranian output may fall due the current conflict with Israel which will reduce future OPEC output.
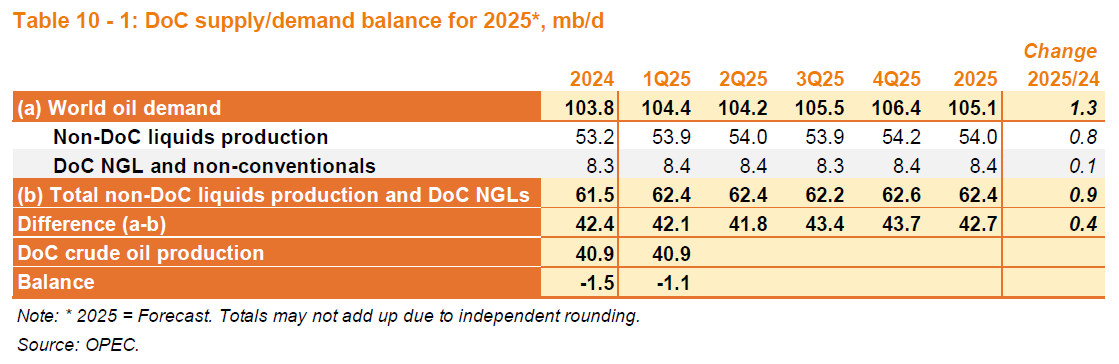
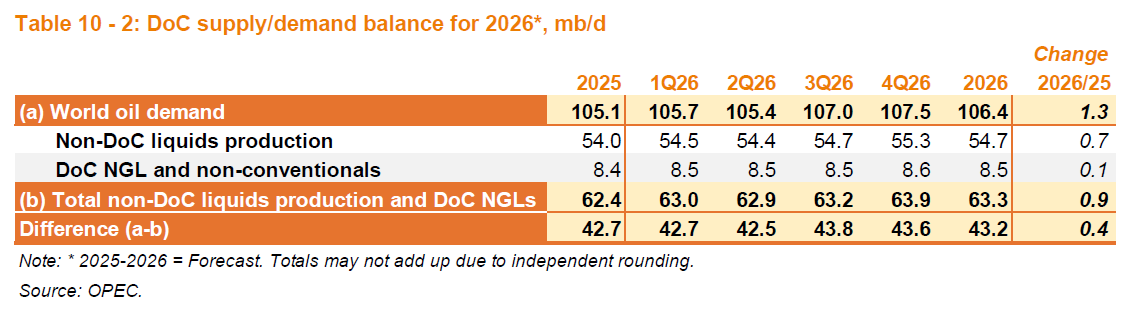
Demand for 2024, 2025 and 2026 have all been revised higher by 100 kb/d from last month’s estimate. Non-DoC Liquids and OPEC non-crude liquids supply were unchanged compared to last month’s MOMR.
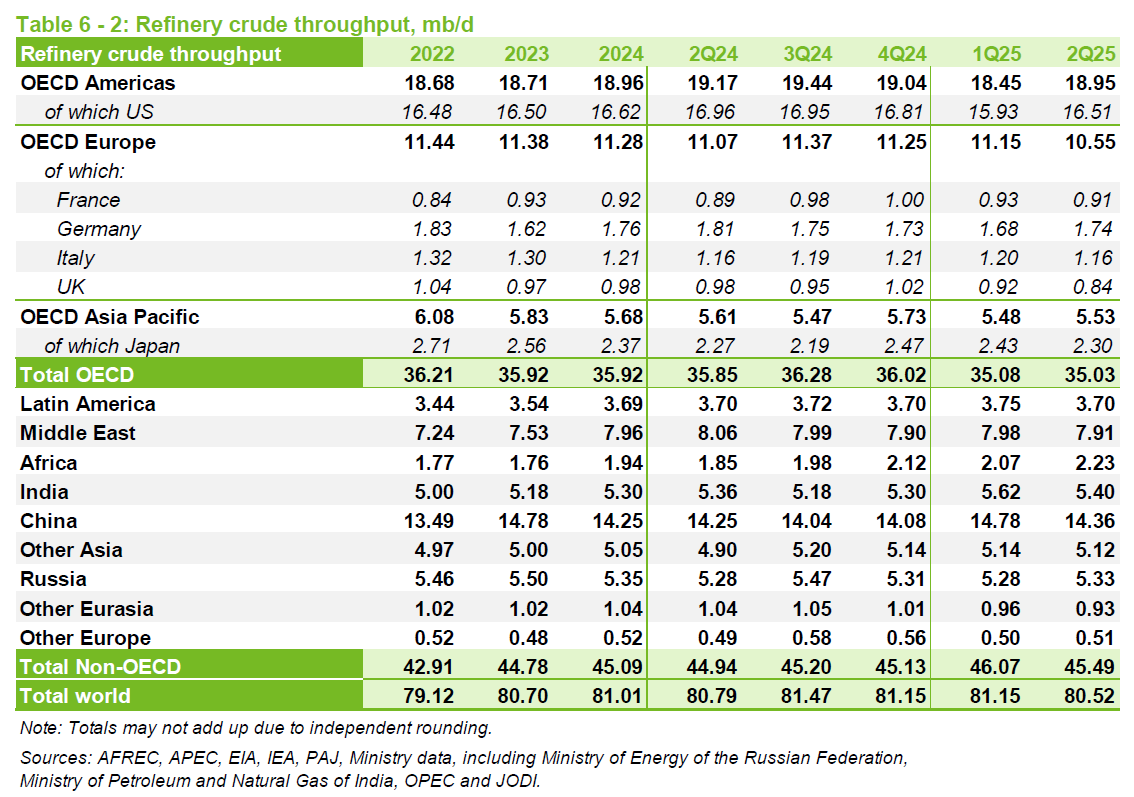
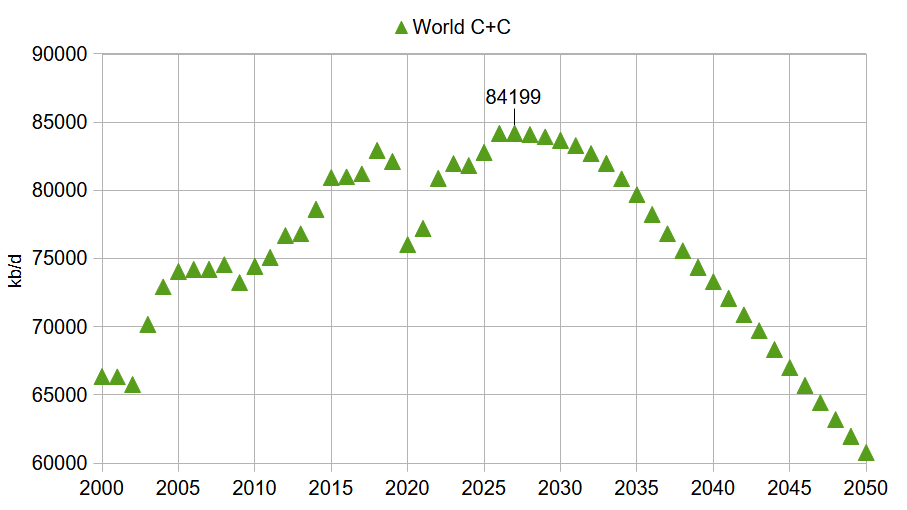
Total Liquids is a very poor way to look at World Supply and Demand for oil as the critical liquid is C+C which may soon be in short supply (likely before 2030). Refinery throughput may be the best way to evaluate World C+C demand, OPEC data shows the peak was 81.68 Mb/d in 2018. For the most recent 4 quarters the average refinery throughput was 81.07 Mb/d, the previous 4 quarters had average refinery throughput at 81.14 kb/d and 2024 had refinery throughput at 81.01 kb/d, so only about a 60 kb/d increase in the annual average over 6 months which suggests another 5 years to return to the 2018 peak if the recent rate of increase in refinery throughput continues for the next 5 years.
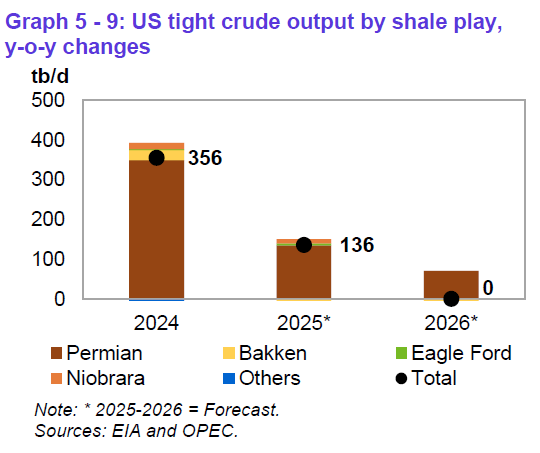
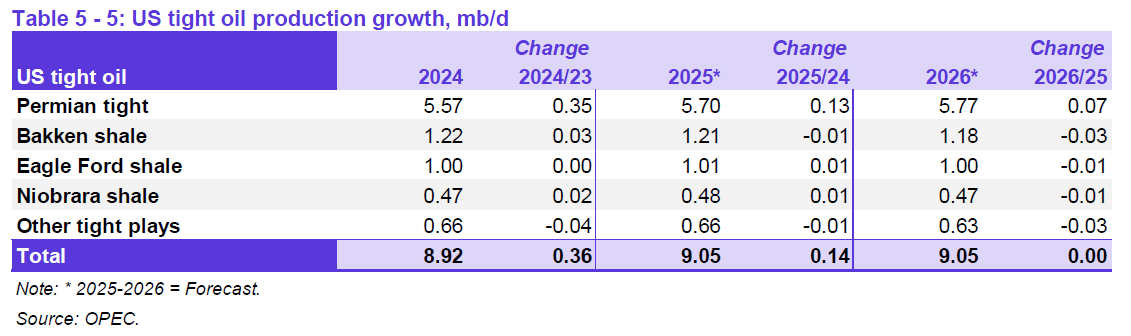
The OPEC forecast for annual change in US tight oil output has been revised from last month’s MOMR with 2024 higher by 10 kb/d, 2025 is 34 kb/d lower, and 2026 is 73 kb/d lower.
The scenario above assumes OPEC+ increases output by 200 kb/d from June 2025 to January 2026 and that Rest of World excluding OPEC+ and US has increased output of 200 kb/d from 2025 to 2033 followed by decreasing output at 250 kb/d each year up to 2040 and a 500 kb/d annual decrease thereafter. OPEC plus output remains flat from Jan 2026 to end of 2035 and then decreases at an annual rate of 300 kb/d until 2043 and then 600 kb/d up to 2050. US output uses the same scenario as the previous scenario presented in the OPEC post in May 2025. This scenario does not attempt to guess at the impact of the Israeli/Iran War, my expectation is that output will be lower due to lower output from Iran than in the scenario presented above.
67 responses to “OPEC Update, June 2025”
Great post Dennis, thanks.
You did not post an OPEC+ chart, so I will do the honors. The other 10 members of OPEC+, not including the original OPEC 12 members were down 3,000 barrels per day in May. They, these 10 members, which includes Kazakhstan and Russia, I believe have peaked. They all had permission to increase production in May, yet they did not.
Total production of the 22 members of OPEC+ was up 180,000 barrels per day in May. That was not what they had promised. From the net”
In May, OPEC+ was supposed to increase oil production by 411,000 barrels per day (bpd). This was part of a plan to gradually unwind production cuts that had been in place. However, some members increased output by less than the planned amount.
They were a bit short of that. And without Saudi’s increas of 177,000 bpd, they would have barley moved. Is OPEC promising what they cannot deliver?
Click on the chart below to enlarge.
Thanks Ron,
Yes the “other” members of OPEC plus that are not part of OPEC 12 have had relatively flat output recently and output from Russia has dropped by about 700 kb/d since early 2023. Chart below looks at those non-OPEC DOC nations without Mexico (which is not subject to quotas and really is not part of the agreement currently). For chart below Mexico is excluded and DOC=OPEC plus, thin red line is centered 12 month average.
I do not think “we” are going to Mars anytime soon.
To overstate the obvious, it would appear that the global oil market is in more jeopardy than current prices reflect. While every “analyst” sensationalizes the potential of a desperate Iranian government closing the Strait of Hormuz, such would be temporary. However, the big offloading jetty on Kharg island is a different matter; the Iraq-Iran War showed just how vulnerable the export facility is to a bombing operation. In essence, via a network of pipelines almost all the oil produced in Iran traverses the dozen or so miles from the Iranian mainland to Kharg island, which possesses a large number of tanks holding anywhere from twenty to thirty million barrels of oil supplying ten berthing positions at the off-loading jetty. For the last few years (due to sanctions), most of that oil has gone via the dark fleet to China, India and Pakistan, in that order of volume. Notwithstanding an OPEC failure to meet quotas, it seems unlikely that the market has priced in the growing possibility of an abrupt loss of 3.3 mbopd. And that would be a very big deal.
Gerry,
Not clear to me that any of the parties to the conflict would choose to hit this target. I am often wrong, so this may be one of those cases.
Peter Zeihan (youtube Peter Zeihan) has a scenario if Khang Island is taken out, Iranian regime has nothing to lose and takes out Saudi Arabia’s ability to export oil.
Andre,
It is not likely anyone will attack Kharg Island, so not a scenario worth considering.
I agree low probability. But not zero!
Remember Trump thinks the USA is energy independent ( doesn’t need the middle east ).
I have no clue what Israel thinks about oil. But they may think they are independent too!
But I do know they both want to topple the Iranian regime.
That would be a way to do it.
Remember, the USA already took out Nordstream. These people are capable of much more than you know, they are driven by fanatical power and greed, over the whole world.
Do not doubt the corruption, myopia, greed, and bloodlust driving the world. You will always be blindsided by events if you do.
Ukraine has admitted they took out Nordstream.
If Iran tries to close the strait of hormuz, they might get nuked by one of the submarines hiding underneath the water around the USA 7th fleet. The carrier fleet can detect when Iran is about to fire a missile (AEGIS Sky 1 radar).
Zeihan’s scenario is Iran attacking Saudi Arabias export facilities. Which I don’t think the Carrier Fleet has an answer too.
As it will be these radical groups that have been planted all around the place.
Can’t nuke a bunch of radical guerilla groups or you will do more harm than good?
https://mishtalk.com/economics/trump-gets-b-2-bombers-in-place-prepares-for-possible-attack-on-iran/
Stealth B2 Bombers being moved in.
I guess we are going to find out.
I predict Bunker Busters on nuclear facilities but not Khang Island.
The Statistical Review of World Energy by the Energy Institute will be released on June 26, 2025.
https://www.energyinst.org/whats-on/search/events-and-training?meta_eventId=2506SR
Data for 2025 report should be available around 9 AM EST (2 PM in London) at link below on June 26
https://www.energyinst.org/statistical-review
Demand for diesel fell by almost 140 thousand. Interesting.
Some good stuff at Oily Stuff on Permian and Eagle Ford
https://www.oilystuff.com/forumstuff/forum-stuff/frac-it-rip-it
I encourage everyone to visit Mike’s blog, you will learn a lot, I always do.
EOG has majority Delaware wells which are gassy to start than FANG’s majority Midland wells.
It is well-known that majority of operators in Shale oil time no longer practice PVT-bubble point, and largely driven by investor’s higher IP and more wells reserve demand. — ”30~50% more wells drilled and ended with 30~50% less oil”
To further exacerbate: they emphasize that higher GOR will help shale production, and it is like a new cult and the century long PVT model is too old — in China, the thicker oil with low GOR shale and tight oil is branded by majority geologists and even outsider like Peter Zeihan as “immature” and “impossible to produce”; and same for the small and only hypersaline lacustrine shale formation, Uinta, in US.
In the mainstream oil-gas generation models, there is not even a suitable model to use for hypersaline lacustrine low GOR&API to fit, and a small majority of geologists oppose any new model other than the marine models. Yet, looking at the deep GOA oil low GOR&API and depth, it does not take a professional geologist to see that the decades oil ABC models will not fit.
Yawn. You talk about your “industry” connections and it’s Mike and Shallow. Coupla minor operators, with limited analytical savvy.* You’ve never bothered broadening your connection set or getting contrasting views.
Years later…and this is what you have. What a joke.
And it’s hilarious watching you suck up, like a Hoover vac, to someone that kicks you in the teeth.
*In contrast, Enno, even if I don’t agree with him on everything, is a very smart guy, who I would listen curiously to on analysis of shale oil, supply chains, pharma, Moneyball, Tableau, or whatever he was doing.
I was with Enno from almost the very beginning; he was a smart guy that found a unique niche, but did not understand anything about oil and gas. Nothing. That is the truth. Myself and several other people, like LIkvern, helped him a lot because we believed in him. His business model was created around the idea that he wanted the data to speak for itself. He was brilliant.
Today Novi announced the funding of $35 MM, by private equity, to enhance its AI ability. I no longer trust Novi, I want data so that I can use 60 years of real life experience making my own interpretations of what the data means. I don’t need nitwits from Austin who have never seen a frac stage, tell me what the data means. Its called artificial for a reason. Novi wants you to believe that AI is unquestionable. Its on a mission to influence outcome, if it can.
I was a “minor” operator that could today buy all of your assets, Nony, with the credit limit I have on a Visa card. The employees I have set up for the rest of their lives I am proud of. You could NEVER understand that. Your personal insults, like so many others here on POB, directed at my career, or my family, or the American domestic conventional oil industry in general, are pathetic. People are ugly, and mean, and hateful, and otherwise don’t have anything to offer.
Take Alimbiquated, for instance: 40% of all shale oil wells in the U.S. today are stripper wells and overseen by hard working individuals with love for their families. They don’t just dig ditches and fill them in again…they believe in what they are doing. This comment coming from Europe, or even England (who knows really, as he likes to keep his credentials a secret) Is stupid, and ugly. Great Britain receives almost 800 MM BOPD of tight oil exports from the Permian Basin. Perhaps this individual comes from a background of making briskets for high tea. Who knows? Insulting hard working Americans is pure, unaltered, pompous… hate.
Thank you, C. I appreciate what you said.
Thank you, D. I agree with you about U.S. natural gas exports and appreciate your courage in the face of such of gross ignorance. I have never in 60 years seen so much of it !
“To count to one million without stopping takes 11 days. To count to one billion takes nearly 32 years. To count Elon Musk’s fortune would take more than 13,000 years. Who needs that much money?”
You already answered your question.
Elon Musk does. And Gates, Buffet, Bezos, Zuckerberg, etc.
They NEED the money. It fulfills some inner desire for them, because they were never the jocks in high school. You just can’t make this stuff up anymore if you tried. It’s beyond us all now.
US Horizontal oil rig (HOR) count down 1 WOW, Permian and Bakken no change from last week, Eagle Ford up 1 and Niobrara up 2, other basins (not Big 4) down 4. Year over year, US HOR down 33, and Permian also down 33, Big 3 (Big 4 excluding Permian) down 20, other basins up 20.
Frack spead count unchanged for week ending 6/20/2025.
US Horizontal Gas Rig Count down 1 rig from last week and up 9 YOY and up 15 since March 14, 2025. Peak since Jan 2022 was 152 rigs for week ending Sept 9, 2022, current count is 95 rigs, down 60% from peak in 2022.
Dennis, I know that you have me banned, but consider explaining the following.
The gas/oil ratio.
A well starts out at 1,000 bbl of oil per day/30,000 bbl per month. And it produces 1 BCF of gas per month. What is the GOR?
At the end of 3 years, it produces 100 bbl of oil per day/3,000 bbl per month. And it produces 1 BCF of gas per month. What is the GOR?
More importantly, has the GOR gone up? Or, has the oil production gone down? What meaningful information can be gathered by the GOR?
GOR tends to increase for an individual well as it ages. In addition GOR changes in a basin over time.
See
https://novilabs.com/wp-content/uploads/2024/04/4.-Gas-oil-ratios.png
Ron
Happy birthday. Hope you see many more ( at least until Dennis has declared the end of the plateau, and the start of terminal decline).
Dennis
Great report.
I just noticed the crude input to refineries in Table 6.2 in the first two quarters of 2025 are 81.15 Mb/d and 80.52 Mb/d. I also note the STEO reports crude production in the first two quarters are 77 Mb/d and 77.25 Mb/d. Provided the STEO and OPEC crude numbers are reasonably close, this implies there is currently a crude shortage in the World.
Ovi,
Thanks.
I think the input to refineries is C plus C rather than crude only.
Certainly. But also some crude is burned directly for electricity… The math gets difficult with increasing condi production worldwide…
Kdimitrov,
I agree, some crude is burned directly in power plants, but the annual average is probably on the order of 1000 kb/d or less. There is not very good data on this that is publicly available. And yes condensate production increases with rising natural gas output and the percentage varies from field to field.
For what its worth, Vladimir Putin met with OPEC Secretary General Haitham Al Ghais on the sidelines of the St Petersburg International Economic Forum on June 20 (2025). The verbatim transcript implies global ‘oil’ production is 103.5 Mbd. Russia is excluded from the SWIFT system, so there is no record (in the west) of direct country to country payments for oil.
Mr. Putin is a lawyer, and always precise. I notice his estimate of 105 is only for “the nearest future”, however that is defined.
“We agree with your (Haitham Al Ghais) forecasts that demand for energy resources and oil will undoubtedly remain high. (Addressing Alexander Novak.) How much is it, 105?
Deputy Prime Minister Alexander Novak: Now it stands at 103.5, and in future we will reach 105 million barrels per day.
Vladimir Putin: This is how it will remain in the nearest future. We also agree with these estimates.
By the way, we largely relied on your expert assessments when we were determining the strategy for Russia’s development, the strategy for the development of our energy sector…
…OPEC Secretary General Haitham Al Ghais: And that is why at OPEC and, with the support of the Russian Federation to preserve the stability in the market and the balance, we will incentivise investments, which are required for the future demand for oil, which we see growing from this year, now we see it at 105 million barrels per day, in 2050 we see it reaching over a hundred and twenty million barrels per day. Which is significant growth, for many reasons.
(Introduces a participant in the conversation.) This is the Director of Research, here with me, Dr Al-Qahtani. He is heading all our research, and I really appreciate, Your Excellency, that you are paying a lot of attention to the forecast done by our organisation. This means a lot to us that Russia considers this very seriously. We are very much – this is a responsibility on my shoulder and my team since we hear it from you Mr President that you really value the research we are doing and the forecast we are doing.
One of the key things I would like to share with Your Excellency is that we have always removed ideology out of our forecasting. Unlike some of the other western agencies that put ideology into their numbers and they cook, if I may use the term, they cook the numbers. We do not do that in OPEC.”
Laurie,
The 103 to 105 Mbpd is total liquids which includes NGL, biofuel, and refinery gains. Only about 82 Mbpd for 2024 annual average output is C plus C, those are the liquids used to produce gasoline, diesel, and jet fuel which are the main liquids that might be in short supply in the future. For this reason we focus on C plus C. Peak was about 83 MBpd in 2018, that level may be surpassed in 2026 or 2027, decline will become noticeable after 2031.
Yes, he said ‘oil’ which I reflexively equate to C + C, but you are right, he must be referring to all liquids.
All the light gas liquids do need that heavy for blending. Urals, tar sands, Venezualan, Iranian etc.
Interesting dynamics for product chokepoints and geopolitics.
“Mr. Putin is a lawyer, and always precise”
Putin is a bullshitter, are you watching the news? A lawyer in a system he controls.
U.S. Bombs Iranian Nuclear Facilities, As Iranian Parliament Responds By Voting To Close the Strait Of Hormuz
It looks like we are heading into QUITE THE INTERESTING TIMES AHEAD.
I wonder what the price of oil and gold will trade when the Asian Markets open in a few hours. Iran has threatened to close the Straits of Hormuz many times before, but didn’t. Is this time different?
If this Israel-USA-Iran conflict escalates, will Iran attempt to use its Hypersonic Missiles on U.S. Navy Aircraft Carriers or Ships??
Trump warned that if Iran attacked U.S. bases or U.S. Military forces, the United States would bring its entire Military Might on Iran.
Remember how Ukrainian Drones took out Large Russian Strategic Bombers several weeks ago? Drones at $1,000 a piece destroyed several Russian Strategic Bombers at $500 million a pop. What happens if Iranian hypersonic missiles hit a U.S. aircraft carrier?? Could Two or Three Iranian Fattah-2 Hypersonic missiles at a total cost of $300,000 take out a $13 billion Gerald Ford Class U.S. Carrier??
What next???
steve
https://www.dailymail.co.uk/news/article-14836175/Iranian-government-SHUT-Strait-Hormuz-closing-20-cent-global-oil-gas.html
Never forget what is under the water of US carrier fleet. Stealth submarines that are armed to the teeth, and you DON’T KNOW WHERE THEY ARE.
A closure of the Strait of Hormuz won’t be a celebration, it will be suicide for Iran.
https://www.dailymail.co.uk/news/article-14836301/Trump-nuclear-threat-Ex-president-Dmitry-Medvedev-nuclear-weapons-Iran.html
Russia: countries lining up to give Iran nukes
https://mishtalk.com/economics/derivatives-suggest-80-wti-oil-when-futures-open-then-what/
$80 WTI
Andre The Giant (WTI 2025 predictions):
At the 1/2 way point
Iran Attacked by Trump for attempting to assasinate him: Check!
Permian Decline: MMM-Kind of Check! Still uncertain I think
115 a barrel end of year: Looking like a possibility, maybe higher depending on how things unfold.
Chevron yanked out of Venezuela: Did not see that coming
Like my great great grandma taught me, if everyone else goes low….you go HIGH!
Oil prices just dropped $4, down below $70 in the past hour.
Obviously markets can gyrate and impossible to make a Euclidean cause/effect inference. But it seems like markets just decided that the Iran strike was kind of a one-off and will not lead to a closure of the Straight. I guess markets were pricing in more risk earlier.
This is not to say, we won’t have some wider war (and a big price rise). Just that over the last hour, markets decided they had been pricing in too much risk (too high a percentage odds of it happening).
Really not what I expected from Monday markets. Thought we’d at least have a big jump at the opening bell (like from $74 to 80) and then possibly a pullback. But markets didn’t even do that opening jump. Just flatlined for four hours. And now have dropped, instead. Sure seems like markets think the danger of a wider war is overstated.
It’s in the 66es now, in the EDT evening. And it actually briefly dropped below 65 during the day.
Whiskey Tango?
You better go buy some more designer jeans with the gasoline savings. Lol!!
I was thinking of you with the price drop. Better put that bass boat on hold.
I mean…oh darn, hate it when peace breaks out. Don’t worry…maybe we can get another war somehow!
Not kidding. You think I’m hard on you, but it’s actually sort of a tough love, fond of you!
FYI I’m 10# away from literally (and not how the automatic transmission driving Millennials use that word) buying those jeans.
I will spend the money on a new SUP. Old one is starting to slow leak.
Don’t tell Dennis. He will want me to vote for some neoliberal like Pete Buttawhateverhisnameis. The dude who worked for McKinsey.
😉
lol. I don’t fish. I’m set on my golf clubs.
Thankfully, I’m somewhat diversified from socking all of the oil money into other things.
Generally, when oil tanks the S&P goes up, and vice versa. Oil gets too low when the economy is sucking, then everything drops. MSFT has been on a run, think it’s hitting an all time high today.
Will continue to maintain $75 WTI doesn’t hurt anyone, but the Donald doesn’t like it, so oil has to go down.
Gotta love the stripper guys that vote MAGA (over 95% – higher than farmers 85%).
We just got a big farmer bailout direct deposit in March. Too bad the MAGA stripper well guys and gals can’t figure out a way (besides preservation of percentage depletion) to get some goverment $$.
Maybe an LDP payment like we used to get for grain? If WTI is below $75, we get the difference at the end of each year, with a max of $250k per producer (the $250k is the farmer max)? Lol.
I’m for peace completely as our son is in the Army Reserve. He’s done his deployment and gets out soon, but would be called back in a big boots on the ground war.
Maybe the Donald is the second coming of Christ. Things seems to work out for him despite the terrible human he is.
He is a weird dude. Never was into his crap, even in the 1980s. Of course it was sort of lesser of two evils, when I had to chooses some lefty like Kamala versus him.
https://www.youtube.com/watch?v=DJYu0ia3fvo
Markets for pretty much everything, including oil, are showing “irrational exuberance” these days. Oil way down, even though shipping insurance rates are going through the roof? Do the markets really think that Iran will not try to do anything to Gulf shipping?
All North Dakota C+C production was down 21,619 barrels per day in April to 1,171,738 barrels per day.
The real story here is barrels per well per day. Before the pandemic, it was in the mid 90s. At the height of the pandemic it had dropped to 71 in May and June of 2020. In April 2025 it is at 62 barrels per day per well. Of course this is an average, older wells producing many times less than newer wells.
But the main factor driving the decline in barrels per well is the fact that there are many more wells now. Wells producing is increasing at an average of about 35 wells per month.
That is the average of new wells started each month over wells shut down each month. This is a decline from an average increase of over 100 increase in producing wells per month last year. That is, new wells minus wells shut down per month.
Ron
You’ve got a record of looking at ND per well production (very misleading) statistic too much. Easy to pull up posts from a decade ago, where you thought this signaled the doom of the Bakken. And DID NOT understand the population dynamic.
And here we ARE. In 2025(!), with poor old ND, doing over 1 MM bopd.
What were you talking about in 2013? In 2016? Where is “Verwimp”? Remember that dude with the uh-mazing match/prediction of ND production? That turned into utter s***!
While you have a caveat here about the population effect (showing you learned something), it still doesn’t change the issues with using this misleading statistic. Which still seems to fascinate you. A bit too much!
Regarding the population effect, the clearest thought example is to consider some mystery “thought experiment” land (call it Perpetua), where we add 100 wells of the exact same decline profile (shape and IP and EUR), every year. Forever. This example will clearly show a decline in average (producing) well over time. Even though the individual (new) well profiles are unchanged. And even the rate of POPing has not changed.
Again, I get the impression, you “get this” now. You didn’t in the past. Even Dennis bonked you for it. But even if you acknowledge the caveat NOW, you’re still using a statistic that is prone to a confounding effect. Like me acknowledging that NFL teams in the lead, run out the clock and then STILL noting the same confounded statistic.
It’s like me saying, my cycling speed dropped in June versus May. And (maybe) acknowledging that the temp went from 75F to 100F. But…it’s STILL one equation with two unknowns. Can’t meaningfully solve that for an inference. If instead, I compared days in each month that were 85ish, I could (maybe) get some inference if I’m getting worse.
BTW, this is a real example….where I’ve actually (very slowly, but STILL) gotten better, on a temp-neutral basis, but look worse if not removing the confounder. Sorry for biking…I know it is for tree-hugger lefties. I should probably be drinking beer and golfing (and not even walking the course!) like a good Trumpican.
There are many other factors that can confound the average well production count (quality of well may change, average profile may change, number of wells added may change [boom and bust, leading to changes in percentage of “big, new” wells], temp shutins, permanent P&A, refracks, etc., effing etc!)
Again, while you’ve learned some lessons from your decade-old crap analyses, I still think you are TOO fascinated by this metric. Which is a pretty poor one, for doing analysis.
Much better is just to compare generations! This is what Enno did. Showing 2010, 2011, 2012, etc. wells versus each other. This allows comparison of the quality of wells over time. He even had thickness of the line, to allow showing how many wells were drilled (which helps, at least visually, compensate for high/low grading during price gyrations).
BTW, while there are SOME downsides with the per well production dropping, there are actually some upsides too. It sort of depends on what you are optimizing. What economist mean when they say “what is your happiness function?”
Yes…an older well population means a higher per barrel opex expense. But from the perspective of the community, of ND, having some stable work force doing stripper well work (versus boom and bust man camp transients) can actually be a feature, not a bug. Also, of course, an older population (more stripper well-ish) tends to be lower decline. So, when prices drop and drilling drops, the older population is less impacted.
We saw this dramatically with the EF and Bakken in 2014. The former dropped much faster than the latter. At the extreme, of course, are stripper wells, which have (near) zero decline rates.
Note: this is not to say that lower production per producing well is all great. Just that it is not 100% bad, either.
You need to think more thoughtfully. Still blows me away how Dunning Kruger the “think they are smarter than the dumb Repukes”, some of the Democratic-oriented peak oilers are. They are so sure every conservative can’t do math…while they have probably never looked up a Bessel function in their lives. You see this all the time with the “creative class” who watch SNL and think every Southerner is a rube.
I love hiding in the grass and then slamming them, like Loudon Swain flipping the Shute.
Just kidding. Or. Am I?
😉
But from the perspective of the community, of ND, having some stable work force doing stripper well work (versus boom and bust man camp transients) can actually be a feature, not a bug.
This is the proverbial digging ditches and filling them up again to grow the economy mentioned by John Maynard Keynes. Imagine if those people had a job doing something actually useful.
Oh, give me a break. For a guy who is afraid to use his own name, you sure are brave when it comes to pointing out errors of those who do use their own name. North Dakota is producing 350K barrels per day less than it did six years ago. I would never have thought they would drop that much that quickly.
And I pointed out exactly WHY their production per well is dropping. It is because they are opening more wells than closing, and those old wells are declining. What is so goddamn hard to understand about that.
Geeze, some people feel they must criticize others over nothing.
It’s more than what you thought they would do, ten years ago. When you thought it would drop off a cliff.
Heck, it’s doing almost exactly the same was what it did 10 years ago!
MAR2015: 1.18 MM bopd
MAR2025: 1.16 MM bopd
https://www.eia.gov/dnav/pet/hist/LeafHandler.ashx?n=pet&s=mcrfpnd2&f=m
So much for the dropping off a cliff!
P.s. BTW, where is Verwimp? How does his prediction stack up now?
Now you are just making shit up. One would have thought you could have done better than that. I don’t remember ever saying they would drop off a cliff. And everyone, including me, knew they were on their way up 10 years ago. And if all you can do is criticize what someone wrote ten years ago then your posts are worthless as shit. Post something relevant to today. I don’t know or care what happened to Verwimp, and I have no interest in what he, or anyone else posted ten years ago. What they are posting today is all that matters.
“Is the Bakken a Bust?”
https://peakoilbarrel.com/2017/02/ (early 2017)
“Bruno Verwimp sends us the above chart. The accuracy of his prediction is uncanny.”
[How did that work out? His curve predicted we should be less than 100,000 bopd right now!]
“Tight oil will be a complete bust. The Permian is performing well because it is mostly conventional production. But even the Permian will begin to decline by 2020 or shortly thereafter. All other shale plays are already in decline.”
[How did that work out? We ended up BREAKING the all time record for US production…and even going above 13 MM bopd.]
=============
I still remember at peakoil.com, when you challenged me on your (I claimed) failed record of Russia peak predictions. And I trawled the Internet and found over 20 linked instances where you/”Darwinian” had been wrong about Russia. Even the Peakoil.comers said you had been squashed.
Nonymo,
I’m in Europe for a while.
Metro, trains, busses, etc.
Life is good. Miss my car, though in the States. Hope by the time I get back, gas will be below $2 or else. Gotta get to 14 MM bopd to sleep well.
Nony,
Show us your predictions and if you are going to say, what ever the EIA AEO says. Those projections for their reference case were pretty far off back in 2017.
Looking forward to your predictions without which you have zero credibility.
Well…I don’t make a lot of predictions because I’m not as Dunning Kruger stupid as the typical neoliberal peak oiler.
But one is that I warned you that USGS had a habit of needing to revise their estimates higher. Yet, you still went to a science conference in 2018, with a USGS-based prediction, that it turned out doubled, a month before your presentation.
The funny thing is you were too cheap to reprint the poster, and you just stood in front of something you knew was a piece of crap. Heck…you should have taken a red sharpie to it.
Predictions are almost always wrong. People who are brave enough to make predictions should be prepared to face future idiots who will point out where their predictions went wrong. These idiots are not brave enough to make predictions of their own because their knowledge of the subject is too shallow to do that, So they satisfy their ego by pointing out those who were brave enough to make predictions were wrong.
So we must put up with these idiots and stroke their ego. After all, what would we do without those fools if not to point out mistakes?
You are so, sooo brave. Pat yourself on the back, Darwinian. Wow…you made crap predictions. And consistently in the too low direction.
What a joke. Peak oilers consistently underpredicted shale growth. Whodathunkit?
But…this isn’t even about predictions. It’s about how you don’t know how to deconfound the population effect. And run with a crap metric like production per well, uncorrected for age. Duh.
Nony,
No you are simply a coward.
The EIA also underestimated tight oil growth. When I did the poster for the AGU Conference, I had limited information on the Permian Delaware Basin as the USGS had not yet evaluated undiscovered resources there. I became aware of the new USGS assessment on December 6, 2018, the Fall AGU Conference started on December 10, 2018 and the deadline had passed for submitting the poster to the printer. I live in a rural area without much access to overnight printing of this sort so last minute changes were not an option.
So, the estimate was revised and presented on 8×11.5 paper.
Here is my estimate from December 10. 2018 for Permian Basin
https://peakoilbarrel.com/open-thread-petroleum-december-6-2018/#comment-660930
Note that for the Medium Scenario in chart below (ERR=60 Gb) output in May 2025 is about 6800 kb/d for Permian tight oil, while actual output in May 2025 was about 5720 kb/d, so the guess proved to be too optimistic by about 19%.
Also note that I was using the well profile from 2016 average wells to estimate the future with EUR about 330 kb of oil, the well profile increased to an EUR of 440 kb of oil by 2020 and has remained at roughly that level from 2020 to 2022. The 700 wells of the 2016 vintage would be the equivalent of about 525 of the higher EUR wells from 2020 to 2022. Completion rates lately have been about 450 wells per month in the Permian basin for horizontal tight oil wells.
Finally, note my scenario was using the AEO 2018 reference case for Brent oil prices, link below
https://www.eia.gov/outlooks/aeo/data/browser/#/?id=12-AEO2018&sourcekey=0
The 2025 price forecast was $84.70/b in 2017 $ for Brent, using 2025$ this would be about $112/b, much different from current STEO price forecast for 2025 of about $66/b.
Click on chart for larger view (this is my guess from December 2018, so about 6.5 years ago.)
Unless everyone here is wrong because, actually, oil is unlimited or effectively so, I’m not quite sure what these histrionics are for over whether people were off by a decade or not.
Oh cool, we get to burn more of the black goo from the ground to turbocharge already accelerating climate change? I am so relieved the idiots in this community called it wrong. Now we can have an even funnier finality to the end of civilisation instead of one we could have weaselled out of like Trump does so many predicaments.
Oh well.
Nony.
Quit posting while drunk.
I’ve never claimed to be any more than I am.
I have no idea what your background is.
As for Mike, you couldn’t have kept up with him for six hours last week, and he’s no kid. Mike has seen and lived a ton.
There has been another poster here who has owned a lot of shale in the Permian. I talked to him on the phone once after Dennis connected us. It’s been awhile, and I don’t think he posts here much anymore. I’ve even forgotten his handle here. Maybe Dennis can remind me. Was it “Shale Survivor?”
There is really no reason to be cocky. Just because half of the US populace is made up of dumbasses doesn’t mean the discussion here needs to be dumbass.
Have zero issue with someone who has opinions. Just make sure you stay factual as much as possible.
For some reason you have taunted me when the chips were down, when oil was $25 in 2016 and during the pandemic. Why would you taunt some anonymous person on a blog? Makes zero sense to me, nobody I know personally talks smack like that. It’s all a TV/internet thing, this MAGA insult bullshit.
BTW, we survived $25 in 2016. Survived 2020. We won’t be broke if oil goes to zero and we plug out all of our wells. At this point, it would’t even matter much.
shallow sand —
Quit posting while drunk.
Haha nailed it exactly.
Shallow Sand,
The drinking starts early in Northern New York I reckon.
You may be thinking of LTO Survivor, a nice guy, very knowledgeable, he is missed.
U.S. Crude Oil and Natural Gas Proved Reserves, Year-end 2023 Bold mine.
Oil highlights 2023
U.S. crude oil and lease condensate proved reserves decreased 3.9%, from 48.3 billion barrels to 46.4 billion barrels, year over year from 2022.
U.S. crude oil and lease condensate production increased 7.8% year over year.
North Dakota crude oil and lease condensate reserves decreased 12.3% from 2022, the largest annual net decline (611 million barrels) reported among all states. The second-largest net decline of oil reserves occurred in Alaska (11.4% or 384 million barrels).
The 12-month, first-day-of-the-month average spot price for West Texas Intermediate (WTI) crude oil at Cushing, Oklahoma, decreased by 17.4% year over year, from $94.54 per barrel (bbl) to $78.05/bbl.
New Mexico crude oil and lease condensate proved reserves increased 6.1%, the largest net increase (380 million barrels) in 2023.
Well well well … lookee heah.
Water treatment outfit named Gradiant just announced that its pilot/research site in Pennsylvania will start commercial operations in a few months to produce about half US’ lithium needs by extracting lithium carbonate (99.5% purity, 97% recovery rate) from the Mighty Marcellus shale wells’ produced water.
Technology – like depletion – never rests.
Keep calm and frac on.
Lithium batteries will solve the problem of expensive fossil fuels underlying the whole economy. Very smart, sir.
New posts are up.
https://peakoilbarrel.com/short-term-energy-outlook-june-2025/
and
https://peakoilbarrel.com/open-thread-non-petroleum-june-25-2025/