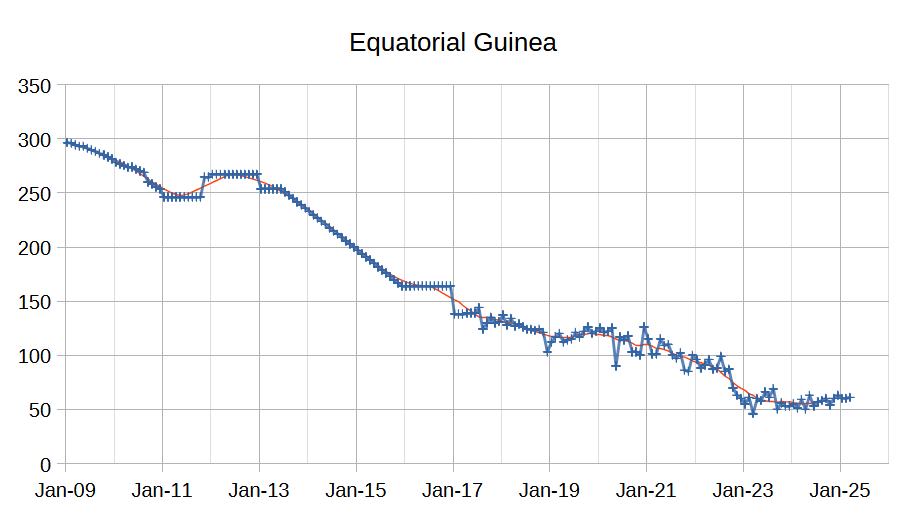
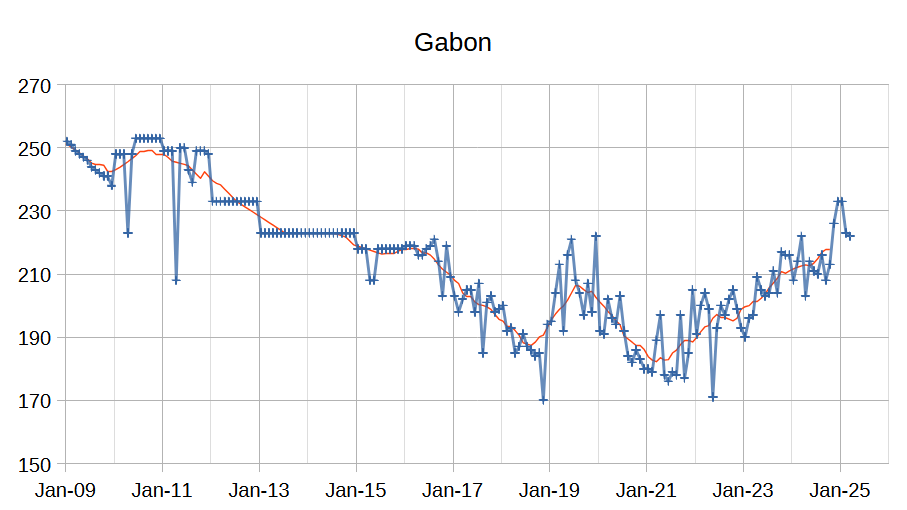
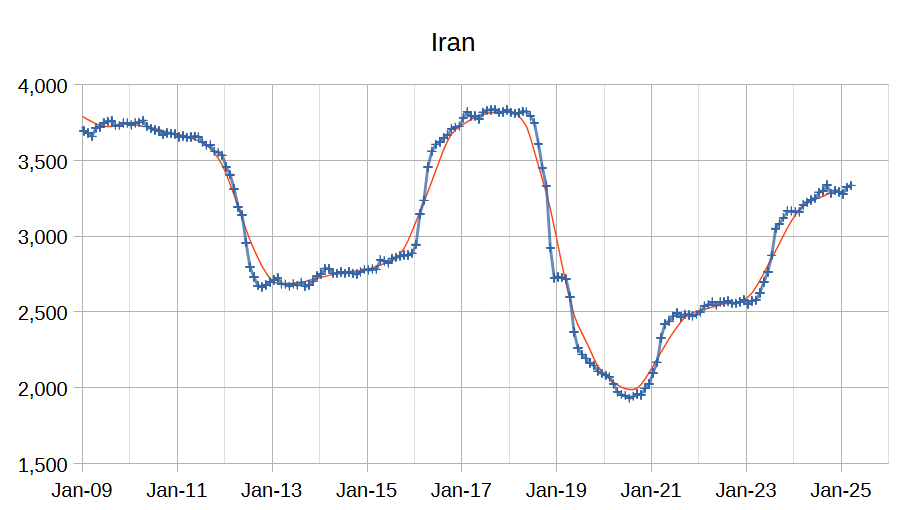
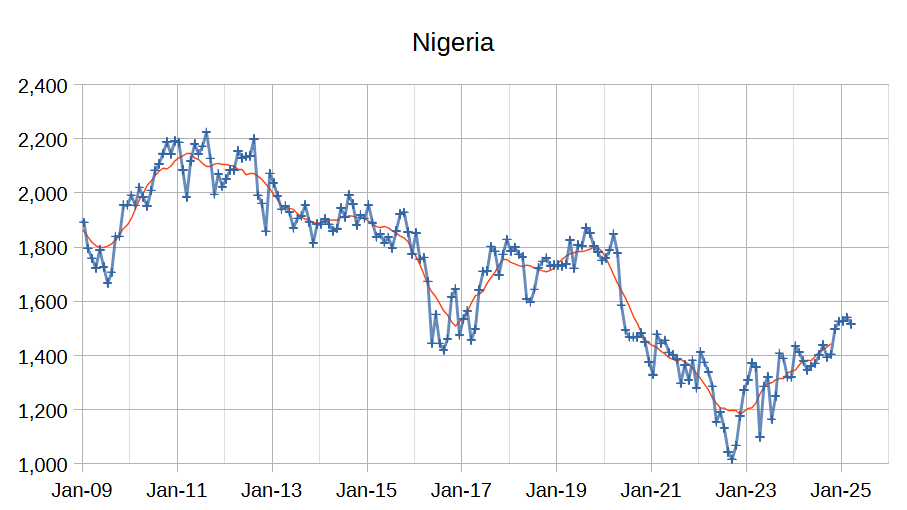
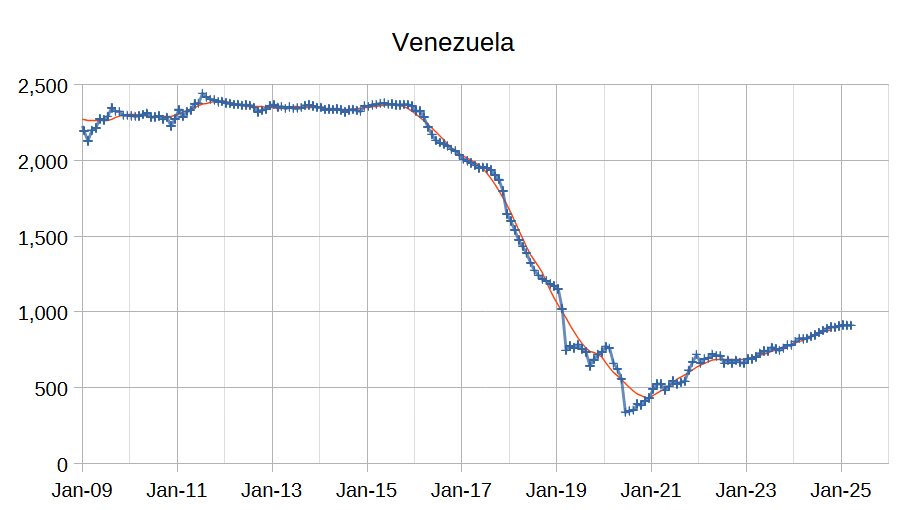
The OPEC Monthly Oil Market Report (MOMR) for April 2025 was published recently. The last month reported in most of the OPEC charts that follow is March 2025 and output reported for OPEC nations is crude oil output in thousands of barrels per day (kb/d). In the OPEC charts below the blue line with markers is monthly output and the thin red line is the centered twelve month average (CTMA) output.
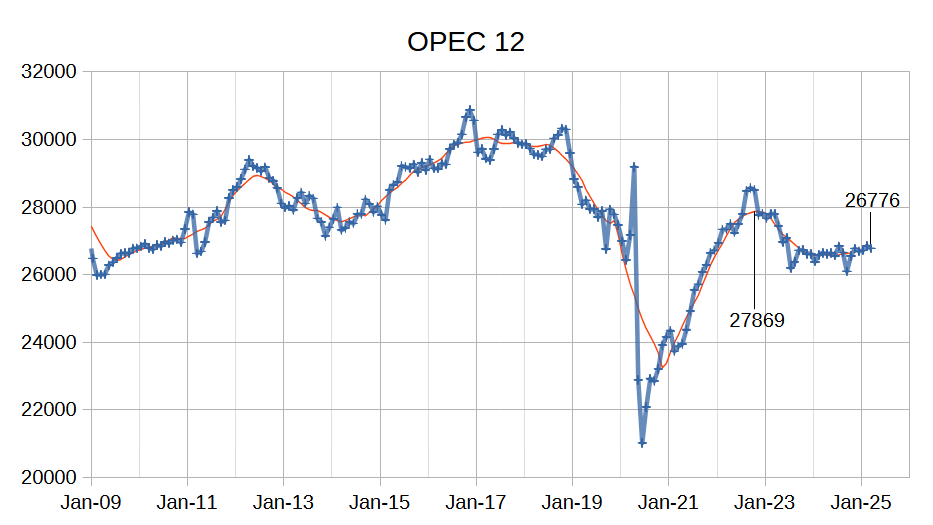
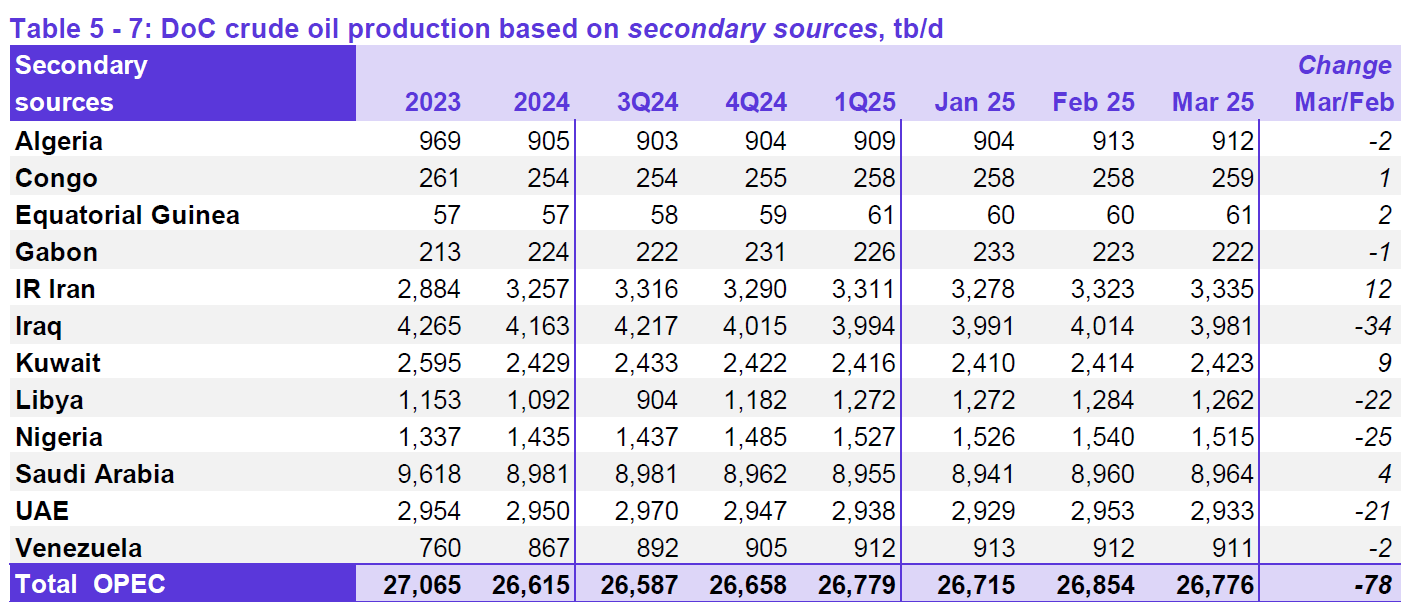
Output for January 2025 was revised higher by 9 kb/d and February 2025 output was revised lower by 6 kb/d compared to last month’s report. OPEC 12 output decreased by 78 kb/d with the largest decreases from Iraq (34 kb/d), Nigeria (25 kb/d), Libya (22 kb/d) and UAE (21 kb/d). Iran (12 kb/d) and Kuwait (9 kb/d) saw increased crude output, other OPEC members had small increases or decreases of 4 kb/d or less.
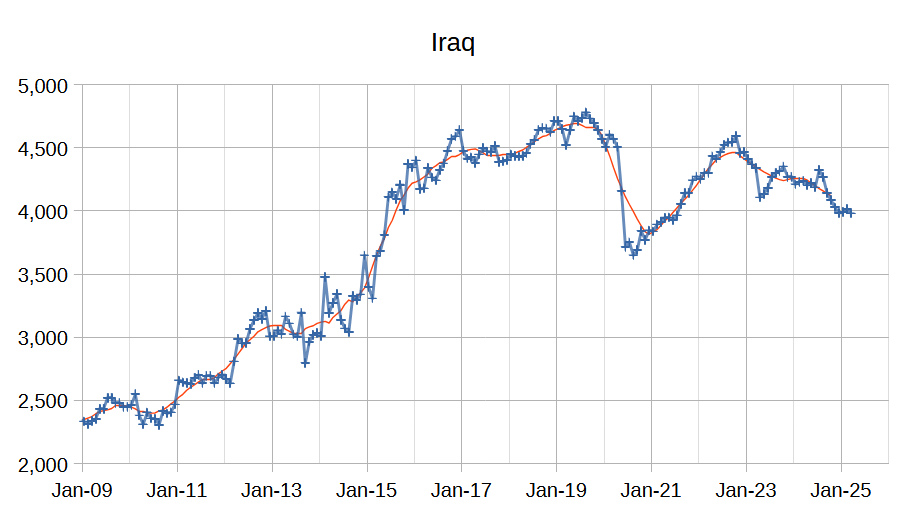
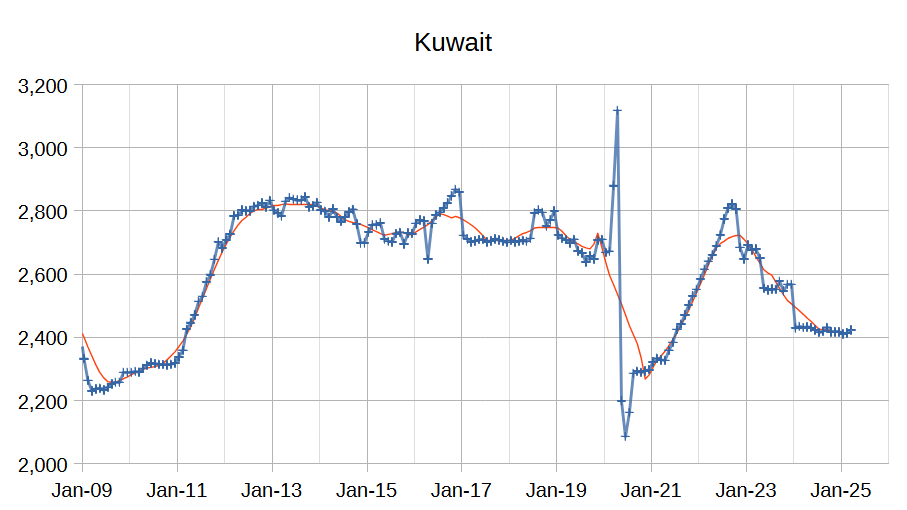

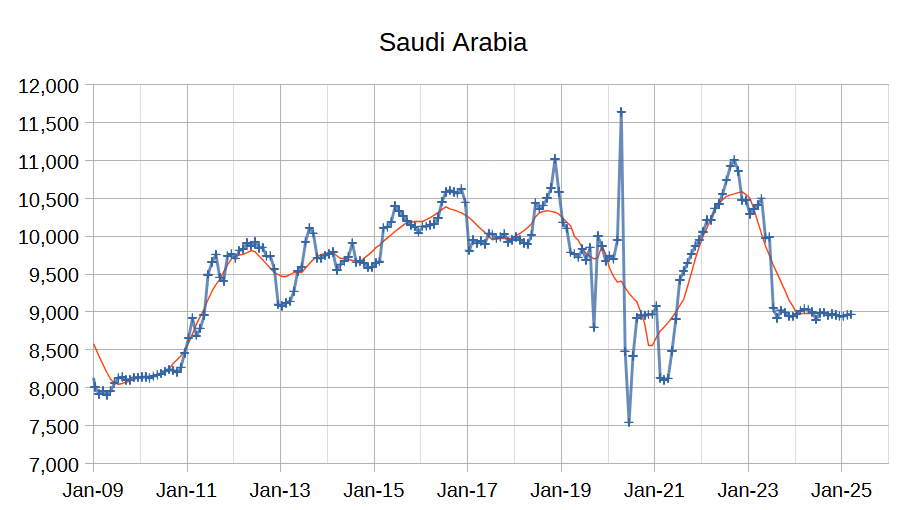
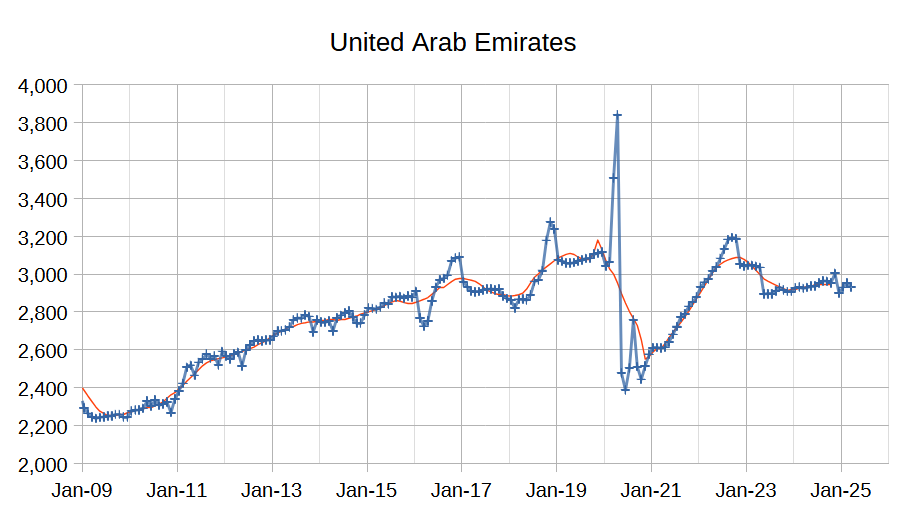
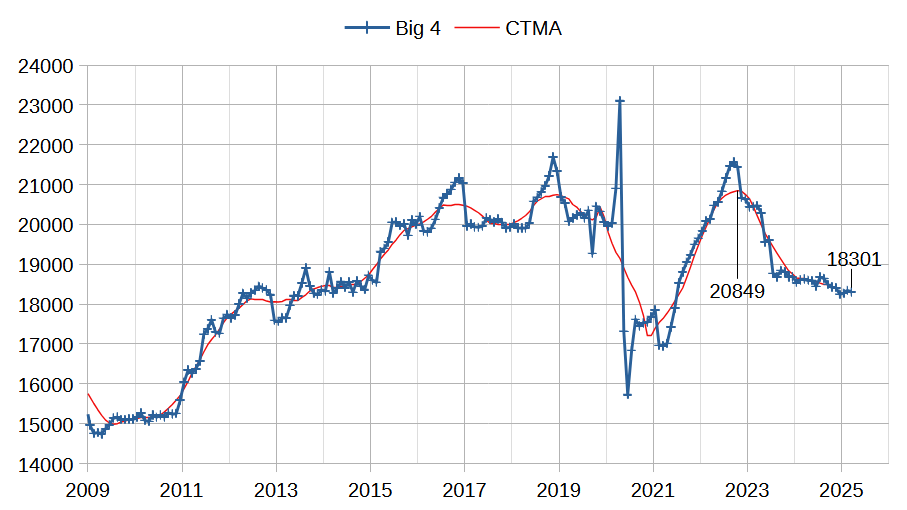
The chart above shows output from the Big 4 OPEC producers that are subject to output quotas (Saudi Arabia, UAE, Iraq, and Kuwait.) After the pandemic, Big 4 average output peaked in 2022 at a centered 12 month average (CTMA) of 20849 kb/d, crude output has been cut by 2548 kb/d relative to the 2022 CTMA peak to 18301 kb/d in March 2025. The Big 4 may have roughly 2548 kb/d of spare capacity when World demand calls for an increase in output.
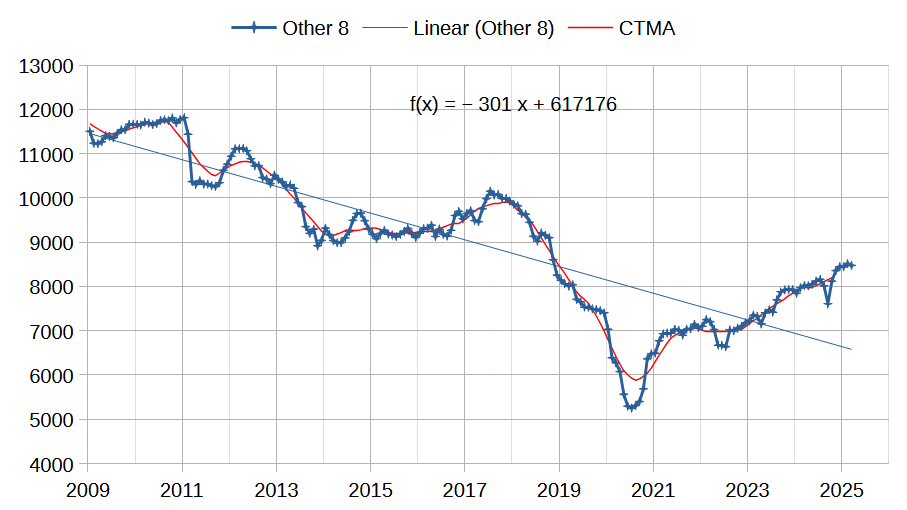
The chart above shows the trend in output for the OPEC 12 members that are not part of the big 4 producers. These Other 8 OPEC nations are producing at close to maximum capacity with the possible exception of Iran and Venezuela that are subject to US sanctions which limits their crude exports and their output. The long term trend is an annual decease of 301 kb/d since 2009, but since the pandemic their output has risen at an annual rate of 600 kb/d mostly due to increases in Venezuela and Iran as they have become more adept at avoiding US sanctions. I expect slower increase in the future for the OPEC Other 8 unless Iran and Venezuela see sanction relief.
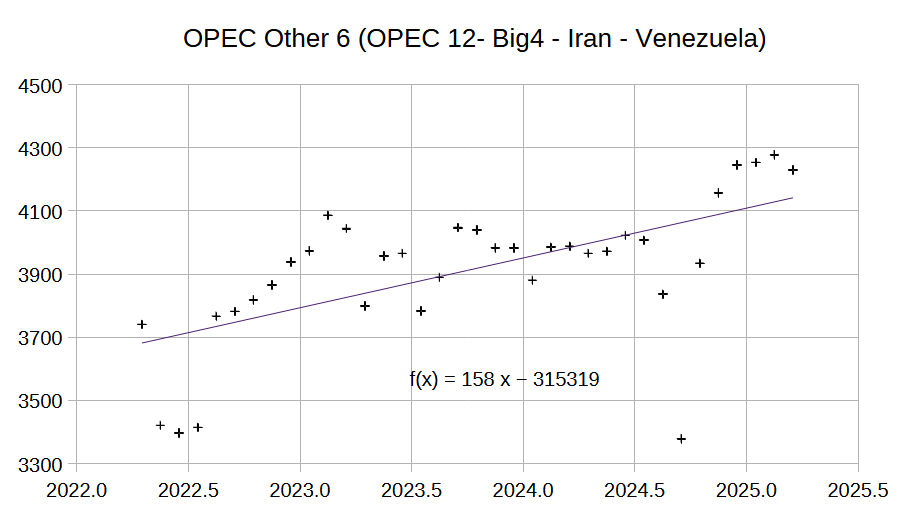
The chart above excludes Iran and Venezuela from the Other 8 OPEC grouping presented in the previous chart. Annual output growth is much slower at 158 kb/d. I believe this output growth is also likely to cease within a few years and Other 8 output may revert to the long term annual decline trend of 300 kb/d by 2027. I also expect OPEC Big 4 spare capacity could be used to keep OPEC 12 output on a plateau for about a decade (spare capacity of 2500 divided by 300 would be 8.3 years and it will be a few years until OPEC other 8 returns to the long term decline trend.)
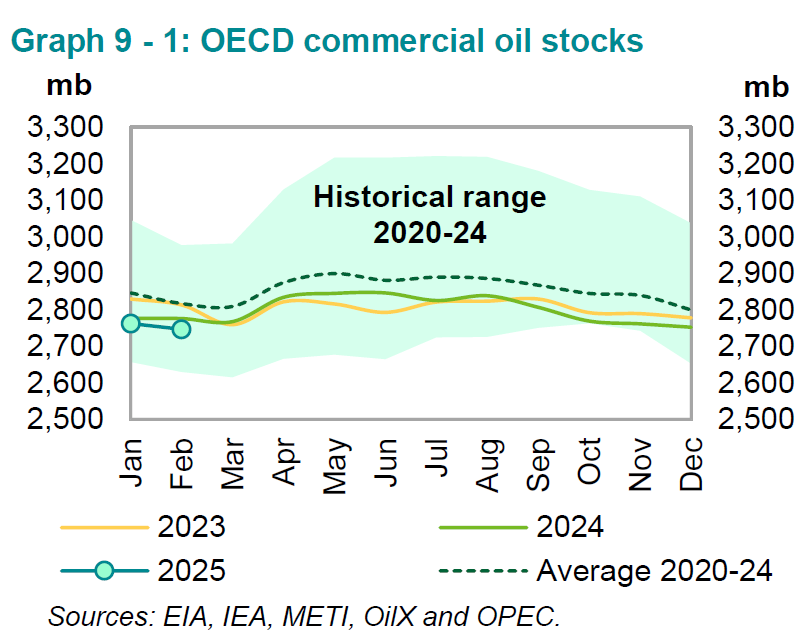
OECD commercial stocks remain well below the 5 year average, but oil prices remain low so this seems to be the new normal. It is also possible that the very high stock levels during the Pandemic may be skewing the average higher. On land commercial stocks have remained at 87 days of forward cover from 2022 to 2024 while oil on water has fallen from 34 days of forward cover in 2022 to 30 days in 2024, about a 3% decrease in total days of forward consumption for on land plus oil on water stocks over a two year stretch.
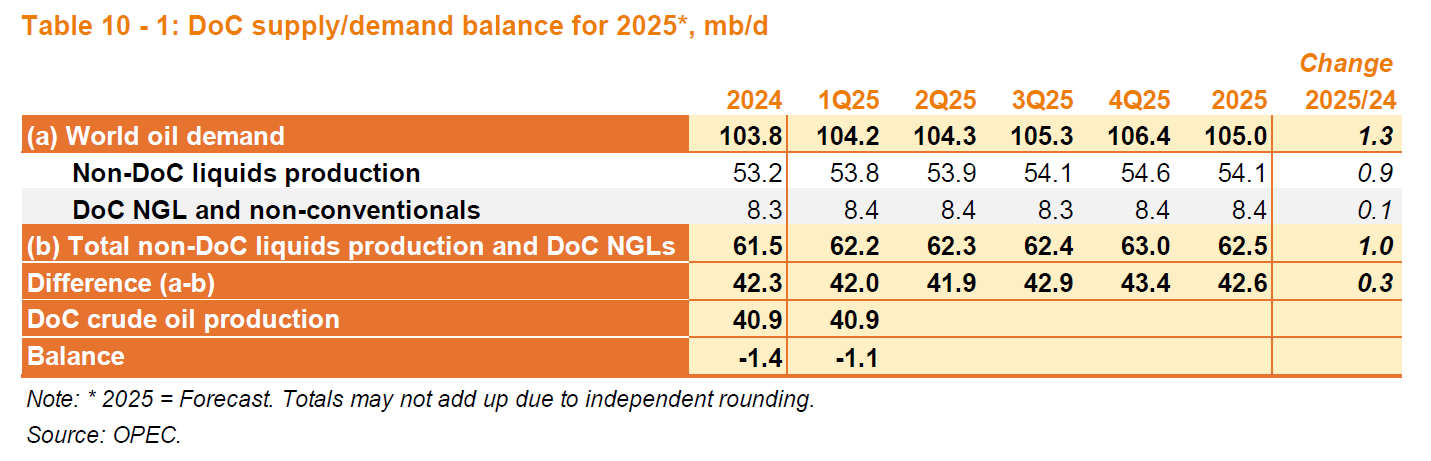
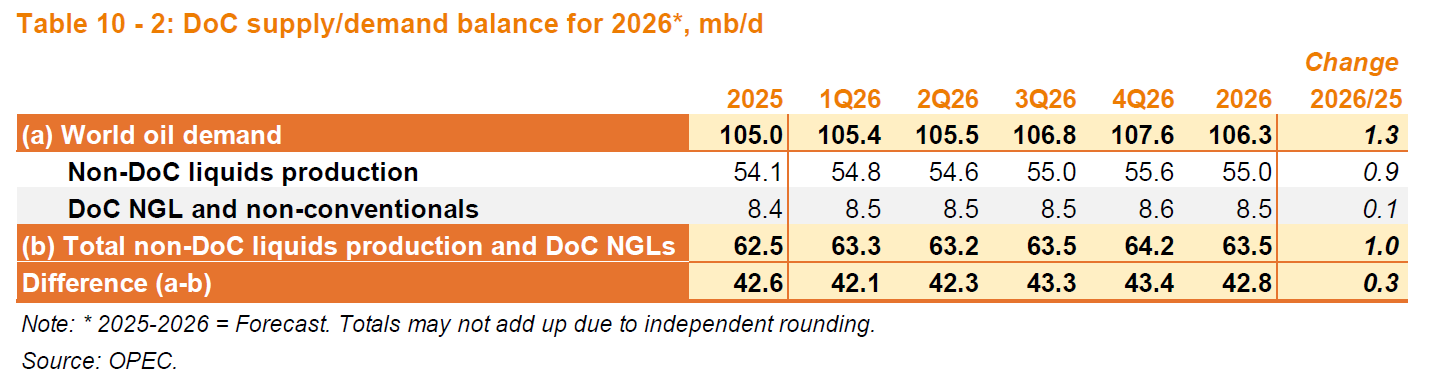
OPEC has reduced its demand estimates for World liquids in 2025 and 2026, but revised its 2024 demand estimate higher by 100 kb/d compared with last month where 2025 was 105.2 Mb/d and 2026 was 106.6 Mb/d compared with 105.0 and 106.3 Mb/d in 2025 and 2026 respectively in this Month’s MOMR.
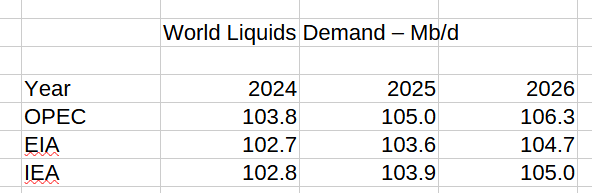
The chart above compares EIA and IEA estimates with OPEC estimates, IEA does not have a 2026 estimate I just added 0.3 Mb/d to the EIA estimate as that was the difference between the EIA and IEA estimates for 2025, but that is a WAG. The average of the OPEC and EIA estimates is 105.5 Mb/d in 2026, the average of the EIA and OPEC estimates in 2025 is 104.3, with the IEA estimate 0.4 Mb/d less than this average, using that as a guide we would get an EIA estimate of 105.5-0.4 or 105.1 Mb/d. In any case the OPEC forecast looks high, perhaps because their 2024 estimate is too high. In fact subtracting 1 Mb/d from the 2024 to 2026 estimates by OPEC results in a similar result as the IEA forecast.
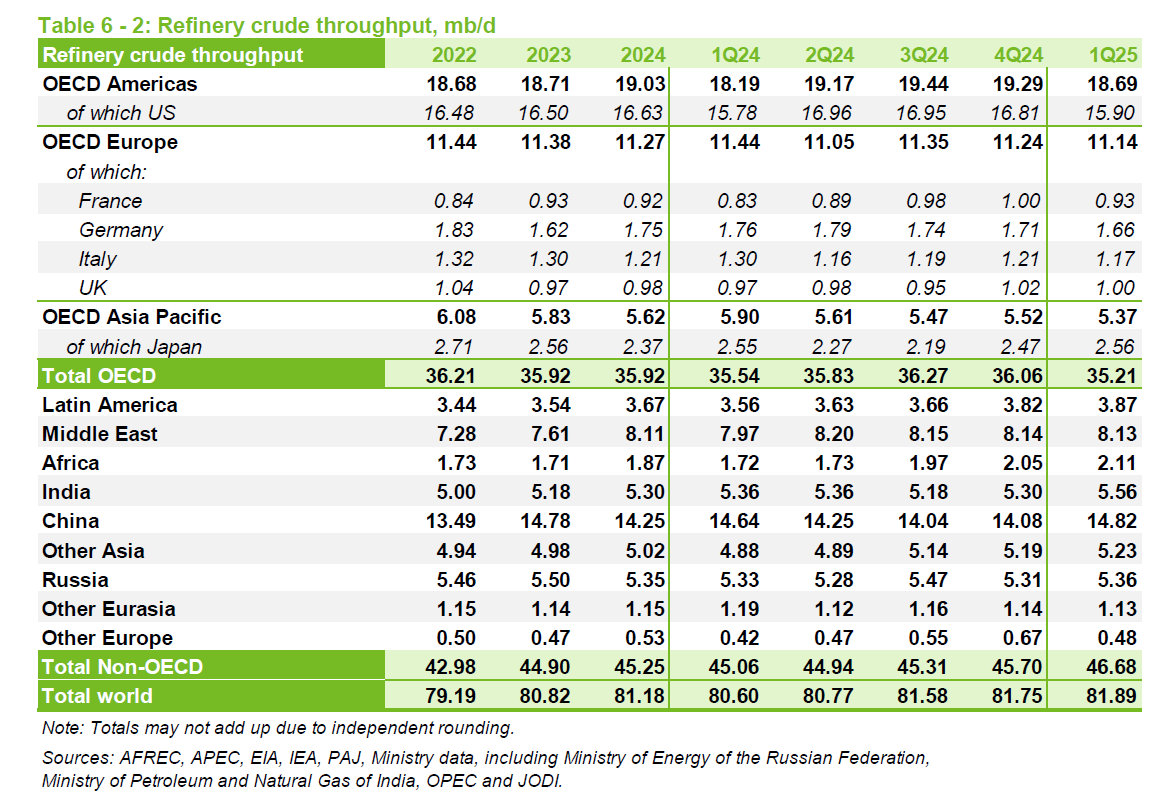
Refinery throughput is likely the best way to evaluate World C+C demand, from OPEC data the peak was 81.68 Mb/d in 2018 (some crude is burned directly for electric power in the Middle East). For the most recent 4 quarters the average refinery throughput was 81.5 Mb/d (higher than last month’s estimate by 0.1 Mb/d) so we may see a new peak this year unless there is a recession due to tariffs and economic turmoil.
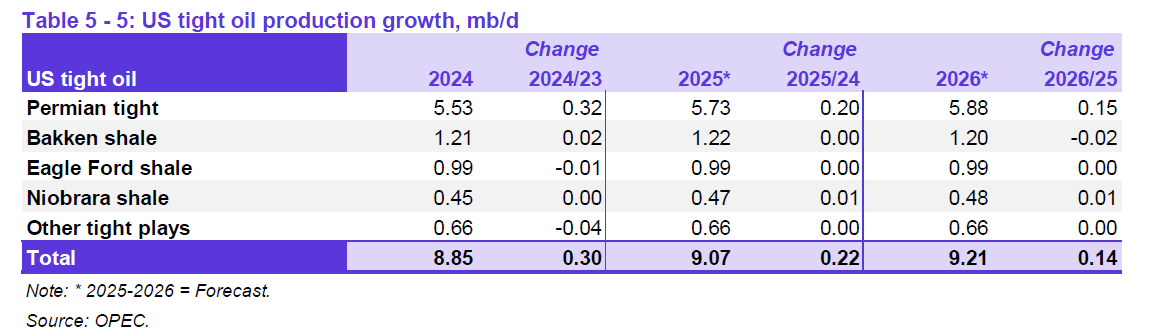
The tight oil forecast for the US in 2025 and 2026 has been revised lower by 30 kb/d in 2025 and 30 kb/d in 2026 compared to last month’s MOMR, the 2024 estimate is unchanged. Most of the increase comes from the Permian Basin.
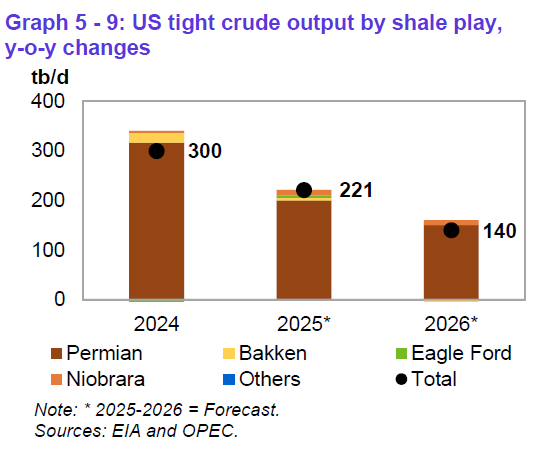
The chart above shows very clearly the slowing growth in US tight oil output and that most of the increase is Permian output.
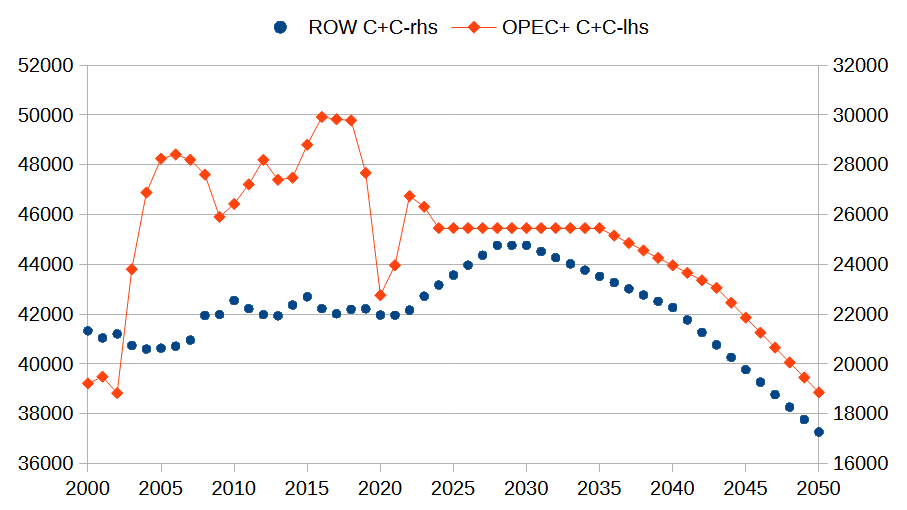
In my previous post I presented an oil shock model with roughly 2.2% annual decline in World C+C output from 2030 to 2050. In the chart above I present a scenario for future output from OPEC + which assumes a plateau in output from 2024 to 2036, then annual decline of 300 kb/d from 2037 to 2043 and annual decline of 600 kb/d from 2044 to 2050. I assume the OPEC Big 4 can offset declining output from the OPEC Other 8 up to 2036 and then Big 4 remains on a plateau while other 8 declines at 300 kb/d up to 2043 and then Big 4 declines at 300 kb/d after 2043. For the Rest of World (ROW) defined as World minus OPEC+ and US, output increases at an annual rate of 400 kb/d (2020-2024 average rate) up to 2028 and then declines at an annual rate of 250 kb/d starting in 2031 and then 500 kb/d starting in 2041.

The chart above shows the US scenario (right scale) and World scenario for C+C output. The US scenario uses the tight oil scenario presented in my previous post (URR=72 Gb) and assumes US non-tight C+C declines at an annual rate of 3% per year after 2024. The World scenario after 2024 is the sum of the OPEC+, ROW and US scenarios presented in the previous two charts. An Excel spreadsheet with this World scenario at link here.
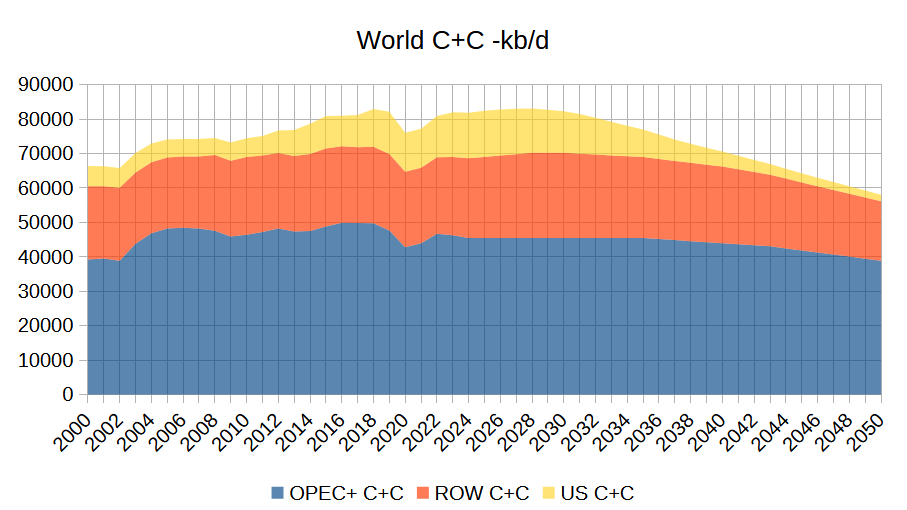
Same scenario different view. Peak is 2028 at 83.1 Mb/d.
The stark difference between a country where oil production peaked 25 years ago.
https://www.rac.co.uk/drive/advice/buying-and-selling-guides/the-top-10-most-popular-cars-in-the-uk/
And a country where oil production has been increasing for the last 15 years.
https://www.caranddriver.com/news/g60385784/bestselling-cars-2024/
Best selling car in the U.K. reaches 52 miles per gallon.
Best selling car in the U.S. if you can call it a car, does 20 miles per gallon.
Average UK petrol price is $6.78/US gallon, average US petrol price is $3.164/US gallon. UK has smarter fuel tax policy in my view.
Regardless if Ron was right about 2018/19 beeing the peak, which I think he was btw, there´s still very interesting things to observe going forwards. The major issue is if things politically will change calmly or violently, both ways have happend before. Resource avavilibility and sources matters a lot, probably really the key matter.
Regarding electricity, personally I´m in favour of hydro, wind and solar. Nuclear just leaves shit for “someoneelse” to care for it, for a very long time, in my view.
Still got beer….
Thanks Dennis!!!
Thanks Dennis!
I agree with the comments in the last thread about the great value in looking at these production forecasts normalized by population. Very helpful. I also think that some of the demographic work outside the UN (like you cite) seems more likely than the UN median that is quoted in the press so often.
In this context of resource availability on a per capita basis, I do think that factors such as economic turmoil and EV displacement are likely to have a tendency to flatten the peak towards a plateau.
IEA’s April 2024 forecast for STEPS scenario was for about 5 million barrels per day of reduced demand in 2030 due to EV adoption, with that growing to about 11 million barrels per day in 2035. The last update at our-world-in-data was also for April 2024 using 2023 data which showed 18% of global light duty vehicle sales as what they defined as EVs. This trend will have an impact.
T Hill
Obviously global oil production is a sum of all oil producing countries.
To really understand what will happen you have to look at each individual country to see where we are.
The United Kingdom peaked in 1999 at 2.6 million barrels per day and was a net exporter of over a million barrels per day. In less than 8 years it became a net importer.
https://www.ceicdata.com/en/indicator/united-kingdom/crude-oil-production
Australia was briefly self sufficient, now it hardly produces any oil, it has become another country dependent on imports.
https://www.ceicdata.com/en/indicator/australia/crude-oil-production
From memory in 1995 about 40 countries were or would be able to increase oil production, today that number is less than 10. All the others are in decline.
The main one being the United States, which single handedly prevented peak happening. It will peak by 2028. The decline rates of many post peak countries is high and the spare capacity of the few OPEC countries will be gone in a couple of years. From 2030 every single country will be in decline or unable to increase production. Decline rates could be as high as 5% in some years.
A world with no spare capacity will see massive fluctuations in oil prices. A hurricane in the Gulf, or a war somewhere, a terror attack on pipelines.
By 2028 if every single one of the 90 million cars sold were electric then things would still be difficult. Best prediction is for only 40 million and probably will not be that high. Best selling vehicle in America is the F150 it is the absolute opposite of what should be happening with only a few years to go.
Loads of Oil- Yes indeed on this general oil scenario.
So, for all the countries who aren’t going to be flush with oil in about 5 years do you foresee a rush by the citizenry to get EV ownership popping up later in this decade?
I think we may be setting up for a buying frenzy.
China in the pole position.
Way out front, in fact they have already lapped the field before the race (peak) has even begun.
Hickory
There are only 1.5 million electric cars out of 42 million vehicles in the U.K.
Yet travelling to see relatives at Christmas we saw a vey long queue of cars at a service station. Could not figure out why then someone said they were all electric cars trying to charge up.
A service station ceo said they can install chargers but the electric grid can’t supply the power because we have closed down all our coal power stations and the grid can’t transfer power from where the wind turbines are.
If we have these problems with 1.4 million vehicles think what it would be like with 20 million.
https://www.worksinprogress.news/p/the-breaking-of-britains-national
How many vehicles in the U.S. and how many electric vehicles?
Infrastructure like that take a couple of decades to upgrade.
We are in deep trouble
Nonetheless, it is clearly the direction the world is moving. In China sales of plug vehicles are now over 50% of the total each month, and this for a country that ranks 72nd in gdp/capita.
Apparently they can read the writing on the wall better than most.
And yes, most countries are very late to the game. Thats why I suggest there is a setup for an EV industry frenzy.
The EV industry in China is an extension of the coal industry. Coal is heavily used in the production of EV’s and solar panels.
EV’s are coal powered cars in China. Regardless if solar panels are used to produce electricity to power EV’s or if coal is directly burned to create electricity. It’s all an extension of their coal industry.
The Chinese aren’t escaping their demise due to lack of oil. They are accelerating their demise due to lack of coal by going all in on EV’s and solar panels not only for themselves but for most of the rest of the world as well.
Pakistan’s nice solar industry was built in factories in China for instance, using coal.
When the coal is gone there will be no EV and solar industry in China.
The Chinese will likely ramp up coal to liquids as the diesel supply contracts. Putting further stress on their coal supply.
What HHH is saying about China’s coal is in my view exactly right. According to Energy Institute’s latest report, China mining 93 EJ worth of coal and consumed 92 EJ’s worth. Its imports were 10 EJ, so these numbers do not match. It appears to me is that they are putting some of the imports into the column of production and perhaps have reached peak coal. By the way 10 EJ is larger than the entire US production that peaked in 2008 most likely because new power plants are by natural gas rather than coal. China’s imports in 2024 were 543 Mt and US production was 458 Mt. The heating values that I use is on the average 20 MJ/kg, as this seems to be the one used by Energy Institute
So I’m hearing that countries should refrain from facing the reality of peak oil in transportation because
-there are not enough charging stations deployed in the UK…the same UK that is an importer of oil, and
-China will run out of coal faster than if it had no EV industry…the same China who is an importer of oil, and who has the 4th largest reserves of coal in the world. And yes of course, coal is a fossil fuel like nat gas and oil….they are all in line to enter decline before too long.
Good job guys. Any more brilliant comments on the need to refrain from getting up off of our collective asses on making adaptations during the late plateau phase of peak oil, which yes we are now in.
Hickory,
You can be mad about reality all you want. Being mad about reality doesn’t change reality.
You can attack the comments all you want if it makes you feel better about it. Doesn’t make the comments any less true.
China is screwed. Living on borrowed time. And instead downsizing. They are going petal to the metal.
Sorry, solar power and EV’s aren’t going to be the saviors. The sooner you accept that reality the better off you’ll be.
Of course maybe you’re not mad. Maybe it’s fear that reeks from you instead of anger.
HHH,
Hickory is employing irony as a way of making a point, which is that you’re not being realistic. In part the irony is intended to convey that he thinks you’re being very unrealistic.
Hickory – did I capture your intent?
HHH
Solar might not be a great idea, but it will definitely suck a lot of the profit out of the fossil fuel industry.
This is already happening in Pakistan. They bought a lot of coal fired power plants from China 10-15 years ago, but the “load shedding” problem didn’t go away, mostly thanks to the fast growth of air conditioning.
Traditionally air conditioning is the electricity company’s best friend. (Those air conditioners are also Chinese imports, but that’s another story.) But Pakistan started massively importing solar panels in recent years.
A lot of this is rooftop solar, as satellite imagery of Hyderabad will show you. This is dampening demand for electricity from the grid. Now the utilities are having problems servicing their debt to the Chinese for their coal-fired power plants.
https://tribune.com.pk/story/2539779/heres-how-pakistan-quietly-became-worlds-biggest-solar-importer
I am constantly surprised at the comments along the lines of “solar and wind depend on fossil fuels and will disappear when fossil fuels are gone.” I consider that equivalent to saying that fossil fuels had to have disappeared when horses stopped being the main form of transportation.
It is clear that what we call civilization has been created on the back of fossil fuels. I think the dependence of “renewable” energy sources on ff is the least of our worries. You can make solar cells and windmills without ff. Can we make enough of them to maintain our current industrial lifestyle? Probably not.
T Hill,
It is possible that a transition to EVs will mitigate the declining C plus C output to some degree. A STEPS scenario would be enough, my scenario in 2035 is about 6000 kb/d below 2028 peak output. It reaches 11000 kb/d in 2039.
Chart with C+C per capita using Lutz population projection
Dennis
Do you think the United States could make do with 4 million barrels per day?
Two thirds of countries are increasing oil consumption and have raced past 3.5 barrels per person per year.
The U.S. will have to outbid other countries for what’s left
Loadsofoil,
Probably not, but there is lots of oil on World Market for sale, so the US will continue to import crude oil as it has done since 1944.
https://www.eia.gov/dnav/pet/pet_move_neti_a_epc0_IMN_mbblpd_a.htm
Dennis
It is all very well drawing graphs, but they do not reflect the political and psychological situation in the world once everyone knows that oil production will continue to fall year after year.
The electricity grids in many are very old and in no way fit to increase wind and solar very much.
https://www.worksinprogress.news/p/the-breaking-of-britains-national
Countries will do anything to get their hands on ever declining oil exports. You think India is just going to sit back and let THE U.S. take the oil it desperately needs?
At the moment the U.S. can do what it likes. Once oil production starts to fall in the U.S. and globally the oil exporting countries will have you by the proverbial.
They will not want dollars which are becoming toilet paper they will want useful things like food and weapons. They will need them to protect their countries from attack.
LOADSOFOIL
I transcribed and edited part of an interview with Eric Dollard about the electrical grid.
Interviewer: You just brought up the subject of the electrical-grid. I’d like to touch on that before we go to the dangers of what the power companies are doing; the way they’re rearranging the electrical system such that it makes us very vulnerable to EMP and other types of potential disasters that would come from a foreign source; but also bringing the danger right into our homes with the grounding system not being a true ground; that your refrigerator, the dishwasher, etc., all connected back to the substations where the high-voltage is.
Eric Dollard: The entire metallic structure of the nation’s power system is being bonded together; every transformer is being bypassed; all the way up to the grid tie-lines; so, the metal in your house is connected to all this metal; as a giant receiving antenna and the transients are hideous; they’re burning out people’s appliances; people are getting shocked and electrocuted.
Interviewer: You told of an incident of where just a cross-arm fire ended up severely shocking cattle.
Eric Dollard: Yes, and people’s pets are dying when they sleep outside next to the ground rod and the circuit-breaker box and the power companies are spending a fortune to rebuild the power-system in this configuration, that every old textbook said stay away from. It’s jamming-out all of my Earth receiving capabilities in Nevada. It’s taken on surreal proportions. There are literally millions of watts of stray electricity. Rivers of it flowing around in the Earth which completely overwhelms my telluric equipment. The interference is 10 million times stronger than the signal and you know being a third-generation electrical worker; starting from my grandfather and having an integral mental and archetypical connection to the infrastructure since I was an infant and to watch everything get turned inside-out; I mean it really affects me psychologically. It’s insane, it’s absolutely insane. So that was the objective of my last presentation; the history, theory, and practice of the electrical utility system; from an engineering, mathematics, and historical standpoint.
Interviewer: You have been talking about your ground receptacles sporadically responding to these transient-impulses that are sailing into your house because every single transformer is bypassed. Bring everyone up to speed.
Eric Dollard: My family in Pennsylvania are dairy farmers and they were milking their cows. They put their heads in head-locks and they feed them while they milk, and one day on the power-pole, which was quite a ways away, there was an incident that took place with the insulator, but instead of there being isolation, instead of there being protective ground, all the cows that were being milked took a very heavy shock twice and it brought them down to their knees and that wouldn’t have happened with the proper wiring and grounding and isolation. So, what that means potentially is that if you’re taking a bath and there’s an incident on the power pole or something like this; what would happen to the average person? People are going to get killed in their showers. They are getting killed and the power company engineers don’t know why. Well, it’s just basic electricity and electronics. You know, when you bypass the transformer and you use a neutral and Y-connections, with all the harmonics and transients, this is what you’re going to get.
Interviewer: I had mentioned yesterday that Congress had before them a bill to upgrade the power-grid to help avoid EMP’s or any other type of surge and it was voted down. That was in 2008 and it sounds like they’ve continued and taken [grid danger] to an even further extent. It is being forced and I don’t know exactly why.
Eric Dollard: Everybody asks me this, you know, what’s behind it. I have to conclude that it’s a nefarious conspiracy, for the lack of a better word, because it’s forcing the power companies to spend a lot of money. Here in Nevada, we have this Envy Energy, owned by Warren Buffett, and they are brutal in enforcing this. They are loathed by the entire state of Nevada. They are the most hostile, uncooperative utility company. They’re putting pressure on everybody to rip-out their Delta connections and get their hot-neutral into your facility. There’s no maintenance; no workmanship. When I was in the hospital, a lot of the nurses there have husbands who are engineers and they were telling me that their husbands are saying that this thing’s insane and they’re all going for early retirement.
I’d argue that between the Ukraine war and reciprocal tariffs from China that the US is already finding out that it can no longer just do what it likes. I expect this to accelerate in the coming years.
Hillcountry
That is beyond scary.
This is what happens when you get politicians who understand very little wanting to make a name for themselves.
All wind and solar companies should be forced to finance the storage of excess electricity either with batteries or conversion to hydrogen.
Politicians are always 5 years behind any problem.
Loadsofoil,
When the World realizes that peak oil has arrived, policies may change, exactly what those changes will be cannot be known in advance. The scenario is a guess at what might happen in the future, output might be higher or lower, impossible to foresee.
The assumptions have been stated clearly and they will be wrong. Download the spreadsheet and change the assumptions to whatever you like and present them if you wish.
If India wants more oil, they simply need to outbid the competition, in a free market prices will rise enough so that consumption will match production in the long term. Typically as prices rise supply will rise and demand will fall until they match.
Thanks DC.
I’m not sure if we’re comparing exactly the same numbers and scenarios, but they do look close.
If the IEA is correct, the demand destruction in 2035 from EV adoption will exceed the absolute decline in this production forecast and the per capita impact as well. 11MBD reduction is equivalent to 0,5 barrel per person per year in your chart above.
Add in a lot of smart people in the oil industry working to squeeze every bit they can out of this Faustian bargain and it seems like a good portion of impacts (other than environmental) will continue to get pushed down the road.
For most countries, and certainly for the US, it takes a complex global supply chain of materials and manufactured components to come up with a modern device such as those that become an EV (with batteries, motors, controllers, computers), or other base industrial items like transformers, turbines, compressors, etc.
If the functioning global supply chain and free-ish trade does not hold up then the EV implementation (not to mention things like nuclear power, grid upgrades, data centers, robotics) will come to be deployed much more slowly.
Laggard countries will be at risk, just as they have been at all other major economic transitions in history.
The risk in this case being that oil depletion happens quicker than adaptation measures have been deployed.
People have mentioned nuclear power as being a big part of the fossil fuel off ramp.
A few comments
-The tariff regime that is being crafted will result in a higher cost of build of what is already such an expensive project that the US has only commissioned a couple reactors in the last 35 years.
-Being realistic, it would take the US 10-20 years to plan and build a new full scale nuclear reactor.
-So far SMR’s (small modular reactors) are penciling out to be much more expensive/Mwh than are the full scale nuclear generating stations. Perhaps that price can come down with mass production, however there is no guarantee on that point and with inflation between now and actual time of scale deployment it might not be true at all.
-SMR’s may end up being useful as niche generators, but it won’t be inexpensive energy, and various components will be required to be sourced internationally indefinitely.
So far SMR’s (small modular reactors) are penciling out to be much more expensive/Mwh than are the full scale nuclear generating stations
Wow, that’s expensive. Do you happen to have a source for that?
There are many projections on the eventual price tag for SMR electricity but we really won’t know where it settles until a large centralized manufacturing production line is developed. That will take a long time, and who knows how many tens or hundreds of billions to get built.
I’d put enhanced geothermal in that bucket…we won’t know output electricity pricing until scale deployment is achieved. I think that the geothermal potential looks quicker, cheaper and less complex to deploy/run.
It takes time to do these things.
Do we have much time to get with it?
“Lollygaggers” refers to people who are fooling around, wasting time, or dawdling. It’s a slang term for individuals who are not actively engaged in work or responsibilities, but are instead idling away their time.
T Hill,
Took a quick look at announced Pledges scenario from IEA and in 2035 that scenario has Oil Consumption about 81% of 2023 level which for my scenario is about 15 Mb/d lower than 2023 (67 Mb/d), my scenario has World output at 77 Mb/d in 2035. The stated policies scenario has output at about 80 Mb/d in 2035, so in that case demand would not be met.
T Hill.
IEA WEO 2024 at link below
https://www.iea.org/reports/world-energy-outlook-2024
Chart below compares my World scenario with the Stated Policies Scenario (STEPS) and Announced Pledges Scenario (APS) for World Oil Supply.
Thank you DC.
Rig Report for the Week Ending April 25
Very little change in the rig count as the drillers face a low WTI price and assess their options.
– US Hz oil rigs were unchanged at 443.
– New Mexico rigs were unchanged at 90 while Texas dropped 1 rig to 232. Texas Permian was unchanged at 186.
– In New Mexico, both Eddy and Lea were unchanged at 45.
– In Texas, Midland and Martin were unchanged at 21 and 26 respectively. Midland is down 6 rigs from the beginning of the year, 27 to 21, and also down 6 over the last 5 weeks.
– Eagle Ford was unchanged at 41.
– NG Hz rigs added 1 to 82.
Frac Spread Report for the Week Ending April 25
The frac spread count rose by 5 to 210. It is also down 52 from one year ago and down by 36 spreads since October 11.
A Question: Do drillers/companies have to drill and complete wells even if the latest wells are slightly uneconomic. Here is the problem as I see it.
If the public oil company stops drilling, production will start to drop rapidly and the quarterly report to shareholders showing dropping production will not look good. So better to show a smaller profit but steady or rising production to try to maintain the share price. It is not clear for how long a company can do this, depends on debt, dividend, etc.
Ovi,
Producers tend to high-grade wells when the price is low. There are many locations that are economical at $60/bbl.
KDIMITROV: “There are many locations that are economical at $60/bbl.”
Shale? Can you be a bit more specific please? I’m not being argumentative, just inquisitive. Thanks.
Gerry,
Excellent question. It seems there are many E&P CEOs that are claiming that $50/bo will be a problem, when we look at quarterly reports for shale producers, there are many not doing well even at $65/bo. There may be a few spots that are profitable at $60/bo, but this is only known once the well is flowing, the idea that a producer knows in advance which wells will be the best wells is disproven by the productivity distribution. If this were known in advance only the best locations would be drilled, the fact is it is not known except in a very general way. Also there is very little room left for new wells in the highest productivity areas, fewer and fewer locations by the day.
Dennis/Gerry
“It seems there are many E&P CEOs that are claiming that $50/bo will be a problem”.
Maybe $50 is where the losses are so big that a company can’t afford to drill. That is the nub of my question. Maybe the drilling/completion loss at $60/b is not enough to put earnings into the negative column while still maintaining production/drilling at a good enough level to not scare off investors.
The financial strength of the company is critical in determining whether it can sustain drilling and completions at a small loss to keep up good appearances.
Ovi,
In the long run Oil at $62/bo will be a problem for most (and probably all tight oil producers). We will see it in the 10Q reports as time goes on.
Gerry,
I am just referring to a recent report from NOVI Labs, which says there are 65,000 locations in Permian/Bakken that have IRR of 25% at $60/bbl.
https://www.linkedin.com/pulse/wtis-near-60bbl-producers-really-feeling-squeeze-novi-labs-n6pme/?trackingId=z7w7FMHeR1i8KHsr9DDIHA%3D%3D
Various companies also claim that they have massive inventory that are profitable at <$60
Kdimitrov,
Consider chart below from https://www.dallasfed.org/research/surveys/des/2025/2501#tab-questions
click on chart for larger view.
They say nearly 65k, but lets say 65k is the right number and that 75% of these locations are in the Permian basin, that’s about 49k locations and recently about 490 wells per month were being completed in the Permian Basin. At that rate we are out of locations in 8 years. I am highly skeptical of the 65k estimate at under $60/b being profitable.
My analysis for the average 2022 Permian well suggests that at $60/b at the refinery gate, NGL price at $21/b and natural gas at $4/MCF at wellhead and Royalties and Severance Taxes at 28.5%, OPEX at about $27/bo (includes downhole maintenance), and real annual discount rate at 10%, the discounted net revenue over the life of the well is about $10.3 million, the well cost is likely about $12 million in 2024$ (all costs including land, well overhead, and plugging costs at end of life.) The well pays out at 97 months based on my analysis, from what oil industry experts have told me a well is not profitable unless it pays out at either 36 months (MS) or perhaps 60 months(SS). Nobody wants to drill a well that is expected to pay out at 99 months, that is a recipe for losing money.
Kdimitrov,
Maybe discuss at oilystuff.com where the view is a little different.
Dennis
Attached is an article indicating how these low prices will affect the big 5.
“HOUSTON (Reuters) -When Exxon Mobil and Chevron report first-quarter results this week, investors will be focused on how falling oil prices have increased the risk to dividends and share repurchases for the rest of 2025.
Chevron may reduce buybacks if weak oil prices persist, said analysts from four firms. The second-largest U.S. oil company previously guided annual share repurchases between $10 billion and $20 billion.
The company is in the process of cutting up to $3 billion in costs and laying off up to 8,000 employees.
UK-based BP may be forced to cut share buybacks as well, analysts said, which would increase pressure on its already underperforming shares.
Chevron requires a Brent price of $95 to cover dividends and buybacks compared with $88 for Exxon, according to RBC Capital Markets. Both companies can cover dividends alone with prices in the mid $50s.”
https://uk.finance.yahoo.com/news/investors-worry-big-oil-could-100531879.html
Ovi,
These very large companies may be ok, but smaller companies are not in as strong a position financially, the smaller companies may not be well positioned to survive a lower oil price environment.
Great stuff
https://www.oilystuff.com/forumstuff
The Novi estimate of 65k locations at under $60/b breakeven is bunk.
So, imagine what it will be like as the world realizes with a start that it’s undeniably at peak oil. It’s an inelastic commodity so soon thereafter the price of a barrel will begin to rise–maybe by as much as 20%.
As in anything that goes into short supply, there will be hoarders, and these will be in the form of high-dollar speculators. In fact, it wouldn’t surprise me to learn that a certain cabal of Texas oilmen had purchased a massive salt deposit along the Gulf Coast and hired a crew to carve out a cavern with a high-pressure hose, until they have a couple of hundred-million-barrel caverns identical to the ones used for the SPR—yes, the one that is half empty and may remain that way. They’ll hoard in China, that’s a given. And in just about any oil-starved place where they absolutely must have a certain amount of feedstock, say a place like Taiwan.
Eccentric billionaires will undoubtedly hoard aviation fuel: try telling a man who has accumulated a hundred-billion dollars that he can’t fly his jet from NYC to Aspen for a weekend skiing trip. Helium is absolutely necessary for MRI machines to work and there are thousands in the world. Helium is in very short supply, being found as a significant component of Natural Gas in a very localized part of the country: W. Oklahoma and SW Kansas close to the old Hugoton Oil Field. Helium is almost certainly going to be hoarded. So is ethane.
Graham Allison at the Kennedy School at Harvard has spent almost his whole adult life studying Thucydides’ Trap, using it as a jumping off place to debate day by day whether China and the U.S. are destined for war, or if they can work it out by negotiation. This year, particularly, negotiation has gone badly. Unless a dense, reliable fuel source is found quickly, it would pay both China and the U.S. to keep plenty of jet fuel and diesel on hand. Even if the initial combat zone is commanded by nuclear missile-loaded drones operated by kids in Beijing and the Pentagon, it’s eventually going to involve thousands of planes, tanks, ships, armed personnel carriers, trucks and the like. Human nature hasn’t changed much since the time of Thucydides, so I’m betting on conflict.
I’m doing this little exercise for a reason: to point out that there are factors, mostly due to the quirks and foibles of duplicitous men (and women), that will significantly influence the already stretched supply of oil when we let the news out we’ve hit the peak. Hoarding and warfare go together like horse and carriage.
Absolutely.
A second underappreciated factor is the breakdown of the trading system for oil. It is highly likely that trading blocks of nations will become much more heavily walled off. This recent example with Russia/Europe in regard to natural gas is just an appetizer.
Dennis
Graph 9-1 shows the OECD commercial oil stocks. However, the April MOMR in Table 11-3 also shows total OECD stocks. I assume this implies we do not know the Chinese and Russian stocks. That table also shows Oil on the Water. A lot of that must be Russian, US and OPEC oil.
Attached is a chart that shows total OECD stocks and Oil on Water. It seems that the biggest drop since January 2023 is Oil on Water, 187 Mb. I wonder if this big drop in Oil on Water is the reason OPEC + felt it could increase production in May and is now also considering another increase for June.
Ovi,
I think at the world level, the visibility for oil stocks is very unclear, note that OECD stocks are probably less than half of World Oil Stocks, given that less than half of World oil is consumed in the OECD (in 2023 OECD consumed about 44% of World Consumption of oil, based on Energy Institute data).
Dennis says
“If India wants more oil, they simply need to outbid the competition, in a free market prices will rise enough so that consumption will match production in the long term. Typically as prices rise supply will rise and demand will fall until they match.”
I say Dennis does not actually understand geological peak oil.
In the U.K. oil production started to decline in 1999, oil prices went from $40 a barrel to $140 yet oil production continued to fall. All the technology available was already being used, no price increase made any difference.
Hence in 2015 after 3 years of $100 plus oil, 50 plus oil producing countries continued their decline in production.
Loadsofoil,
Supply is higher at high prices than at low oil prices. I am talking about World Supply. Let’s give a concrete example. In 2018 the average World Price for Brent Oil was $89/b in 2024 US$ and World Supply of C plus C was 82.9 Mb/d and in 2020 the average price of Brent Crude in 2024$ was $50.85/b and World C plus C supply was 76 Mb/d. In 2024 the average annual price for Brent Crude was $80.52/b in 2024 US$ and World C plus C output was 81.8 Mb/d. The basic idea is that supply is relatively higher at a higher oil price even when we are past peak oil output so that at $100/b output will be higher than it would be at $50/bo. This is freshman level Econ 101, not hard to understand.
First, in 2020 there was a covid economic ‘slowdown’ (!) and thus a glut of oil hoping for a buyer.
Flip side of that, is that when demand is relatively high but does not exceed geological economic supply capacity, then there are higher oil prices – until supply catches up and slightly surpasses demand.
Equally, past peak (absent recession/depression) IF economic conditions demand a lot more oil, using up the OPEC+ ‘buffer’, then oil prices will be higher – but ONLY so long as geology can now supply.
If, past peak, demand is muted due to poor economic conditions – as is likely – then prices will be lower – within cost of production hard limits.
But once falling geological production capacity is insufficient to supply global economic demand at a price that various segments can afford, then we enter a very complicated economic ‘shock pulse’/stasis/segmented expansion period where interacting feedbacks and sub-system stalls and failures (economic and political) have hard to predict consequences and timelines.
Laurie,
After peak their will be a limit to how high output can rise, just pointing out that at $200/b the amount supplied will be greater than at $2/b.
Obviously prices were low in 2020 due to lack of demand due to Covid lock downs, I assume people know this, output was also lower. In 1980-1982 output was low due to a supply shock due to Iran/Iraq War which took a large chunk of World Supply off the market and prices spiked as supply could not meet demand, this brought on supply from Alaska, North Sea, and Gulf of Mexico as well as FSU.
In addition high prices reduced demand as oil stopped being used to produce electric power and higher fuel efficiency was attained in the vehicle fleet, though this took some time leading oil prices to fall (also the Iran/Iraq war ended). World Oil output did not return to the 1980 level until 1995 so it took time for World demand to recover to the 1980 level. The story has a lot of pieces, oil price is just a part of the story.
Very dishonest Dennis
Everyone here knows that 2020 was the lockdown. Supply had to be reduced because there was no demand. Price reflected the loss of demand. You can’t produce more oil than the system can absorb.
Can price bring on supply? Sure but it’s not some elementary calculation of supply and demand the way the army of dult economists explain things.
In 2013 oil was WTI $91.00 and inflation adjusted to 2025 $124.00 2018 was WTI $57.00 and inflation adjusted $73.00
Why didn’t you include that in your example? Cherry picking numbers to make your argument undermines your credibility maybe that’s why Mike is so mad.
Secondly high prices do not immediately result in higher production and you know that. It takes time to deploy CAPEX and bring new production online. But low oil prices can immediately reduce production because of necessity. Bringing production back from a low price event isn’t a supply demand function the production was already built.
Lastly to believe oil is headed to $100.00 is to avoid the last 4 year trend.
2022 $ 87.40 $94.93 second column is 2025 inflation
2023 $ 70.60 $73.59 adjusted
2024 $ 69.29 $71.88
2025 $ 65.00
Oil prices have been steadily declining so maybe the pie in the sky EIA and IEA that are so often quoted here have no clue what is going on.
Inflation adjusted oil today is 30% cheaper than 2022. If what you say is true production should have already fallen off a cliff. Inflation adjusted today’s prices are half of 2013!!! What you’re witnessing is the death of the industry which seems to be what everyone wants anyway but it isn’t being caused by EVs it’s being caused by geology.
JT,
I adjusted the Oil price for inflation in my example. I agree it takes time to bring on oil supply, but prices will affect decisions about whether to invest and bring on new supply.
My point is that price will affect World supply. nobody knows what future oil prices will be, they will depend on both supply and demand at any given price, the supply and demand functions are not fixed, they change over time. In 2022 prices were high due to supply disruptions due to the start of the Russian invasion of Ukraine and sanctions on Russian oil. In 2011 to 2014, OPEC reduced supply to keep prices high and in 2015 they increased output to take back market share and drove prices lower. Soon OPEC will take back control of oil prices and may be able to adjust output to achieve the prices they want.
As far as oil price trends, those change.
JT,
Real Brent Prices in 2024 US$. This shows that trends change from time to time. My expectation is that the peak in 2026-2030 may lead to a change in trend, but perhaps not if a lot of EVs are sold. I often point out that EIA, IEA, and OPEC predictions seem likely to be wrong, as is true of every scenario of the future.
Click on chart for larger view.
Dennis
Brent oil price in 1998 was $14 a barrel.
https://www.eia.gov/dnav/pet/hist/LeafHandler.ashx?n=PET&s=RBRTE&f=M
At that time the U.K. was producing over 3 million barrels per day total liquids.
12/ 13 years later oil prices were $110 to $125 per barrel, this massive increase in prices caused a relatively small uptick in production but nowhere near the 1999 high.
https://www.ukeiti.org/oil-gas
In 2018 despite oil prices being near triple 1998 levels total liquids production had fallen to less than a million barrels per day.
I think you are confusing areas where there are still major new discoveries to be made and areas where geological peak has occurred. In areas where there are new prospects, oil production can grow, but these are becoming very rare.
https://www.visualcapitalist.com/map-worlds-biggest-oil-discoveries-since-1868/
The list of countries past geological peak has been growing by almost one country each year over the past 30 years. In these countries oil price has been irrelevant. Ovi,s graphs show very clearly the downward trend of many of these countries. Once shale peaks and OPEC hit a plateau the weight of decline will make your head spin.
As Colin Campbell said economists just don’t get it.
Loadsofoil,
World supply of oil will be higher at high prices than it will be at lower prices. What do you think World Supply of Oil would be if the price was $1/b in 2025 US$? What do you think it would be if the price of Oil was $200/b in 2025 US$? My guess is that it would not be the same number, that is my only point.
Economists often use the assumption of ceteris parabis (Latin for all other things being equal) and this assumption is never correct.
Dennis
Being childish is unattractive and achieves nothing.
I have shown actual reality, the U.K. 3 million barrels per day when oil was $14 per barrel. In 2018 oil prices were 300% higher yet oil production had fallen by 2/3.
Most of the oil in the world is profitable at $60 , so nobody has been waiting to produce what they have.
https://en.wikipedia.org/wiki/Price_of_oil#/media/File:Oil_production_cost_per_barrel,_grouped_by_country._(2015).png
Most countries are already using horizontal drilling, water flooding, co2 etc. these techniques extract most of what can be extracted. What is left at $60 per barrel is tiny.
You see the list of the greatest oil fields. What is the biggest oil field discovered in the last 10 years?
Loadsofoil,
There are a lot of resources which have been discovered but not yet developed, some of those will only be developed at higher oil prices because cost of production is high, my scenarios are based on discovered resources. The size of individual fields discovered is less important than the resources yet to be produced (these are on the order of 1500 Gb that are economically recoverable resources and perhaps more if oil prices are high.) Also my scenario assumes oil prices will be between $70 and $100/b in 2024 US$ in the future (2025-2035).
I agree not much will be produced at $60/bo, but at $80/b or $100/b more will be profitable to produce (that’s why oil price matters).
Chart below with World C plus C output (right vertical axis) and real Brent Price (left axis) in 2024 $, annual averages.
In the first case oil would be uneconomic to produce for export sale, and so global supply would localised and minimal;
and in the second case oil would find very little market anywhere (well, maybe Luxemburg), and so marginally economic for sale that global supply would be minimal.
Laurie,
If oil prices were $2/bo, this implies that supply is very high relative to demand and there would be plenty of oil for export in my view as it implies excess supply on the World Market.
If oil was $200/b, I agree demand would be lower than if the price was $100/bo, but keep in mind that in 2011 the average price of Brent was $140/b in 2024$, $200/b is only 43% higher than $140/b, we would probably see fewer ICEVs sold and smaller vehicles sold in many places and perhaps fewer trips by air. Supply will be higher than it would have been at $60/bo as many oil projects would be profitable at $200/b that would not have been at the lower price.
I doubt oil prices will be at either of these levels. In chart below is the EIA’s reference Brent real oil price case for 2025-2050 and historical real Brent Prices in 2024 US$/b. The average Brent Oil price from 2025 to 2050 for this scenario is about $84/bo in 2024 US$.
Actual future oil price is of course unknown, but the EIA reference scenario seems a reasonable guess.
My apologies.
I made a mistake on chart above in my spreadsheet, corrected chart below (data from 1990 to 2024 incorrect in previous chart).
Loads of oil,
Updated Global supply curve from October 2024
https://oilprice.com/Energy/Crude-Oil/Oil-Production-Costs-Surge-But-Shale-Projects-Remain-Profitable.html
If this is accurate (not clear that it is) there are a lot of resources with breakeven cost less than $60/b. Note that producers need to do better than breakeven. Let’s say they need 25% profits, then an oil price of $60/b implies a needed breakeven cost of $48/b, probably only about 1200 Gb of resources profitable at that price level, oil prices at $100/b would allow more of the resource to be produced profitably, roughly 1400 Gb, assuming no new discoveries or reserve growth.
Breakeven prices in Texas tight oi basins
https://www.tgs.com/weekly-spotlight/2024-09-16
Another estimate of breakeven costs
https://oilprice.com/Energy/Energy-General/Oil-Majors-Pursue-Projects-with-30-Breakeven.html
Dennis
Exactly draw a line from the $60 mark and the vast majority of global oil is profitable.
Higher oil prices will make only a tiny difference when most oil fields will be in decline by 2032
Loadsofoil,
Breakeven is not the same as profitable. Profits are a matter of opportunity cost and relative risk.
If I can take my money and invest in a basket of large company stocks and earn a real long term rate of return of 8% with far less risk than investing in oil, I will demand at least a 25% profit on an oil investment, or perhaps even 35% to make the higher risk worthwhile so a $60/bo break even would require a price of $80/b to make the investment worth while.
In addition, I question these breakeven numbers as the tight oil estimate suggests a $45/bo breakeven for US tight oil in 2024 when in fact it would be more like 75 or 85 per barrel in the Permian Basin which is the highest profit area for US tight oil. I think the cost curve is wrong.
Oil at $60/b will lead to lower supply and higher oil prices will be needed for projects to reach FID in my opinion. Time will tell.
Also keep in mind that cost of extraction may rise faster than the rate of inflation over time.
Dennis
The graph that you posted has a breakeven cost of $50 for over 70% of the resources.
The vast majority of oil extracted is done by massive companies like Aramco, Shell, BP. Share holders in oil are doing pretty well.
https://www.globaljustice.org.uk/news/bp-and-shells-profits-in-2024-more-than-double-the-amount-of-uks-climate-finance-commitments/
https://www.worldoil.com/news/2025/3/31/petrochina-posts-record-profits-following-rise-in-oil-and-gas-production/
The vast majority of oil is profitable at $70 and is being extracted at a rate of 81 million barrels per day. Anything that needs $80 plus is because it is difficult, small or slow to get out.
The losers in the industry are a minority.
Loadsofoil,
Resources will deplete and the price is determined at the margin, so if the World needs another barrel of oil the cost to produce that barrel will determine the price, if oil producers do not expect to earn a profit on high cost barrels they will not invest their money to produce those barrels.
The estimates for the cost to produce a barrel of oil are often not accurate. For the average 2024 Permian well with Oil with Oil price at $71/b, NGL at $25/b, and natural Gas at $3/MCF, with the nominal annual discount rate at 12.5% the discounted net revenue over the life of the well would barely cover the cost of the well. The well would pay out at 60 months and a $12 million investment returns only $3 million over 15 years an annual rate of return of only 1.5%. Not a great investment considering the considerable risk.
Dennis
“ The price is determined at the margin”
Yes it is but that is not what we are talking about. I have clearly shown that the vast majority of oil is found in good reservoirs which are profitable at $50 to $70 a barrel.
You said there are large reserves that have been found that are not being exploited because the price is not high enough. Where?
The only large ones I can think of are due to political corruption and wars.
Loadsofoil,
There are some resources that are not proved producing reserves and that have not yet been fully developed. For conventional crude plus condensate resources about 1472 Gb have been produced (by end of 2024) and about 480 Gb proved producing reserves remain to be produced, another 848 Gb of C plus C resources remain to be developed.
I have not said they all have not been developed because prices aren’t high enough, but no doubt there will be some of them where this is the case in deep water offshore or in the Arctic. The point was that new discoveries are not so important as discovered resources that are yet to be developed.
You have not shown that most of the oil is profitable at $50 to $70 per barrel, you have assumed the Rystad estimate (or the estimate from 2015 you posted earlier) is correct.
Note that the Rystad estimate has tight oil breakeven at $45/bo (average), that is at $25/b too low (it is more because the Permian is the lowest cost of all tight oil basins at $71/b for breakeven, which MS would tell you is too low, his estimate is over $90/b) So it may be that all of the Rystad breakeven estimates are 37% too low.
We are talking about oil price, which is determined at the margin, the highest cost barrels will determine equilibrium price, this is the way markets work.
Prices for Brent crude in 2024$ have averaged close to $82/bo from 2021 to 2024, costs to extract oil may continue to rise as resources deplete and as other materials (steel and other inputs to the process) become more expensive over time. The low oil prices in the 2015-2017 period (Brent at $58/b in 2024$) was due to OPEC oversupply to try to take market share back from US tight oil producers. US tight oil producers did not see a lot of profits during this period. Prior to that we had a high price period from 2007 to 2014 where Brent averaged $120/b in 2024$, those high prices allowed the tight oil boom in the US.
Loadsofoil,
In OPEC plus nations output is being held back and in some of those nations there are resources which have not been developed fully consider chart below where World proved(1P) reserves are about 450 Gb and OPEC plus Russia proved reserves are about 290 Gb. Cost to produce other resources that are not part of 1P reserves may not really be known. Note that proved developed producing reserves would be somewhat less than 1P (aka proved) reserves.
Oil prices will fluctuate with demand and scarcity within geologic limits—-that’s what I believe I’m hearing everyone say. And of course, if it becomes patently obvious to the world community that we have reached a definite geologic constraint, then oil prices would rise most of all, at least in the face of increasing demand.
The problem with more precise analysis is that the oil and gas industry has traditionally been influenced more by canards than truth. There are those who will say that the shale industry has told more lies, exaggerated more, bragged more about reserves, but I doubt that. From lore I heard from my grandfather, the sign that went up declaring Tulsa to be the Natural Gas Capital of the World was wildly overboard. From history, the E. Texas oilfield was like the gold rush. During the last decade, some in the shale industry have spun outlandish tales, to sell leaseholds at outrageous prices. So now, just as in other times in history, we’re in a bit of a quandary. Novi Labs says without any real evidence (except AI is now used in the fairy tale) that there are some 65,000 drilling sites left that would be profitable at $60 oil. With the inflated price of everything used in the oil field, esp treated tubular steel, I would have to see the figures to believe it.
Number one, they’d be making some pretty grand assumptions about EUR’s, which have been steadily declining despite laterals out to yonder. I suppose they’re doing that based on neighboring wells, but everyone knows that productivity can vary drastically—especially in the Bakken where a pinch-out can form an oil trap that catches migratory long-chain oil in dolostones. And there are big anticlines in the Bakken, as well. In places, the thinnest shale benches produce the most oil. I don’t have anything in the Permian to give me any real-world experience but I can tell you that in the Bakken productivity wobbles all over the place. And number two, they’d be making some equally untenable assumptions about a volatile time running a certain course.
I have a gut feeling that there is enough variation in geology, and enough uncertainty in governmental policy, to make $60 oil a very uncertain marker. When you compare the price of oil today to other commodities that are much less restricted and difficult to access, it is one of the few bargains in today’s world. And yet it’s being squandered at warp speed. Since returns are so front-end weighted, if you invest $10MM and hit a dip in prices down to $60 for the IP180, you’re not likely to pay out your well, no matter where you are.
Longer term real oil price in 2023 US$/b and World C plus C output. Price is Brent from 1984 to 2024 and Arabian light at Ras Tanura from 1968-1983.
Oil prices pretty much maps global economic growth, with special influence by the economic trajectory of high oil consumers (e.g. USA/Volker). Prices also map geopolitical effects. The Iranian revolution in 1977, plus the 1977 OPEC 10-15% oil price increase, and so on. Thereafter cheap oil coiled the world for growth. Cheap interest rates in US, China joined the WTO, emerging markets ramping up, demand, demand, demand.
Come 2008 US shale is starting to feel its oats, oil production increases substantially, OPEC dropped prices to bust the US (and failed).
Apart from geopolitics, supply has not been a factor.
If Dennis is right, and he likely is, in +/- 10 years time will be THE factor.
Then the interplay of price, pulses of economic activity, and geopolitics makes it a difficult to predict teeter-totter fight of many rounds of uncertain duration.
But we do know how it finally ends.
Laurie,
On the macro scale prices seem not to matter, economic activity is what correlates best with oil consumption, on the microeconomic scale for an individual producer prices are an important factor in determining profits. The Iranian revolution in 1979 coincided with a fall in Iranian output and a spike in oil prices which was further impacted by the Iran/Iraq War which began in 1980. These events were the main reason for the price spike in 1979-1982 as about 5.4 Mb/d was taken off the World Market over 3 years (roughly 10% of World output in 1978).
I have just posted a post over on the “Non Petroleum” page. The post does mention “peak oil” but I felt it more appropriate over there. It is Titled” 10 Reasons Our Civilization Will Soon Collapse
I would like your opinion if you are interested in the subject.
NOTE: I would like your opinion even if it is: Sorry Ron, this subject just doesn’t interest me.
Paul wrote: In short:👉 Intersectionality multiplies complexity and makes single-issue solutions ineffective.
I agree. But so far I haven’t seen a single issue solution. I have not seen a multiple issue solution. That’s the point of the whole issue. There is no solution. End of story.
Ron,
I agree multiple problems interact, sometimes unpredictably.
But…fossil fuels are central to most of these problems. They cause resource wars. They create killer smog. They create climate change, which in turn creates refugees.
Paul’s Venn diagram seems like a very good illustration of the problems caused by FF, and the enormous value of transition away from FF to solve most of them.
Yea true, before FFs humans were living in Utopia.
FF has been very useful & very beneficial in some ways, and it would have been even better if we had used it in moderation and replaced it as quickly as we could.
Instead we’ve used it too long and in excessive quantities, for very marginal benefit while the side effects and hidden costs have become very obvious.
2,000 years ago we didn’t know to use FF. 200 years ago we didn’t know how to use wind & solar like we do now.
Things change and better things replace the old.
Shallow Sand
If you are around and have time I would like to know your opinion as to if this company is currently profitable.
https://www.shalexp.com/reach-oil-and-gas-company-inc
Thanks
I don’t know anything about this company. The company has a website, but I don’t see much more online.
Thanks Shallow.
Just thought there might be some details of well production water cut etc on your subscription sites.
World C+C production since 1973.
What you see is a seven year plateau, 2018 through 2024, disguised by the covid interruption.
It may or may not break the 2018 peak. But if it does, it will not be by much. The important thing is that we are on the peak plateau today!
Yup, we are now in the second half of the plateau phase
[World C C between 79 and 84 Mbpd],
which began at 2014.
Have you seen the Diesel Supply figures over the last few years?
Shortages in Africa at the moment
Truthfully, I have paid no attention to them. What’s your point?
Perhaps changing APIs (worldwide) is showing? As well as export volumes?
I think the lighter hydrocarbons in the form of LNG/CNG, or electricity, will have to take Diesels current superior place in economical/availibility/utility means at some point, but Diesel is still a very powerful entity.
So the fracking bonanza will maybe not power the world by current means, like flaring, but maybe some of the others?
I found this graph very interesting.
Since world C+C peaked in 2018:
22 nations have increased production.
63 nations have decreased production.
6 nations were unchanged.
The losers actually peaked in 2016, but the combined peak was in 2018.
Ron,
If we take out 8 nations from the World (KSA, US, UAE, Russia, Iraq, Iran, Kuwait, and Venezuela) US and UAE have gained since 2018 and the other 6 nations have been losers either due to quotas or US sanctions. When Gainers and Losers are grouped in this way, the Gainers nearly offset the losers with World minus the 8 nations mentioned having an annual decrease of 100 kb/d on average from 2015 to 2024.
Without the shale revolution, we are 228,000 barrels per day below our 2005 level, (Arrow) and 3,516,000 bp/d below the 2018 peak.
That is a 20-year plateau!
Dennis needs to take a good long look at this graph.
From 1985 to 2005 the world increased oil production by 25 million barrels per day. This was done when oil prices were, in today’s money between $35 and $50 per barrel.
Oil prices in the last 20 years have been over double that yet the increase in production excluding shale has been zero. If you include OPEC spare capacity and use a generous number of 3 million barrels that is still seriously concerning considering the price increase.
Add in shale and global oil production in the last 20 years has not managed half the increase attained from 1985 to 2005. This with oil prices for some year being triple the 1985 to 2005 average.
My family’s company made money at $15 or more per BO during the 1980’s and 1990’s.
We need over $50 now to make money.
Go back and compare public company 10K from the 1980’s and 1990’s to those from 2024. You will see the same thing.
A lot more wells that make a lot less production.
I like to look at Parshall in the Bakken, which was touted as the most profitable and prolific in the Bakken back in its heyday. Lots of SI wells and many that are now stripper wells.
Think about the profitability of a deep, horizontal shale oil well producing less than 15 BOPD.
Parshall isn’t even 20 years old yet. Most of those big wells EOG drilled were completed in 2008.
Shallow Sand,
Thanks.
For some perspective the real spot price of WTI from 1986 to 1999 averaged $43/b in 2024$ with prices ranging from a low of $27.75/b in 1998 to a high of $59/b in 1990 (again in 2024$). Nominal prices for WTI spot price ranged from $14.42/b in 1998 to $24.53/b in 1990.
So in 2024$ under $30/b was a problem back in the 80s and 90s, today under $50 is a problem. Probably costs to extract oil have risen faster than the overall rate of inflation and maybe taxes and royalties are higher as well today than 35 years ago.
Dennis. Although we are in a low decline field, there still is decline.
The average oil production from a well in our field is just about 50% of what it was in 1990. So not including wells completed post 1990.
So when you are producing 1/2 the oil, LOE is double, all else being equal.
Of course, it’s never exactly equal at anytime. But hope this makes sense.
Kind of frustrating USA doesn’t have better public data on oil production. Oh well.
BTW, where is 2/2025 EIA field production? Isn’t it due today?
Shallow sand,
Thanks, makes sense that LOE would go up for low volume wells, I often miss these obvious things (obvious to someone who knows the business, which I do not).
I expect Ovi will report something later today, I leave that to him.
I checked again just now and it hasn’t been released yet. Usually posted by now.
Shallow sand,
In the future search for 914 at EIA, that report is released earlier than PSM.
https://www.eia.gov/petroleum/production/
https://www.eia.gov/petroleum/supply/monthly/
Loadsofoil,
I am not arguing that only prices matter, simply that they do matter. US tight oil would not have been developed without the high oil prices that occurred from 2006 to 2014. Also the geological limits of the oil resource which the World started approaching around 2005 was part of the reason that World Oil prices rose along with rapid economic development in China from 2000 to 2010 which led to a large increase in World demand for Oil. I expect World output will peak (or perhaps it has already) due to these geological limits, but price will still have some affect on the level of output, the two are not mutually exclusive.
Dennis
Price matters only up to a certain point. If oil prices are $40 a barrel then a large part of the industry will lose money. If oil price is $60 then some companies will shut some poor performing wells. Others may delay producing some new discoveries. Most production will make money.
At $70 most oil other than arctic and ultra deep water are sure bets. At $80 to $90 all reasonable discoveries will make money. Sources that are only profitable above $100 are small and will make no impact on global production.
The decline rate will hit 4% no matter what the price is after $90.
https://data.ukedc.rl.ac.uk/cgi-bin/data_browser/browse/edc/publications/working_paper/UKERC_Review_of_Evidence_on_Global_Oil_Depletion-Technical_Report_4-Decline_rates_and_depletion_rates.pdf
An old study but just as relevant today.
I think there are huge amounts of Shale world wide that could be developed at 100$+ oil. They are not in the focus now and you will only look after them when prices are high enough over longer time.
It’s the same as with Lithium – before car batteries Chile was the only reasonable source. Now you find the stuff everywhere – including the land Putin wants from the Ukraine.
100$+ oil will fasten the transition to other energies. And even when it’s only the low hanging fruit of nat gas / butane which is more common and has more untapped big findings.
In 2005 every taxi in Bulgaria was driving on butane because it was so much cheaper than gas. The conversion was done by makeshift local garages.
True, and while $100 oil is pricier than we are accustomed to it is still a great bargain for what you get. The higher price will enable a fat tail of future production, and at the same time makes EV’s for the light transport sector look like an outright competitive win.
For those who cherish oil product availability the presence of the EV offramp for transportation should be seen as great asset in this post peak period, allowing oil product supply to last further out into the future.
Eulenspiegel
Oil price was over $100 for 2 years but shale hardly exits outside of the U.S. which has ideal geology for shale.
Hickory we pay the equivalent of $230 per barrel of oil yet ice make up 80% of sales.
Loadsofoil,
People are slow to change their behavior, higher taxes on fuel is a sensible approach to speeding the transition which would make sense in the US. Not sure what makes sense in the UK as I don’t live there. Charging infrastructure will improve over time. Tesla Superchargers work great in the US and at least here many car manufacturers have access to them. Don’t know if that’s true in the UK.
Loadsofoil,
Check out oilystuff.com, experts think your cost estimates are crap. Maybe if you add 30 to 40 $/b to your various estimates you would be close to the actual breakeven for a new investment to payout. You need to consider full cycle costs. No decline rates are not likely to be 4%, resources will continue to be developed which will offset some of the decline, the decline rate is likely to be about 2% up to 2050 and may increase to 3% in the future, this will depend in part on demand and the price of oil. If oil prices are low annual decline rates might be 4%. You fail to take account of new investment offsetting decline. The 4.1% decline estimate in that paper is for all producing reserves with no new investment. It is quite unlikely that all new investment in oil production will stop unless oil prices fall to under $20/bo (which is not likely long term.)
Last paragraph of section of the 2009 paper on decline rates,
In summary, the global average decline rate of post-peak fields is at least 6%/year and the corresponding overall decline rate is at least 4%/year. Both are on an upward trend as more giant fields enter decline, as production shifts towards smaller, younger and offshore fields and as changing production methods lead to more rapid post-peak decline. Significant investment is needed simply to offset the underlying natural decline rates and if this is not forthcoming (for example, as a result of the economic slowdown) decline rates will increase. While future trends in decline rates are difficult to forecast, a case could be made that the IEA’s assumptions are optimistic. If so, more than two thirds of current crude oil production capacity will need to be replaced by 2030, simply to keep production constant. Given the long-term decline in new discoveries (Figure 2.8), this will present a major challenge even if ‘above-ground’ conditions prove favourable.
The overall decline rate of 4% assumes no new investment to develop fallow or newly discovered resources, obviously we did not see 4% decline in World C plus C output from 2008 to 2024, nor are we likely to see this in the future. My scenario for World Oil has a URR of about 2960 Gb and annual decline rate from 2030 to 2294 averages about 2.66% per year. From 2031 to 2050 the average annual rate of decline for World C plus C is about 2.1%.
Dennis
That’s correct and we all know there have been new discoveries over the last 20 years. There has also been vast amounts of infill drilling, horizontal drilling, water flooding, co2 and chemical injection.
With all those technical advances, conventional oil has increased by maybe 3 million barrels per day if you include OPEC spare capacity. A dramatic decline from the 25 million barrels per day increase in the previous 20 years.
There are already many countries with decline rates of 3 or 4% despite employing all these technologies.
Just one example
https://www.ceicdata.com/en/indicator/australia/crude-oil-production
The ability of oil companies to find oil has vastly improved over the last 50 years.
This is the result.
https://www.researchgate.net/figure/World-Oil-Discovery-Trend_fig1_267194751
There ain’t much left.
I think oil production between 2030 and 2040 will fall by about 12 to 15 million barrels per day. There could be a fantastic reversal of discoveries or a massive increase in the percentage of oil recovered from existing fields but I doubt it.
Loads of oil,
My scenario is in line with your expectation between 2030 and 2040 with World C plus C output falling by about 15 Mb/d. I agree there has been very little increase in conventional oil output since 2008 with peak in 2016 at about 1.2 Mb/d higher than in 2008. For conventional oil I believe we are past the peak by 8 years. I define conventional as oil that is not tight oil and has an API gravity higher than 10 degrees (not Canadian oil sands or Orinoco Belt oil.) It is not clear there has been much increase in OPEC spare capacity since 2016, some significant increases from Guyana and Brazil as far as conventional oil (as I define it deepwater off shore is included in the conventional bucket) these have been offset by declines in OPEC plus output and declines throughout the World. In 2024 conventional C plus C output was 5.1 Mb/d below the 2016 peak an average annual decrease of 638 kb/d over that 8 year period.
Something in the above posts bothers me: they only consider crude oil prices, though NG and NGL’s can easily make up 40% of a new well’s hydrocarbon production. To illustrate, if you have a new well that feeds into the Henry Hub at Erath, Louisiana (to which the NYMEX index is attached, and also in close proximity to an LNG train), then you’re selling NG for about $2.50/MMbtu, but if your well is in the Delaware Basin (where most of the new Permian activity is taking place), then you’re selling into the WaHa Hub near Fr. Stockton, where NG is bringing about a dollar per MMbtu. It’s pretty easy to check the NYMEX each day and be reassured that your NG is bringing a good sum, when in reality it is still selling for peanuts. It sure beats zero, where it languished for much of the preceding year, but it’s still not enough to move the needle. Many of those new Delaware wells have an inordinately high water cut too, and since NM doesn’t allow much salt water dumping (for good reason: the limestone karst connects to the not-so-far-away Carlsbad Caverns), that water has to be transported to Texas and deposited in the least over-pressurized SWD. With the tariffs on treated steel casing pipe, and the extra costs for these big wells, I doubt very seriously that very many of those new Delaware wells make much money selling NG into the WaHa Hub when crude oil is $60 on the NYMEX (which means that they’re receiving about $50 at the wellhead). In my opinion today’s shale production economic model cannot be compared to the conventional drilling and production activity of yesteryear.
Gerry,
Good point, recently WAHA NG price was about $1.90/ MMBTU while it was about $3.17/MMBTU at HH, a significant difference of $1.27/MMBTU (about 40% less at WAHA than at HH).
https://www.eia.gov/todayinenergy/prices.php
I use Southwest for WAHA and Louisiana for HH at page above.
US February Production rose by 29 kb/d
Texas and New Mexico were biggest contributors offset by many smaller drops.
I see it now! Great! Thanks Ovi!
Were there revisions?
Wasn’t EIA calling for 13.35 average for Q1, or am I dreaming that?
Also, I have read where EIA is expected to lose over 100 of its 350 employees.
I’m concerned about whether we will get this data in the future, especially if it’s going to show US peaking.
Would love to read comments on this thought, plus comments on what happens to oil markets if USA stops publishing oil production data?
Shallow sand,
December and January were revised lower (around 15 kb/d as I recall).
The STEO had 13451, 13146, 13350 for Dec to Feb (in kb/d). The PSM has 13438, 13130, 13159 for Dec to Feb in kb/d. So Feb was a miss high by 190 kb/d.
EIA data will probably be less accurate, I imagine they will try to automate, probably fewer human sanity checks.
Sanity may prevail when Trump is gone, it will be a long 1361 days, perhaps things might improve marginally if Democrats do well in 2026 in which case it will be another 612 days or so that we need to try to hang on to a Representative Democracy where the rule of law is respected. I am not hopeful this will be accomplished.
You are more optimistic than I DC, thinking that those now in control will allow an election that would transfer power to non-believers.
ShallowSand
In the previous US January post, it was not clear how much of the January 305 kb/d drop was due to cold weather vs the lower completions associated with the low January Frac Spread count. A maximum of 90 kb/d was estimated as being related to the cold weather. The continuing low February production which is only 29 kb/d higher than January’s points to fewer completions along with possibly geology, i.e. fewer Tier 1 wells, dropping pressure and increasing GORs as being the main cause of the January and February production drop.
In the February update which will appear late Friday or Saturday, a lot of data is presented for the top 8 Permian counties. While the data is not the best in some cases, it is pointing I think to a production peak in the next six months.
The low price of WTI along with the $2/b drop to $58.25/b today will certainly add more pressure to reduce capex. Today’s drop is due to rumours that Saudi Arabia will add another 411 kb/d to OPEC’s June production for a total of slightly over 822 kb/d.
As an aside, I am not clear on all of the reasons for the sudden increase. The first reason is that Kazakhstan and Iraq have been over producing and SA is fed up with the cheaters and wants its market share back. That is the official reason.
Two other possibilities
1) Trump has asked SA to increase production to reduce the price of WTI/gasoline and help slow US inflation and take some heat off the tariff increases.
2) As a side benefit the lower price will reduce Russian revenue from oil and may help to bring them to the bargaining table sooner.
Thanks Ovi. Looking forward to your post.
This next chapter is going to be very interesting—-and it’s going to very likely be written in terms of demand for LNG. It sure looks as though WTI is headed for some point substantially lower, based on the speed with which the price is taken down by a buck fifty to two dollars per barrel. As that happens, at these NG prices, rigs will almost certainly be laid down. After that, it won’t take long before there is a NG shortage, as the Sec of Energy says plainly that LNG will be the biggest export by the United States. Pivoting off this line of thought, Raymond James predicts NG hitting $6/MMbtu in 2026. Of course, if it does, then every rig will be raised and put to work again, as, to reiterate, many of these new shale oil wells have a gas cut of nearly 40%. So instead of NG being an unwanted by-product, it’s likely to be the coveted hydrocarbon fraction, bolstering profitability of a well. In my view, the time has come to stop using the price of WTI as the ONLY index of likely profitability, and instead give the emerging NG component its due. Much of this speculation depends, of course, on how fast alternative forms of energy become available to use for powering these data centers. SMR’s will likely be the savior of the enterprise, but it’s going to take a couple of years to get enough built. It would appear that the rate of development of energy-hungry chips for AI is outgunning the availability of electricity, worldwide. Enter LNG.
If oil is $50 WTI, at what WAHA price does it make sense to drill in the Permian because of the gas and NGL’s?
Is there enough capacity to get all of that gas to the LNG terminals, and if not, when will that be in place?
Keep in mind we appear to be seeing US oil flat lining when WTI was at $77 average.
I’m not in the nat gas business, so I don’t know much. I’m glad I haven’t been (outside of some Hugoton royalties) as it has been hammered worse than WTI due to shale overproduction.
Shallow Sand,
For the average 2022 Permian well with oil at $50/b at refinery gate, NGL at $25/b, and Natural gas at $8.50/MCF at WAHA, the well pays out at 60 months. Discounted net revenue at a 12.5% nominal annual discount rate is about 12.4 million at the end of well life (10 bopd), I assume well cost is about 12 million full cycle. For the 36 month payout preferred by some we would need to see Natural gas at $12/MCF at WAHA with oil and NGL prices as in previous example.
I doubt we see WAHA prices this high, but as you know I am often (always) wrong about the future.
US output has been very flat the last 12 months, often there is a winter down turn so we need a couple more months of data, if output remains flat until April (or declines further) it will tell us these prices are not high enough to sustain US output. Note that WTI was pretty low from September to December perhaps we are seeing that effect in January and February. Not sure the completion estimates by the EIA are very good in the DPR and we no longer have access to Novilabs data for recent insights. It could also be due to falling productivity in the Permian Basin, which again I only have the output data and no individual well data.
I used my Permian scenario with no change in well profiles except an earlier decrease in well productivity starting in Jan 2025 at about 3% per year, completion rate from Jan 2022 to March 2025 is from the drilling productivity completion data for Permian. Looks like my well profile for 2023 is too high if the completion estimates are accurate and for 2024 the well profile may be a bit low. I don’t have data to make a better estimate beyond 2022. Peak is in Sept 2024, URR is 36 Gb for 92k total wells completed (horizontal wells only).
UPDATE 2-Exxon beats Wall Street profit estimate, boosted by Guyana and Permian production
08:11:24 AM ET, 05/02/2025 – Reuters
*
Exxon on track to meet annual share repurchase target
*
Lower-cost production in Permian, Guyana helps boost earnings
*
Oil and gas production up from a year ago
*
Shares rise about 1% in pre-market trade
(Adds details from results, analyst comment)
By Sheila Dang
HOUSTON, May 2 (Reuters) – Exxon Mobil on Friday beat Wall Street’s estimate for first-quarter profit as higher oil and gas production from Guyana and the Permian basin helped boost earnings.
The largest U.S. oil producer paid $4.3 billion in dividends and repurchased $4.8 billion in shares during the quarter. The buyback figure puts Exxon on track to meet its annual share repurchase goal of $20 billion.
“In this uncertain market, our shareholders can be confident in knowing that we’re built for this,” Exxon CEO Darren Woods said in a statement.
Shares of Exxon, which have fallen 9% over the past year, rose about 1% in pre-market trading.
The energy sector has faced a tumultuous start to the year after U.S. President Donald Trump’s global tariff announcements stoked recession fears. Those concerns triggered a slump in oil prices because a weaker economy needs less energy to fuel it. At the same time, the OPEC+ group of oil producers has been increasing output, leading to more crude supply and further pressuring prices.
Exxon reported a profit for the January-March quarter of $7.71 billion or $1.76 per share, beating analyst estimates of $1.73 per share, according to data compiled by LSEG.
Exxon’s results set it apart from rival U.S. oil major Chevron, which said on Friday it would cut share repurchases during the second quarter.
“(Exxon) appears to have reiterated guidance on the shareholder returns front, which should be expected given the company’s strong balance sheet,” said Biraj Borkhataria, an analyst at RBC Capital Markets, in a research note.
Global oil and gas production totaled 4.55 million barrels of oil equivalent per day (boepd) during the quarter, up from 3.78 million boepd in the same period last year.
Exxon is the largest producer in the Permian basin, the top U.S. oilfield, and operates the lucrative Stabroek block off the coast of Guyana. Cost of supply in the Permian is less than $35 per barrel, the company has previously said, allowing it to make money even at lower oil prices.
Higher production from the Permian and Guyana helped boost earnings from oil and gas production to $6.76 billion, up from $5.66 billion in the same period last year.
Refining profits were $827 million, down from $1.38 billion a year earlier
Gerry,
My scenario for US shale Gas, there is less than many believe. Perhaps natural gas prices will get bid up to very high levels as supply becomes short in 2030, but it is not clear US LNG would remain competitive on World markets. I think the companies that built the LNG trains will be holding stranded assets by 2035.
No way to know about how much NG there is, what the demand might be, or how much it will influence shale well financials. Above, I meant to illustrate what I think will be a very dynamic process, going forward in the next year or so: oil price falling, reduced frenzy of drilling, increased demand for LNG in a production squeeze, leading to high LNG prices, more drilling, etc. Oil prices will eventually come back too, probably with a roar.
One thing has become pretty clear: the president intends to use LNG exports as a cudgel to try to balance out trade. It really is about the only fungible commodity that could be used, and the Energy Secretary has openly stated that we are going to export more LNG.
It sounds like I may be the only one who likes NG. I have a WI in a conventional well that was intended to be a pure oil well, but against all odds (given the neighborhood) it is 1/3 oil, 2/3 NG—-which turned out to be a blessing as it’s right close to an LNG train and enjoys Henry Hub pricing. I get that it cost one-third what a big shale well costs. I think NG will see a big (maybe double) price increase in the next year.
I’m not against natural gas at all. As I said, we have some royalties that at one time made some money, but for the most part since 2014 have made next to nothing.
Gerry,
I also have nothing against NG, my scenario is based on 75% of USGS mean TRR estimate of shale gas for shale gas URR, there are people that think the USGS estimates are not very good and likely much too large, so if anything my Shale Gas Scenario is likely on the optimistic side. Higher natural gas prices may make it difficult to sell LNG on the World Market or at minimum will reduce profits for LNG exporters. I agree it will be good for tight oil producers.
D C,
The USGS URR numbers more than 10 years ago were made when gas price was still >$4 average, and Marcellus wellhead price over $3, and yet they have not been adjusting that — it is worse than Saputra Marcellus URR paper’s >3 year lag time.
The shale gas drillers need different NG prices,
1. Marcellus/Appalachian: they need wellhead prices, and if pipeline take away capacity could help to $2.5 wellhead they could increase production, and HH price could still be well around $3. But now, they don’t have the take away capacity and so the wellhead price is under $2, this is especially true for the dry gas NEPA. It is so absurd to see New England NG price is over $5, and yet closest neighbouring Appalachian wellhead under $2.
2. Haynesville and Eagleford, they need wellhead price to be over $3.5 to increase production, and that translate into HH price around $3.75
Sheng Wu,
Technically recoverable resources do not have prices factored in, so price is irrelevant. The Marcellus and Utica were last evaluated in 2019, see
https://www.usgs.gov/centers/central-energy-resources-science-center/science/appalachian-basin-oil-and-gas-assessments
Haynesville and Bossier were evaluated in 2017 and Permian in 2016, 2017 and 2018.
https://www.usgs.gov/news/national-news-release/usgs-estimates-304-trillion-cubic-feet-natural-gas-bossier-and
https://www.usgs.gov/centers/central-energy-resources-science-center/science/permian-basin-oil-and-gas-assessments
Read the assessments and see if you can find prices mentioned anywhere.
For the Permian Basin tight oil the mean TRR is about 75 Gb, actual economically recoverable resources will be on the order of 50% of TRR, shale gas from the Permian is likely to be similar at about 50% of mean TRR for URR. For Appalachia and Haynesville/Bossier and other shale gas basins I have assumed 75% of mean TRR will be recovered. URR will be around 900 TCF for US shale gas.
For all USGS assessments of undiscovered shale gas resources the total is 1683 TCF for mean TRR, my URR estimate is 53% of the mean TRR. This is similar to what I get for tight oil where my URR estimate is 54% of mean TRR estimate from the USGS (124 Gb.)
My guesses are likely to be wrong, whether too high or too low remains to be seen.
New England cannot get pipelines across New York State from PA, they do not control decisions by politicians in New York State.
Trump has promised to get the Constitution Pipeline going again. You may see PA gas in ME yet.
T Hill,
I don’t think it will change the shale gas recovered from the Appalachian, but it may move the peak to an earlier date if it happens.
the links seem to be 2019 Marcellus “undiscoverd”, not TRR nor URR
Sheng Wu,
read the pieces it is undiscovered TRR, we need to add 2018 proved reserves and cumulative production up to Dec 2018 which adds 172 TCF to TRR so total for Marcellus would be about 245 TCF.
Quote from Marcellus assessment in 2019,
Using this geologic framework, the USGS defined and quantitatively estimated undiscovered, technically recoverable gas and NGL resources for six continuous assessment units (AUs).
undiscovered TRR for Marcellus is 96 TCF, but about 24 TCF is from low productivity areas not likely to be developed, so a more realistic number is 72 TCF for Marcellus undiscovered TRR.
For Utica Shale the TRR is about 148 TCF for a total Appalachian Shale gas of about 393 TCF for mean TRR, if we add back the low productivity areas we get 417 TCF and assuming 60% of TRR is recovered we get a URR of about 250 TCF for Appalachian URR.
Proved reserves plus cumulative production at the end of 2022 was about 276 TCF, which would be 66% of TRR, so that might be a better estimate.
For Permian I have URR of 195 TCF, based on my tight oil scenario and assuming when drilling for tight oil stops, shale gas drilling in the Permian (for shale gas alone) will not be profitable. For Appalachian I use URR=300 TCF, and for Haynesville/ Bossier URR=240 TCF and for other US shale gas and coalbed methane URR=150 TCF for a total of 885 TCF for US shale gas/coalbed methane URR.
World C plus C in kb/d per trillion 2015$ in World real GDP from 1985 to 2023.
If the trend in chart above continues we get the following scenario assuming that World real GDP grows at 3% per year after 2023.
Dennis,
This might be realistic if worldwide birthrates drop by a similar rate. And negative real GDP.
Dennis
What is this based on?
You need to extrapolate the graph above so we can see what your assumptions are.
Loads of oil,
The assumption is that the trend of the first chart (where the equation for the linear trend is shown) continues in the future. World real GDP from World bank to 2023 is assumed to grow at 3% per year.
It is a very simple model which is likely to be incorrect based on the 37 year linear trend shown in the first chart.
Dennis
That is unrealistic what do you think all the chemicals will be made from?
Tyres? All 2.3 billion each year!
What do you think planes are going to fly on? Globally we can’t feed everyone as it is, any idea how many millions of hectares would have to be dedicated to producing all the aviation fuel?
Oil is used for many more things than road transportation
https://www.iea.org/data-and-statistics/charts/oil-demand-by-sector-and-scenario-to-2030
Loadsofoil,
I agree probably not realistic, simple models are usually not correct. Model below assumes real GDP grows at only 1.5% per year due to slowing population growth, it is close to linear with about a 2.295 T 2015$ increase per year on average from 2024 to 2080. I also assume the rate of decrease in oil use per T 2015$ of real GDP slows at the 2010 to 2023 average rate 22 kb/d per T 2015$ until 2050, slows to half this rate until 2062 and is halved again from 2063 to 2080, the assumptions are arbitrary we can only guess the future. We will have to find ways to do with less in the future, aviation may be much reduced and as population falls there will be less demand.
Loads- “What do you think planes are going to fly on?”
Phased out, except for the super wealthy and some critical applications.
All get used to the idea.
Dennis
GDP is nothing to do with population. It is to do with a country starting to use lots of Coal, gas and oil in order to produce lots of goods with value.
China population has only grown by less than 20% in 30 years, yet over that time its GDP has grown from 1 trillion to 18 trillion in that time.
Africa population has grown more in that time yet its GDP is only 2 trillion. Its consumption of coal oil and gas are proportional.
If Africa starts to grow as many believe then its consumption of oil, coal and gas will increase greatly also.
Loadsofoil,
I disagree, population matters. More people mean more resources are consumed including oil. I look at World real GDP per capita which has grown pretty consistently at 1.55% per year from 1970 to 2023.
I suspect world oil used specifically for each unit of grain production has changed little at all over the past 40 years, meanwhile the overall grain production (oil consumption in the food production sector) is much higher with population having increased about 40% since then.
Hickory: I would point out that the Malthusian limit would have been reached, resulting in “population overshoot,” sometime in the last half-century had it not been for the Haber-Bosch equation, fixing ambient nitrogen to the exhaust residue of natural gas as a superb and readily available source of fertilizer. Genetic modification of the DNA of seeds of all types did the rest.
Indeed Gerry, N2 fert (nat gas) and improved seed genetics have been bigtime contributors to vastly higher yields per acre,
plus a lot petrol! for on farm mechanization and water pumping and livestock/product transport, petrochemicals for plastics (irrigation tubing, greenhouse, packaging, pesticides), and energy for food processing and refrigeration.
Remove just some of these fossil energy inputs from the food sector equation and we are in deep global overshoot condition right now.
Its a minority of the world who currently live on a low energy input food system.
This is one of reasons I and others have pointed out that oil is far too precious to use for the light transport sector.
OPEC+ sticks to output plan, removes US EIA from monitoring sources
“After thorough analysis from the OPEC Secretariat, the Committee replaced Rystad Energy and the Energy Information Administration (EIA) with Kpler, OilX, and ESAI, as part of the secondary sources used to assess the crude oil production and conformity,” OPEC+ said in a statement.”
Surprised they replaced Rystad.
My supply scenario for World C plus C based on Paul Pukite’s Oil Shock Model and the World C plus C demand scenario based on Wofgang Lutz population scenario, World real GDP per capita trend and falling oil intensity of real GDP for the World (presented in an earlier comment). These scenarios imply low oil prices in the future which would likely shift demand higher and supply lower, so that actual output would fall somewhere between the supply and demand scenarios, if they were correct. I would define a low oil price as $50 to $70/b in 2024 US$.
Hats off to you DC- very ambitious and well considered projections to make.
I fall into the camp of those who expect oil demand to decline less steeply, given the inertia of this vast and still growing human bulldozer. But this is really just a hunch and not based on anything factual.
I do believe that light transport sector of oil demand will drop off pretty briskly from 2030 to 2050, but that other sector demand will not drop off…perhaps even grow a bit.
Hickory,
I tend to agree that the demand scenario seems optimistic, it may not be the case that oil intensity of real GDP continues to decline along the 2010-2023 trend, as I said earlier the simple models are often wrong, though this is modified where the linear annual rate of decrease of 22 kb/d per T 2015$ of World real GDP falls to 11 in 2051 and to 5.5 in 2063, but is likely (or certain) to be incorrect.
An update to US production has been posted.
https://peakoilbarrel.com/us-february-oil-production-marginally-higher/
A New Open Thread Non Petroleum has been posted.
https://peakoilbarrel.com/open-thread-non-petroleum-may-3-2025/