By Ovi
All of the Crude plus Condensate (C + C) production data, oil, for the US state charts comes from the EIAʼs Petroleum Supply monthly PSM which provides updated information up to January 2025.

U.S. January oil production decreased by 305 kb/d to 13,146 kb/d, 158 kb/d lower than December 2023. The largest decreases came from Texas and New Mexico. December production was revised down from last month’s 13,491 kb/d to 13,451 kb/d a decrease of 40 kb/d. Production in February is expected to increase by 392 kb/d.
The dark blue graph, taken from the March 2025 STEO, is the forecast for U.S. oil production from February 2025 to December 2026. Output for December 2026 is expected to reach 13,698 kb/d. From February 2025 to December 2026 U.S. production is expected to grow by 160 kb/d, not much for almost two years.
The light blue graph is the STEO’s projection for output to December 2026 for the Onshore L48. January Onshore L48 production dropped by 324 kb/d to 10,913 kb/d. From February 2025 to December 2026, production is expected to increase by 203 kb/d to 11,440 kb/d. December 2026 production was revised up from 11,366 kb/d by 74 kb/d from last month. Note how production is essentially flat starting in mid 2025 to December 2026.
Why is January production down by 305 kb/d? Is it the weather or the low frac spread count? An estimate for the weather can be made. The weekly production data for the week of January 24 shows it was down by close to 300 kb/d. Let’s assume it was 400 kb/d for the whole week. That translates into a monthly drop of 90 kb/d. That implies that 200 kb/d of the January drop is associated with the low January frac spread count and possibly geology, i.e. fewer Tier 1 wells, dropping pressure and increasing GORs. It will take a few more months of production data to sort this out.
U.S. Oil Production Ranked by State
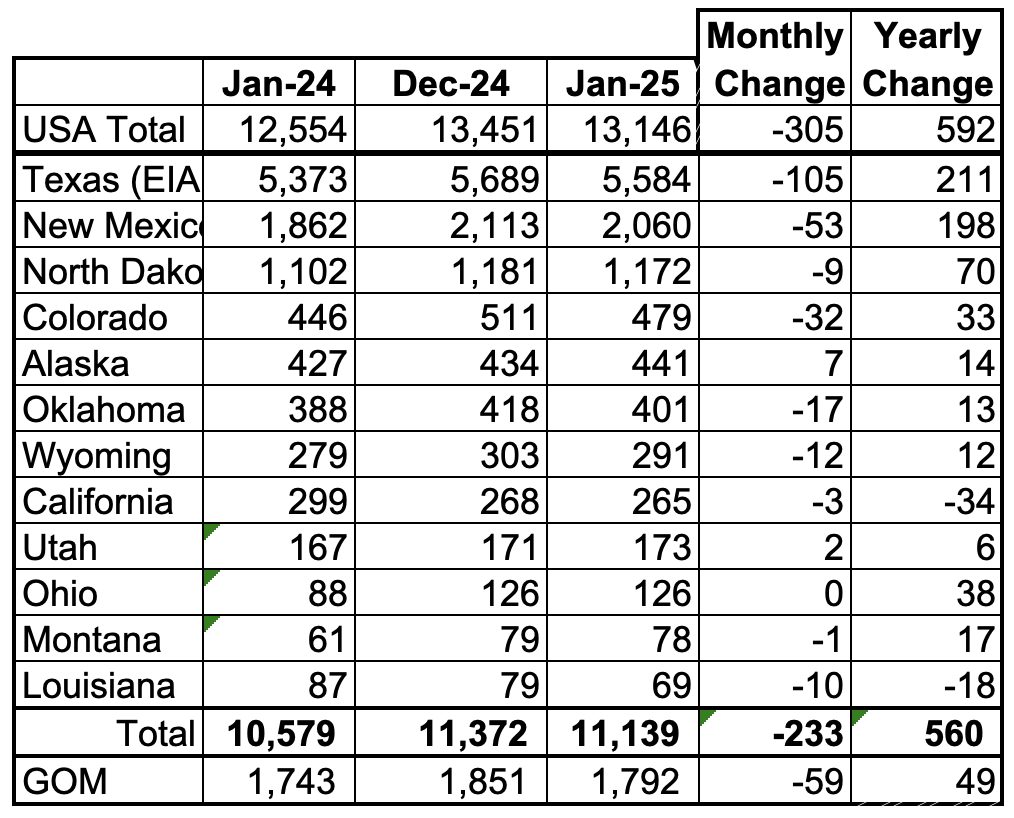
Listed above are the 12 US states with the largest oil production along with the Gulf of Mexico. Montana was added to this table a few months back since its production exceeded Louisiana’s production and we wish to keep tracking Louisiana.
These 12 states accounted for 84.7% of all U.S. oil production out of a total production of 13,146 kb/d in January 2025. On a MoM basis, January oil production in these 12 states dropped by 233 kb/d. On a YoY basis, US production increased by 560 kb/d with the biggest contributors being Texas and New Mexico.
State Oil Production Charts
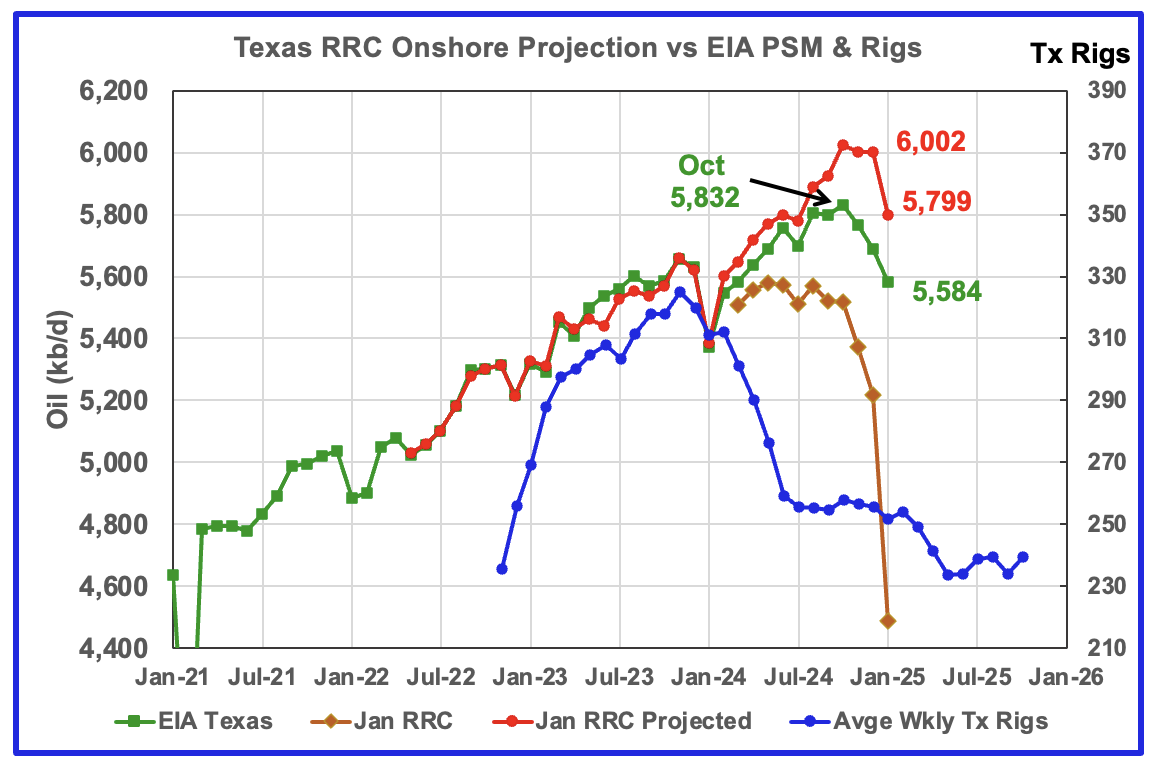
According to the EIA, Texas production decreased by 105 kb/d in January to 5,584 kb/d and is 248 kb/d lower than October 2024. YoY production is up by 211 kb/d. Note that November production from last month was revised down by 33 kb/d from 5,801 kb/d to 5,768 kb/d and December was revised down by 34 kb/d from 5,723 kb/d to 5,689 kb/d.
Texas production has been dropping since October. The drop could be related to the drop in completions that started in October while the January drop could be a combination of cold weather and low completions. A few more months of data is required to see if Texas is nearing a production plateau and possible peak.
The red graph is a production projection using December and January Texas RRC data. Due to more production revisions than typical to earlier months in the January report, the projection is too optimistic by roughly 200 kb/d. However, note that both the projection and the EIA show production rolling over in October and dropping in January.
The blue graph shows the average number of weekly rigs reported for each month, shifted forward by 10 months. So the 276 rigs operating in July 2023 have been shifted forward to May 2024. From February 2024 to July 2024, the rig count dropped from 312 in time shifted February 2024 to 256 in July 2024. That drop of 56 rigs has had no impact on production up to August 2024 but November may be the first month when the rig drop impact on oil production is starting to show up.
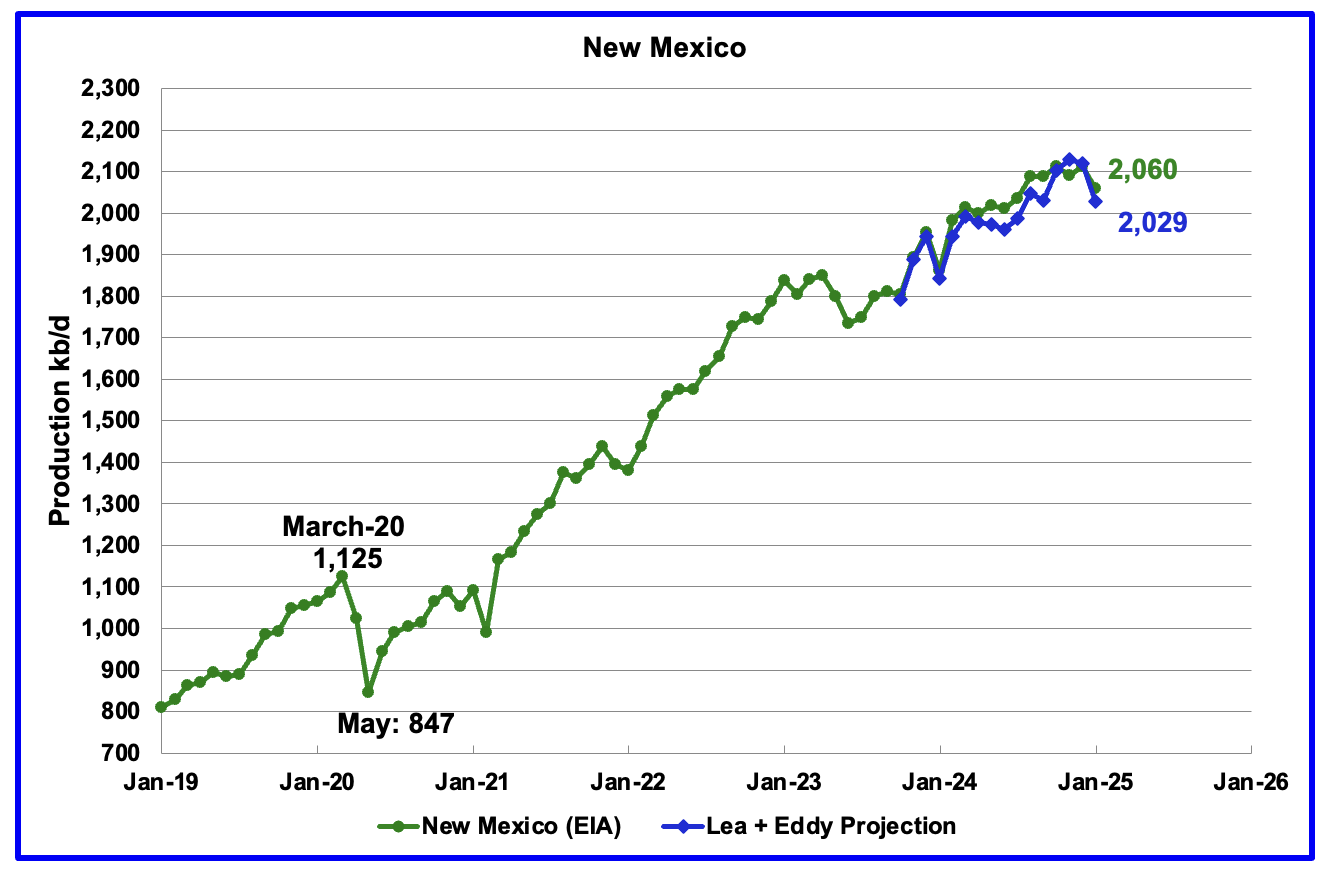
According to the EIA, New Mexico’s December production dropped by 53 kb/d to 2,060 kb/d.
The blue graph is a production projection for Lea plus Eddy counties. These two counties account for close to 99% of New Mexico’s oil production. The difference between the December and January preliminary production data provided by the New Mexico Oil Conservation Division was used to make the projection. A 1% correction was added to the Lea plus Eddy production projection to account for their approximate fraction of New Mexico’s oil production.
The projection estimates January production was 31 kb/d lower than the EIA’s report. The decrease is related to January production decreases in both Eddy and Lea counties and is discussed further down in the Permian section.
More oil production information for a few New Mexico and Texas counties is reviewed in the special Permian section further down.
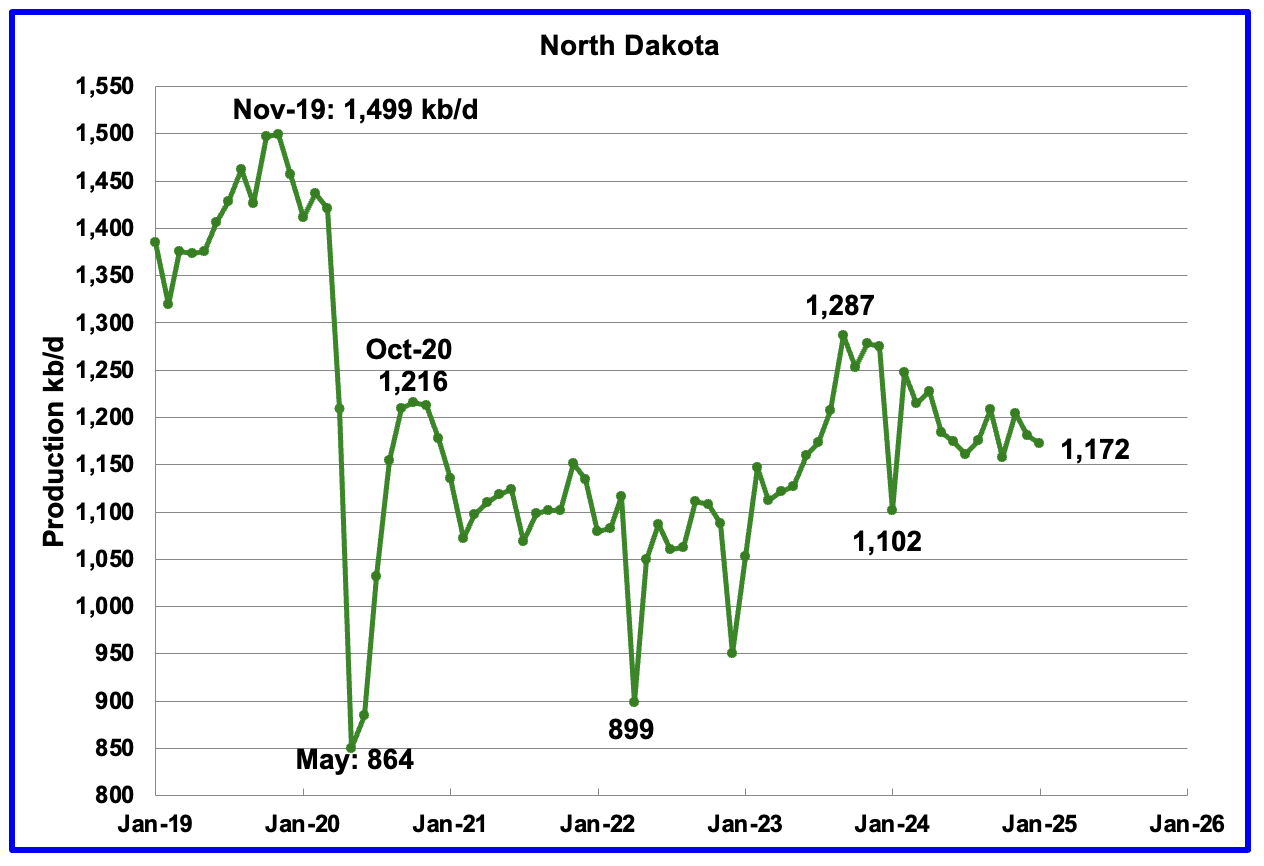
January’s output dropped by 9 kb/d to 1,172 kb/d. Production is down by 115 kb/d from the post pandemic peak of 1,287 kb/d. The North Dakota Department of Mineral resources reported January production was 1,173 kb/d.
According to this Article the Director of the North Dakota Department of Mineral Resources said “oil production is 6.6% above the revenue forecast but it is 1.7% down from December into January or roughly 20,000 barrels per day in the December to January decline. “We attribute that to a cold spell in mid-January and slightly less completions,” he said. He said he would expect February will have similar results due to very cold temperatures.”
“According to Anderson, the drilling rig count remains steady and is expected to remain at similar levels through 2025.
He said mergers and acquisitions continue to occur and it is expected integrations of these companies will occur in the coming year.
Currently, 12 frac crews are active in the state.”
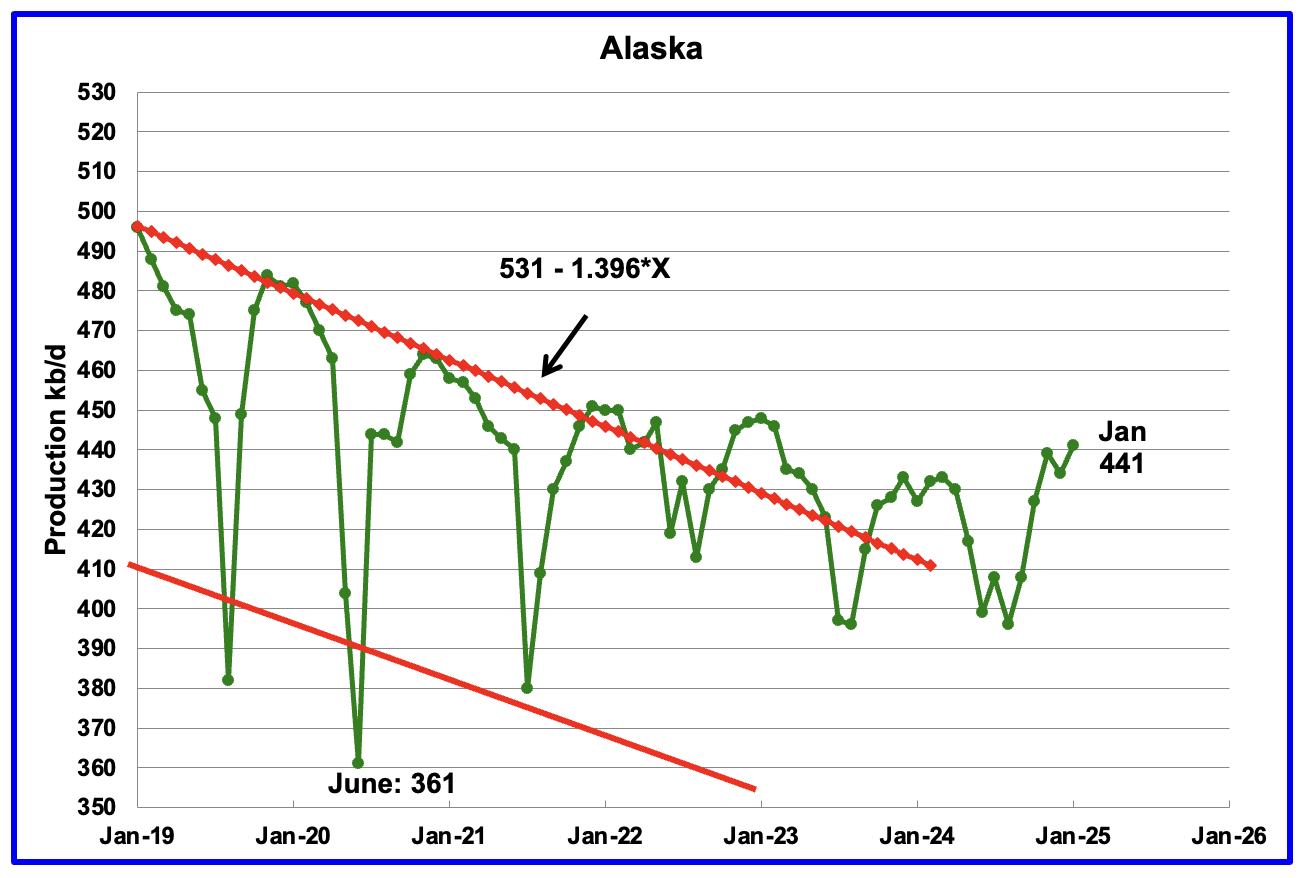
Alaskaʼs January output rose by 7 kb/d to 441 kb/d while YoY production rose by 14 kb/d. The rise in production is an indication that production for the next few months will be on its regular plateau after summer maintenance. EIA’s average weekly January production for Alaska is almost the same at 440 kb/d.
Alaska has recently brought new fields online to consistently have YoY and monthly production gains which have broken away from the earlier dropping production trend red lines. According to this Article, first oil production begins at Nuna project in Alaska in December.
Nuna is expected to add 20,000 barrels of oil to the state’s overall oil production, at its peak production level.
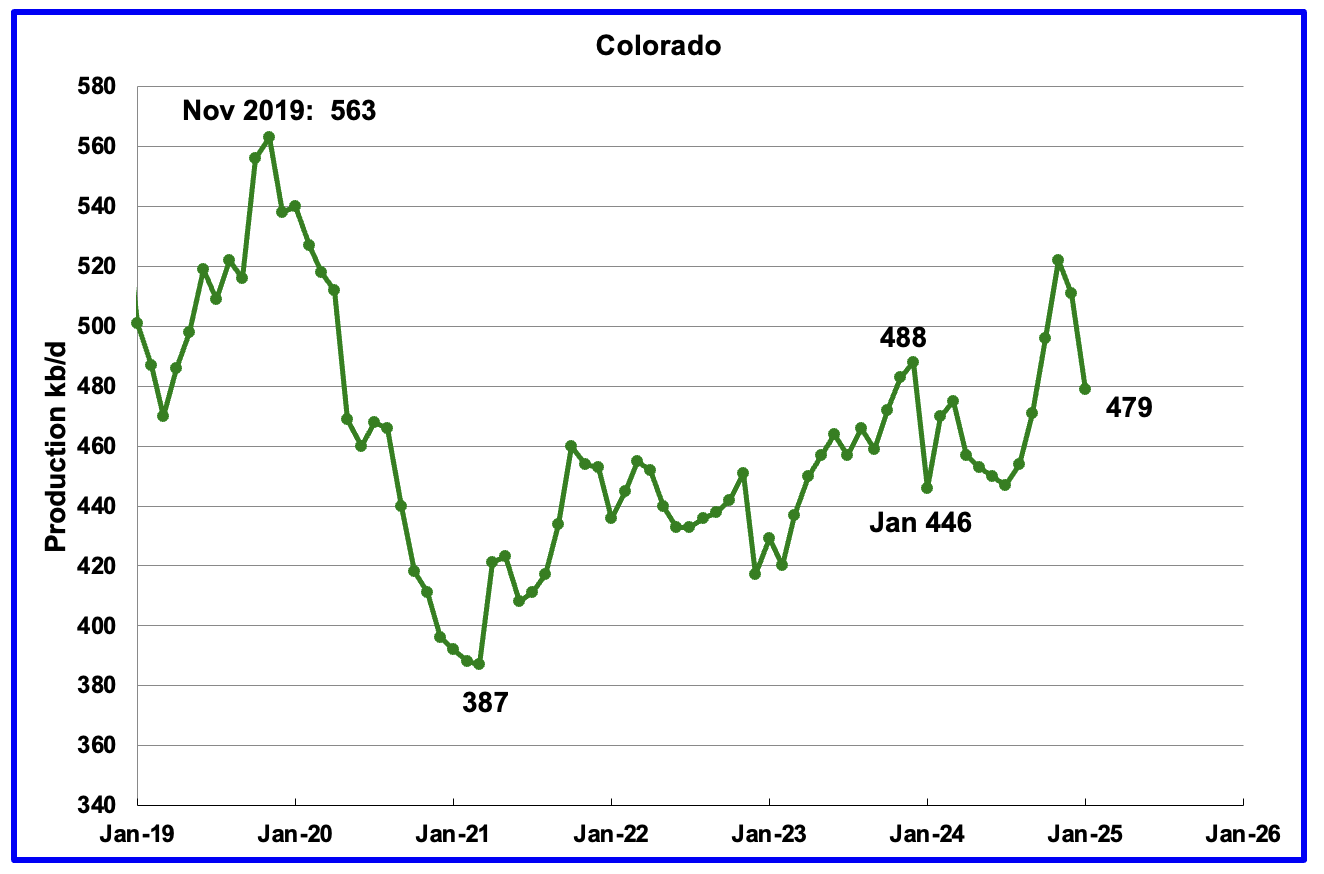
Coloradoʼs January oil production decreased by 32 kb/d to 479 kb/d. Colorado began the year with 12 rigs. In December it had 7 in operation which dropped to 6 in January and February and to 5 in March. Is the dropping rig count beginning to show up in dropping oil production?

An aside: Did a search to find a reason for Colorado’s January oil production drop. Above is what the AI summary came up with. Beware of AI data/facts.
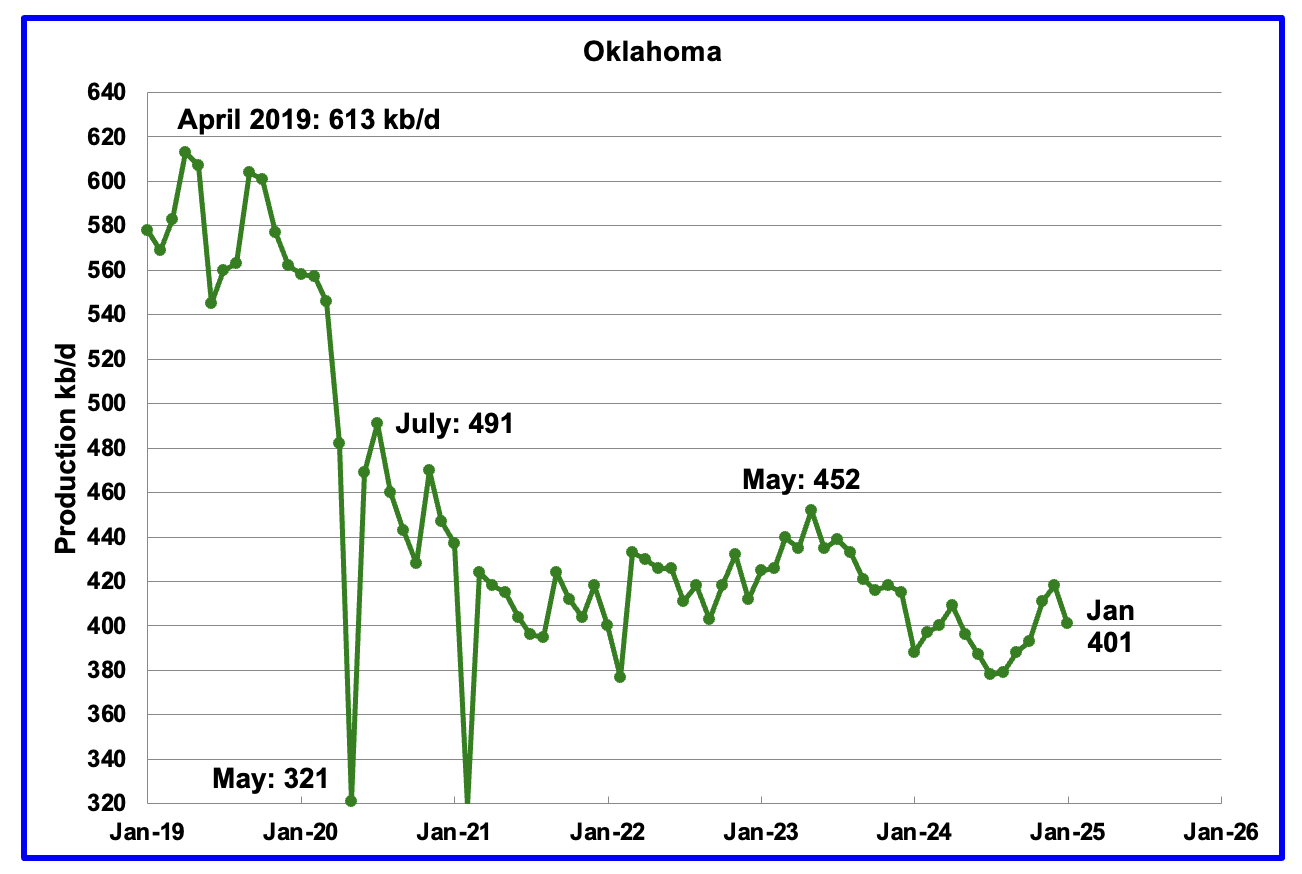
Oklahoma’s output in January dropped by 17 kb/d to 401 kb/d. Production remains below the post pandemic July 2020 high of 491 kb/d and is down by 51 kb/d since May 2023. Output entered a slow declining phase in June 2023.
At the end of October 2024 there were 40 operational rigs and they have held steady at 41 ±1 from October to December. In February 4 rigs were added to bring the total to 46 and an additional 4 were added in March to raise the count to 50. Will the increase in the rig count result in increasing oil production going forward? Maybe January was a cold weather related production drop.
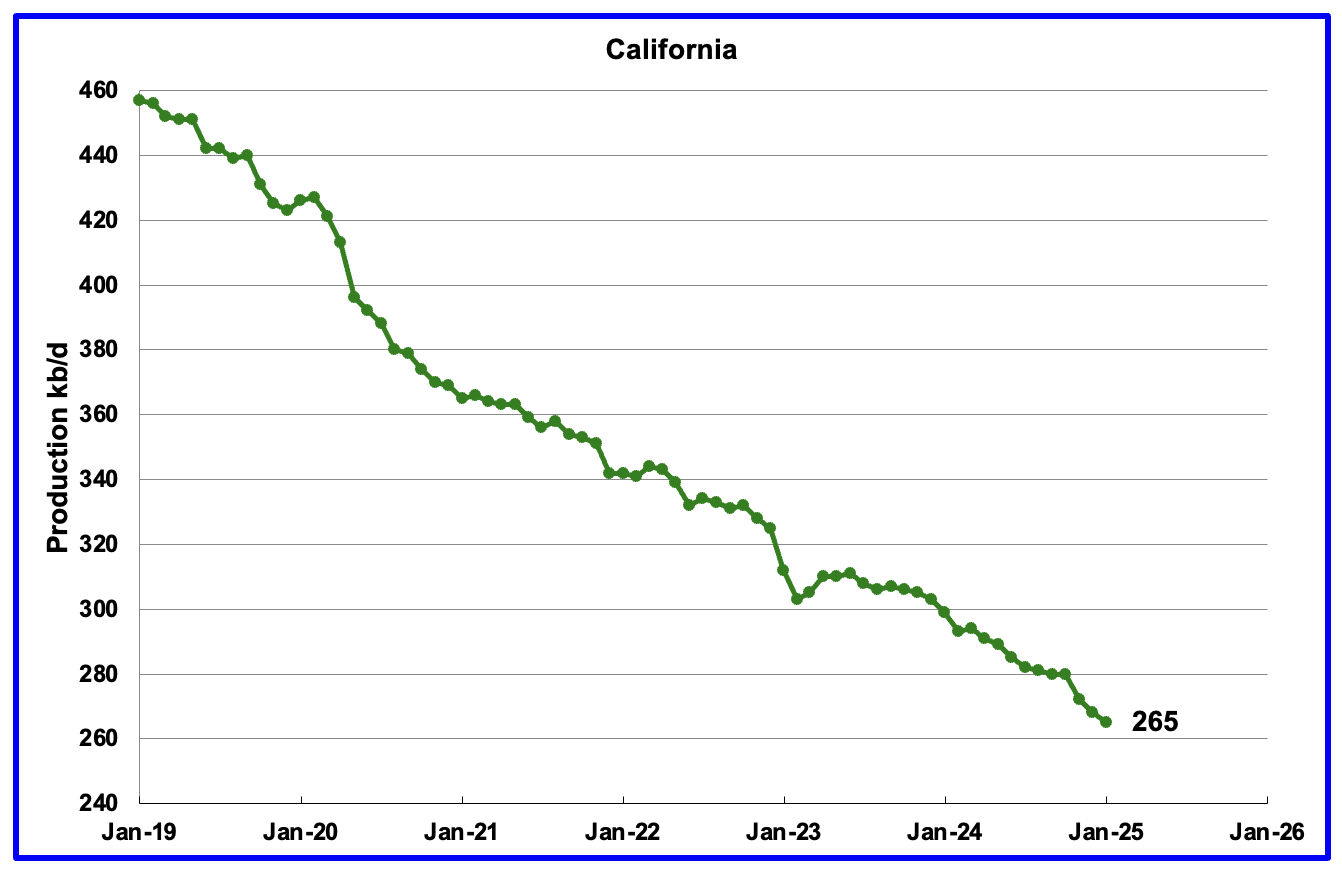
California’s declining production trend continues. January production dropped by 3 kb/d to 265 kb/d.
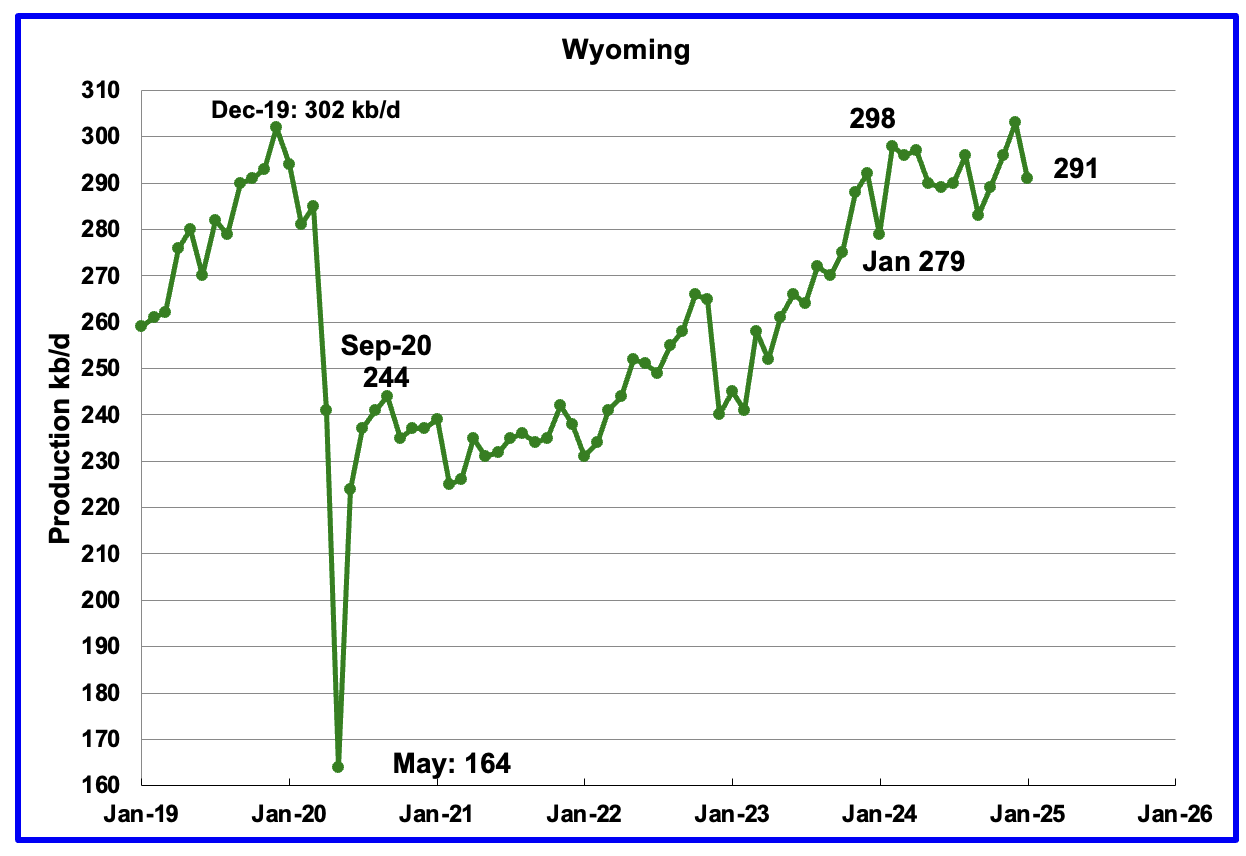
Wyoming’s oil production has been rebounding since March 2023. However the rebound was impacted by the January 2024 storm. Production peaked in February 2024 and was showing signs of being on a plateau in mid year. January’s production dropped by 12 kb/d to 291 kb/d.
In August Wyoming had 8 operational rigs. The rig count has slowly risen to 14 from November to January and to 16 in March.
January’s production increased by 2 kb/d to 173 kb/d. Utah had 8 rigs operating from December through March.
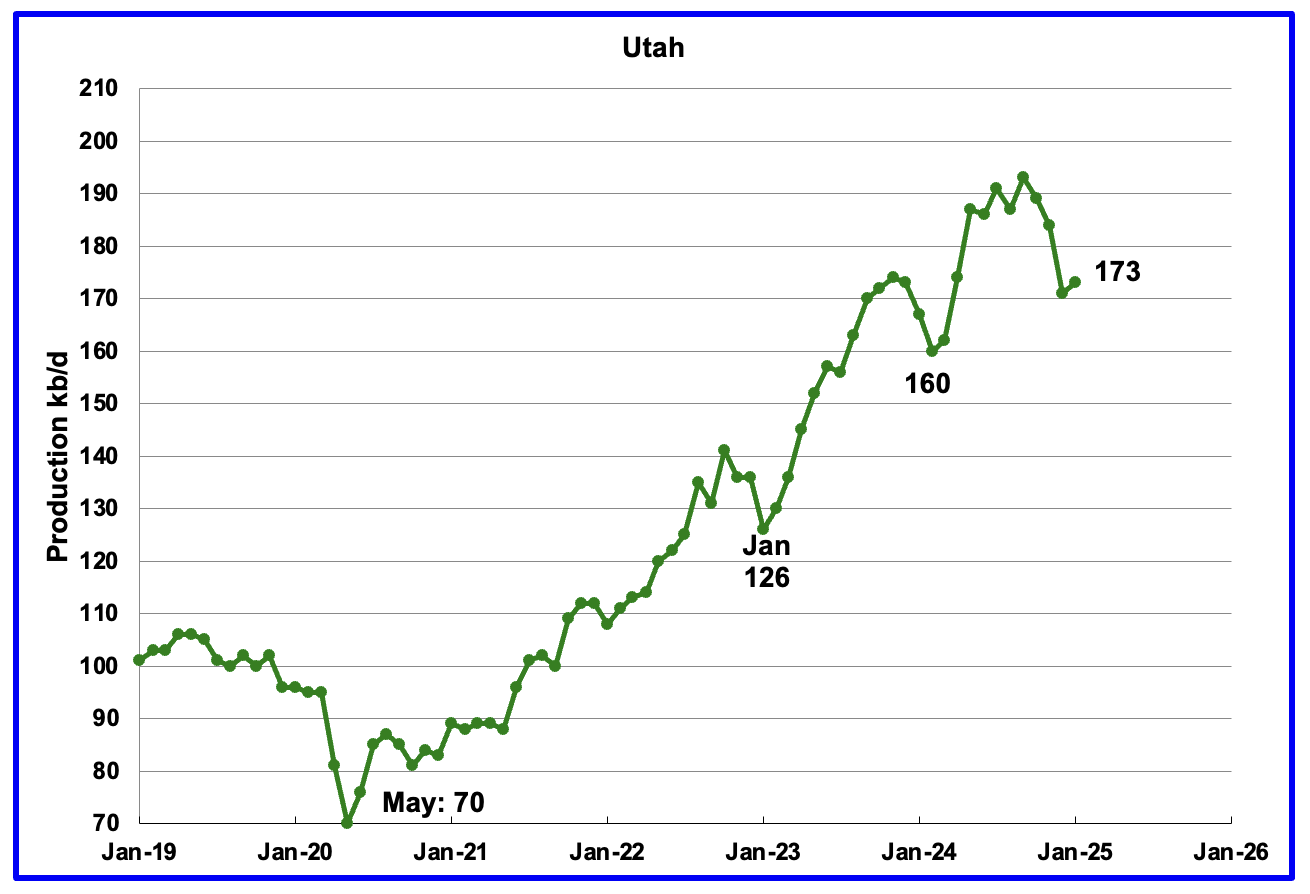
January’s production increased by 2 kb/d to 173 kb/d. Utah had 8 rigs operating from October through March.
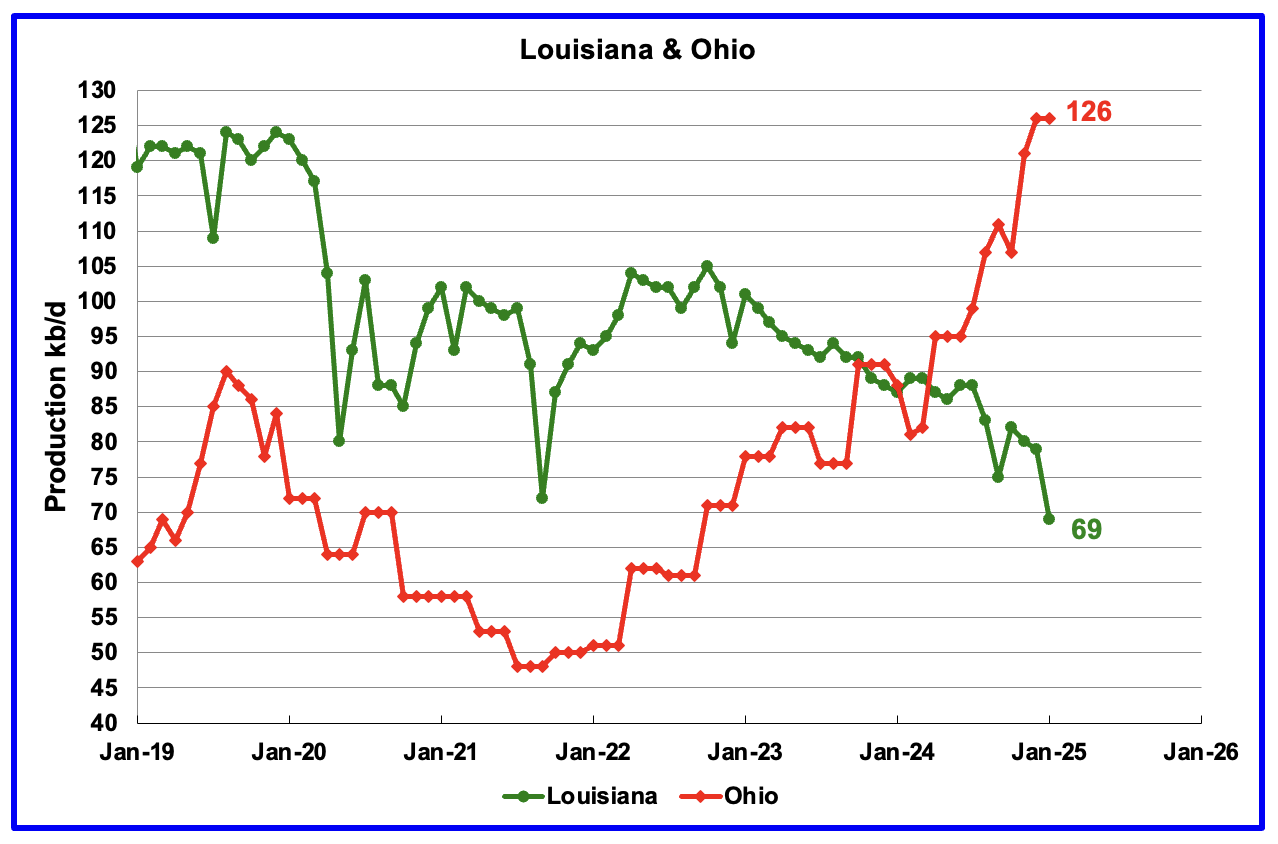
Ohio has been added to the Louisiana chart because Ohio’s production has been slowly increasing since October 2021 and passed Louisiana in November 2023.
Louisiana’s output entered a slow decline phase in October 2022 and continued to fall in January. January’s production dropped by 10 kb/d to 69 kb/d. As of all of 2025, there are no oil rigs operating in Louisiana. In November 2024, one rig was operating. Anybody have any thoughts on this and can it be confirmed?
Ohio’s January oil production was unchanged at 126 kb/d, a new record high, upwardly revised from 122 kb/d last month. The most recent Baker Hughes rig report shows one horizontal oil rigs operating in Ohio in December and January and two in February. In late March, 3 rigs were operational.
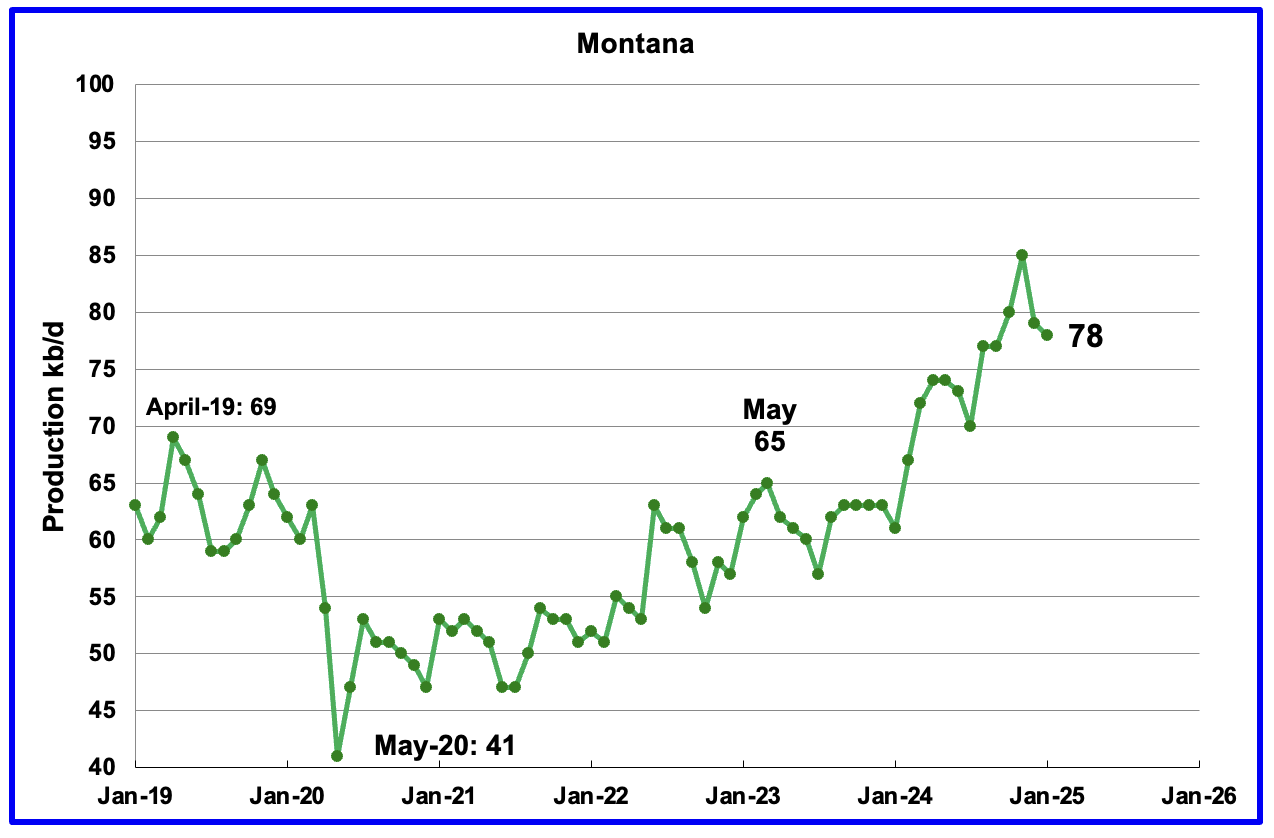
January’s oil production dropped by 1 kb/d to 78 kb/d. Montana had one oil rig operating from December through March.
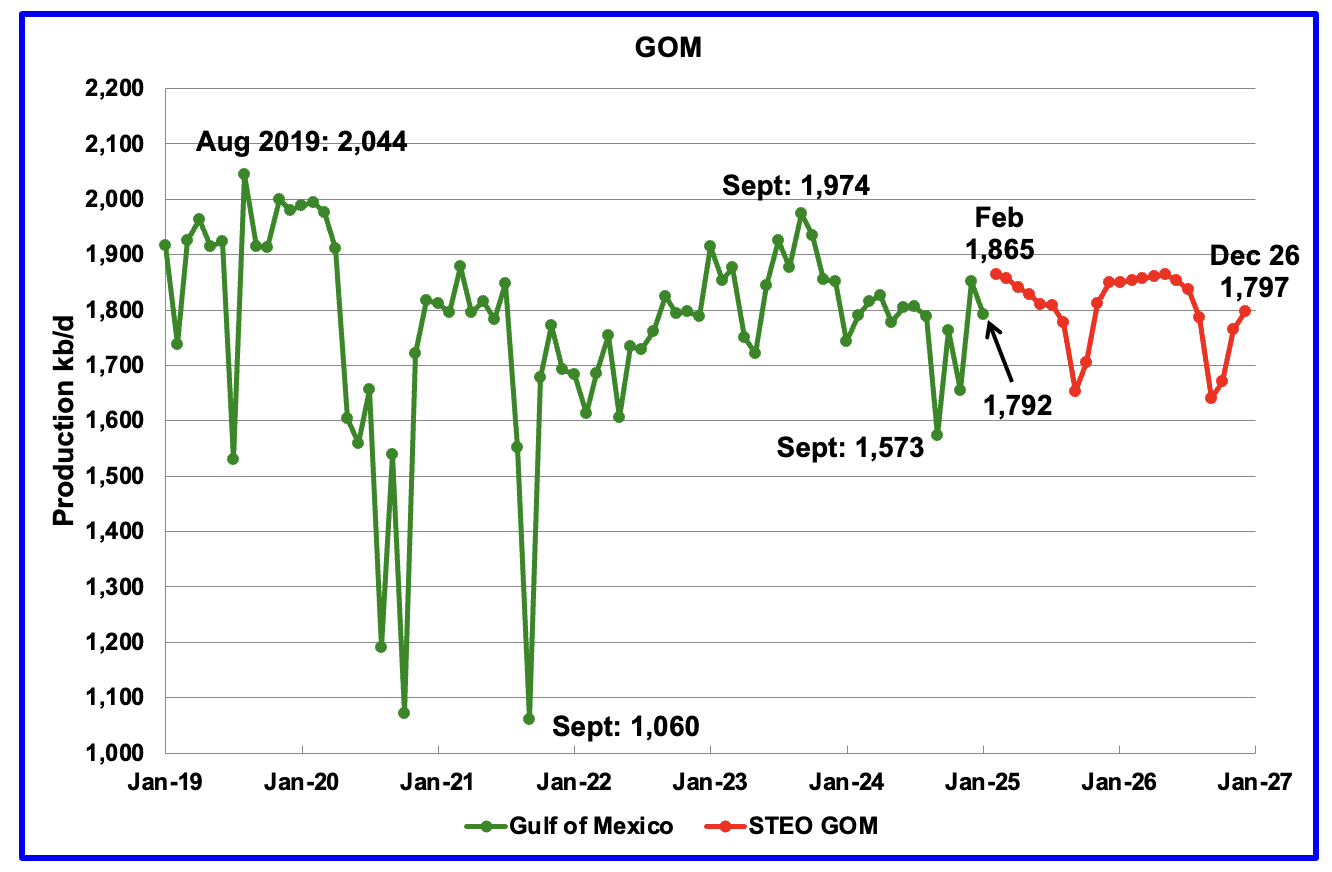
GOM production dropped by 59 kb/d in January to 1,792 kb/d but is expected to rise in February to 1,865 kb/d.
The March 2025 STEO projection for the GOM output has been added to this chart. It projects production in December 2026 will be 68 kb/d lower than February 2025 at 1,797 kb/d.
According to the OPEC MOMR, GOM output is expected to be supported by new projects in the coming months, such as the deepwater Whale platform that started production in January.
A Different Perspective on US Oil Production
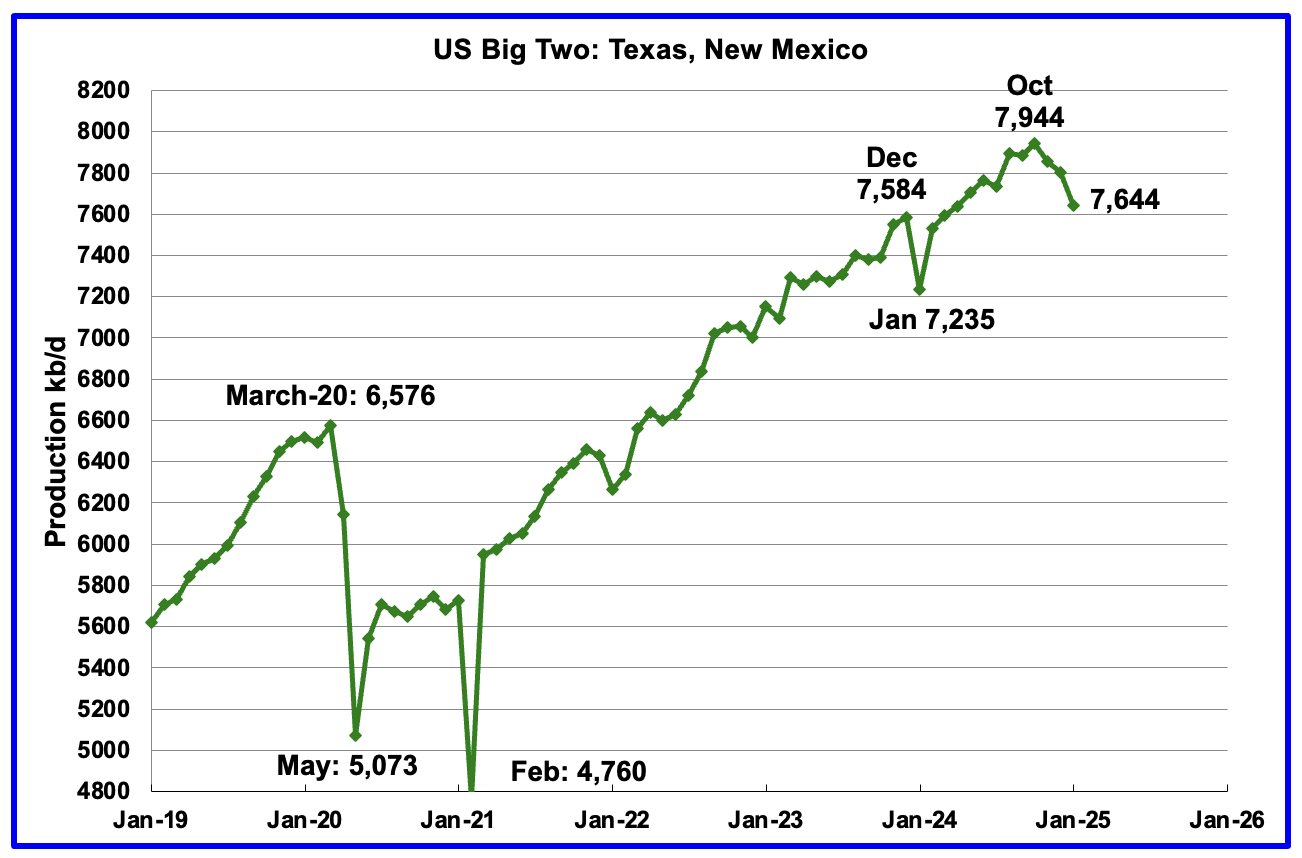
Combined oil output for the Big Two states Texas and New Mexico.
January’s production in the Big Two states decreased by a combined 158 kb/d to 7,644 kb/d and is 300 kb/d lower than October 2024. Clearly these two states were the drivers of US oil production growth up to October 2024. Has the trend flipped?
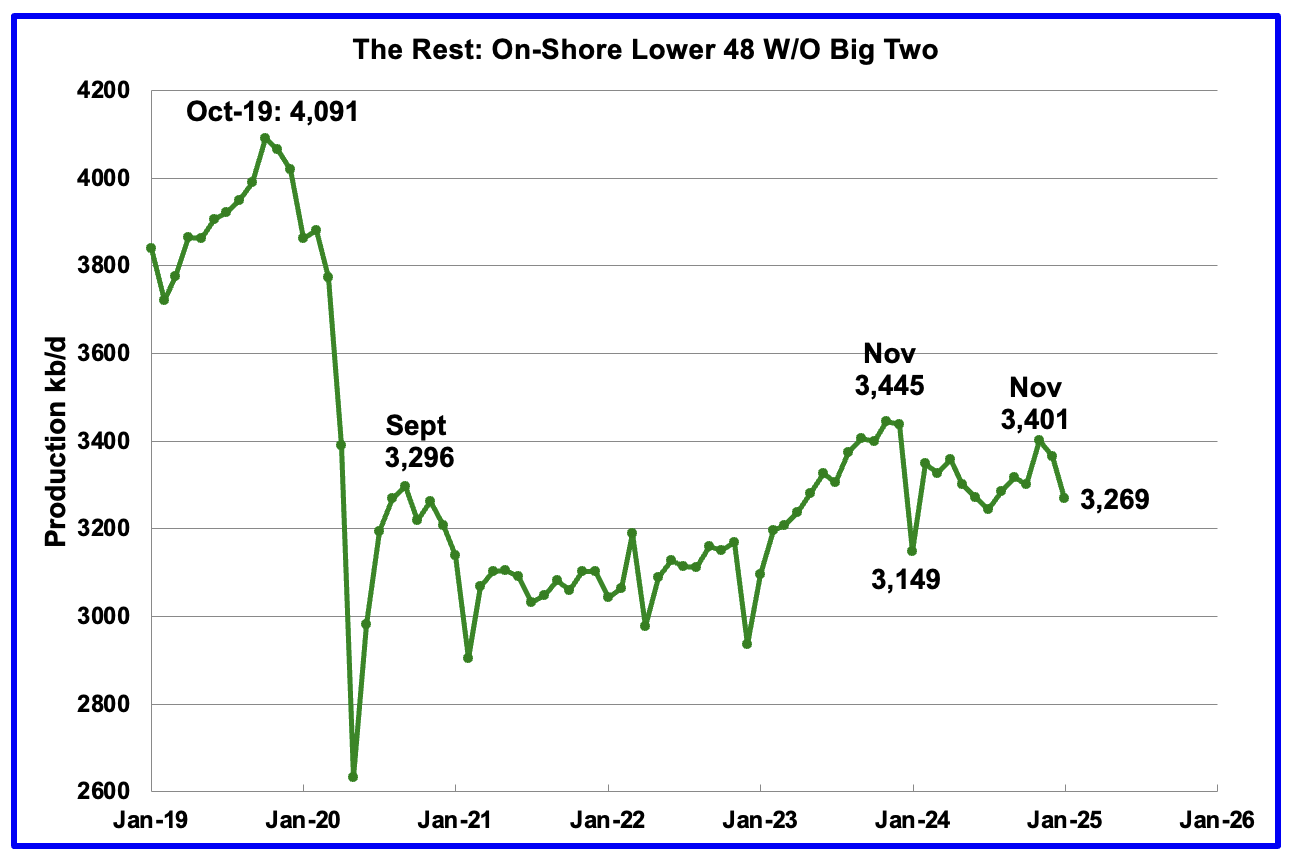
Oil Production by The Rest
January’s oil production by The Rest dropped by 95 kb/d to 3,269 kb/d and is 176 kb/d lower than November 2023.
Permian Basin Report for Main Counties and Districts
This special monthly Permian section was added to the US report because of a range of views on whether Permian production will continue to grow or will peak over the next year or two. The issue was brought into focus recently by two Goehring and Rozencwajg Report and Report2 which indicated that a few of the biggest Permian oil producing counties were close to peaking or past peak. Also comments by posters on this site have similar beliefs from hands on experience.
This section will focus on the four largest oil producing counties in the Permian, Lea, Eddy, Midland and Martin. It will track the oil and natural gas production and the associated Gas Oil Ratio (GOR) on a monthly basis. The data is taken from the state’s government agencies for Texas and New Mexico. Typically the data for the latest two or three months is not complete and is revised upward as companies submit their updated information. Note the natural gas production shown in the charts that is used to calculate the GOR is the gas coming from both the gas and oil wells.
Of particular interest will be the charts which plot oil production vs GOR for a county to see if a particular characteristic develops that indicates the field is close to entering or in the bubble point phase. While the GOR metric is best suited for characterizing individual wells, counties with closely spaced horizontal wells may display a behaviour similar to individual wells due to pressure cross talking . For further information on the bubble point and GOR, there are a few good thoughts on the intricacies of the GOR in an earlier POB comment and here. Also check this EIA topic on GOR.
New Mexico Permian
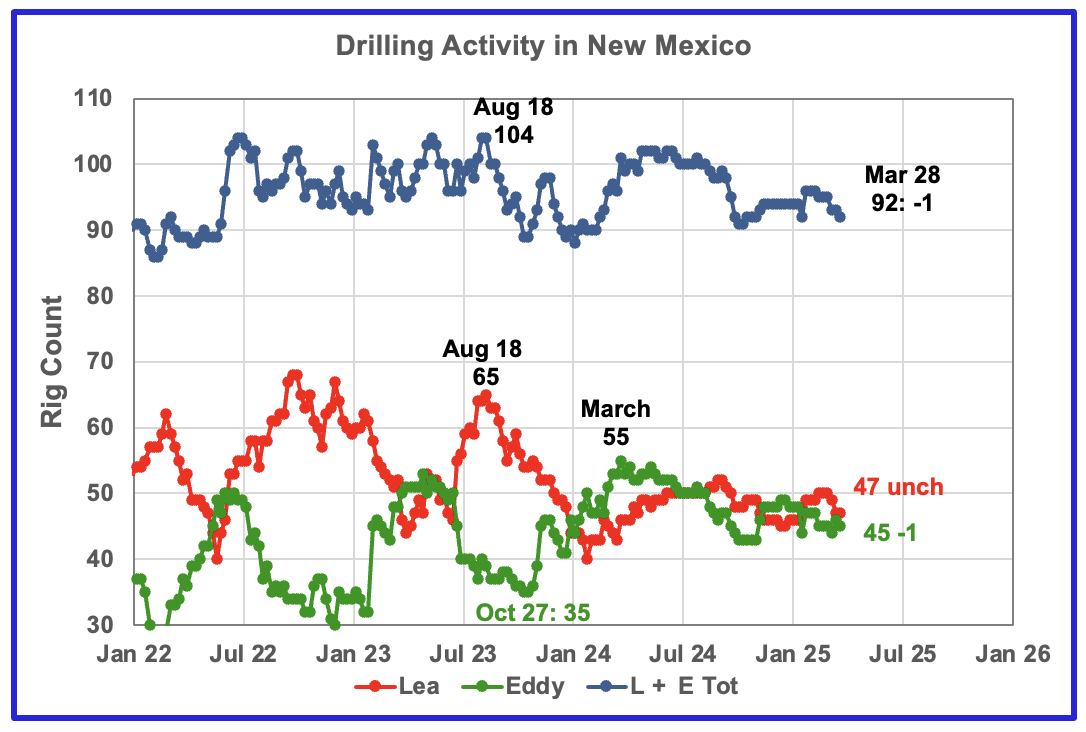
The total rig count in Lea and Eddy counties in the week ending Mar 28 was 92 and is down 8 from the July 2024 count of 100.
Lea and Eddy county rigs have both stabilized in the 45 to 50 range over the last few months but are hinting at a slow decline.
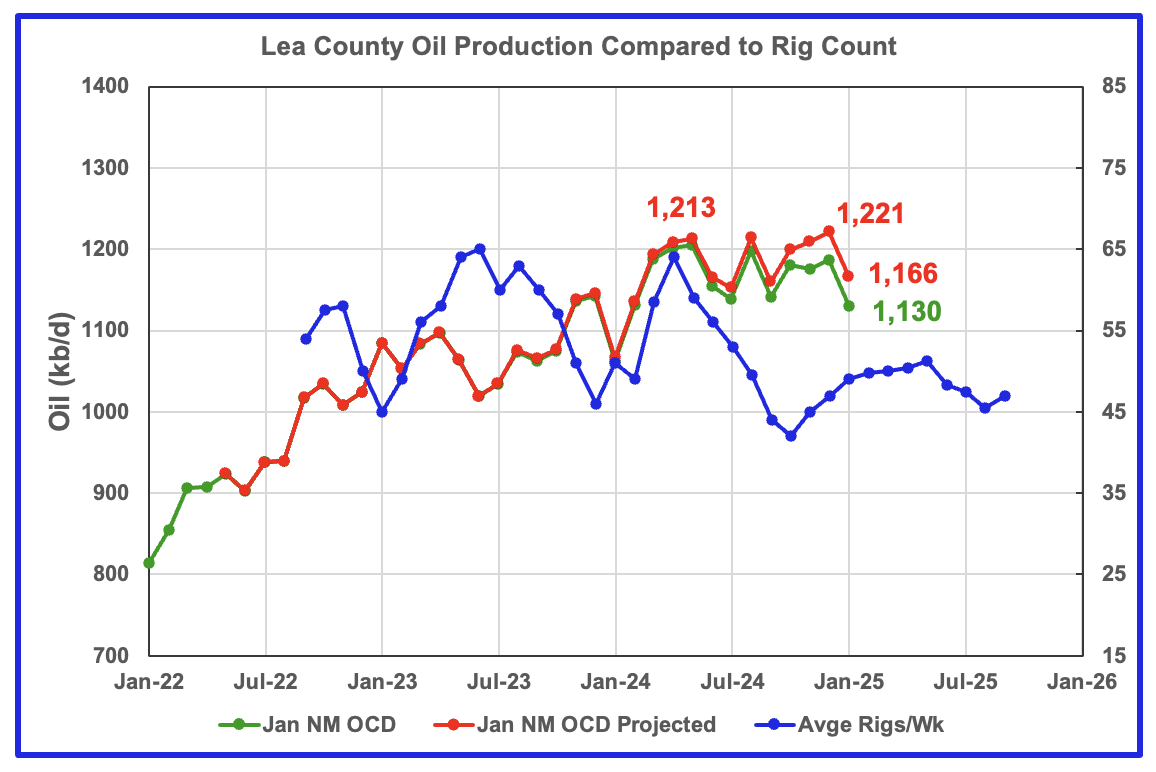
Lea County’s oil production appears to have entered a plateau phase in May 2024 at 1,213 kb/d. December production saw a projected high of 1,221 kb/d followed by 55 kb/d drop in January to 1,166 kb/d. Preliminary January data from New Mexico’s Oil Conservation Division (OCD) indicates Lea County’s oil production decreased by 47 kb/d to 1,130 kb/d.
Production has been essentially flat since May 2024 as the rig count fell. While January shows a large production drop, it is not clear whether this drop is geology related, related to the low frac spread count that occurred in January or cold weather.
The blue graph shows the average number of weekly rigs operating during a given month as taken from the weekly rig chart. The rig graph has been shifted forward by 8 months. So the 64 Rigs/wk operating in August 2023 have been time shifted forward to April 2024 to show the possible correlation and time delay between rig count, completion and oil production.
Comparing the flattening oil production since May with the dropping time shifted rig count, indicates/implies the newer wells drilled since June had higher IPs to offset the decline associated with the fewer wells drilled by the declining rig count. The rising rig count starting in November 2024 may be able to slow the declining/flattening production in Lea County but the writing on the wall is saying that Lea County is close to peak production.
Note that rig counts are being used to project production as opposed to completions because very few extra DUCs are being completed at this time.
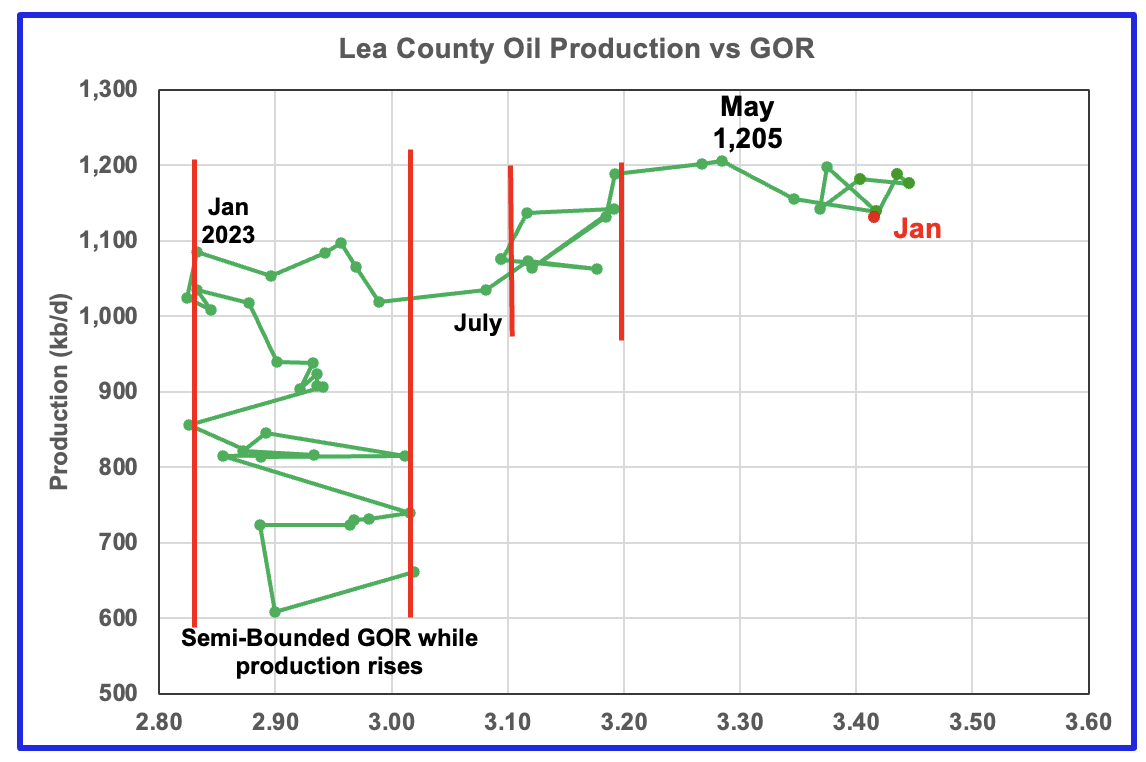
After much zigging and zagging, oil production in Lea county stabilized just below 1,100 kb/d in early 2023. Once production reached a new high in January 2023, production appeared to be on a plateau while the GOR started to increase rapidly to the right and entered the bubble point phase in July 2023.
Since July 2023 the Lea County production has continued to increase as the GOR remained within a second semi-bounded region. This may indicate that the recent additional production is coming from a new bench/field since the GOR’s behaviour since August 2023 to March 2024 time frame appears once again to be in a semi bounded GOR phase accompanied with rising production.
The GOR moved out of the second semi-bounded GOR region in April and hit a new high in May. Since July the GOR has bounced around 3.4. January saw a production drop as the GOR dropped slightly to 3.42.
This zigging and zagging GOR pattern within a semi-bounded GOR while oil production increases to some stable level and then moves out to a higher GOR to the right has shown up in a number of counties. See a few additional cases below.
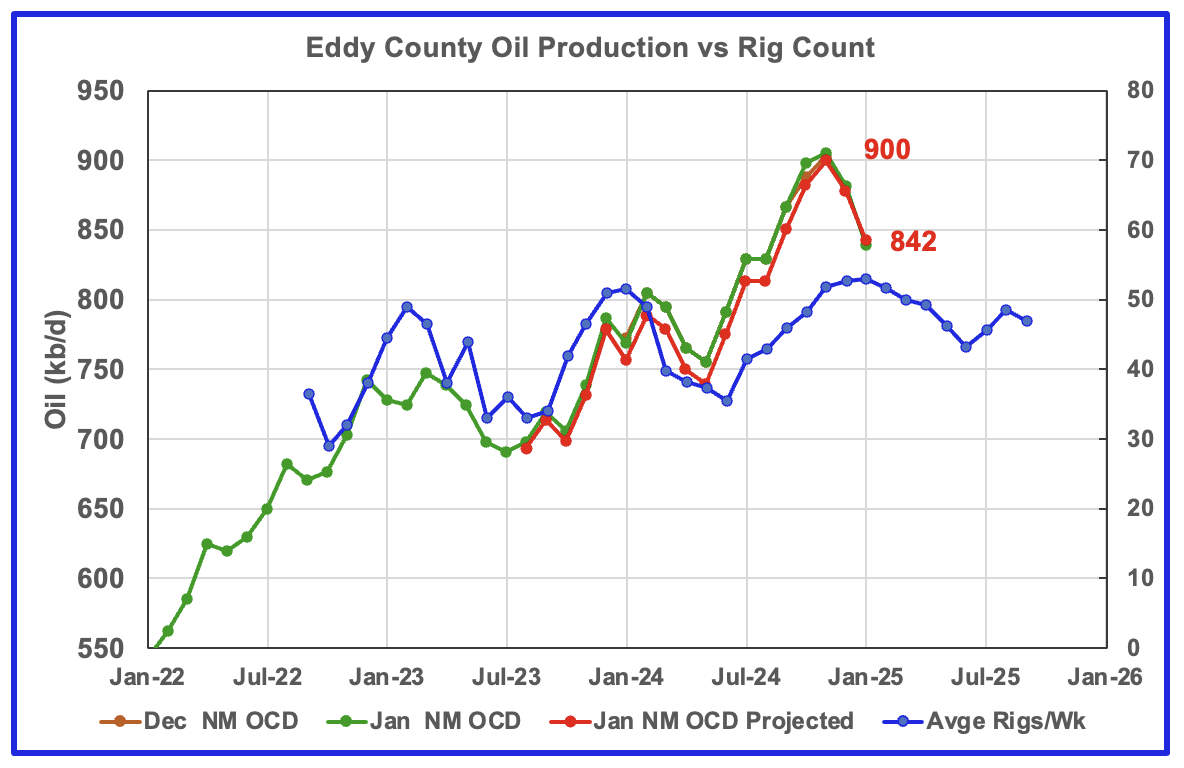
January’s projected oil production dropped by 36 kb/d to 842 kb/d and is the second monthly production drop since rising steadily since June 2024.
Eddy County’s oil production first peaked in February 2024. After dropping for three months, the number of rigs and associated wells increased and so did oil production. From May to November, production rose from 739 kb/d to 900 kb/d, an increase of 161 kb/d, while essentially paralleling the increasing rig count. Over that same time shifted rig period, 14 to 15 rigs were added to Eddy County as production rose. Was a new Tier 1 region/shelf discovered to attract such a large increase in the rig count?
In November the projected oil production increased by 18 kb/d to a new high of 900 kb/d. This smaller increase relative to previous months also appears to reflect the production impact associated with the slowing increase in the rig count.
The blue graph shows the average number of weekly rigs operating during a given month as taken from the above weekly drilling chart. The rig graph has been shifted forward by 8 months to roughly coincide with the increase in the production graph starting in November 2023.
Clearly the production rise up to November 2024 is closely associated with the rise in the rig count and associated well completions delayed by roughly 8 months. The smaller November increase is the second clue that the production rise associated with increasing rigs is about to end. The flattening rig count starting in December 2024 implies that production in Eddy county may be heading into a short term plateau phase around 850 kb/d before starting to decrease.
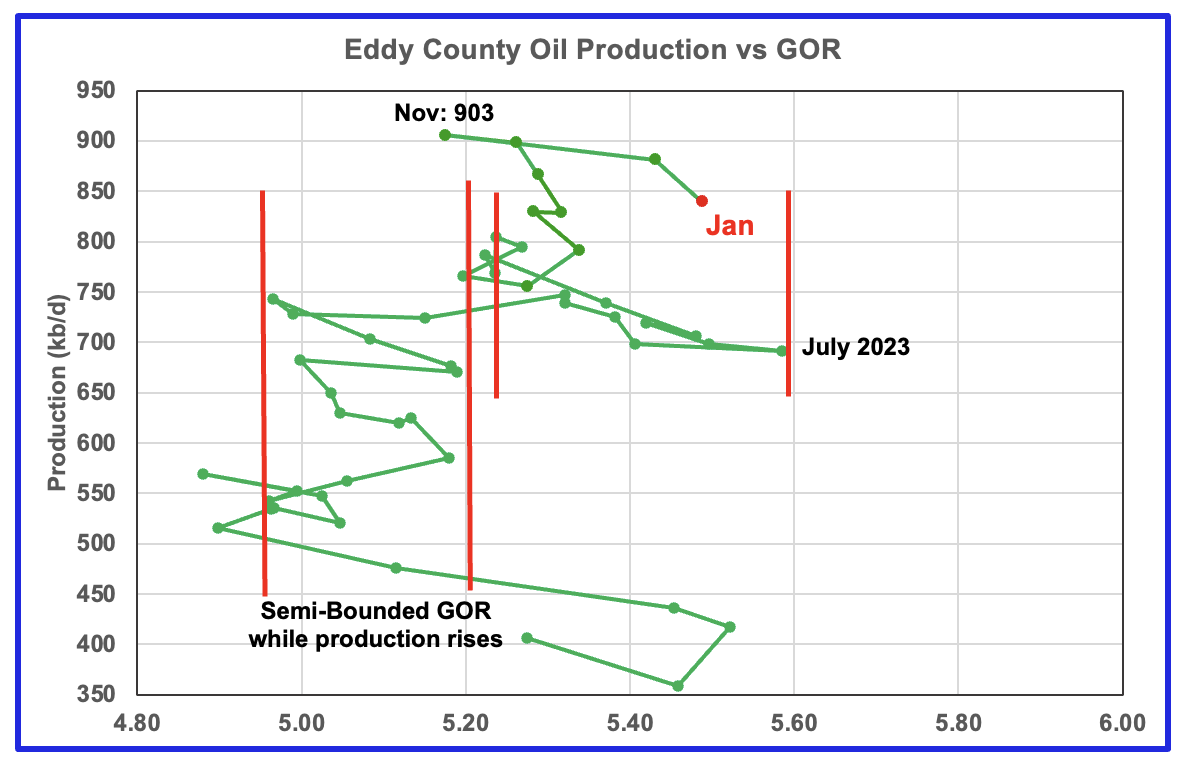
The Eddy county GOR pattern is similar to Lea county except that Eddy broke out from the semi bounded range earlier and for a longer time and then added a second semi bounded GOR phase. For January New Mexico’s Oil Conservation Division (OCD) reported oil production decreased by 42 kb/d to 839 kb/d and stayed within the second semi-bounded region.
Note the big increase in the GOR from November to January. Interesting to see what February brings.
Texas Permian
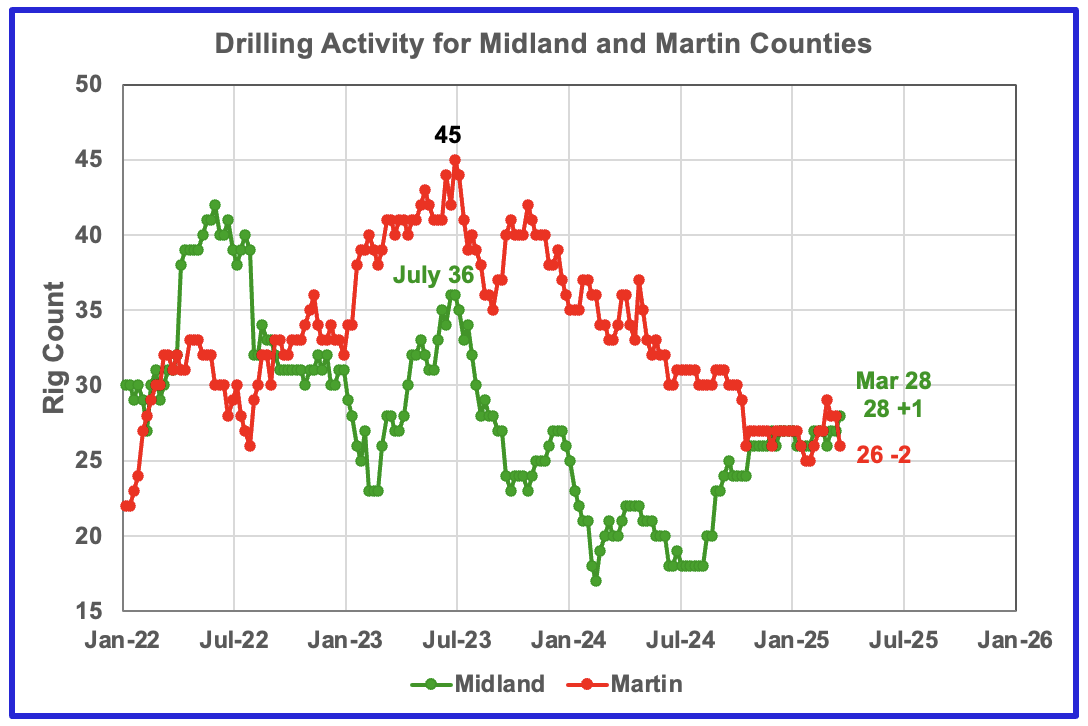
The Midland county rig count has been rising since July and is up 10 to 28 at the end of March. The opposite is true for Martin county. On March 28, 26 rigs were operational, down 19 from 45 in July 2023.
Since the end of October drilling in the Midland and Martin counties has been very steady between 26 and 28 rigs, respectively, except for January 31 when Martin dropped to 25.
Oil Production in Texas Counties
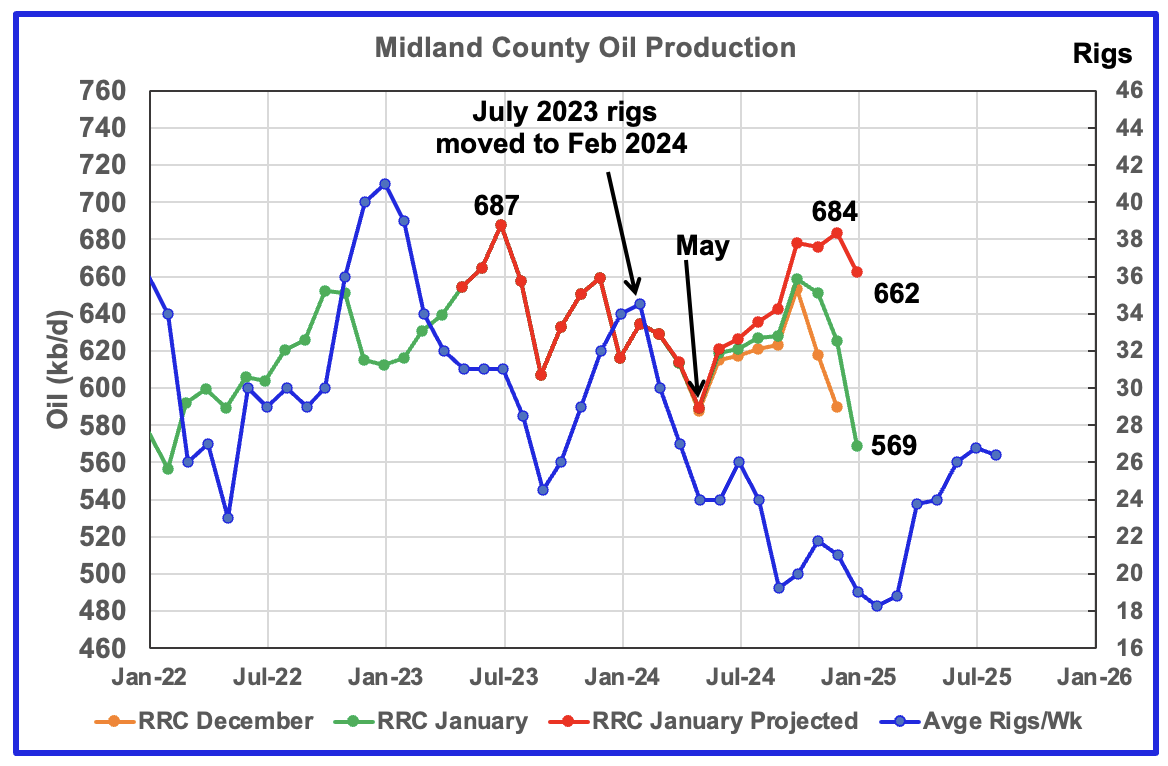
January’s projected production dropped 22 kb/d to 662 kb/d. December production of 684 kb/d may be slightly optimistic. Preliminary Texas January RRC production dropped 56 kb/d to 569 kb/d.
The orange and green graphs show the oil production for Midland County as reported by the Texas RRC for December and January. The red graph uses the December and January data to project production as it would look after being updated over many months.
Even though the rig count is dropping, I think the increase in the projected production after May is real based on the increasing preliminary production shown from June to October in the latest January RRC data. Flat October to December production is signalling an imminent production peak/plateau.
The blue graph shows the average number of weekly rigs operating during a given month as taken from the weekly drilling chart. The rig graph has been shifted forward by seven months. So the average 34.5 Rigs/wk operating in July 2023 have been moved forward to February 2024 to show the possible correlation and time delay between rig count, completions and oil production. If the seven month shift in the rig count is approximately correct in that oil production can be tied to the rig count, oil production in Midland county should increase starting in April for a month or two before resuming its decline.
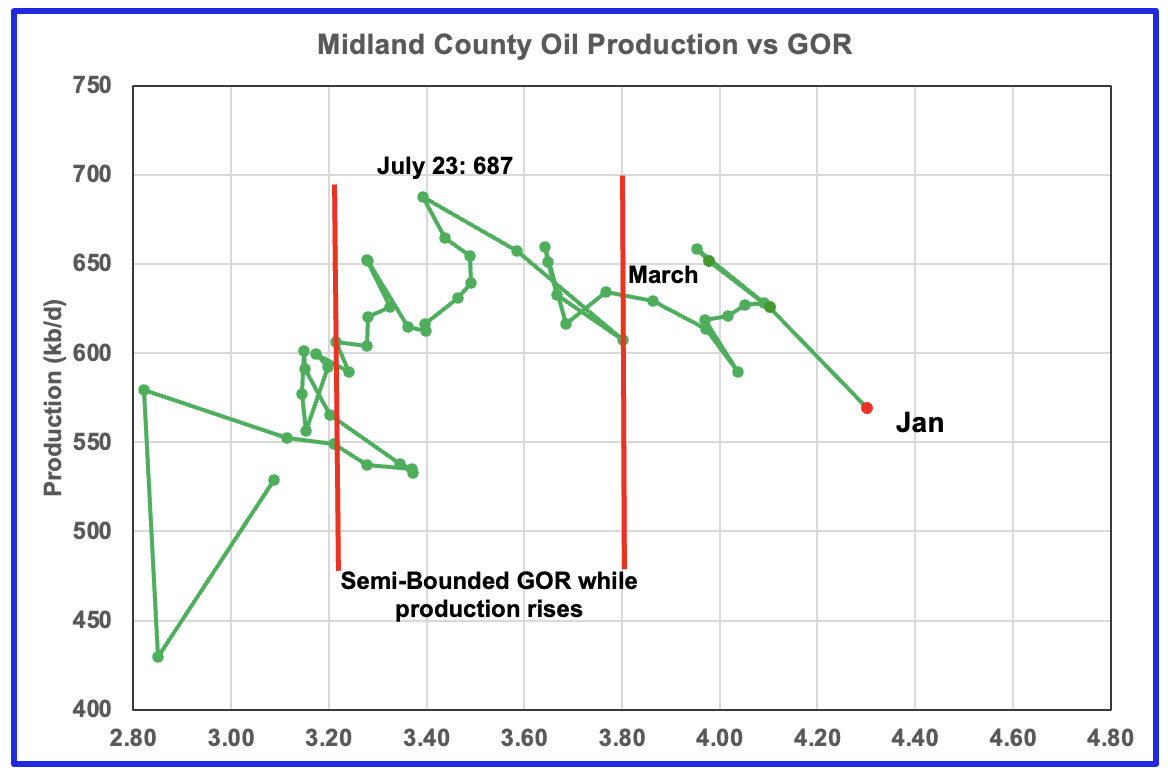
For January the GOR ratio increased to 4.30, a new high, while reported preliminary oil production dropped.
With Midland county into the bubble point phase, oil production and the GOR have stayed within a narrow range outside of the initial Semi-Bounded GOR region since March. January GOR broke to a new high and preliminary production came in at a new low since the July 2023 production high.
The oil production and GOR shown in this chart are based on the RRC’s January production report. Note that while the last few months are subject to revisions, the July 2023 to May 2024 production data has been steady for a number of months.
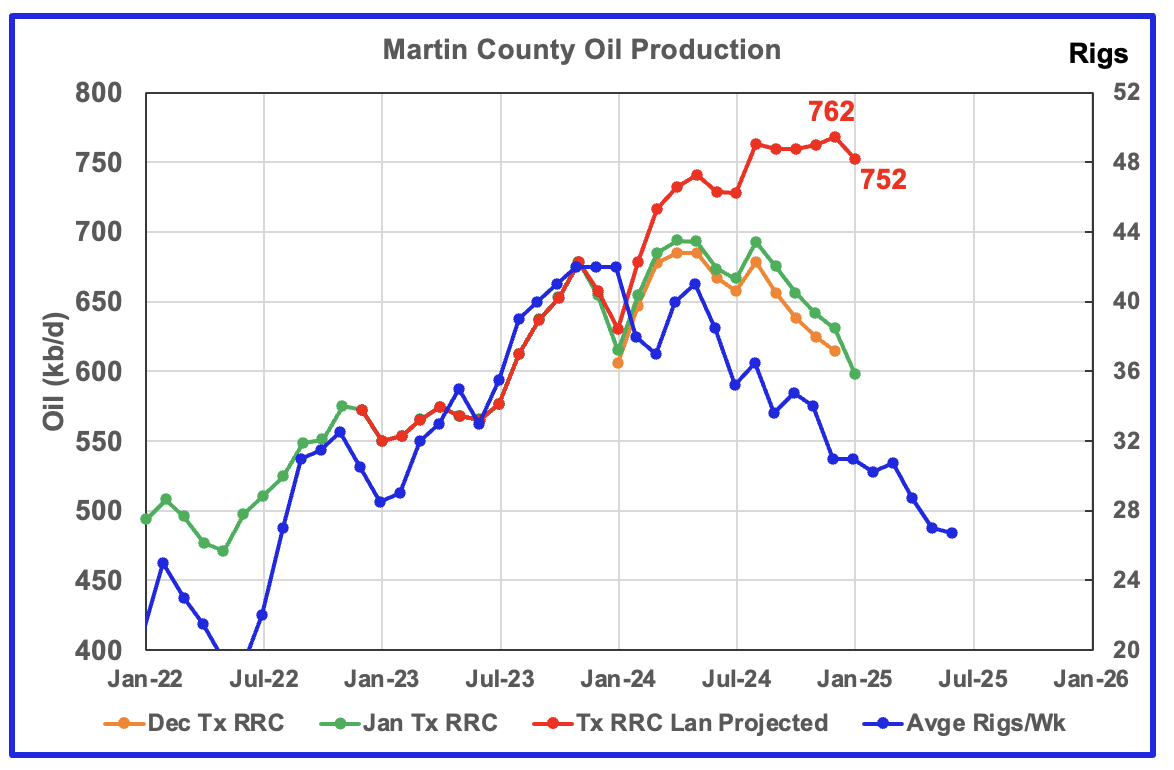
Martin county’s projected January oil production decreased by 10 kb/d to 752 kb/d.
The orange and green graphs show the production for Martin County as reported by the Texas RRC for December and January. The blue chart shifts the rig count ahead by 6 months.
The red graph is a projection for oil production as it would look after being updated over many months. This projection is based on a methodology that uses preliminary December and January production data. The green graph shows oil production reported by the Texas RRC for January and it is slightly lower than December’s. Note how production has been in plateau phase from August to December before dropping in January.
Martin County’s projection is slightly optimistic due to production revisions back to November 2023 and is over projected somewhere between 25 kb/d and 50 kb/d.
My best guess for Martin County production is that it is on a plateau closer to 720 kb/d and on the verge of starting to decline. A note of caution here because the January drop could be related to a combination of the low January frac spread count and colder weather.
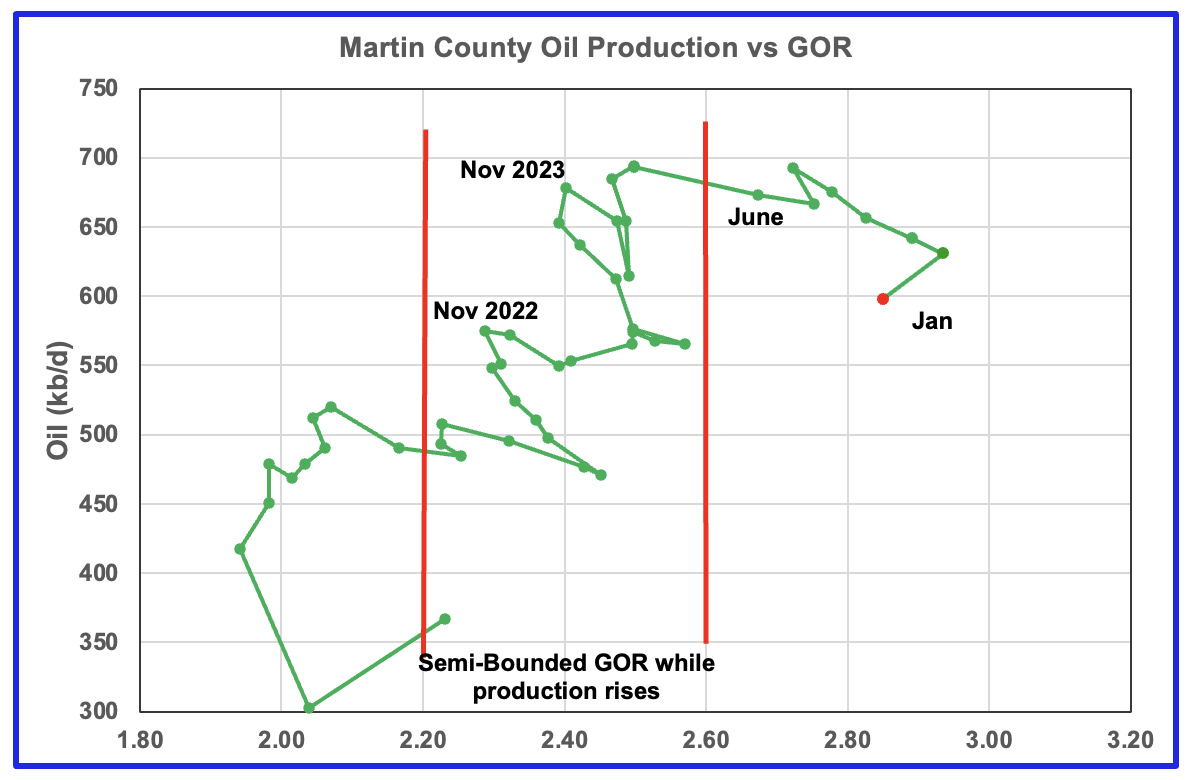
Martin county’s oil production after November 2022 increased and at the same time drifted to slightly higher GORs within the semi bounded range. However the June 2024 GOR saw its first move out of the semi bounded region. The preliminary Texas RRC’s January production for Martin county shows a decrease in both the GOR and oil production.
Martin county has the lowest semi-bounded GOR boundary of the four counties at a GOR of close to 2.60 but for January dropped slightly from 2.93 in December to 2.86. Nevertheless, it is clearly out of the semi-bounded region. Martin County has now entered the bubble point phase that should result in a dropping oil production trend.
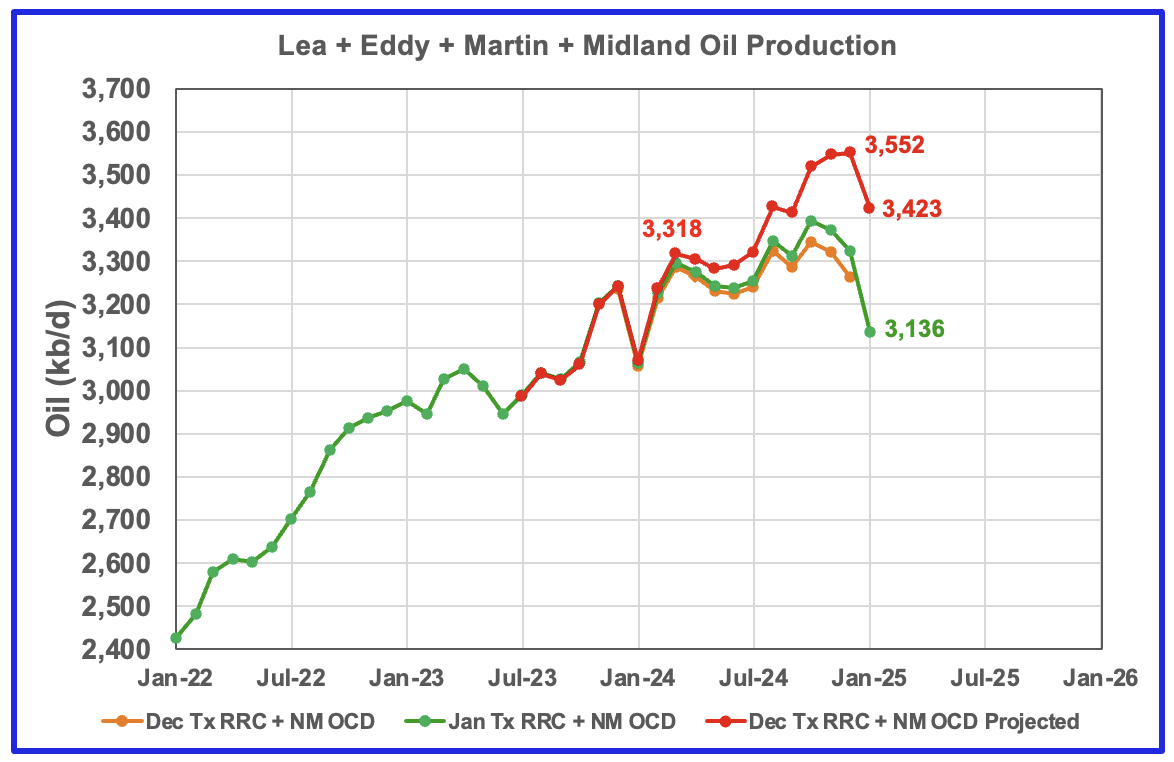
This chart shows the total oil production from the four largest Permian counties. Assuming that current January Permian production is close to 6,400 kb/d, these four counties account for close to 54% of the total. The projection is slightly optimistic because both Martin and Midland county’s production was slightly optimistic. A more realistic projection would be closer to a plateau, possibly showing up next month.
The December and January initial production data is shown in the orange and green graphs respectively. The red graph uses the December and January data to project an estimate for the final January production. The January drop is related to the drop in all four counties.
The projection indicates that January production from these four counties decreased by 129 kb/d to 3,423 kb/d. The combined preliminary January production data is lower than December’s by 189 kb/d to 3,136 kb/d and implies the January decrease is real. Again, the January drop could be related to the January low frac spread count and cold weather.
These charts and those below lend credence to what is being reported in this Article. “U.S. oil producers are grappling with geological limits to production growth as the country’s top oilfield ages and produces more water and gas and less oil – and may be nearing peak output.”
“Relentless drilling to reach record production has exhausted the core of the Permian’s two largest sub-basins: nearly two-thirds of the Midland formation’s core has been drilled, and slightly more than half in the Delaware formation, according to data from analytics software company Novi Labs.
“We’ve never been in a position before where we were on the back-half of the inventory story of the Permian basin,” Novi Labs head of research Brandon Myers said.
That has rung alarm bells across the industry, as drilling in the fringes of the basin, on lower-quality prospects, means less oil output and more water and gas. At conferences and on earnings calls, analysts and executives are discussing the issue with a growing sense of urgency.”
Findings
– The January production data was in good general and most of the projections are reasonable with only a few being slightly optimistic. Of all of the production charts above and below, only one is showing a production increase for January. In general all of the four county production charts are in a plateau phase. Taking into consideration that the price of WTI is stuck close to $70/b, the rig count is holding steady around 445 and the continuing lower frac spread count and the plateauing of the four biggest counties, taken all together all point to peak production in the onshore lower 48 within the next six months.
– Lea county may have entered a plateau phase in May 2024. While oil production is not following the rig count graph directly, the dropping rig count is resulting in Lea production currently being on a plateau. The January production drop could be a combination of low completions associated with the low January frac spread count and cold weather.
– Eddy County’s oil production initially peaked in February 2024. It started a new increasing phase in June as it followed the uptrend in the rig count and exceeded its previous February peak. Production peaked in November 2024 and is now in decline and possibly heading into a lower production plateau phase.
– Midland county peaked in July 2023 and has roughly followed the declining rig count graph up to May 2024. It appears to have started a new increasing phase in June 2024 and entered a plateau phase in October.
– Martin County may have peaked in August 2024 and may have entered a plateau phase. The January production revisions have created an over optimistic production profile. Regardless Martin county has been on a plateau closer to 720 kb/d for the last six months.
– All four of the largest Permian oil producing counties are now in their plateau phase with all four hinting that the decline phase is close at hand. Need a few more months of data to clarify the future growth/decline trend of these four counties.
Texas District 8
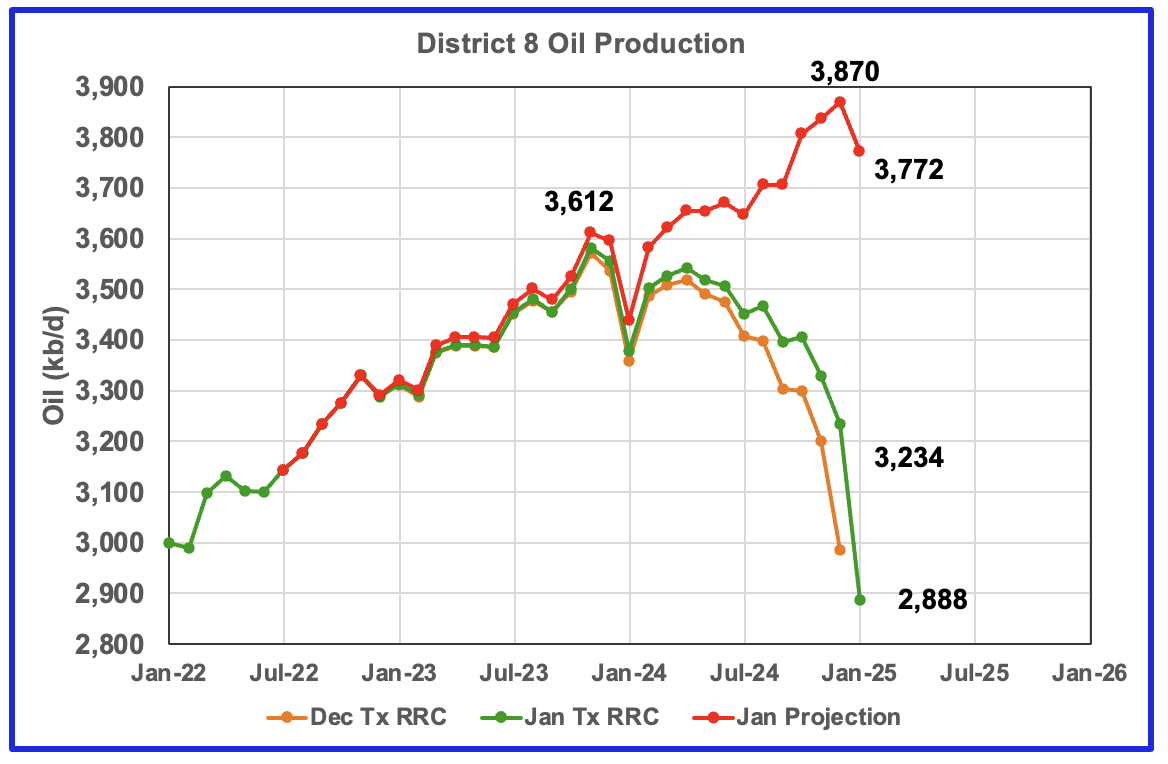
The large number of small revisions to the previous months in the January report has made the production increase in District 8 slightly optimistic. This optimistic increase hopefully will be corrected in the next report. Regardless a portion of the increase is real and the January drop is real. Note how the preliminary January 2025 production is lower than December’s.
Texas District 8 contains 20 counties. Of the 20, five are reviewed in this post, Midland, Martin, Loving, Reeves and Howard. From January 2024 to December 2024, production in District 8 increased by 431 kb/d. Of the 431 kb/d increase, those five counties accounted for 280 kb/d or 65%.
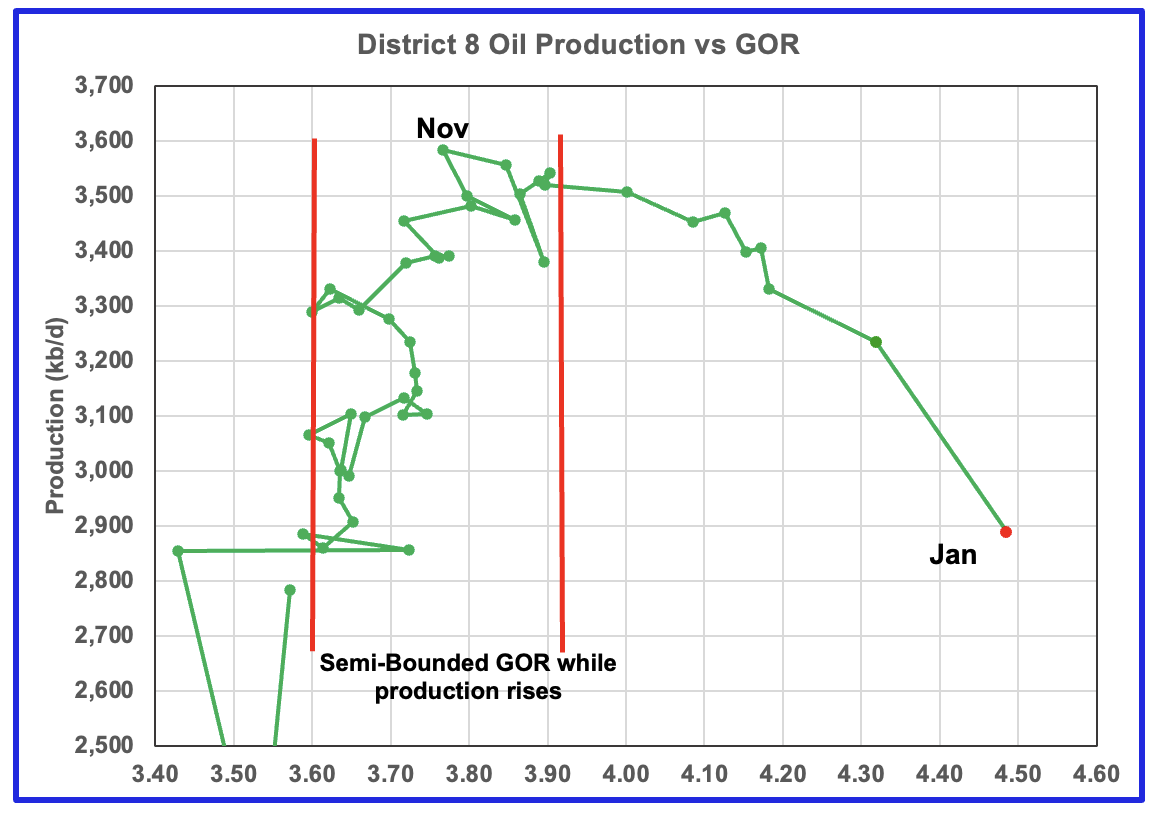
While the revisions in the production chart affect the projection, it does not affect the GOR.
Plotting an oil production vs GOR graph for a district may be a bit of a stretch. Regardless here it is and it seems to indicate many District 8 counties may well be into the bubble point phase. The GOR continues to increase and reached another new high of 4.49. This is another indicator that implies District 8 has passed peak production.
Oil Production and GOR Charts for a number of Larger Texas Oil Producing Counties
Below are the next five top oil producing counties in Texas.
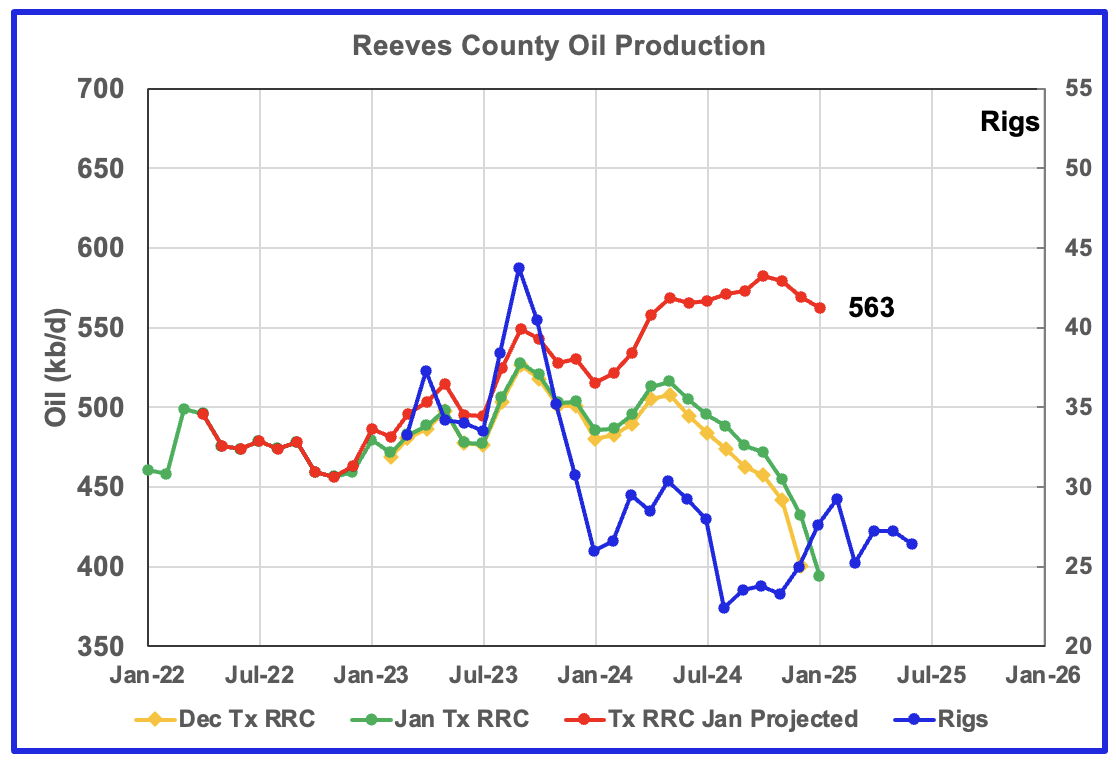
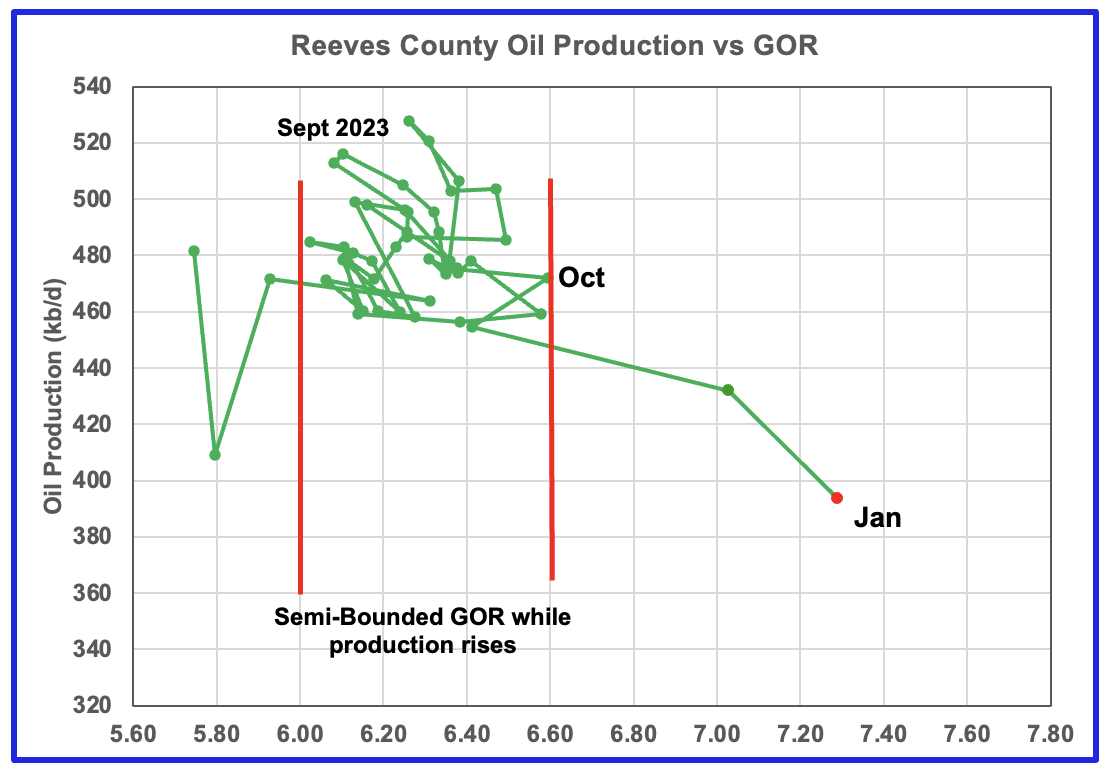
January oil production for Reeves county indicates that production has continued to drop since November and may have peaked in October. The GOR chart indicates that Reeves County entered the bubble point phase in December and production is starting to fall.
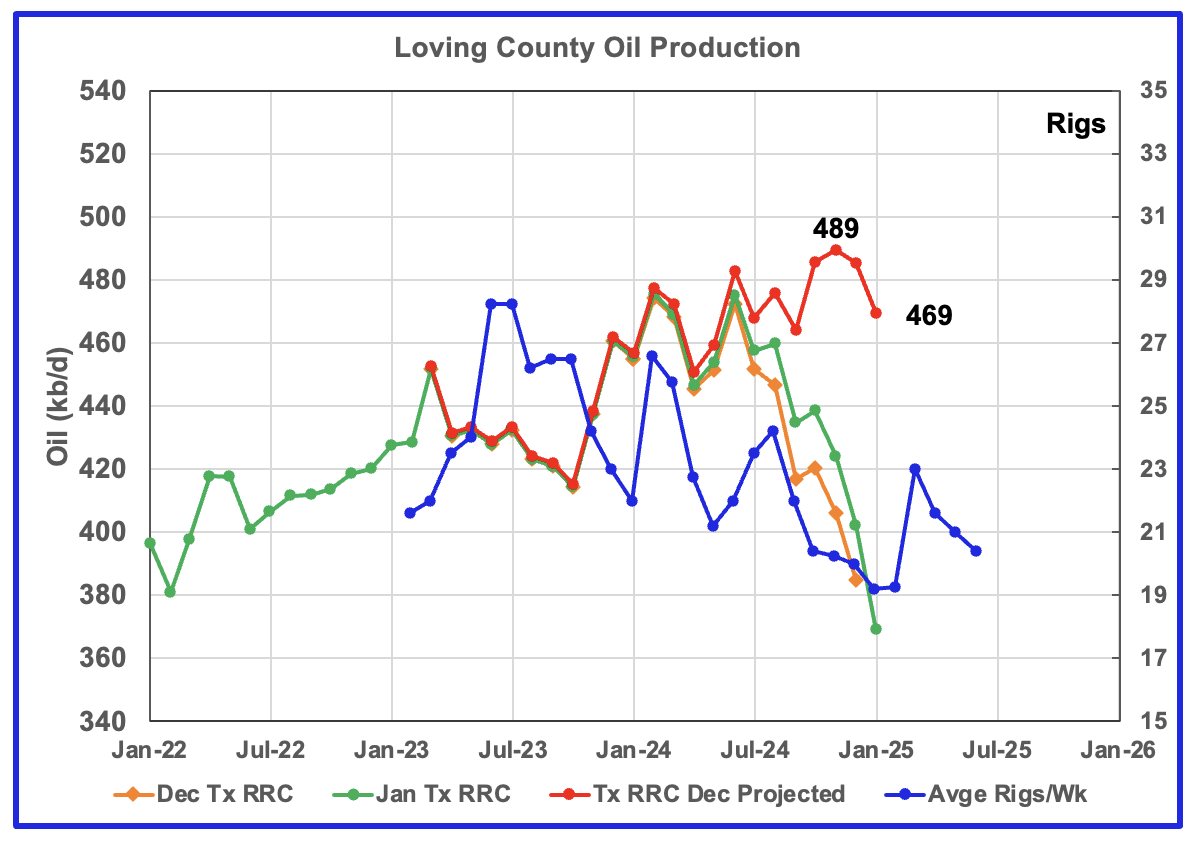
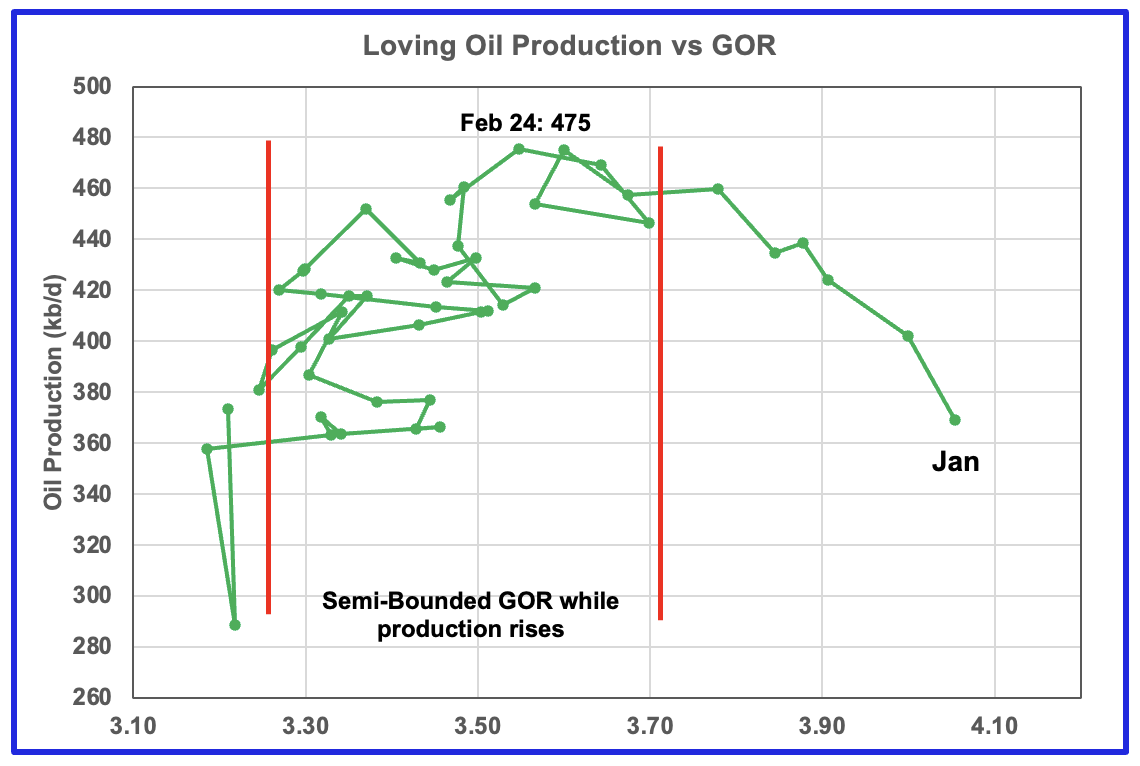
Loving county production has peaked and is supported by the steadily increasing GOR.
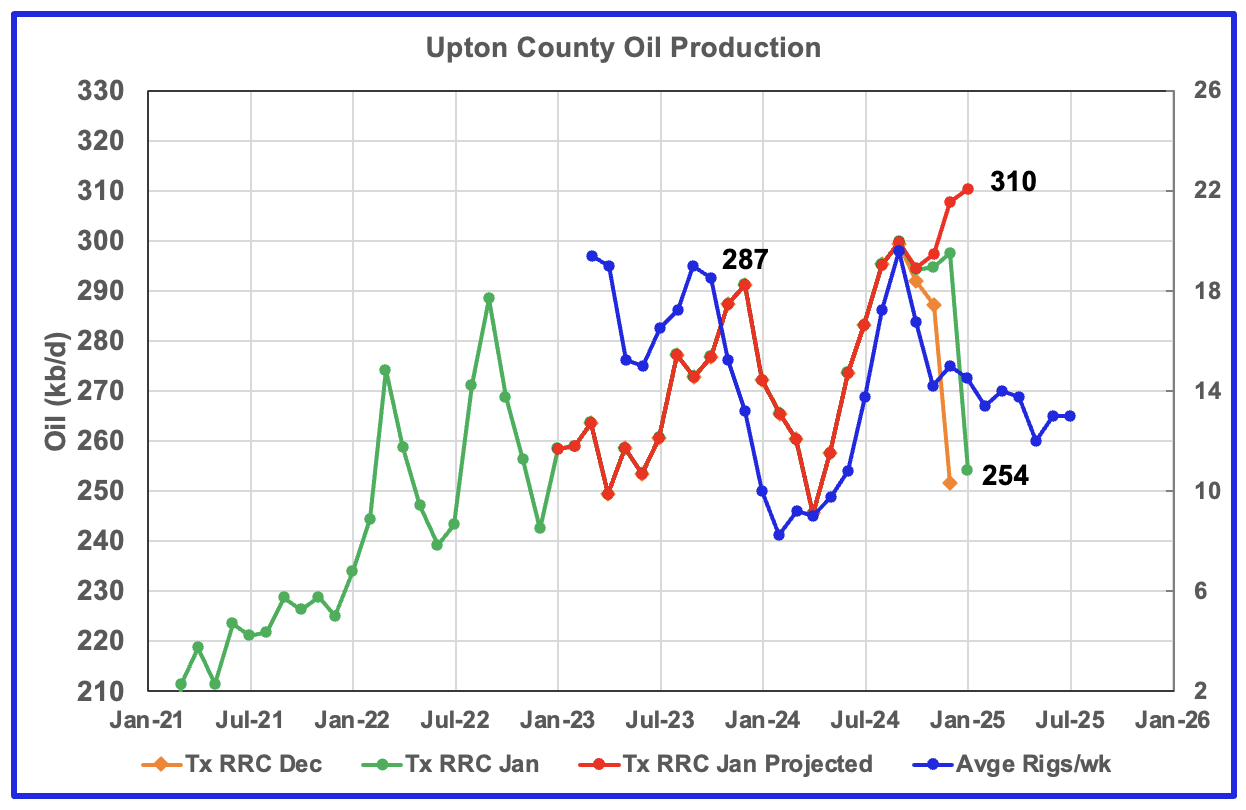
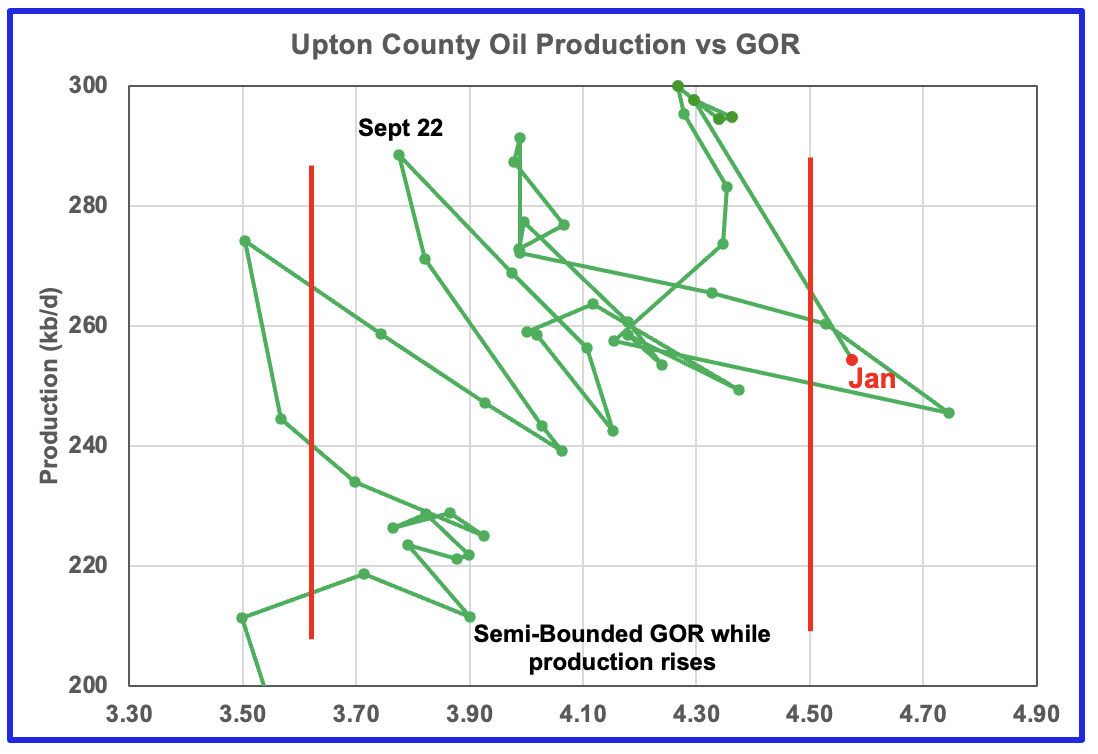
Upton county production has followed the rig count graph since January 2024 and may have peaked in September. January saw a large drop in the preliminary production and the GOR may be on the verge of clearly moving out to the semi-bounded GOR region. Revisions to production from earlier months are making the forecast slightly optimistic.
The rig graph in the oil production chart has been shifted forward by six months.
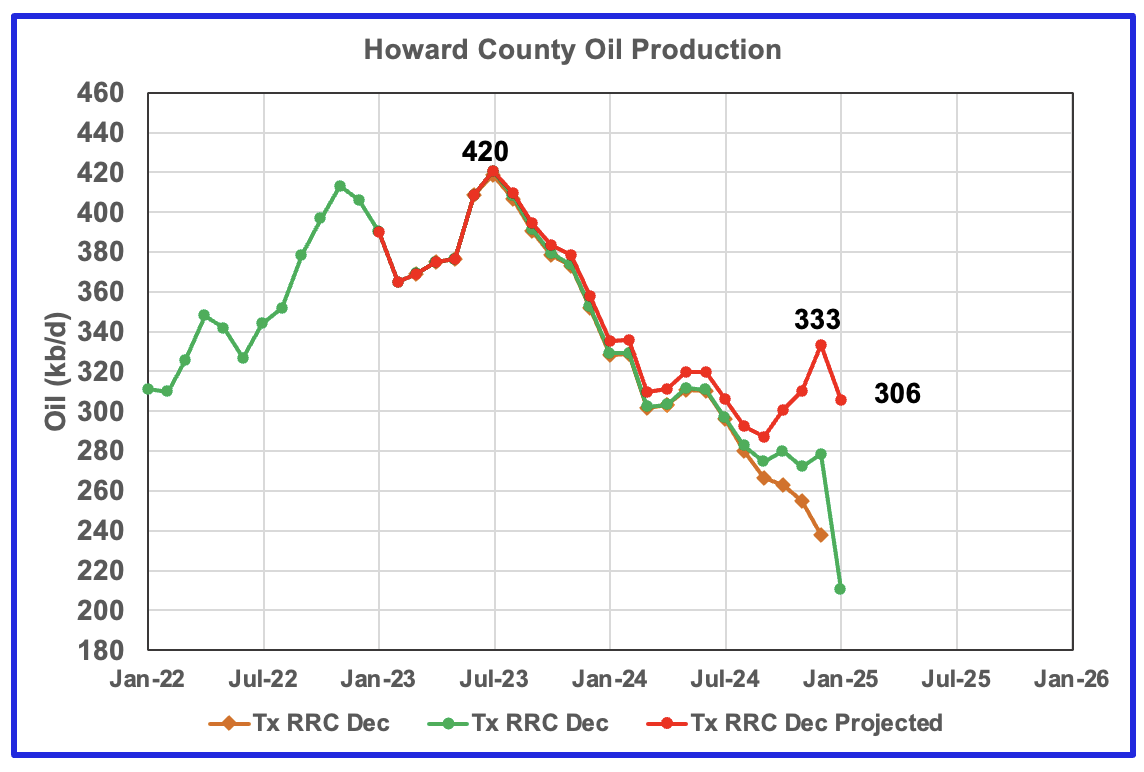
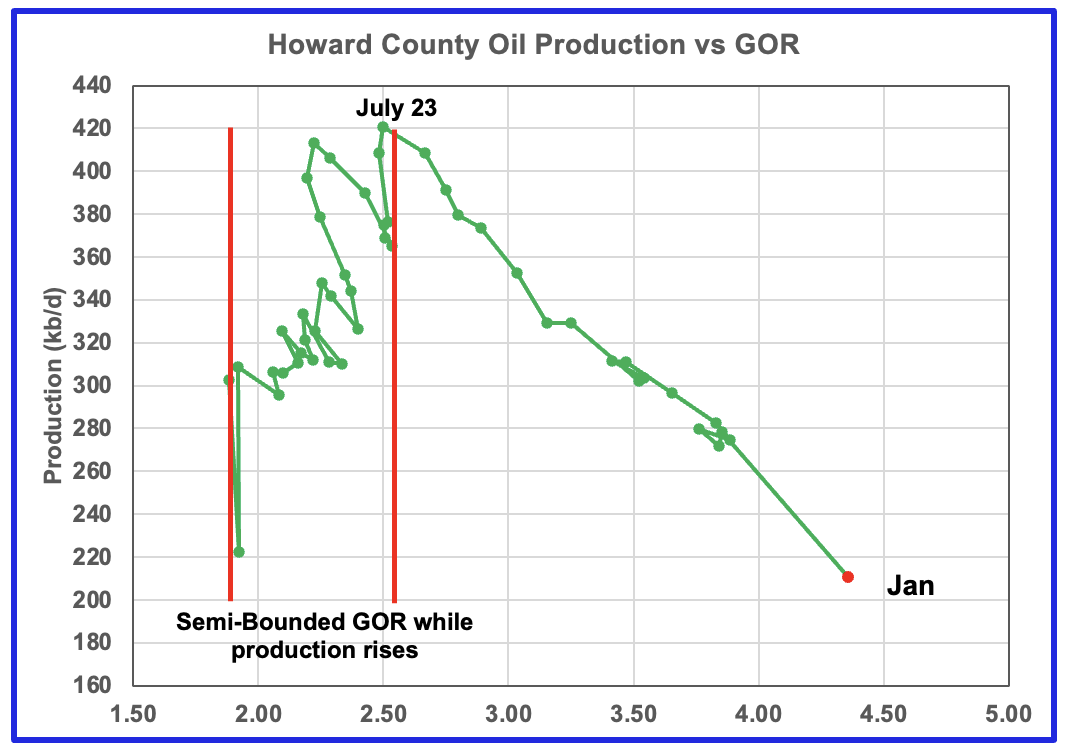
Howard county peaked in July 2023 at 420 kb/d. Note the rapid movement of the GOR to higher ratios once it broke out of the Semi-Bounded GOR range. While the GOR has risen to new highs, production has kept on falling. However the production rise shown after July in the projection graph may be overdone.
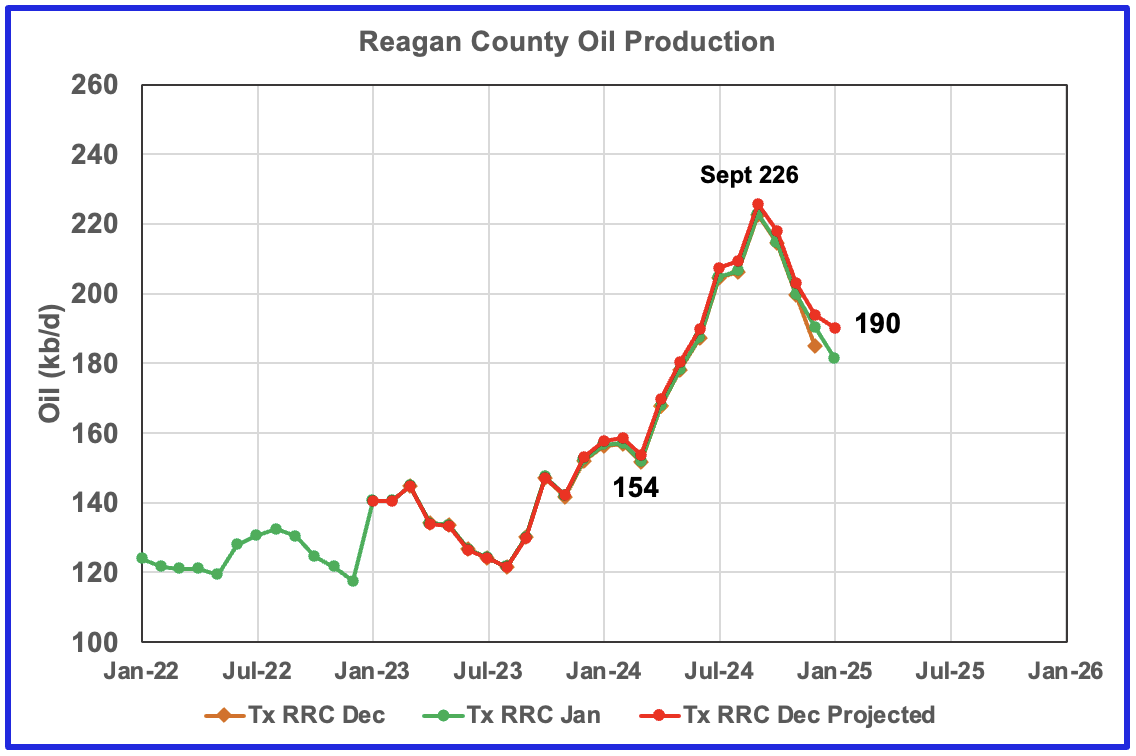
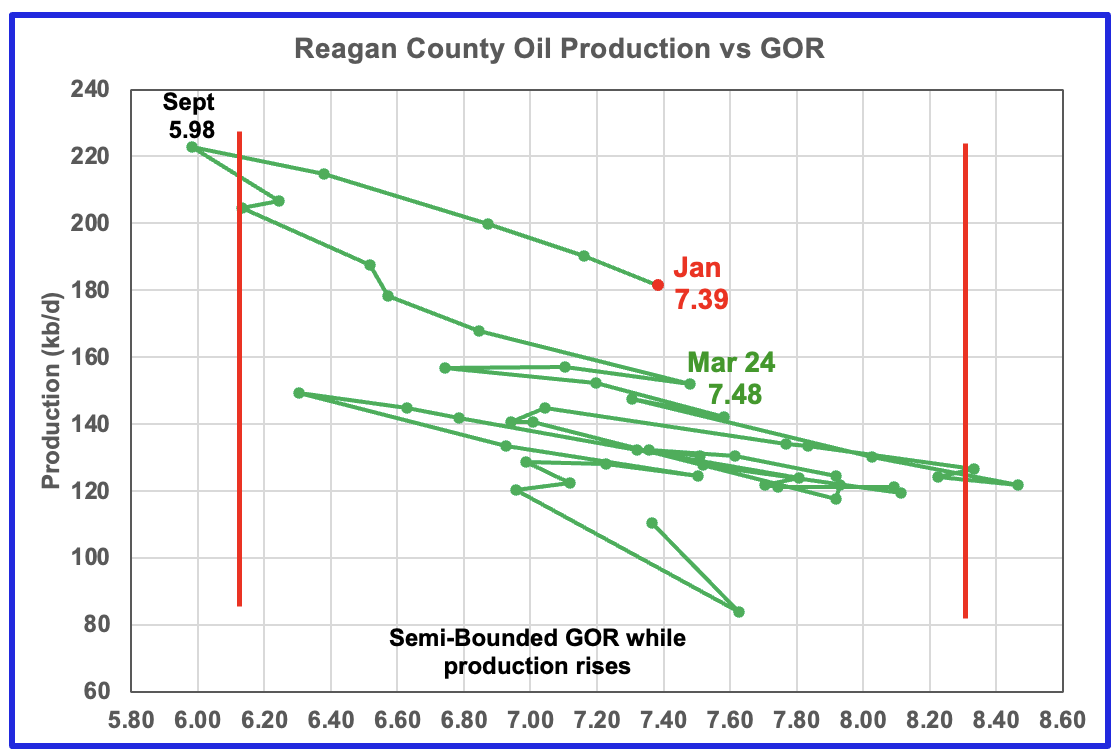
Reagan county has oil wells with a very high a GOR. The production chart indicate that oil production has been falling since September along with an increasing GOR, an indication that Reagan county could be gassing out.
Starting in March 2024, output increased by 72 kb/d to a peak of 226 kb/d in September 2024. At the same time the GOR fell to a new low of 5.98. These new wells must have had a very low GOR to drop the average GOR from 7.48 to 5.98. After the September production peak, the GOR began to rapidly increase to the current level as production fell.
Drilling Productivity Report
The Drilling Productivity Report (DPR) uses recent data on the total number of drilling rigs in operation along with estimates of drilling productivity and estimated changes in production from existing oil wells to provide estimated changes in oil production for the principal tight oil regions. The new DPR report in the STEO provides production up to February 2025. The report also projects output to December 2026. The DUC charts and Drilled Wells charts are also updated to February 2025.
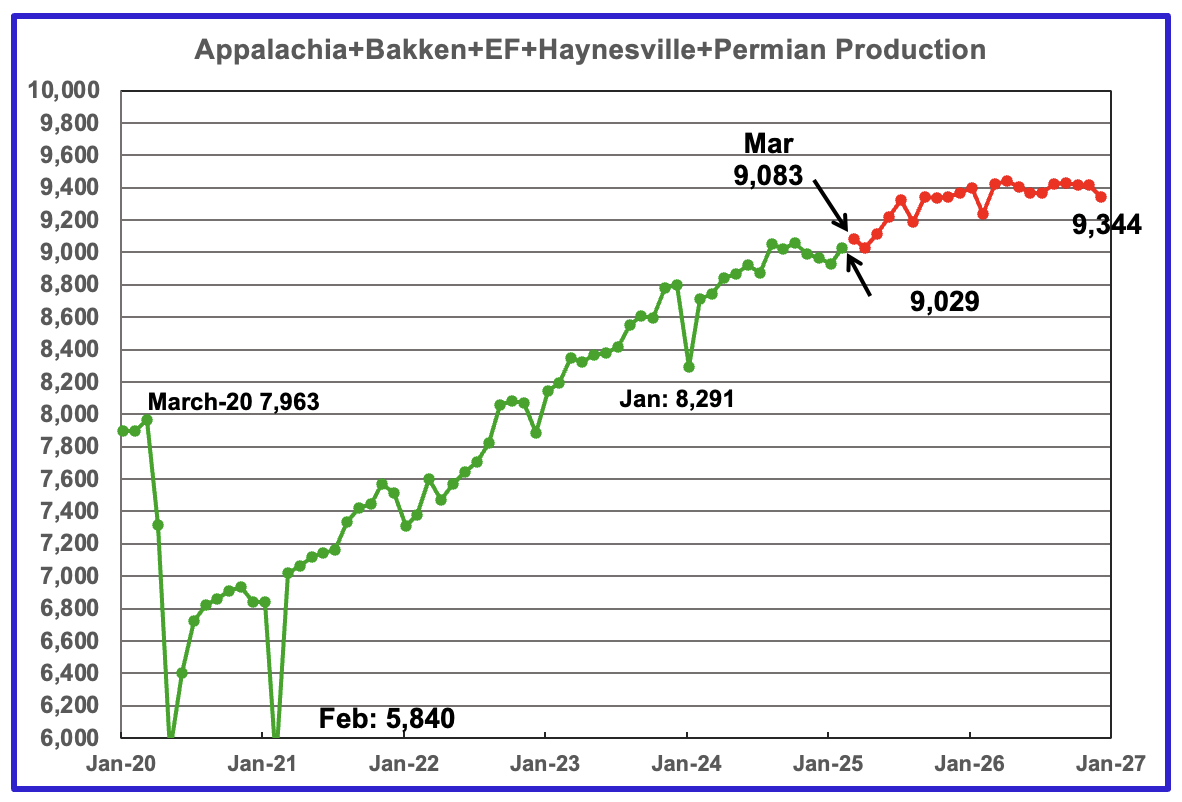
The oil production for the 5 DPR regions tracked by the EIA’s STEO is shown above up to February 2025. Also the March 2025 STEO projects production out to December 2026, red markers. Note DPR production includes both LTO oil and oil from conventional wells. DPR oil production for the Anadarko and Niobrara regions is no longer available.
The February oil output in the five DPR regions increased by 99 kb/d to 9,029 kb/d. Production is expected to rise by 54 kb/d in March to 9,083 kb/d. Note the sharp production rise of 320 kb/d from April 2025 to June 2025. After that, production growth slows. Considering the flat rig count and low completion rate, it is not clear why production should rise over this period.
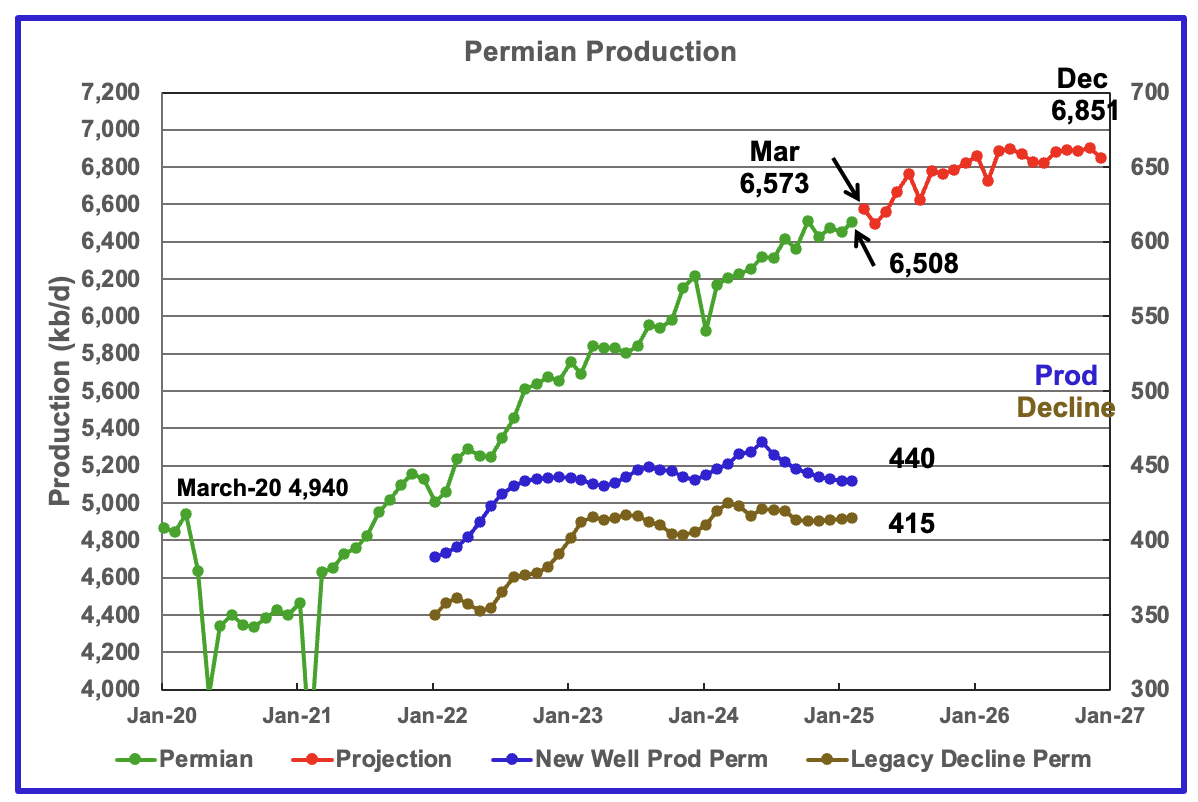
The EIA’s March STEO/DPR report shows Permian output in February decreased by 57 kb/d to 6,508 kb/d. From March 2025 to December 2026 output is expected to rise by 278 kb/d to 6,851 kb/d. Also note how production rises by 269 kb/d from April to June 2025 and then the production growth rate slows.
Production from new wells and legacy decline, right scale, have been added to this chart to show the difference between new production and legacy decline. Notice the steady decline in new well production over the past eight months.
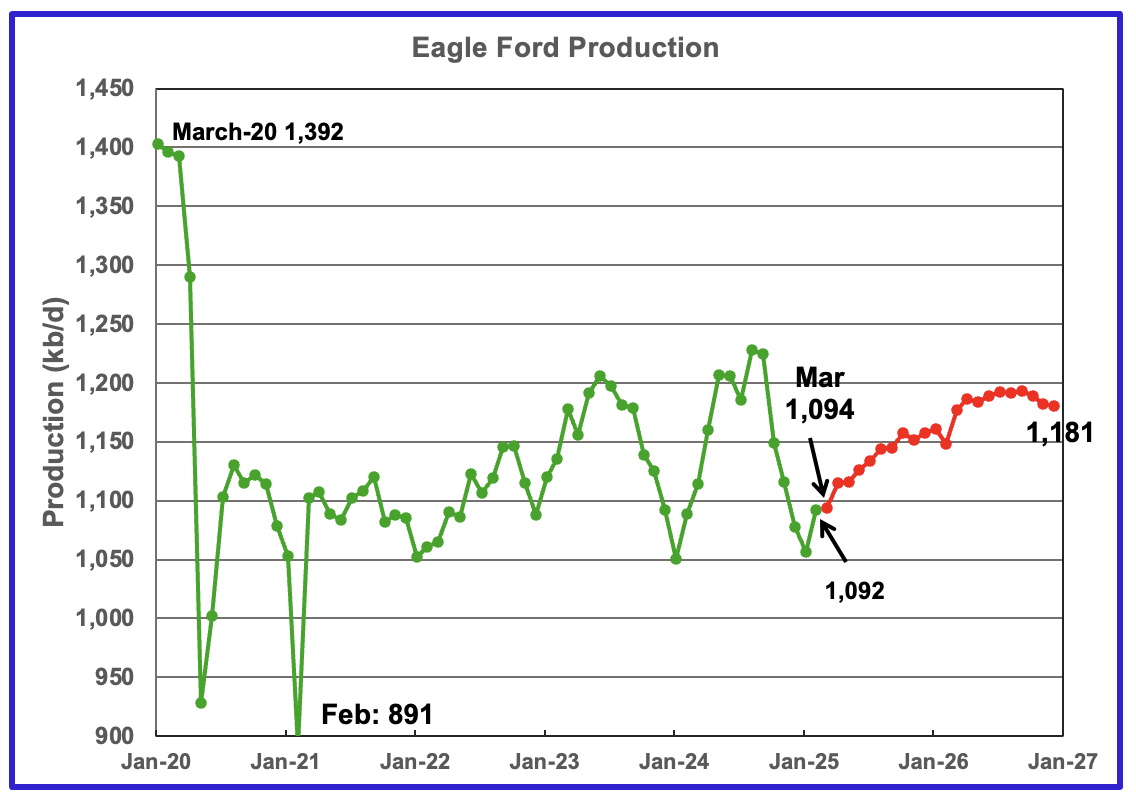
Output in the Eagle Ford basin had been increasing since January 2024 and appears to have peaked in August 2024 and then dropped every month until January 2025. February production increased by 35 kb/d to 1,092 kb/d. March 2025 production is forecast to increase by 2 kb/d to 1,094 kb/d.
Production over the next two years is expected to peak in September 2026 at 1,193 kb/d. Output in December 2026 expected to be 1,181 kb/d.
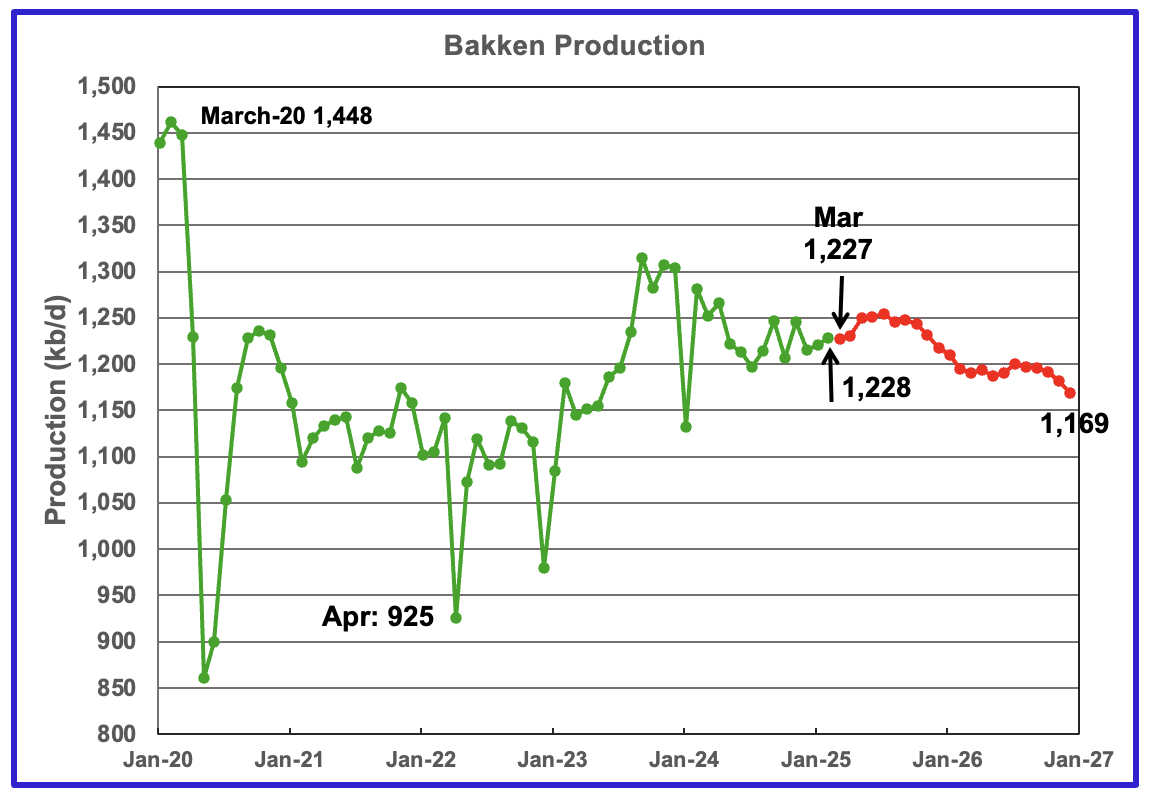
The DPR/STEO reported that Bakken output in February rose by 8 kb/d to 1,228 kb/d. The STEO/DPR projection, red markers, shows output to be essentially in decline after July 2025, dropping to 1,169 kb/d in December 2026.
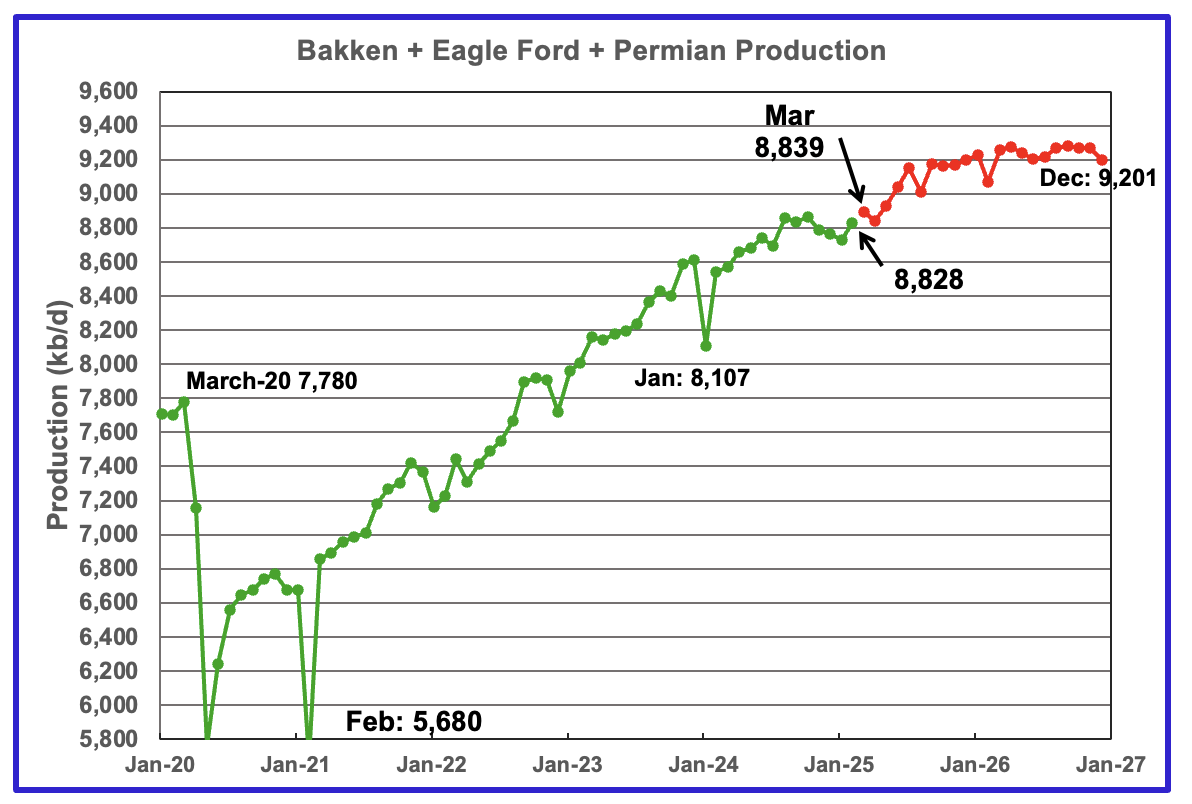
This chart plots the combined production from the three main LTO regions. For February output rose by 100 kb/d to 8,828 kb/d. Production for December 2026 is forecast to be 9,201 kb/d.
DUCs and Drilled Wells
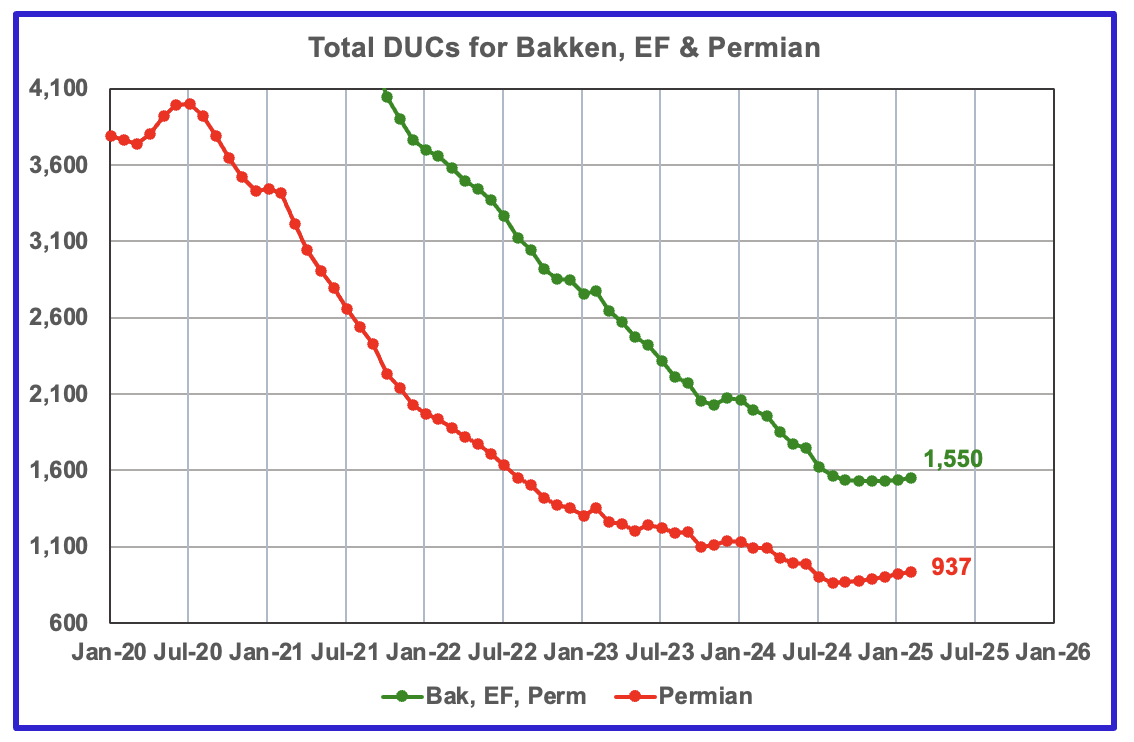
The number of DUCs available for completion in the Permian and the three major DPR regions has fallen every month since July 2020 to December 2024. February DUCs rose by 14 to 1,550. In the Permian, the DUC count increased by 18 to 937.
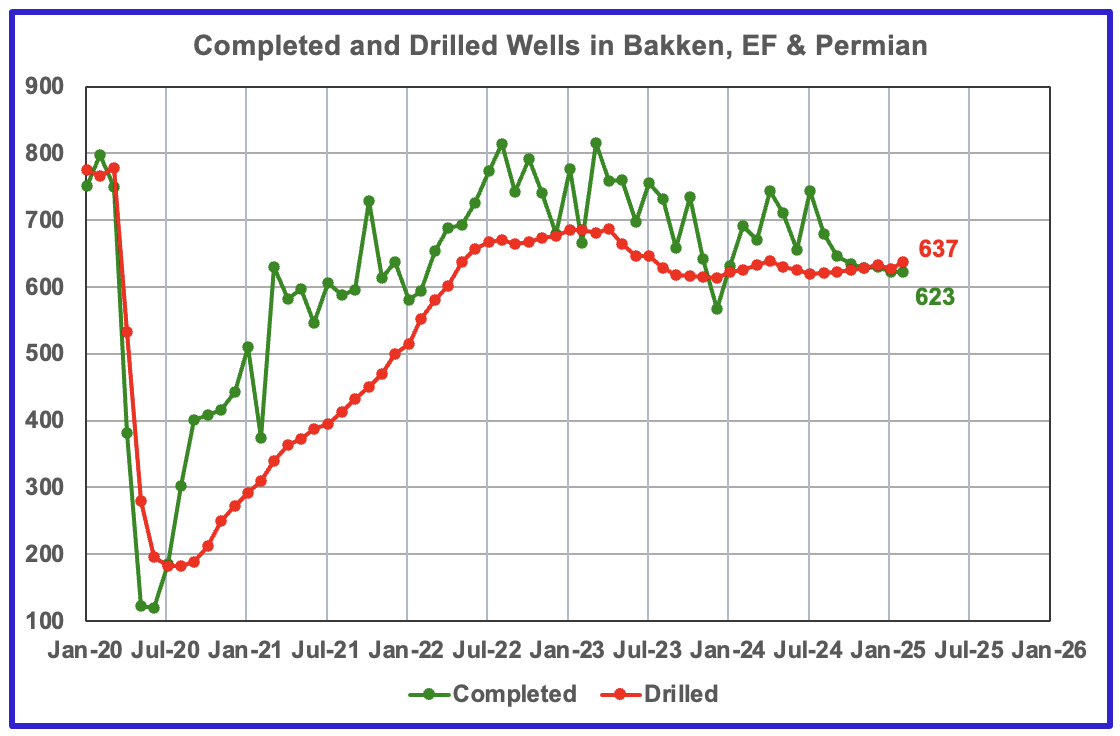
In the three primary regions, 623 wells were completed and 637 were drilled, increasing the DUC count by 14 as reported above.
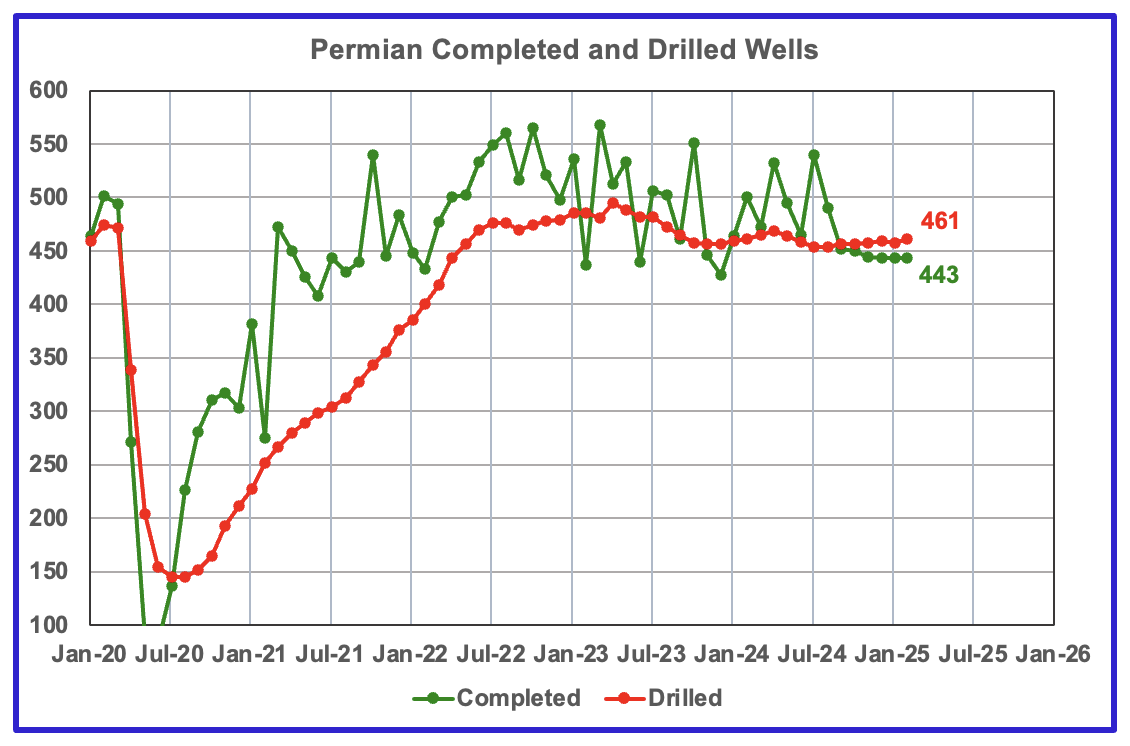
In the Permian, the monthly completion and drilling rates have been both stabilizing in the 440 to 460 range over the last 6 months.
In February 2024, 443 wells were completed while 461 new wells were drilled. This is the sixth month in a row in which the number of wells drilled exceeded the number of completed wells.
Thanks Ovi,
Very nice job.
If we look at the EIA C plus C estimates for the 8 states where most of the tight oil is produced in the US (TX, NM, ND, CO, OK, MT, WY, and UT) we find that for the past 25 months the OLS trend is an annual rate of increase of 466 kb/d.
I expect we will see a plateau, but probably not until 2026 at the earliest and perhaps not until 2027, much will depend on the price of oil and how big the recession is that will be a result of the trade war that Trump has initiated. My expectation is about a 200 kb/d annual rate of increase over the next 2 years for Permian Basin output, roughly half the annual rate of increase over the Jan 2023 to Dec 2024 period. We are getting close and depending on how one defines a plateau (less than 100 kb/d annual rate of increase or decrease?) it could be sooner.
If one were to define a plateau as an annual increase or decrease in the range of 100 kb/d or less, the chart below gives the “plateau” date range for my recent Permian scenario (October 2025 to November 2028.) How a “plateau” is defined will be subjective and of course any scenario guessing future output is certain to be incorrect (I sometimes fail to mention this, but take it as a given, only God knows the future.)
Dennis
Thanks
Not sure how to define a plateau. It probably is in the eye of the beholder.
With regard to future production, I think the counties around Martin and Midland provide a better clue of what to expect over the next 6 months. All of the counties are on a plateau and approaching their decline phase or are already into it. Unfortunately the monthly RRC revisions are distorting the projections. Hopefully the real trend will emerge over the next 3 to 4 months.
Recently at looked at the counties in the central Permian surrounding Midland and Martin. Looks like I missed Glasscock. Attached is a chart for Glasscock. The January data is from the Texas RRC. the December data is from another source. Glasscock is also in decline. I think it is significant that Texas production peaked in October and the EIA has to revise their production down. With WTI down $5/b this morning, the outlook for higher production is not looking good.
For Permian as a whole, my expectation remains a small increase in 2025 of about 150 kb/d followed by a smaller increase of 70 kb/d in 2026. For the most recent 13 months the OLS annual tend is about 332 kb/d and the longer term trend (Jan 2021 to Jan 2025) is an OLS annual rate of increase of 527 kb/d for the Permian Basin Region C plus C. So definitely moving in the direction of a plateau, when it will occur is not known in advance. My guess is a peak in 2027, but low prices might cause it to occur sooner, the accelerated increase in OPEC output recently announced and a World recession cause by tariffs and economic uncertainty they will produce may make my Permian scenario incorrect. If WTI price falls to under $60/b (annual average price for 2026 for example) then plateau would likely occur sooner than I have predicted (my scenario assumes annual average WTI for 2026 and 2027 is at $70/b or more).
These counties with fast rise and drop is probably a prelude of the Major Counties profile. When GOR spikes, oil EUR falling off the cliff of high IP or parent well, and operators just have to lay down rigs, espcially when oil price is also in the valley.
The Martin and Midland counties have the API just above 40, and the GOR increase will send the oil API to under 40, heavier and thicker and higher viscosity.
The Eddy oil API is already in the condensate range, and could behave somewhat better based on my reading of the production profiles (GOR, API) for conventional oil. Lea will be in the middle.
https://www.linkedin.com/pulse/shale-tight-oil-getting-heavier-more-natural-gasoline-sheng-wu-mevfc
Ovi,
A significant quantity of Permian output comes from the Delaware Basin (Lea, Eddy, Reeves, and Loving counties are the largest producers). Not sure why we would only want to look at the Midland Basin when output has been rising in the Delaware Basin, better to look at the entire Basin (and include both sub-basins) in my view.
Note also that based on your estimates for the most recent month the 4 largest producing counties in the Delaware basin produced 648 kb/d more oil than the 6 largest producing counties in the Midland Basin, in fact a chart which adds up the output from all 10 of these counties would be interesting.
Glasscock GOR
The OPEC announces to hike production by 400 kB to get some more money- and the price together with the toll chaos slumps by 7%.
So: +1.3% Production, -7% price – I think this is quite a deal.
From a few weeks ago-
“Shale titan Harold Hamm isn’t mincing words—if oil prices stay this low, drilling in some of America’s prized shale fields could grind to a halt. Speaking at CERAWeek in Houston, the Continental Resources founder warned that with oil hovering near $65 a barrel, many U.S. fields are already on shaky ground. “When you get below the cost of supply, you can’t ‘drill, baby, drill,’” Hamm told Bloomberg. “That shuts you down.”’
Be wary of this GOR analysis.
Moving to a deeper bench can easily get you 500 to 1000 GOR increase without representing a depletion signal.
Not saying that explains every county but geologically, in the Permian, organizing this by county when you have 6 or 8 benches with different GOR profiles at baseline is trickier than this analysis makes it appear.
Timthetiny
I Just came up with that type of chart about two years ago when I started looking into the Permian counties. I was criticized for doing that because that type of chart doesn’t apply to counties.
At the time I made it clear that I was not a petroleum geologist, just an analyst who liked looking at numbers and making nice charts.
Regardless I will keep posting them and our participants can put whatever interpretation they want on them. Personally I think that most of them are telling the same story.
Thanks Ovi, very interesting to read.
Yesterday the President in US issued new custom tariffs on a huge number of Countries. The way cars and equipments are produced today where parts are produced where it is cheapest and imported to the factory that put all together means cars and everything will now get more exspensive for consumers around the world. This leads to inflation and pepole buy less. Investments are set on hold. The result is now Stock markets are plumming and Oil price Brent now below 70 USD /Barrel. Guess WTI soon reach 65. When I look at the GOR graphs, drops in drilling riggs there is no doubt US oil production will suffer from this pollitic. At the same time Donald Trumph could say ” Drill, Baby Drill…”…
Freddy
T might say DBD but will anybody listen.
HHH may just see his 5 year prediction of low oil price come about this year, at least for a few minutes…what was it $35?
Thank you Ovi.
And “Did a search to find a reason for Colorado’s January oil production drop. Above is what the AI summary came up with. Beware of AI data/facts.”
Indeed, just as we need to be forever vigilant against false narratives and fact selection/manipulations from human beings.
WTI is basically at horizontal support that has held since November 2021. It’s tested this area multiple times over the past 3 1/2 years or whatever it is. We’d need a solid break through this support zone to get a larger move lower in oil prices.
WTI is currently down over 7% on the day. Stocks are down 4-5% so it’s been a huge day down. Even gold got sold it’s down 1.7% on the day.
Nothing goes to hell in a straight line. And most of the market, stocks in particular are way over sold. Corporate buybacks will likely return next week and put a bid back under this market. And the CTA’s will follow.
This isn’t the end of the world party that some are making it out to be.
The upward trend in both oil prices and stocks remains until we get an actual trend change. Not there yet. Oil is closer to breaking down into a bear trend than stocks are though.
Just remember that every thing that has happened over the past couple of weeks has happened in a vacuum where corporate buybacks weren’t happening. None of which is by coincidence.
Tax the crap out of the 1% to pay for the restoration.
WTI down another 7% today. It was under $62 a few minutes ago. Maybe we go to $50 or below without any production increase anywhere.
Certainly it is looking like there will not be strong demand for oil as the World will go into a recession within a few months, so not much need for oil output increases, maybe OPEC will decide not to increase output as announced recently, US output will stall if WTI falls to under $60/bo and remains at that level.
Indeed
Bringing in a more long term perspective could be to reflect upon what it takes to reverberate oil supply. We have had several observation points the last years to say that a high oil price combined with a strong dollar brings enough supply to the table. Well, mostly the 2022 aftermath from the Russia-Ukraine situation. So it is safe to argue that we still don’t know what such a price once more for a couple of years could bring in the form of supply (short term in the form of shale resources or investment decisions for the long term lingering projects). It is a pretty good scenario that lack of demand extends the period to bring the price point up to eventually “crunch time”. It is not “good” short term for the cause to prop the economy or the well being of the middle class, but simply to extend the plateau phase for oil related products. Which in itself is important with so many people looking to improve their living conditions globally.
https://oilprice.com/Energy/Crude-Oil/Oil-Executives-Voice-Concern-Over-Trump-Energy-Policies-as-Prices-Plummet.html
Seems there will be less profit to drill new wells but the US president want the oilproduction in US shall increase by 3 millions barrel…. Drill, baby drill… What if it fall by 3 mill barrels in the same period?
Freddy,
Probably won’t fall that fast. No change in output is more likely unless horizontal oil rig count falls to zero, not a likely scenario.
If well completion rate starts to fall rapidly (say by about 120 wells annually or a decrease of 10 wells per month), then US tight oil falls by about 3000 kb/d over about 5 years.
Oil is crashing now in earnest.
Oil companies will have to scale down their drilling programs world wide to conserve money. And state oil companies will get problems to financing their money hungry states.
25 Mar 2025
Post-Covid crude production in world outside the US still lower than end 2018
https://crudeoilpeak.info/post-covid-crude-production-in-world-outside-the-us-still-lower-than-end-2018
Article on oilprice.com describing declining oil consumption in China for transportation uses as LNG and electric modes continue to grow.
This dovetails in with Wednesday’s announcement of the US’ largest natgas power plant project to be built east of Pittsburgh in Homer City.
Costing in excess of $10 billion, this will be the biggest capital construction project in the history of the Commonwealth as it will host a huge AI campus.
Output will be 4,500 Megawatts and should consume over 800 MMcfd from the Mighty Marcellus.
Misplaced concerns over liquid hydrocarbon scarcity are increasingly shown to be baseless.
Age of Gas be a’dawnin.
Appalachia Rising!
How much more expensive was the WMD mistake, ?!
?!
Marcellus scenario URR=200 TCF, peak annual dry gas output 26.5 BCF/d.
D C,
The plot you put above for Marcellus (M) is probably including Utica (U) in Ohio which is OH’s major gas production target, not M (~only dozen wells bordering WV).
The M only production should be much larger portion and has not shown a plateau yet, if you check NOVI here,
https://novilabs.com/blog/pennsylvania-update-through-march-2023/
and check M only for gas, the production only decreased ~1.2BCF, i.e. from 20.5BCF to 19.3BCF. So, PA shale gas are mainly coming from M, not U, and yes, PA M gas production has shown a plateau at ~19.3BCF.
Then, look at the gas production in PA,WV and OH, here from EIA,
https://www.eia.gov/petroleum/production/#ng-tab
You could see similar U M numbers for PA as NOVI, but unable to separate U&M.
But WV gas is almost 100% M as well, you could find the report for 2021
https://www.wvgs.wvnet.edu/www/datastat/Marcellus/reports/WVGES2021MarcellusandUticaPtPleasantProductionSummary.pdf
The U in WV is less than 0.5BCF, and M in WV is about 6BCF. So, if we combine WV PA gas together in EIA link above, with the M is dominating ~ 95% of the production. Then, WV PA gas has been increasing from 26.2BCF to 30BCF from 2020 to Jan.2025, mainly due to WV gas production increase (from 6 to 9BCFPD). The OH gas has been declining from 7.6 to 5.5BCF, due to again targeting liquid condensate rich part of U and very small dozen of M near WV. The Dry gas part of U in OH is also close to WV, above the dry U is the condensate M, very shallow at only 6K ft but super productive, but is very limited, but dry U is huge and super productive but much deeper at 12Kft like Haynesville, and not very economical for now. There is no Dry gas M in Ohio.
WVGS do have a partial report for 2022, but mainly focusing on liquid rich M wells, and the results are matching wet gas counties in Permian and Eagle Ford. That’s why they have the incentive to DBD, and bring up the gas as well.
Your plot below for Appalachian Dry gas (99% are Utica and Marcellus, U&M, WV OH PA combined ) showing a plateau, and some source (USGS?) URR is 310TCF for U&M which put M URR at ~188TCF and U URR at 120TCF? Again, it could be explained by the oil/liquid targeting production pattern above.
Two chatbots say URR for Marcellus range from 400/500~1,000 TCF, so I assume only USGS has the lowest outdated number at 188TCF. Also, Chatbots give 200~500 TCF URR for Utica and 200~300TCF for Haynesville. These 2 URRs have much higher uncertainties because Utica still has only less than 20% just pilot drilled, and Haynesville also could have the eastern part — but mostly upside if wellhead gas price could stay above $3.
Sheng Wu,
Incorrect, it is Marcellus output only for PA, WV and OH. Utica and other formations is not included. URR is 310TCF total for Appalachia, with 200 TCF Marcellus and 110 TCF Utica. Based on roughly 75% of USGS mean TRR for Marcellus and Utica. Note that TRR does not account for economics, at realistic natural gas and NGL prices, only 75% of mean TRR is economically recoverable (where profits are enough to justify investment).
Note chatbots often give incorrect information. URR of 500 TCF only happens with natural gas prices at $10/MMBTU, this may seem plausible to you, in my view URR for Appalachian shale gas will be 300 TCF plus or minus 50 TCF, time will tell, recent output certainly suggests a plateau in output which will not last forever.
For all of Appalachian shale gas (Marcellus plus Utica) see link below, note the difference in 2024 (about 32.5 BCF/d for Appalachia, vs 26.5 BCF/d for Marcellus, with the difference of about 6 BCF/d being Utica formation output.
https://peakoilbarrel.com/januarys-us-oil-production-drops-big/#comment-787531
On Haynesville/Bossier USGS has mean TRR at 315 TCF, if we assume ERR is about 75% of TRR then ERR would be 237 TCF, Cumulative output to Feb 2025 is about 42 TCF (dry gas only), 50% of ERR is about 118 TCF and recent peak output level is about 5.11 TCF per year, the 50% point would be reached in 2040. With increasing output at recent annual rate of increase peak is reached 5 years earlier in 2035.
Do you realize that there have been many very high resource estimates (30 Gb for Bakken/Three Forks comes to mind) that have proven to be 3 times too high? The Permian USGS mean TRR estimate(75 Gb) is likely about 47% too high. So throwing out chatbot estimates is likely to give poor results. The Saputra/Patzek papers are likely better than most in my view.
D C,
I agree with most of your production numbers, except a little about the Marcellus and Appalachian gas production.
The M gas in PA is about 19.3BCFPD (see NOVI and select M only), and WV 9BCFPD gas has only about 0.5~0.7BCFPD from Utica and rest is M. So, WV gas has about 8 BCFPD from M. So, total M in WV and PA now is 19.3+8.3=27.6BCFPD. All Appalachian (WV+OH+PA) mainly have U+M gas, at 34.5 BCFPD, and Utica has 5.5(OH)+0.8(PA)+0.7(WV)=7BCFPD.
About the URR numbers, I repeat my observations:
1. USGS estimate for Permian and Bakken oil have been inflated, like your estimate, but it was also reduced due to over drilling that brought in extra bubble point death.
2. USGS estimate for Haynesville gas has been too relaxed due to the very high IP there, but faster decline will kickin later, much like oil above. But no one really knows the numbers because there is the Eastern part, and also still lots of acreage in LA/TX not drilled yet. Utica dry gas probably has higher uncertainty than Haynesville.
3. USGS estimate for Marcellus has been too low, similar to lowest from Saputra paper.
The 50% URR plateau is for a certain price always, and it is wellhead price, not Henry hub or WTI. The way to improve URR, especially gas, is to get rid of the roadblocks that holds the realization of potentials of M&U and others.
Sheng wu,
Where do you get your production numbers? Are you using gross shale gas? Some of that can be reinjected, flared, or is other gas, so not really the best number to use. We don’t have specific numbers for shale gas on these other categories, just gross gas so I use the dry shale gas estimates to avoid this problem.
Sheng Wu,
Also sometimes people think the USGS estimates are too low because they look at the EUR estimates that are based on older wells, newer wells often have higher EUR due to increased lateral length, but keep in mind that if we double the lateral length we need to divide by two the number of potential locations, The USGS estimates have been if anything too optimistic if one assumes the entire mean TRR will be recovered. For tight oil a better estimate is probably about 60% of mean TRR and for shale gas maybe 75% of mean TRR at most. Other high estimates found by chat bots by scraping the web are not reliable.
You mention that there has not been much drilling in the Utica and Haynesville which implies the USGS estimate may not be accurate, the same was true of the Delaware basin in 2018 (similar time frame to the Haynesville, Bossier, and Utica/Point Pleasant estimates from the USGS). The Delaware estimate was reasonable/ optimistic, probably also true for Utica and Haynesville. The Utica and Haynesville output shown in chart below, note that all shale gas URR may be about 750 to 800 TCF with likely peak by 2027/2028, the LNG exporters are in for a big surprise unless US consumption drops quickly.
D C,
My production numbers are all from EIA (U M), and NOVI (U& M separated) and WV report (U&M separated).
The difference of the production numbers are quite small between your and mine, and it might be traced to dry gas or gross gas.
I detailed them just to show the effect of drilling for liquid in both OH (U)and WV (M) are distoring the gas production, just not to confuse the total Appalachian gas plateau is a result of U M reaching 50%. The U of PA WV OH already declining — but it might be <5% URR (USGS) produced.
Similarly, M of WV OH still increasing, but when you look into WV SWPA, M is still fast increasing, and so are the lateral lengths, the increase in lateral length is much faster than NEPA, and make the false impression that NEPA might also count on lateral length increase to boost per well EUR. You could go to NOVI PA gas, and separately plot out the NEPA and SWPA core gases "well quality" — they look differently, the NEPA tail increase is much smaller than SWPA, indicating the lateral length in NEPA is not increasing as much as SWPA. Then compare it with NOVI North Dakota and there you could see the tails all collapsed together after 2010, which really tells that the higher IP per foot does not mean higher EUR per foot. Similar stagnant or even faster declining tail behavior could be found in new Permian oil wells.
The SWPA and NEPA however, one can see the improvements of both IP and EUR per foot, especially from 2019 to 2020 and for SWPA. Note that Saputra paper gives a flat lateral length from 2019 to 2020, so the improvements in M productivity is obvious, and by grouping 2017-2020 together really buried the upside of M.
The USGS high URR or TRR estimates for Bakken, Permian and Haynesville probably is a result of higher IP and applying a slower declinging curve to get EUR per foot. While for Marcellus, the IP has never been as spectacular as Haynesville or Utica, so it got low balled by USGS almost 10 years ago, and again by Saputra in 2022. However, those who really calcualte the EUR normalized by lateral length and well density knows that there is already the problem of over-production — recovery unreasonably high, especially in SWPA, where 100% is not rare.
If you go to Novi Haynesville, you could see the decline tail also improved obviously after 2016, even though it is still much faster than Marcellus. So, I would say Hayneville, together with the new Eastern part could seriously do well over 200TCF URR already. So, although Haynesville already had 3 plateaus already and declining, it will bounce back once price is above $4 and technology further improves as Wright believes. Note, the 1st plateau in H was created when the gas price dropped from $8~10 to $5~6, and the faster decline showed up. The 2017 bounce back came even when gas price is still $4~6, all due to better fracing with sand and water not proppant and gel. Then, the faster declining showed up again, and gas price further dropped, and the 2nd plateau at 2020, and then the war in 2022 and higher price brought in the 3rd plateau.
Sheng Wu,
Perhaps Haynesville will be over 200 TCF, my guess is around 240 TCF, the USGS has mean TRR for Haynesvilee/Bossier at about 320 TCF. I am estimating that about 75% of TRR will be profitable to produce.
Also note that it is possible Haynesville output might increase to supply LNG export facilities and as I said earlier, at recent peak levels a plateau might be maintained until 2040. If output levels increase, a new peak is reached around 2032 with cumulative output reaching 50% of URR in 2035 or so.
This will only happen if more expensive US gas can compete on World LNG market with Russian and Qatar LNG. As US natural gas output is likely to peak around 2028, the input price to LNG facilities may start to rise and reduce World demand for US LNG.
There is a huge risk to these LNG facilities that is not appreciated by the investors, they will not make much money long term.
https://www.reuters.com/business/energy/venezuelas-oil-exports-fall-115-over-us-tariffs-sanctions-shipping-data-say-2025-04-01/
Venezuela’s oil exports fall 11 percent over tariffs
World C+C declined in 2024 for the first time since the Covid Crash.
Data is in thousand barrels per day.
,,,,,, World Avg
2023 81,969
2024 81,833
Diff ..-136
I suppose one should applaud the reduction in emissions brought about by Trump’s Tariffs, even if it only turns out to be short-lived.
Appalachian Shale Gas, URR about 310 TCF cumulative production to Feb 2025 is 117 TCF, 50% of URR is 155 TCF and at present levels of output the cumulative reaches half of URR in 2028, so peak may be very soon, if output increases the peak is reached sooner, perhaps 2026 or 2027. Mighty Marcellus may not be as mighty as some believe.
Rig Report for the Week Ending April 4
– US Hz oil rigs increased by 5 to 450.
– The headlines are blaring the weekly rig count is up by 5. Actually in the critical basins that are normally reported here, the rig count is down by 2. For some unknown reason Ohio added 5 rigs for 8 overall. That is the source of the jump. Is Ohio aiming for 200 kb/d. Have they found a new field/bench?
Let’s watch what happens over the next few weeks with WTI at $62/b
– New Mexico rigs were unchanged at 92 while Texas rigs dropped by 2 to 235. Texas Permian was down by 2 rigs to 188.
– In New Mexico, both Lea and Eddy were unchanged at 47 and 45 respectively.
– In Texas, Midland dropped 2 to 26 and Martin added 1 to 27.
– Eagle Ford was unchanged at 42
– NG Hz rigs were down 5 to 77.
A year ago, EOG and others in Ohio Utica wet gas condensate window were drilling with >12 rigs, somehow the numbers dropped to low single digits, so maybe they think too small.
Ohio’s Marcellus is super good condensate, albeit quite small, outmatching counterparts in Permian and EF.
They could drill 5 miles in less than 3 days and complete half to 1/3 of the time in Permian.
Also, in the small acreage next to WV, the Utica shale although much deeper, could do 21BCF for a signle well in 2 years.
Sheng Wu,
Note that the rigs reported by Ovi are horizontal Oil Rigs, so gas focused rigs are not included. There is an oil window in the Ohio Utica, but recources are not large maybe 10 Gb or so.
Dennis
I don’t graph the NG rigs but do report them on the last line but with no detail.
Ovi,
Yes, I forgot sorry, the point is that we don’t see the trend.
Chart below has US Horizontal natural Gas Rig Count since July 3, 2022.
Horizontal oil rigs decreased from about 550 to 450 (18% decrease) over past two years while horizontal natural gas rigs decreased from 146 to 77 (47% decrease) over past two years.
Frac Spread Report for the Week Ending April 4
The frac spread count dropped by 4 to 205. It is also down 52 from one year ago and down by 36 spreads since October 11. How low will the frac spread count go with WTI at $62/b?
I suspect oil could drop far below $62.
Dennis
I wonder if you and I will be out of a job in a few months.
Energy Department considers more than 40 percent of its staff nonessential as layoffs loom
The Energy Department (DOE) considers more than 40 percent of its staffers to be nonessential — meaning these people could be on the chopping block — as mass layoffs loom at the agency and across the federal government.
A document viewed by The Hill on Friday states that out of the agency’s current headcount of 15,994 positions — 9,004 are essential, meaning some 7,000 other positions are not.
https://thehill.com/policy/energy-environment/5233347-energy-department-essential-employees-layoffs/
Ovi,
We can still use State data from RRC and OCD, Trump does not control those agencies, nor does he control OPEC, EIA data may become less reliable under the Trump administration as he has a bunch of morons running things.
Dennis
Loved “less reliable”.
https://apnews.com/article/nuclear-doge-firings-trump-federal-916e6819104f04f44c345b7dde4904d5
DOGE didn’t realize the DOE manages the USA nuclear stockpile.
Fired the nuclear engineers that manage it cause they thought they were non-essential.
Ovi and Dennis ( not sure if you work at DOE? ) but Analytics and Data Analysis jobs are in demand ( pre tariffs ).
You have a portfolio of work that could get you another job ( Don’t mention Peak Oil in the interview!!! LOL ).
Andre the Giant,
We don’t make any money doing this, I pay myself for the Web hosting and Ovi graciously has volunteered and receives no compensation. Unless someone volunteers to help at some point (besides Ovi), this blog will go away in the future. Anyone interested in contributing blog posts on oil and natural gas can contact me at peakoilbarrel@gmail.com
“I wonder if you and I will be out of a job in a few months.”
Sorry misinterpreted.
No offense intended. I love your work!
Andre
I am more than 25 years past retirement and this is how I fill some of my spare time. Just hoping for warm, sunny and healthy days.
Ovi,
Your posts here are very much appreciated. Hope you get some warm sunny and healthy days, in Canada I would think there might be fewer of the warm days, though your definition of warm might be different ( above 0 C ?) than for many of us south of the border.
Dennis
We hit 10 C (50F) today and that is warm relative to -15 (5F). Still waiting for the sun.
Ovi,
Awesome, about 45 F down here in southern Canada (aka Northern New England.)
You do a great job….love your work!
I wonder if Harold Hamm has tried to call President Trump recently? If so, I wonder if President Trump took the call?
After all, President Trump wants very low oil prices, and he’s going to get them.
Shallow sand,
I agree that prices may go down, my guess is maybe to $55/bo for WTI, as you know I am wrong more often than I am correct, this guess is annual average WTI price from June 1 2025 to May 31 2026.
https://www.wsws.org/en/articles/2025/04/03/jpkg-a03.html
2 carrier fleets (the 7th fleet is already there in the Strait of Hormuz), stealth bombers, B2 – bombers headed to Iran.
Did Andre say Trump would go after Iran for revenge for trying to assasinate him?
Yes..Yes…Andre did say that
No Chess Moves in Donald’s brain, only Tit for Tat
That is how the narcissitic mind works!!!!
WTI at $59.84 currently. Almost everything had a large gap lower at opening to start the week.
Japanese stocks were down over 3000 points near 9% moments ago. It’s going to be volatile. Don’t be surprised if some sort of news sparks a rally this week though.
A lot of times gap openings like this are reversals where later on during the week or month price closes the gap and prices head the other direction.
It is possible that these prices gaps aren’t closed and prices just keep falling. We will see.
But my guess is central banks will have an emergency meeting. An announcement that puts a bid under everything.
Or they wait around for credit default swaps to be triggered. Those financial weapons of mass destruction as Buffet refers to them. Which will definitely make them take action.
you could see rig drop by 50~100 next 2 weeks, and production drop by 1MBOPD, like Covid
Sheng WU
Any idea for how long a rig contract is signed? 3 mths. Six mths. What I am trying to get at is how long before we start to see a drop in the rig count. You say 2 weeks. Is that a guess or based on some knowledge of rig contracts?
Goldman Sachs’s analysts issued a new note dated April 6, in which they slashed their 2026 oil price forecasts by $4 per barrel—to $58 for Brent Crude prices and to $55 for the U.S. benchmark, WTI Crude.
https://oilprice.com/Latest-Energy-News/World-News/Goldman-Sachs-Slashes-Oil-Price-Forecast-to-Below-60-in-2026.html
The rig report over the next 4 weeks will be interesting. During COVID it took about 5 months for rigs to reach their low point after oil price crash. US Horizontal Oil Rig count dropped from 600 to 150 in that case when real oil prices dropped from $70/b to $35/b in 2024$.
According to a commentator on CNBC, oil execs are calling the WH and telling them low oil prices will not make the US energy independent.
Contrary to corporate opinion, this abrupt fall of WTI to $60 is very good for U.S. energy independence. These CEO’s aren’t thinking past their next earnings report. No matter alternative forms of energy, the U.S. (and the world) is going to need oil and gas for decades to come. Look no farther than the Permian Basin. They have run through an amazing collection of source rocks like maize through a goose, with absolutely no regard for anything but money. For the uninformed, man has traditionally drilled into oil that had migrated a good distance from the source rocks, gathering in an oil trap of some sort. Drilling deep into the earth to blast oil and gas out of the SOURCE ROCKS represents some degree of desperation–this is the last gasp in American oil and gas production.
I make my living from oil and gas, primarily from shale. However, I would very much rather sell less product at higher prices than to give away large quantities as though it’s no big deal to replace it. When the source rocks are all blasted to smithereens, there’s no more production.
The world has not known fossil fuel starvation for over a century. It will not be a good look. Those who are demonstrating against FF’s have no concept just how bleak an oil-starved world would be. This correction–if it persists for months, not just weeks–will idle a lot of rigs, bankrupt a lot of people drilling the next well from the flush of the last one, and will reset the priorities. At least that would be the ideal. No pain, no gain.