JODI, the EIA and Their Data

There has been very little new data to report lately. The JODI, Joint Organizations Data Initiative, data for March came out a few days ago. JODI is very good as far as the data it reports goes. The problem is there is a lot of data they just don’t report. If a country does not report their production for a given month then JODI just leaves it blank. And some countries they can’t seem to get any data from, so JODI just gives them zero for every month. For those countries I just substitute EIA numbers.

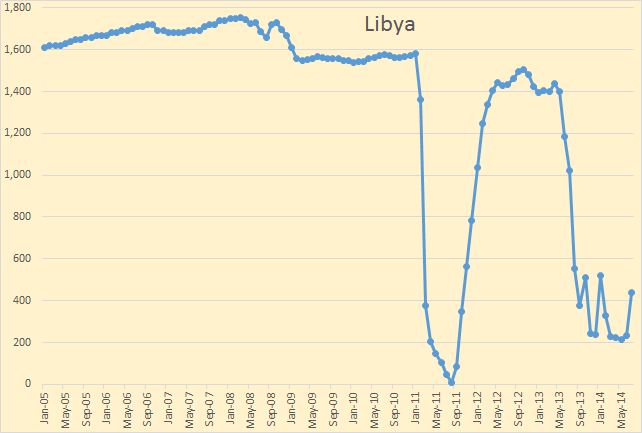
As far as OPEC goes JODI is very political, reporting the inflated numbers that Iran and Venezuela report. I use instead the EIA data for those two countries.  Anyway here is what I have from JODI. The Data is in kb/d, last data point March 2014:

JODI World Total

But for a few countries JODI is a pretty good data source. Russia is a good example.

JODI Russia

JODI has Russia peaking, so far, in November at 10,127 kb/d and now about 100 kb/d below that point. Analysis have, for years, been expecting Russian production to decline but new fields in Siberia have kept inching up a little bit each year. But with over 60% of their production still coming from Western Siberia’s giant, largely depleted, fields it looks like that long overdue decline may have finally arrived.
Read More

Texas RRC Oil and Gas Data

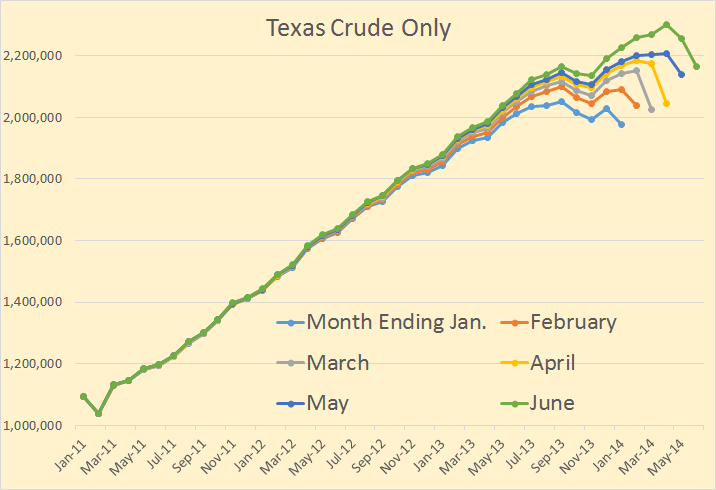
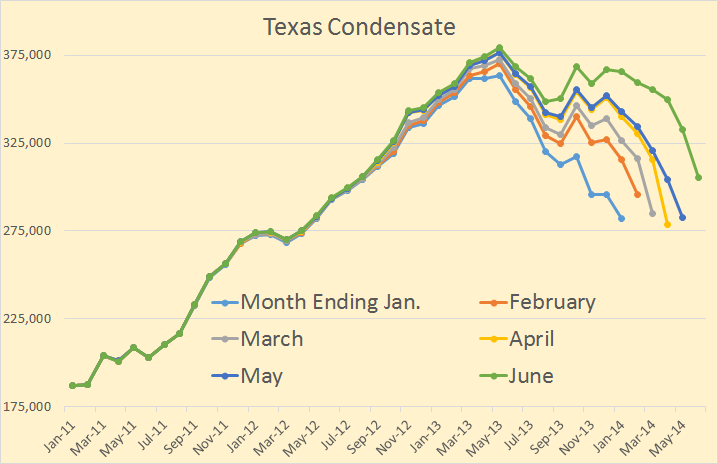
The Texas Rail Road Comission has has released their production numbers for March. The data is always incomplete and the most recent data is always the most incomplete. Nevertheless one can glean quite a bit from the data even though it is incomplete.

Texas Crude Only

The May Report has data through March, April through February and the March report has data through January. You can see from this chart how Texas upgrades their data as data comes trickling in.

Texas Condensate

I looks like Texas condensate has peaked. May 2013 is the peak so far. October 2013 is creeping up but I don’t think it will overtake May. Regardless of whether May will be the ultimate peak or not there is no doubt that there has been a dramatic slowdown in Texas Condensate production.

Read More

Jean Laherrere’s Take, Plus Other News

Note: Jean Laherrere sent me the below post and asked me to post it in reply to comments posted by Dennis Coyne and Political Economist on my post Bakken Update, March Production Data. But that was several days ago, the comments are stale. Also it was too large for a comment. So since we are a period where there is a dearth of data, I decided to make a post of it. Below Jean’s graphs and comments I have added a couple of news Items.
_______________________________________________

Policial Economist displays a graph for Bakken production Hubbert linearization trending towards 3.5 Gb, but it is from EIA DPR for the period January 2007 to June 2014 : it is not real data (we are not yet in June 2014) but estimates.

It is different from mine trending towards 2.4 Gb, but it is only for North Dakota Bakken using ND state data from 1955 up to March 2014.

In many of my papers I state that production Hubbert linearization is not very reliable and it is better to rely on the creaming curve of cumulative backdated 2P discovery versus cumulative number of fields. But for LTO there is no reliable way to estimate 2P reserves, because only the volume generated by the source rocks (using Rock Eval measures from cores) can be estimated but the amount lost from this generated oil and gas cannot be estimated and the recovery from what is left within the fractures needs longer historical data.

Laherrere E

The ND production excluding Bakken Hubbert linearization trends also towards 2.5 GbLaherrere

It is why I use a NG oil ultimate of 5 Gb with both 2.5 Gb for Bakken and non-Bakken.
Read More

Eagle Ford Update, Texas Condensate and Natural Gas

This is a brief update on Eagle Ford Crude plus Condensate (C+C) output through February 2014.  It can also be found at Peak Oil Climate and Sustainability.

blog140513fig/

 Figure 1- RRC Data provided by Kevin Carter 

I have used my usual method of estimation where I find the percentage of total Texas(TX) C+C output that is from the Eagle Ford(EF) play (I call this %EF/TX ) and multiply this by the EIA’s estimate of TX C+C output.

The chart shows the Railroad Commission of Texas (RRC) Eagle Ford estimate (EF RRC) in thousands of barrels per day (kb/d), the EF est (kb/d) as described above, the percentage of EF C+C that is condensate (EF %cond/C+C), and the %EF/TX also described above.

As before I would like to thank Kevin Carter who created a method to simplify gathering the Eagle Ford data.

Read More

Bakken Update, March Production Data

The Bakken production data, as well as the All North Dakota production data just came out with their production numbers for March 2014.

Bakken Barrels Per Day

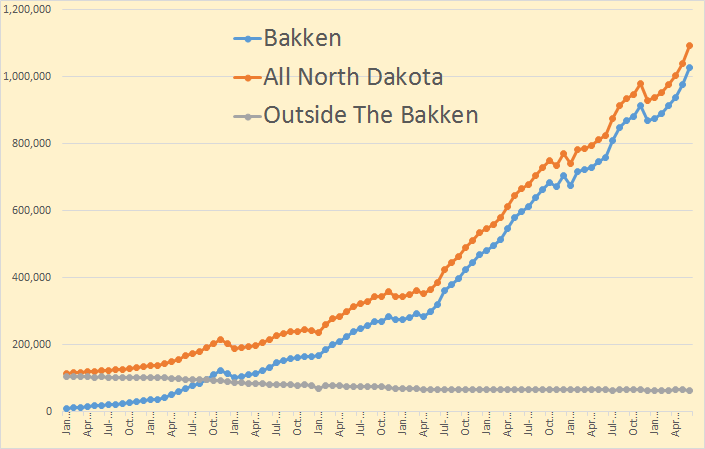
Bakken production was up 914,003 bp/d, up 25,091 bp/d from February. All North Dakota production was 977,061 bp/d, up 24,006 bp/d from February. That was a new record for the Bakken but not for all North Dakota. They are still 538 bp/d below their November 2013 numbers.

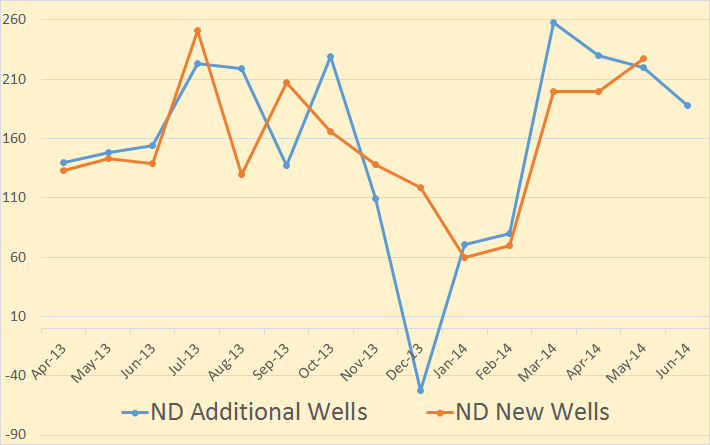
The surge in the Bakken really started in July 2011 when they doubled number of additional wells per month. Production continued to climb in pretty much a straight line through October 2012. Then bad weather and other problems started to affect production. They are now about 150,000 bp/d below where they would have been had they continued on that trajectory. (Line on chart.)

Non-Bakken

North Dakota production outside the Bakken declined at about 12% per year until the number of additional wells per month doubled on July 2011. Then it flattened out as some of those new wells were drilled outside the Bakken. But now additional wells outside the Bakken have dropped and so has production. Production outside the Bakken is still down almost three thousand bp/d from the December numbers. So though the Bakken hit a new high in March, total North Dakota production is still below the November numbers.
Read More