Will US Light Tight Oil Save The World?

There has been plenty of hoopla lately concerning the boom in shale (LTO) oil production. From the New York Times: Surge Seen in U.S. Oil Output, Lowering Gasoline Prices

Domestic oil production will continue to soar for years to come, the Energy Department predicted on Monday, scaling to levels not seen in nearly half a century by 2016.

The annual outlook by the department’s Energy Information Administration was cited by experts as confirmation that the United States was well on its way — far faster than anticipated even a year ago — to achieving virtual energy independence.

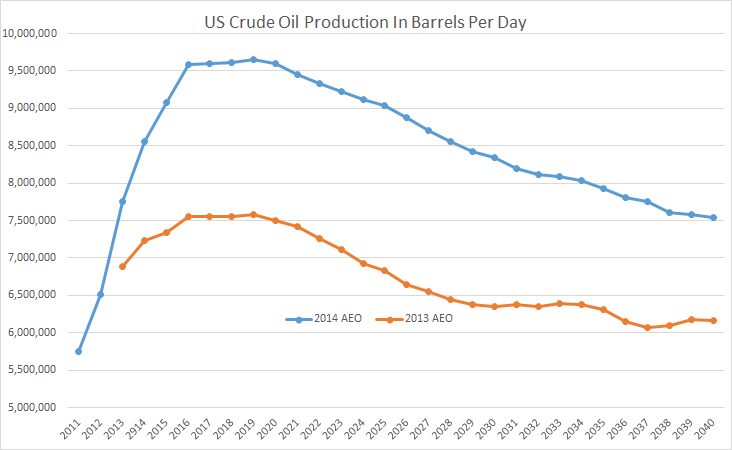
What the EIA is actually predicting:  AEO2014 EARLY RELEASE OVERVIEW. The data is C+C.

AEO 2014

The first two points were what was actually produced in 2011 and 2012 and the rest of the blue line is what they are predicting for the future. The orange line is what they predicted last year. The predicted numbers this year are a lot higher but the shape of the curve looks the same. They predict US Crude + Condensate will plateau in 2016, actually peak in 2019 and by 2021 be headed for a permanent decline.

Note the difference between AEO 2013 and AEO 2014. The difference rises to just over 2 mb/d and holds that difference util 2030 when it slowly closes down to 1.37 mb/d in 2040. And everything above about 5 mb/d is all Shale, or Light Tight Oil. They expect LTO to rise to about 4.5 mb/d by 2016, hold that level for almost 5 years and for LTO to still be above 2.5 mb/d by 2040. 
Read More

When Will US Light Tight Oil (LTO) Peak?

Ron Patterson has graciously allowed me to cross post this here.  It originally was posted at oilpeakclimate.blogspot.com 

ltofig3/

The rapid rise in oil output since 2008 has the mainstream media claiming that the US will soon be energy independent.  US Crude oil output has increased about 2.8 MMb/d (56%) since 2008 and about 2 MMb/d is from the shale plays in North Dakota ( Bakken/Three Forks) and Texas (Eagle Ford). My modeling suggests that a peak from these two plays may be reached by 2016, other shale plays (also known as light tight oil [LTO] plays) may be able to fill the gap left by declining Bakken and Eagle Ford output until 2020, beyond that point we will see a rapid decline.

There are two main views:

  1. There will be little crude plus condensate (C+C) output from any plays except the Bakken/Three Forks in North Dakota and Montana and the Eagle Ford of Texas.
  2. The other LTO plays will come to the rescue when the Bakken and Eagle Ford reach their peak and keep LTO near these peak levels to about 2020 with a slow decline in output out to 2040.

Where are these “other LTO plays”?  There are a couple of these in Oklahoma and Texas (in the Permian basin, Granite Wash, Mississippian basin), the Appalachian, the Niobrara in Colorado, and others (see slide 17 of the USGS presentation link below).  Is it possible for these LTO plays to offset future declines in the Bakken and Eagle Ford?  I hope to answer that in this post.

Read More

Bakken Update, Is Production Slowing Down?

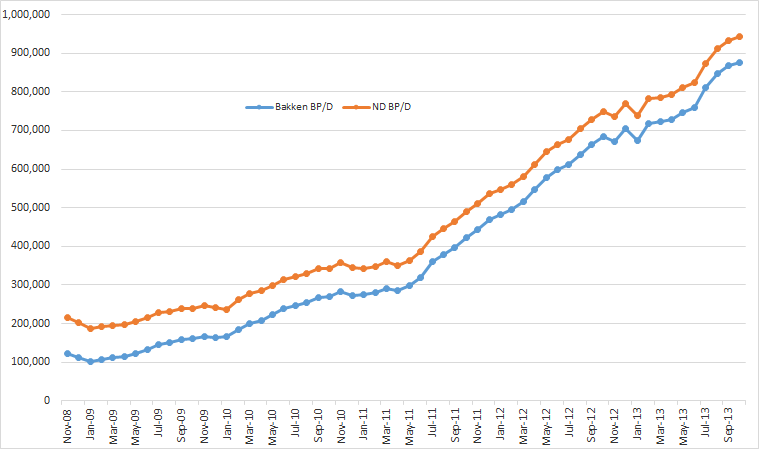
The Bakken production data published by North Dakota is out with October production data. ND Monthly Bakken Oil Production Statistics (Bakken Only) and ND Monthly Oil Production Statistics (All North Dakota).

The below chart is North Dakota Bakken barrels per day and All North Dakota Barrels per day. As you can see it’s mostly Bakken and very little “the rest of North Dakota.

Bakken Barrels Per Day


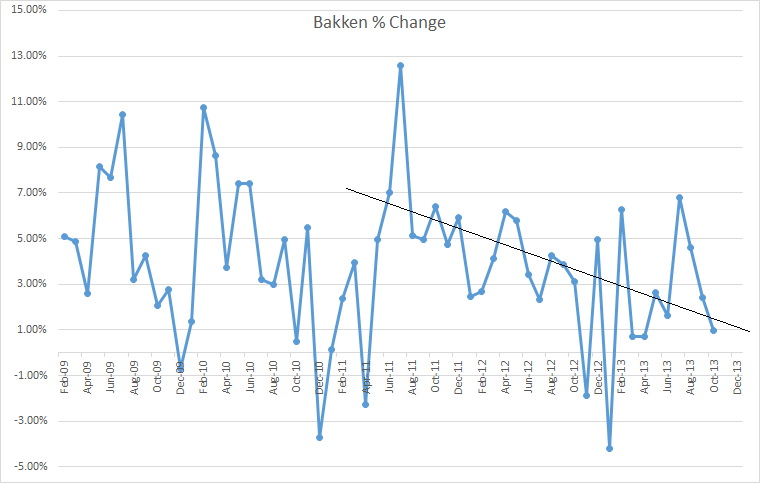
It looks like there is a pattern developing. I charted the month to month percent change in the chart below with a line indicating a possible trend.

Bakken Percent Change

Read More

EIA Shale Oil Drilling Productivity Report

The new EIA Drilling Productivity Report has just been published with their shale oil production and prediction numbers out through January 2014.

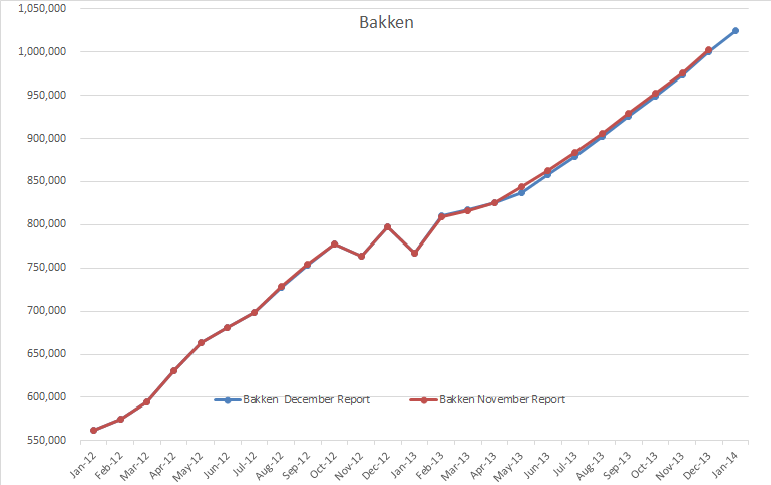
I have discovered something very strange about their numbers. But first here is the Bakken data. I have shortened the time frame to just two years in order to better show what is happening. I have plotted what the EIA reported last month along with what they reported in this last report. The data is in barrels per day.

Bakken AAA

There was extremely little revision in the data from the report last month.

And now Eagle Ford Production in barrels per day.

Eagle Ford

Eagle Ford was revised downward and like the data, the revisions were extremely linear. But the dead give away was when I plotted the percent change of from month to month.

Read More

JODI, Canada and the IEA’s Position On Peak Oil

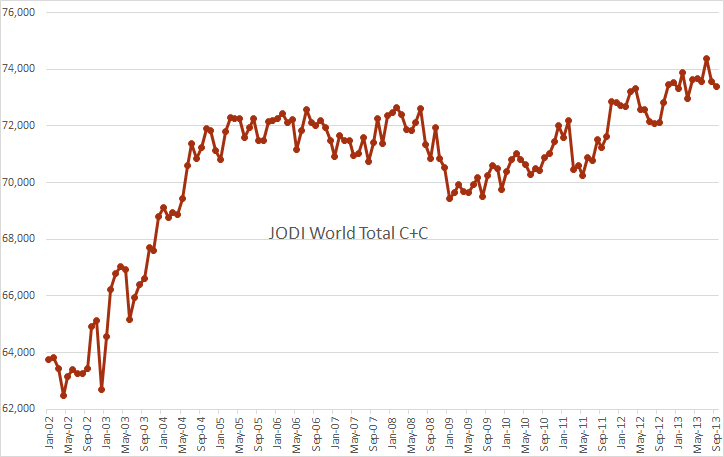
The JODI data came out a few days ago. Below is JODI World Total C+C with EIA data used for countries not reporting to JODI. I use EIA data also for Venezuela and Iran because JODI uses data reported by these two countries which is political and inflated by about one million barrels per day by Iran and half a million barrels a day by Venezuela.

The data is in kb/d with the last data point September 2013.

JODI World Total

Notice that JODI has a new world high in July just like the EIA had but down 976,000 barrels per day from July to to September.

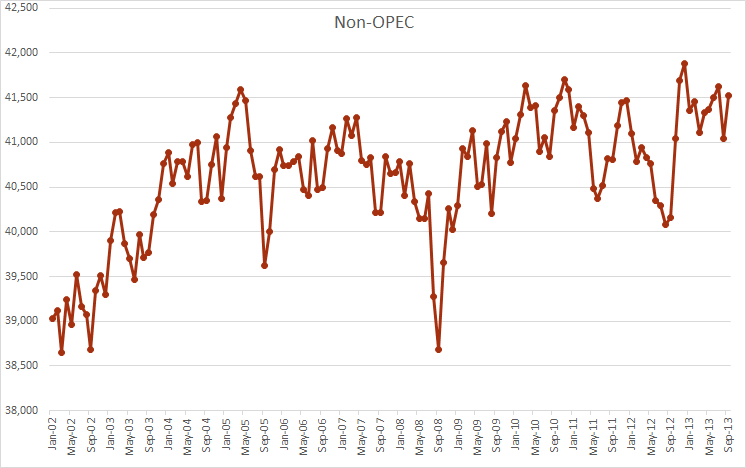
JODI has Non-OPEC at about 350,000 barrels below the peak in December 2012.

Jodi Non-OPEC

I don’t put much stock in the JODI data but I do find it interesting look at occasionally. And since it is usually almost two months ahead of the EIA data it does give me some idea of where production will be two months ahead of the EIA report.
Read More