GOM Oil Production fuels US June Increase

A Guest post by Ovi

All of the Crude plus Condensate (C + C) production data for the US state charts comes from the EIAʼs Petroleum Supply monthly PSM. 

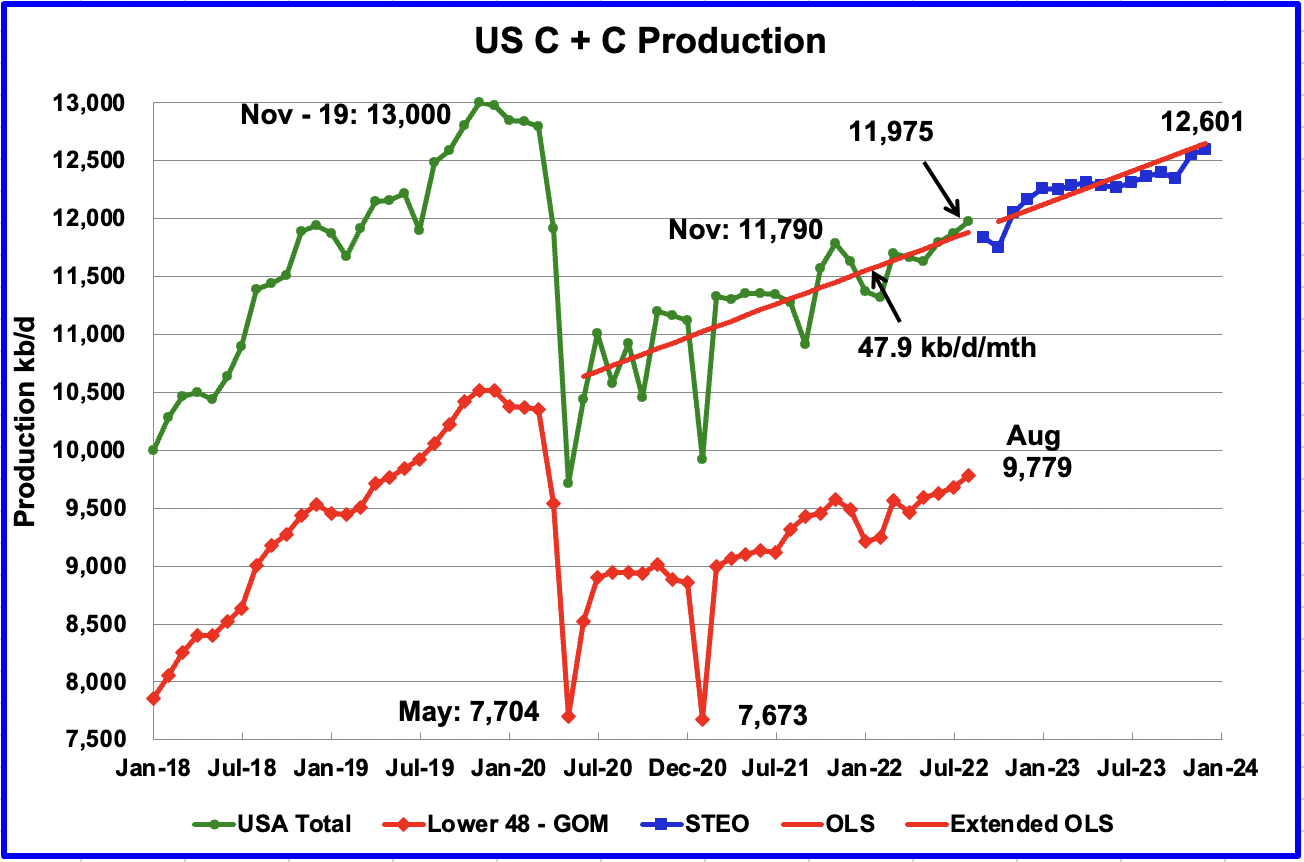
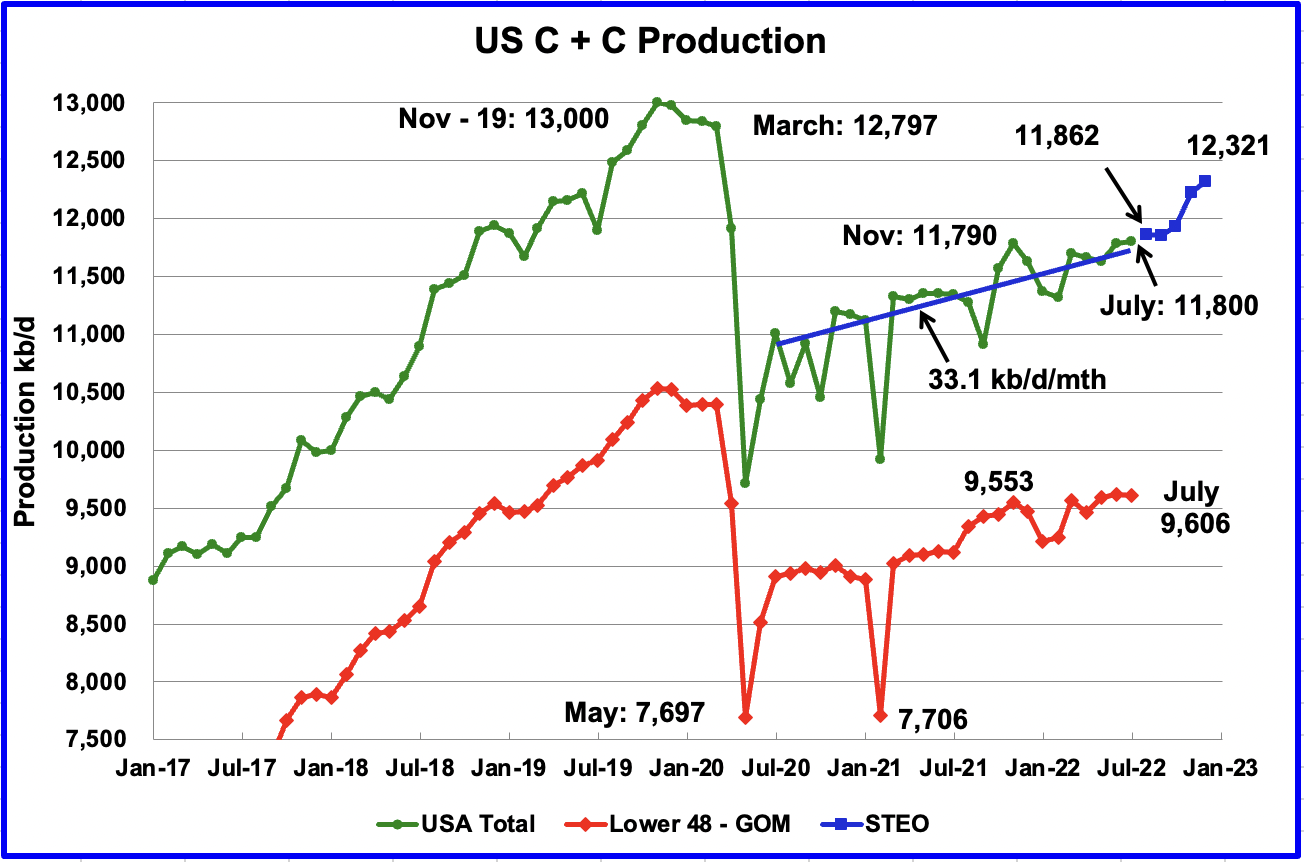
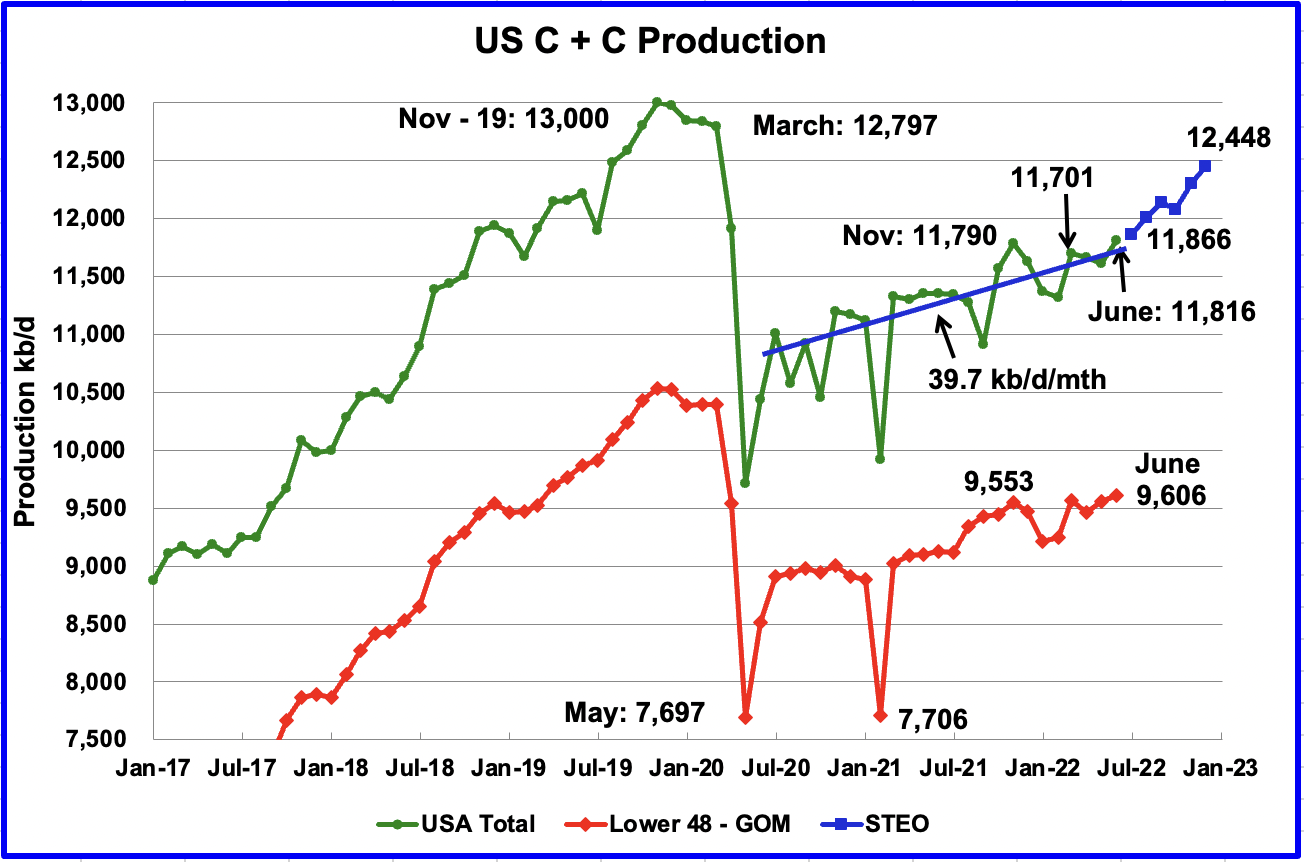
U.S. June production increased by 201 kb/d to 11,816 kb/d. Of the 201 kb/d increase, the largest increase came from the GOM, 183 kb/d. June’s production was a new recent high at 26 kb/d higher than November 2021 which was producing at a rate of 11,790 kb/d.

Read More

US March Oil Production Recovers

A guest post by Ovi

All of the oil (C + C) production data for the US state charts comes from the EIAʼ’s Petroleum Supply monthly PSM. 

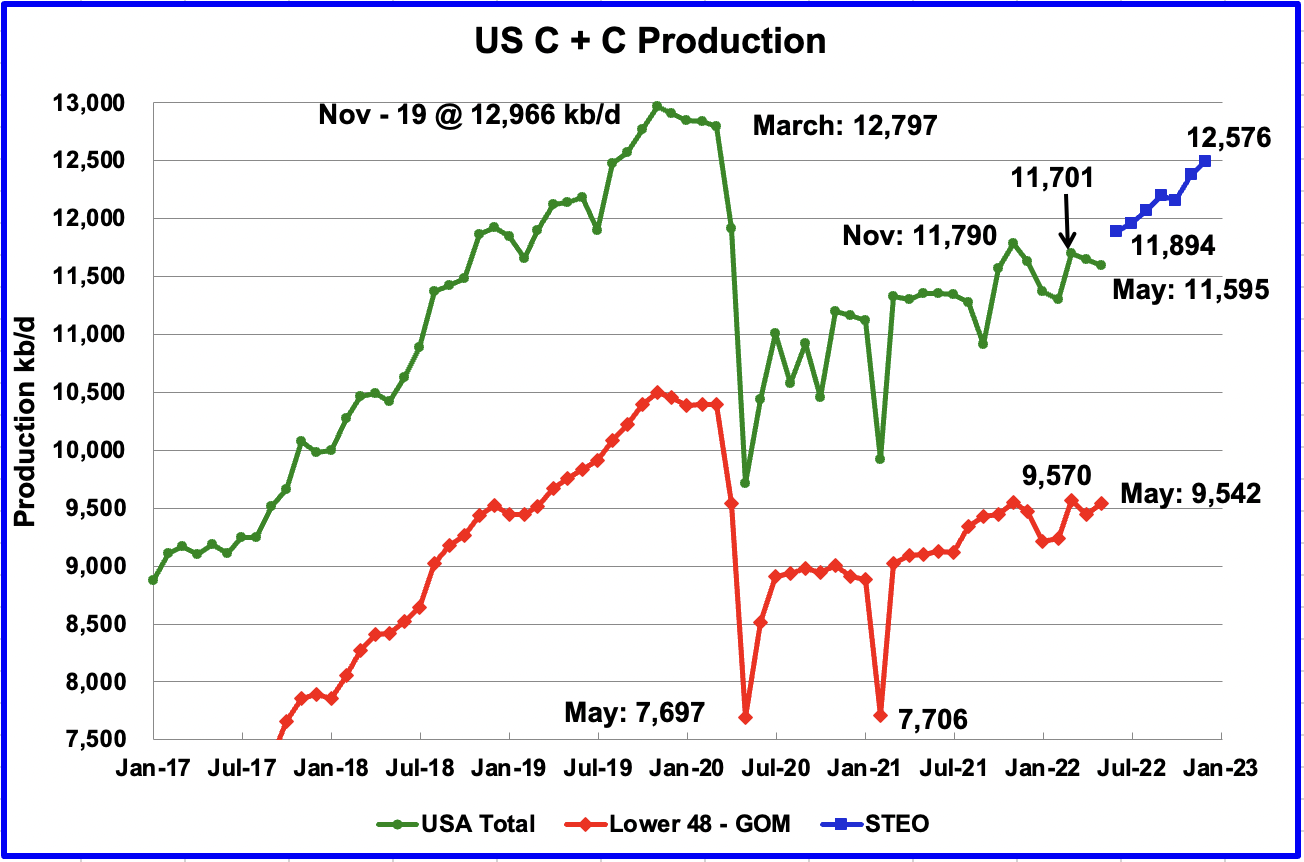
U.S. March production increased by 349 kb/d to 11,655 kb/d. Relative to November’s 2021 production of 11,769 kb/d, March is still 114 kb/d lower. The main increases came from Texas 147 kb/d, ND 66 kb/d and the GOM 75 kb/d.

Read More

Gulf of Mexico update

Through 2021 the federal waters of the northern Gulf of Mexico (OCS) have cumulative production of 23.4 Bbo and 193 Tcf.  The deepwater (water depths > 1000’ as defined by BOEM) has produced 10.2 Bbo and 23.5 Tcf while the shelf has produced 13.2 Bbo and 169.5 Tcf.  From a BOE standpoint, the GOM has primarily been a gas province, and the bulk of that production has come from shelf fields.  While the shelf has produced more cumulative oil than deepwater, over 90% of current oil production comes from deepwater fields. 

First production from the OCS occurred in 1947.  First deepwater production was in 1979 from Shell’s Cognac field in 1022’ of water.  GOM oil production in December 2021 was 1.69 mmbopd as per BSEE.  As Ovi says in his monthly updates, if GOM were a state, it would be the 2nd leading oil producing state in the US, only behind Texas.

Brief history of GOM gas production

GOM gas production peaked in 1997 at 14.4 bcf/day and has been declining ever since.  Current gas production is about 2 bcf/day. 

Figure 1 – GOM gas production, with shelf and deepwater broken out.  Data from BOEM.

Read More

US February Oil Production Surprises to the Downside

A guest post by Ovi

All of the oil (C + C) production data for the US state charts comes from the EIAʼ’s Petroleum Supply monthly PSM. 

U.S. February production decreased by a surprising 50 kb/d to 11,312 kb/d. Relative to November 2021 production of 11,773 kb/d, it has dropped by 461 kb/d. The main declining states were Texas 27 kb/d and ND 23 kb/d.  The major decliner was the GOM which dropped by 93 kb/d. Of the top 3 states, only New Mexico increased its production.

Read More