By Ovi
The focus of this post is an overview of World oil production along with a more detailed review of the top 11 Non-OPEC oil producing countries. OPEC production is covered in a separate post.
Below are a number of Crude plus Condensate (C + C) production charts, usually shortened to “oil”, for the oil producing countries. The charts are created from data provided by the EIA’s International Energy Statistics and are updated to August 2025. This is the latest and most detailed/complete World oil production information available. Information from other sources such as OPEC, IEA, STEO and Country specific sites such as Brazil, Norway, Mexico, Argentina and China is reported to provide a one or two month outlook.

The World’s August oil production increased by 405 kb/d to 85,244 kb/d, a new World Peak Oil All Time High. Last month’s projection for August’s production was 85,465 kb/d, too high by 221 kb/d.
This chart also projects World C + C production out to December 2026. It uses the December 2025 STEO report along with the International Energy Statistics to make the projection. Production in September is projected to increase by 1,439 kb/d to 86,683 kb/d, if correct, another new World Peak Oil next month. The large September C + C increase is due to the 1,165 kb/d increase in crude production shown in the crude graph. That increase then drops in December. The large drop is just as surprising as the increase.
The 12 month highest CMA shown at March 2026 is 85,547 kb/d vs the September 2018 12 month CMA of 82,962 kb/d.
For December 2026, production is projected to be 85,519 b/d, a downward revision of 146 kb/d from last month.
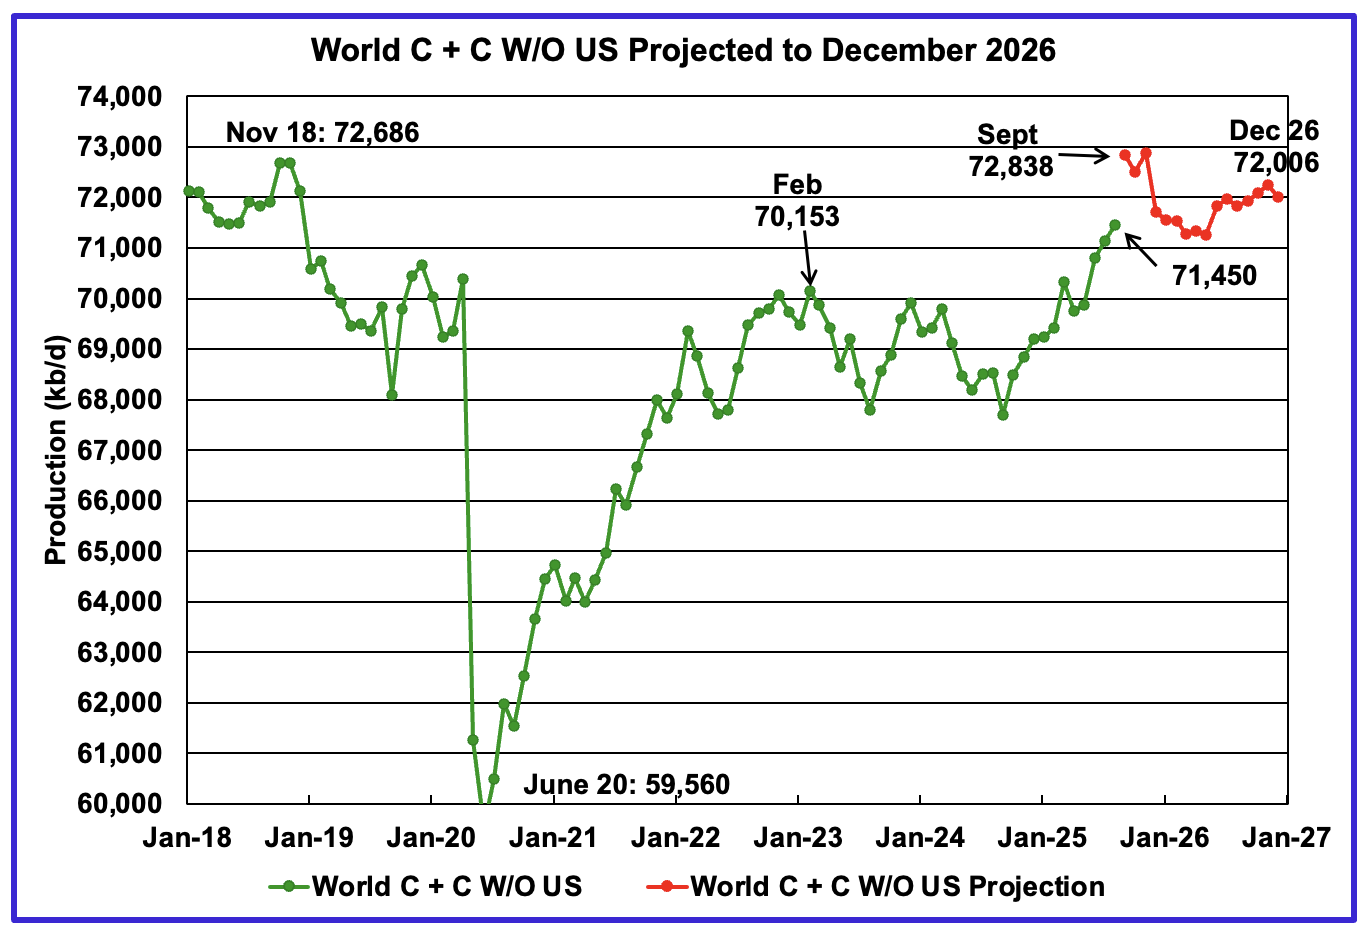
August’s World oil output without the US increased by 318 kb/d to 71,450 kb/d. September’s production is expected to increase by 1,388 kb/d to 72,838 kb/d.
The projection is forecasting that December 2026 oil production will be 72,006 kb/d, an increase of 556 kb/d from August.
A Different Perspective on World Oil Production
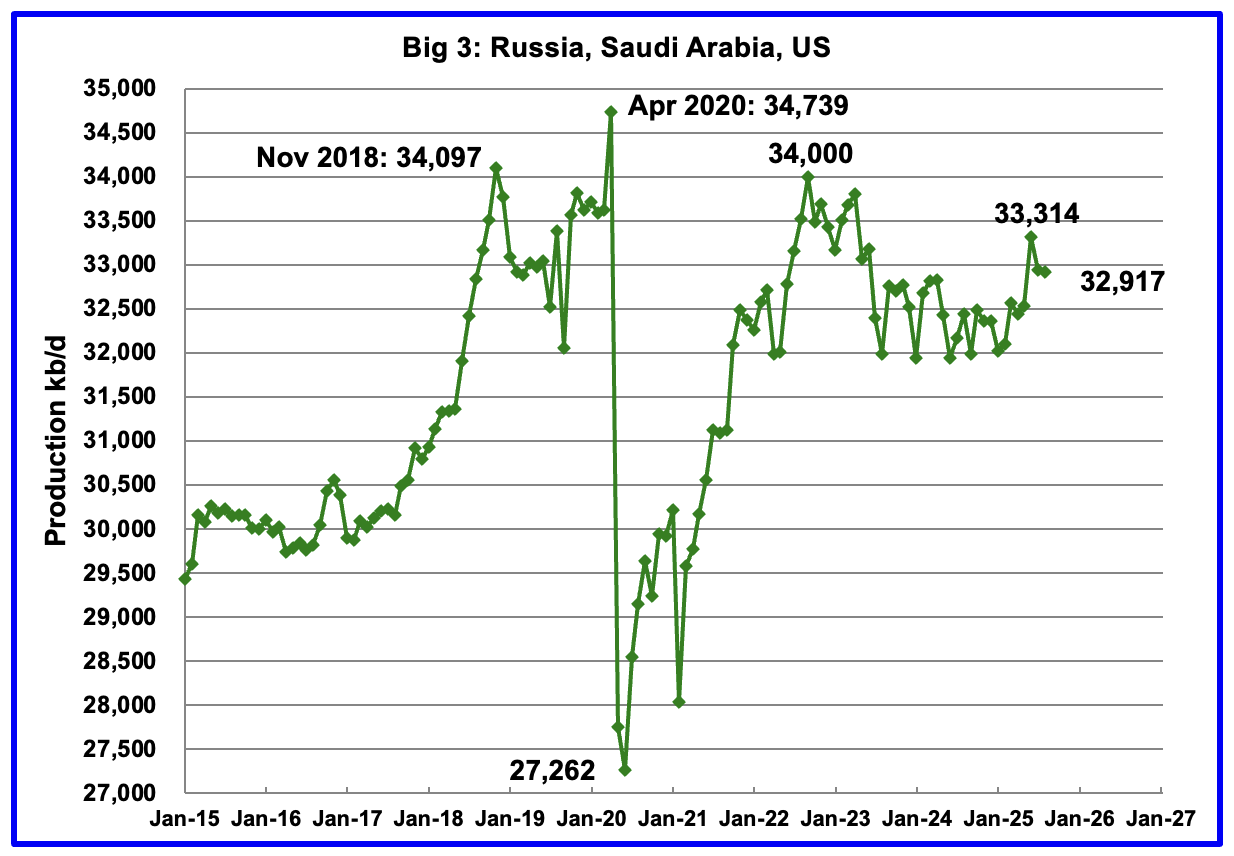
August’s Big 3 oil production decreased by 24 kb/d to 32,917 kb/d. Saudi Arabia contributed a 100 kb/d drop to that decrease while the US added 86 kb/d. While August’s drop was largely due to Saudi Arabia, OPEC’s increasing production which started in April 2025 will continue up to December 2026 and will reverse this unexpected one month drop.
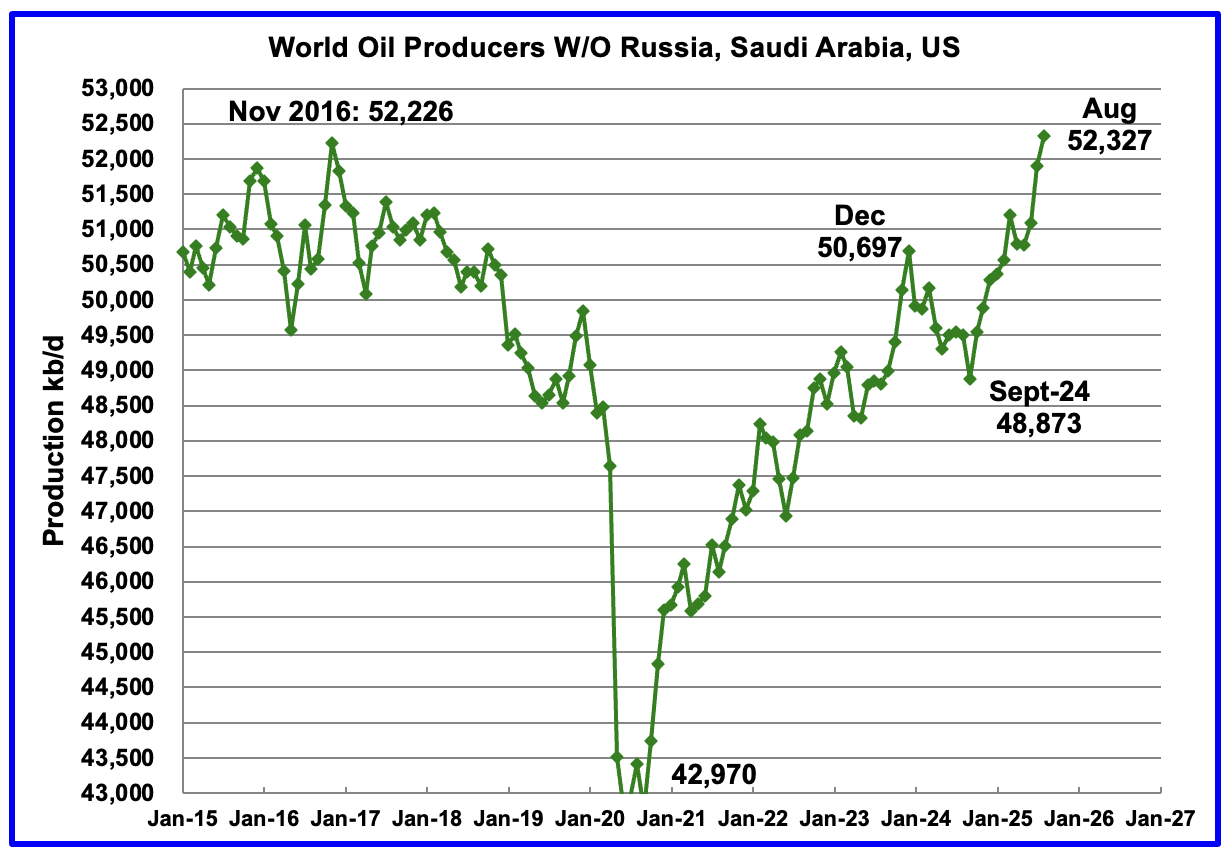
Production in the remaining countries has been slowly increasing since the September 2020 low of 42,970 kb/d. Production in August 2025 rose by 429 kb/d to a new high of 52,327 kb/d.
Countries Expected to Grow Oil Production
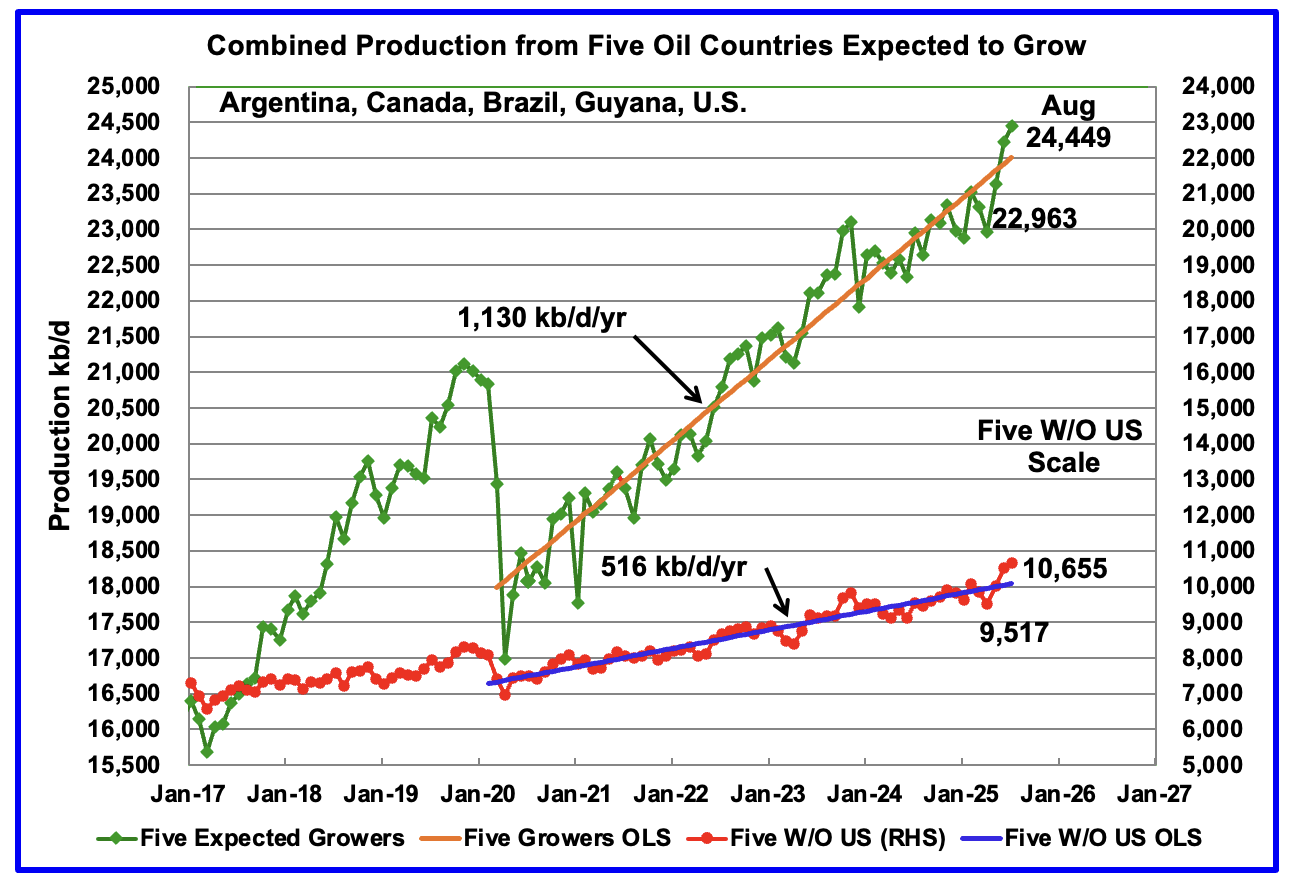
This chart was first posted a number of months back and shows the combined oil production from five Non-OPEC countries, Argentina, Brazil, Canada, Guyana and the U.S., whose oil production is expected to grow. These five countries are often cited by OPEC and the IEA for being capable of meeting the increasing World oil demand for next year. For these five countries, production from April 2020 to July 2024 rose at an average rate of 1,130 kb/d/year as shown by the orange OLS line.
To show the impact of US growth over the past 5 years, U.S. production was removed from the five countries and that graph is shown in red. The production growth slope for the remaining four countries has been reduced by 614 kb/d/yr to 516 kb/d/yr.
August production has been added to the five growers chart, up by 439 kb/d to 24,449 kb/d. Of the 439 kb/d, Guyana added 250 kb/d, U.S. added 86 kb’d and Argentina added 44. For the Five growers W/O U.S., August production rose to 10,655 kb/d, up 146 kb/d from July.
Note: The OLS lines are updated to July.
World Oil Countries Ranked by Production
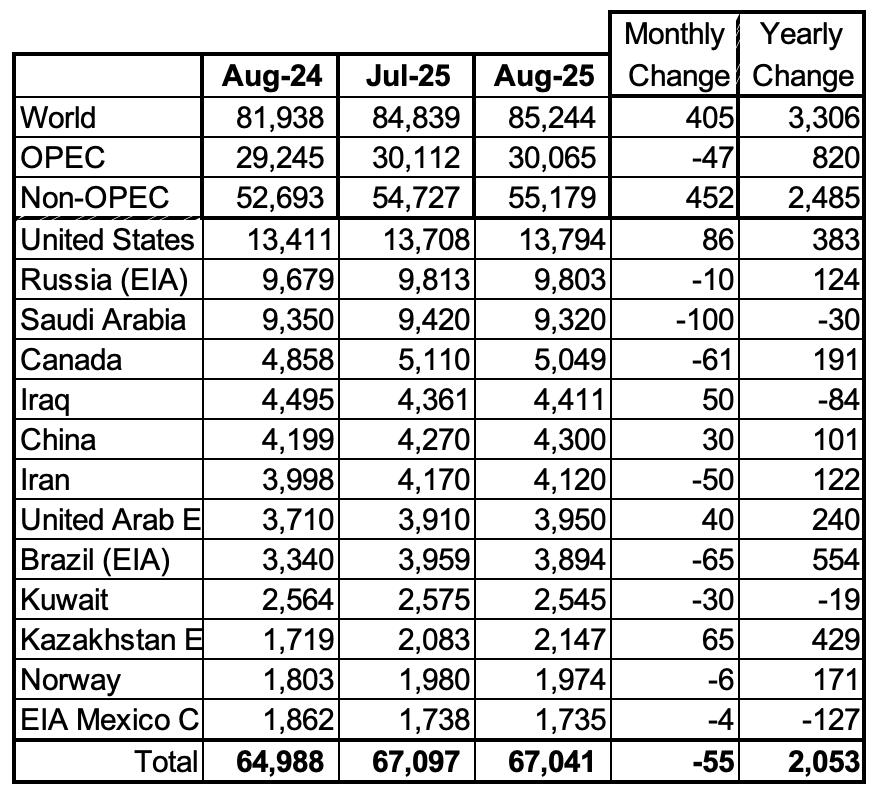
Above are listed the World’s 13th largest oil producing countries. In August 2025 these 13 countries produced 78.6% of the World’s oil. On a MoM basis, production decreased by 55 kb/d in these 13 countries while on a YOY basis production rose by 2,053 kb/d. Note the YoY increases from Brazil, Kazakhstan and U.S.
August Non-OPEC Oil Production Charts
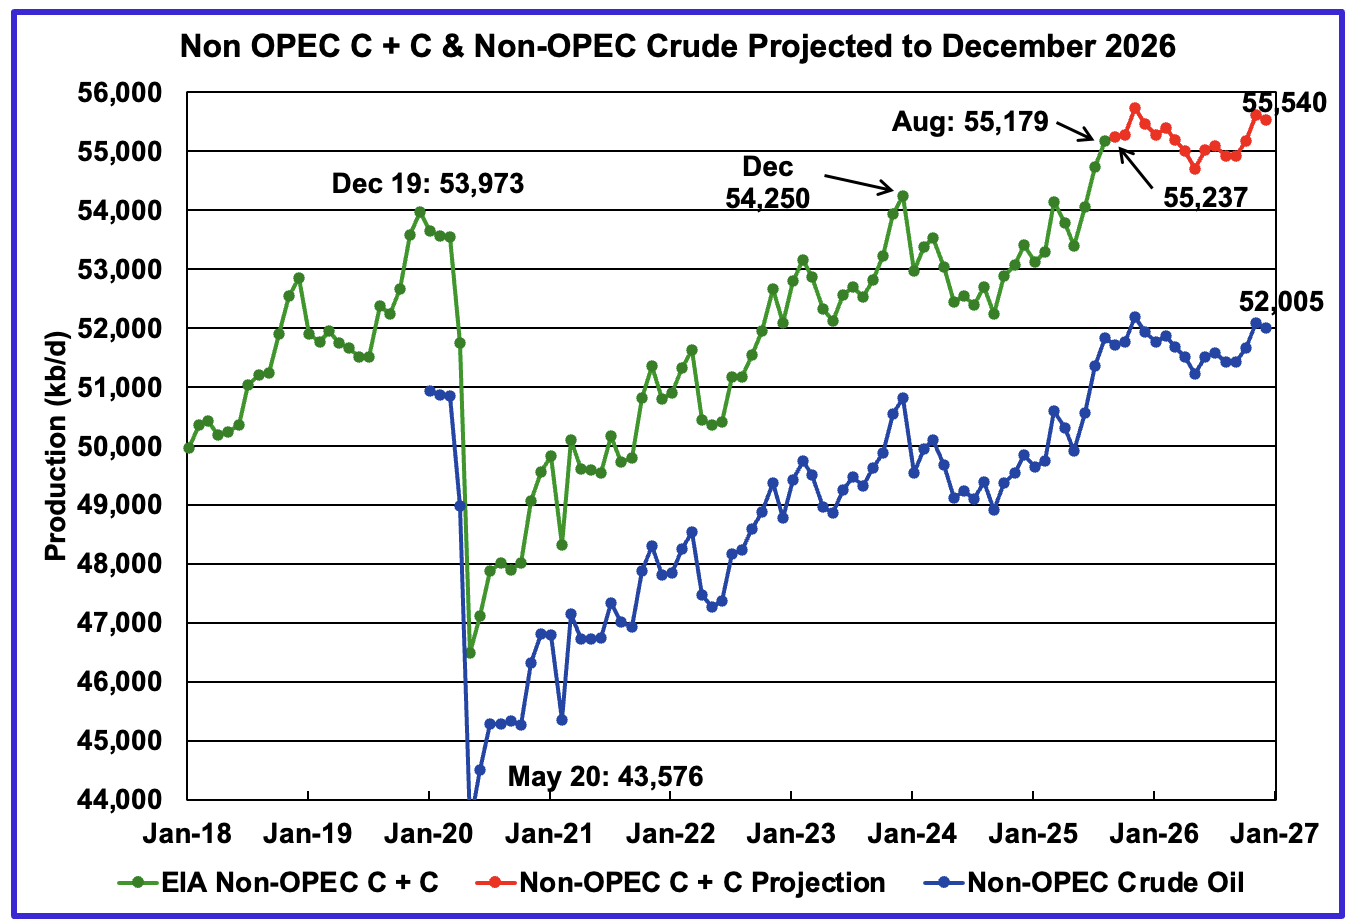
August’s Non-OPEC oil production increased by 452 kb/d to 55,179 kb/d. September is expected to add an additional 58 kb/d to 55,237 kb/d.
Using data from the December 2025 STEO, a projection for Non-OPEC oil output was made for the period August 2025 to December 2026. (Red graph). Output is expected to grow by 361 kb/d to reach 55,540 kb/d in December 2026.
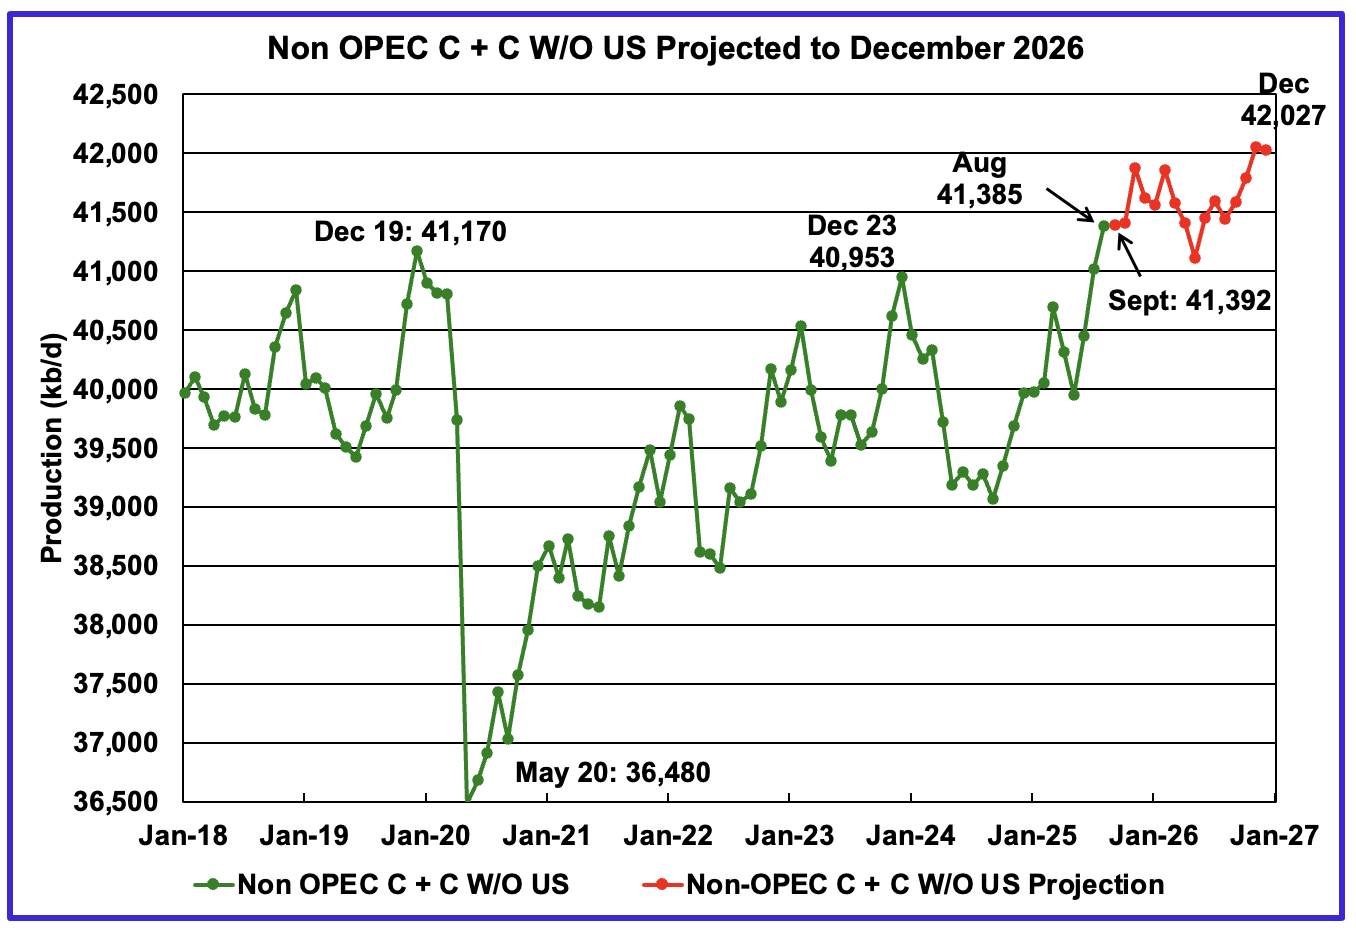
August’s Non-OPEC W/O US oil production increased by 366 kb/d to 41,385 kb/d. September’s production is projected to add 7 kb/d to 41,392 kb/d.
From August 2025 to December 2026, production in Non-OPEC countries W/O the U.S. is expected to increase by 642 to 42,027 kb/d.
Non-OPEC Oil Countries Ranked by Production
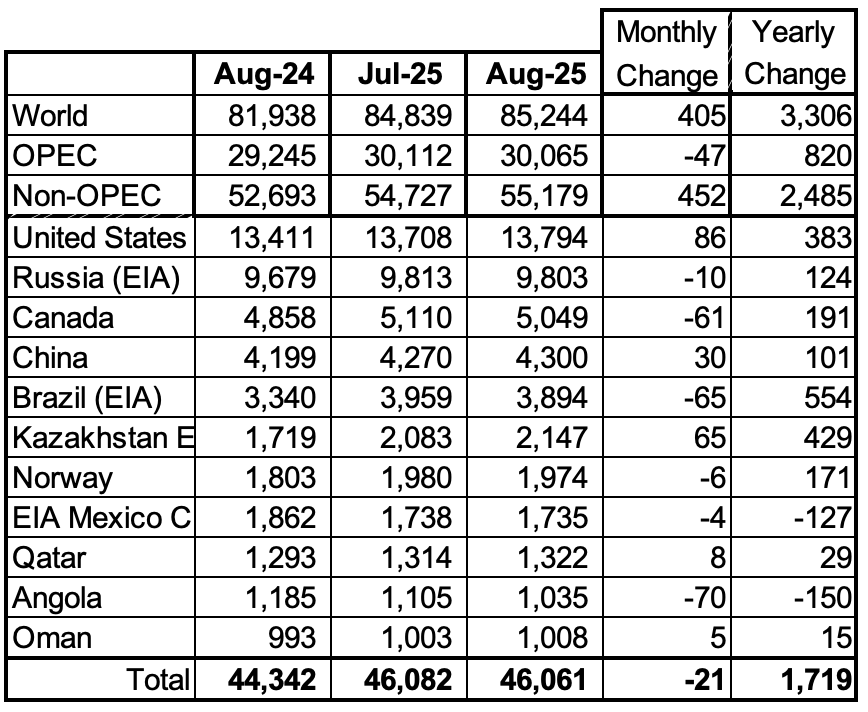
Listed above are the World’s 11 largest Non-OPEC producers. The original criteria for inclusion in the table was that all of the countries produced more than 1,000 kb/d. Both Oman and Angola were below 1,000 kb/d for a few months but have rebounded to above 1,000 kb/d.
August’s MoM production decreased by 21 kb/d to 46,061 kb/d for these eleven Non-OPEC countries while as a whole the Non-OPEC countries saw a yearly production increase of 2,485 kb/d to 55,179 kb/d. Major yearly gains came from Brazil, Kazakhstan and U.S.
In August 2025, these 11 countries produced 83.5% of all Non-OPEC oil.
Non-OPEC Country’s Oil Production Charts
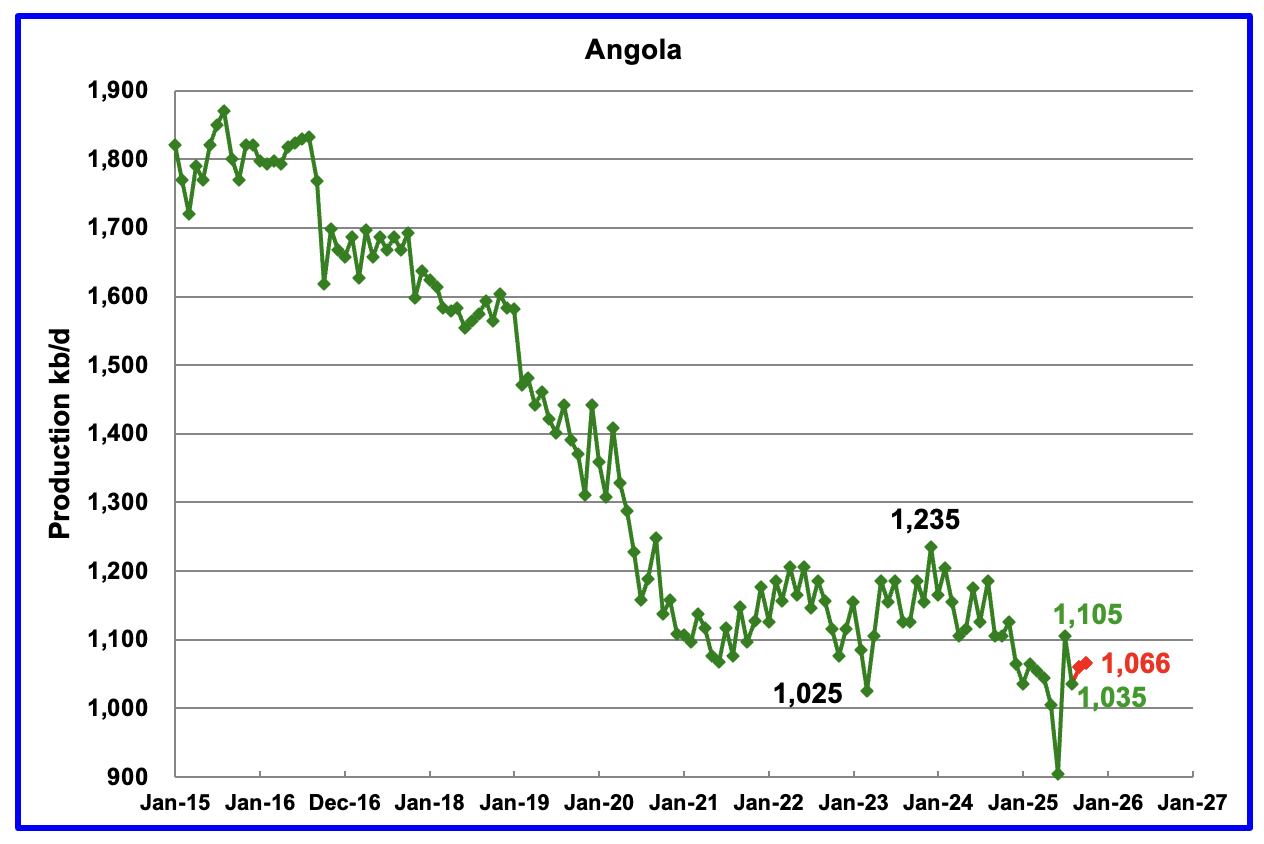
Angola’s August oil production dropped by 70 kb/d to 1,035 kb/d. I think the large drop is associated with the extra large 200 kb/d increase reported last month by the EIA. According to the National Agency for Petroleum, Gas and Biofuels, (NAP) July production was 999 kb/d. For August the NAP reported production was 1,035 kb/d, same as the EIA.
According to the NAP, October production rose to 1,066 kb/d, red markers.
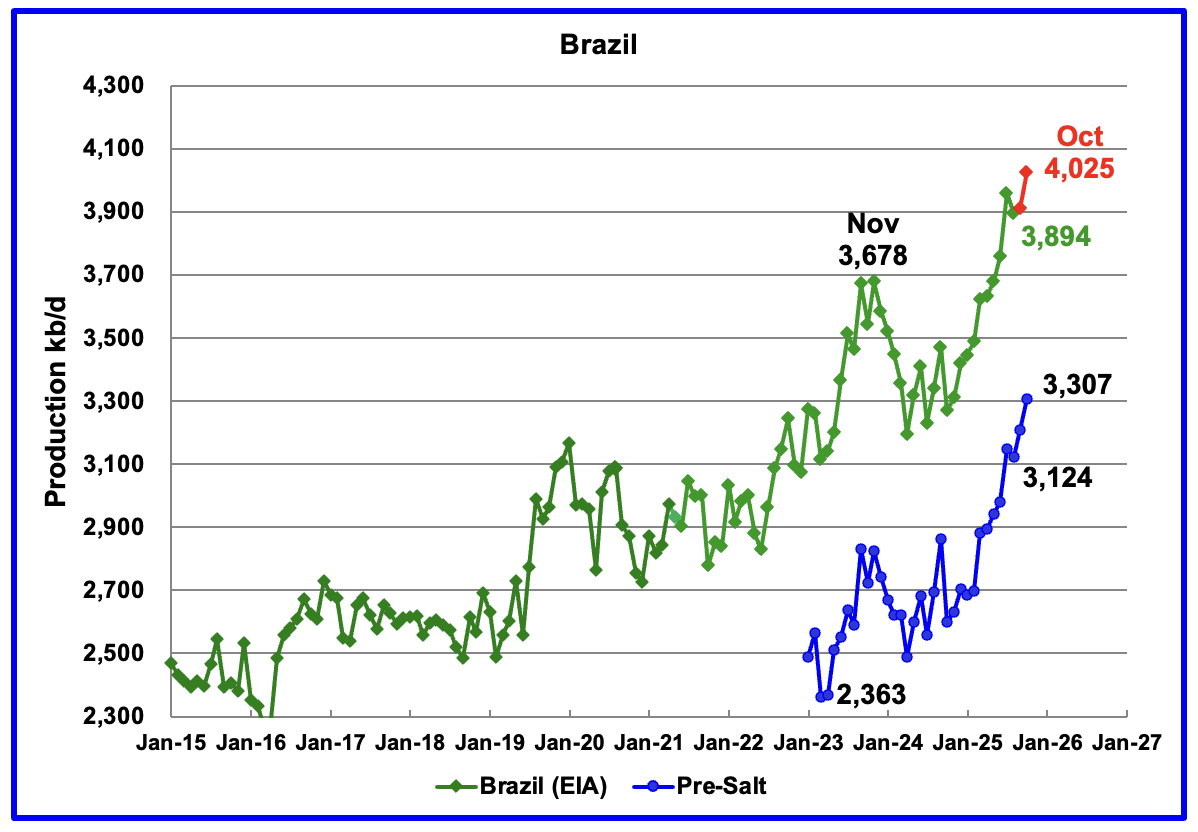
The EIA reported that Brazil’s August production decreased by 65 kb/d to 3,894 kb/d.
Brazil’s National Petroleum Association (BNPA) reported that production rose slightly in September and then rose by 116 kb/d in October to 4,025 kb/d, a new record high. The pre-salt blue graph tracks Brazil’s trend. Pre-salt production increased by 100 kb/d in October to 3,307 kb/d, also a new high.
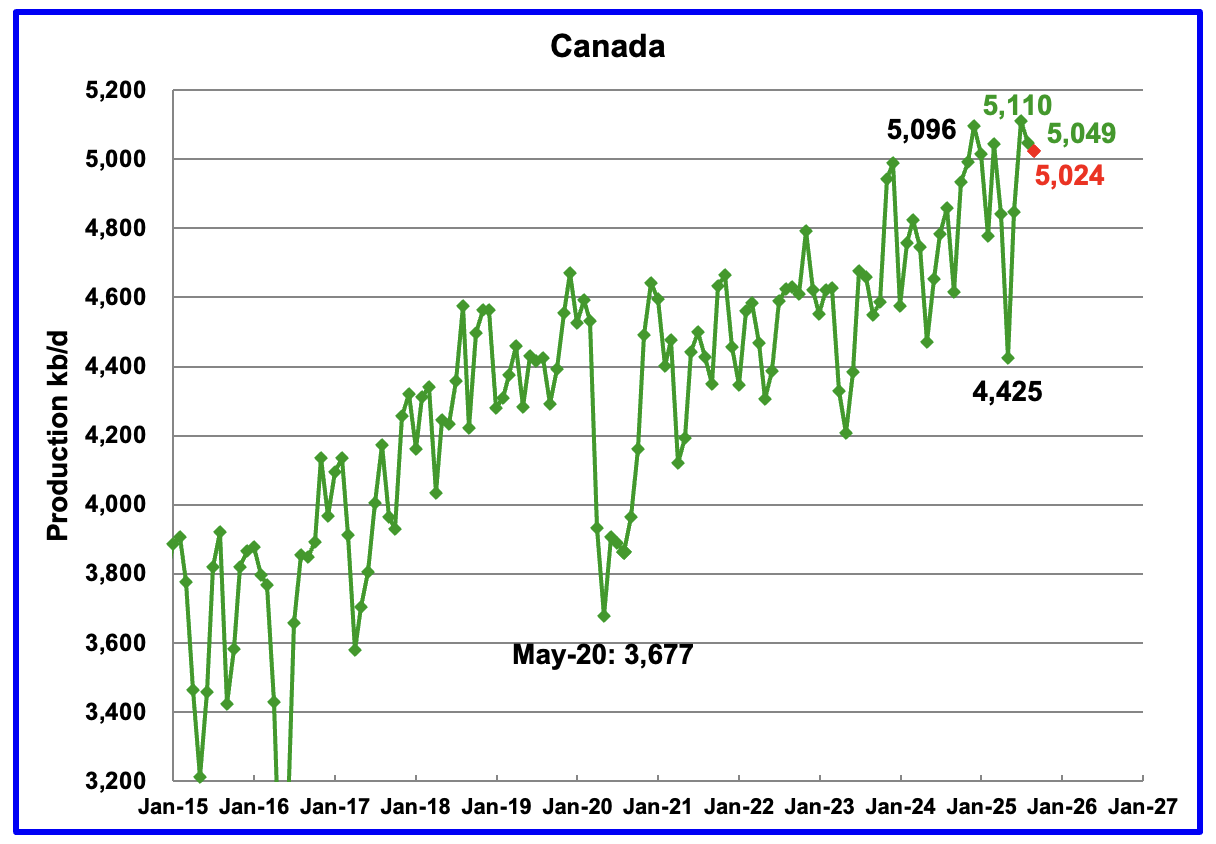
Canada’s oil production decreased by 61 kb/d in August to 5,049 kb/d.
A projection has been made for September production based on preliminary production provided by the Canada Energy Regulator (CER). September’s projected production dropped to 5,024 kb/d. The CER estimate contains some NGLs which have been removed from the projection. On average the EIA reduces the CER’s monthly production by 370 kb/d.
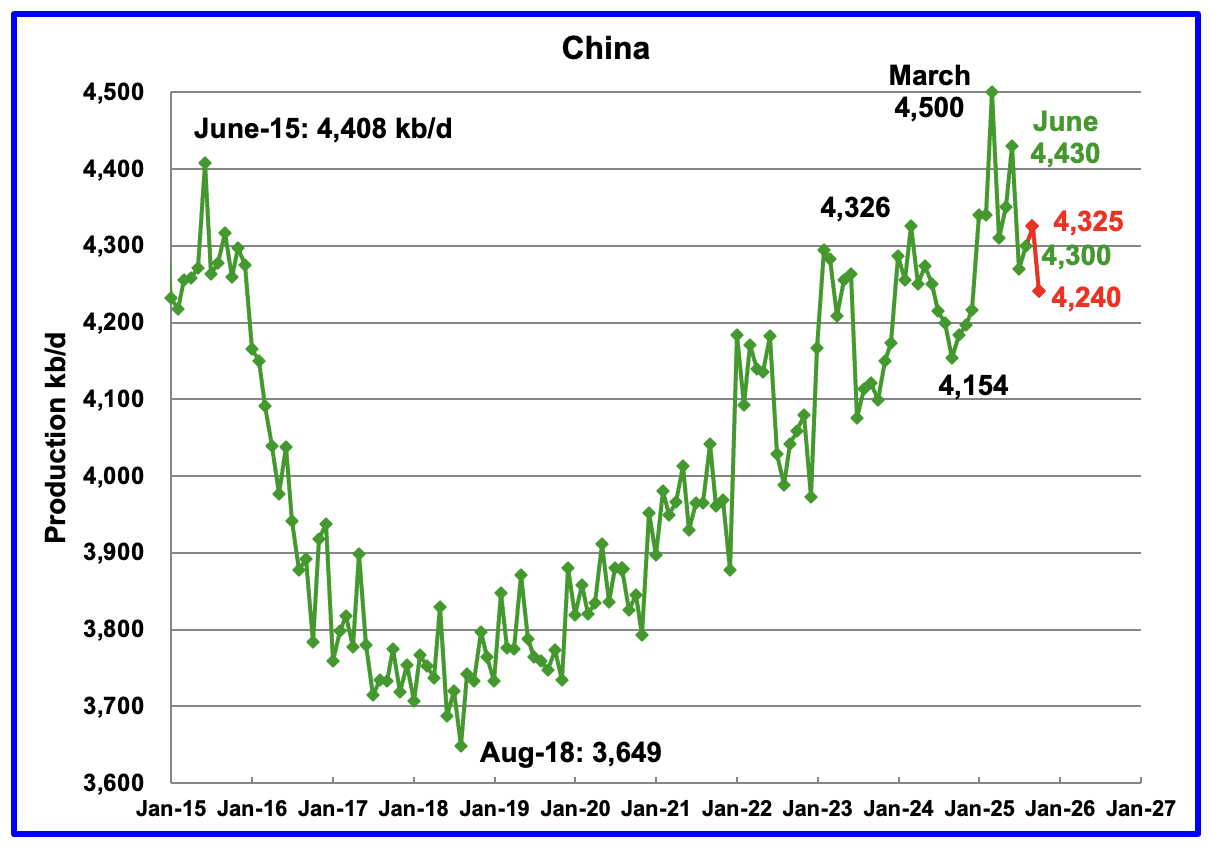
The EIA reported China’s August oil output rose by 30 kb/d to 4,300 kb/d.
The China National Bureau of Statistics reported September production rose to 4,325 kb/d and then in October dropped by 85 kb/d to 4,240 kb/d.
On a YoY basis, China’s August production increased by 101 kb/d from 4,199 kb/d.
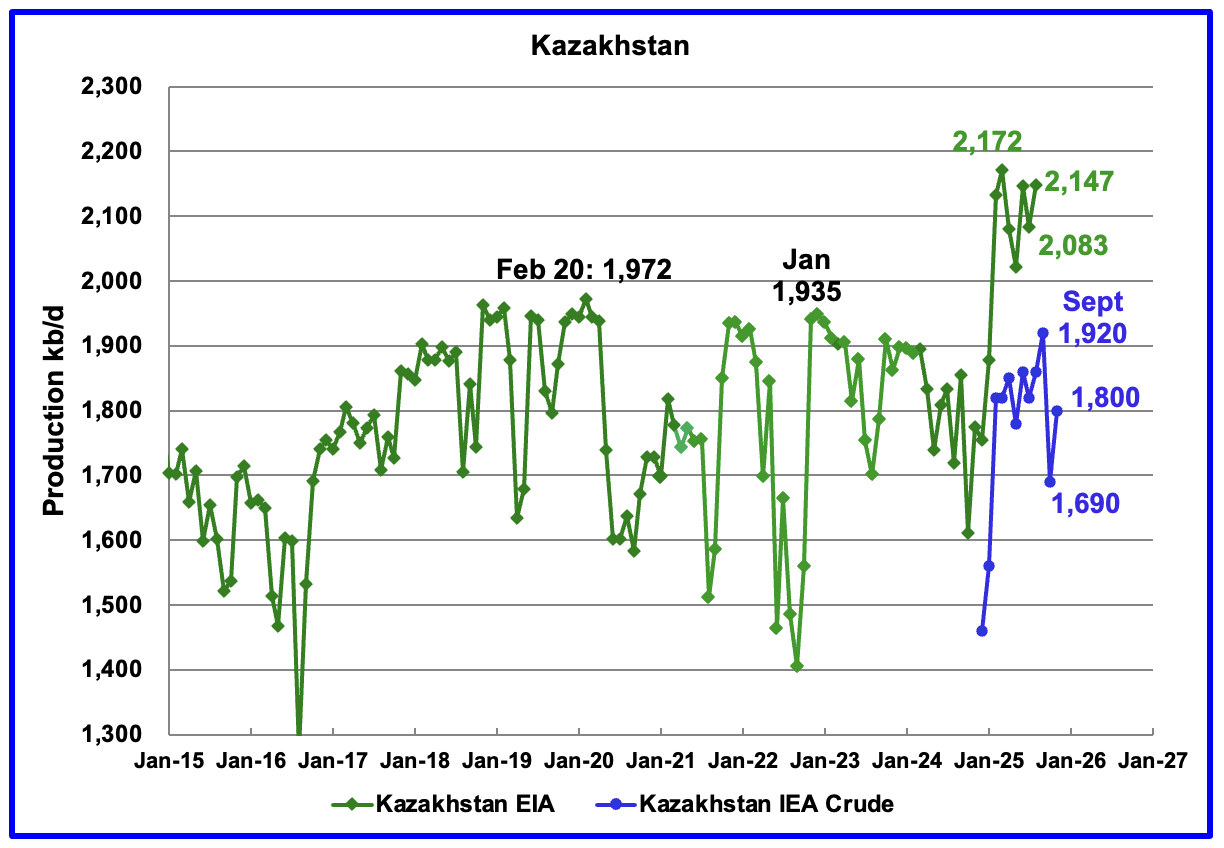
According to the EIA, Kazakhstan’s August oil output increased by 65 kb/d to 2,147 kb/d.
Since Argus no longer reports OPEC + crude production, production data for Kazakhstan will now be taken from the monthly IEA reports. In September 2025 pre-salt crude production rose to 1,920 kb/d, an upward revision of 80 kb/d from the IEA’s October report. In the IEA’s December report, they are reporting October’s production dropped by 230 kb/d to 1,690 kb/d and then rose to 1,800 kb/d in November.
The November oil production is 320 kb/d above the OPEC + target set for Kazakhstan.
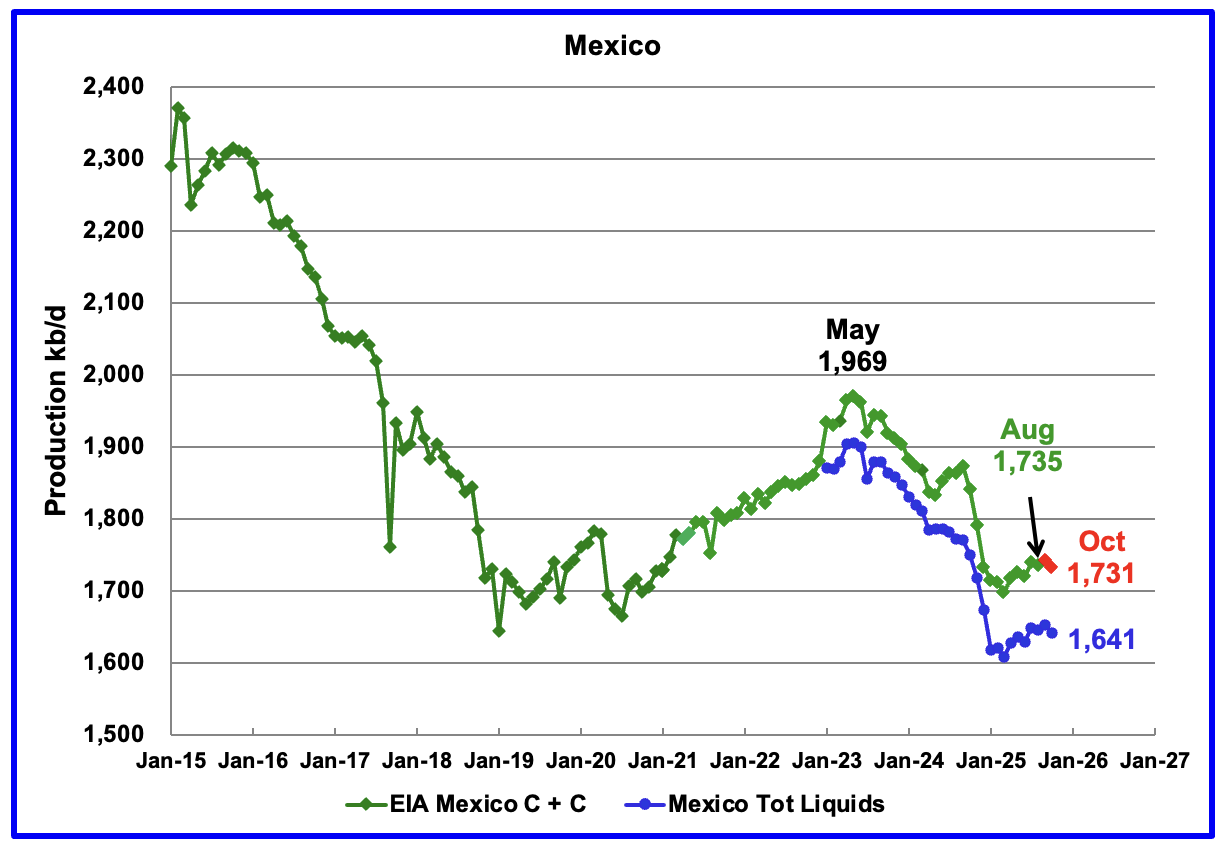
According to the EIA, Mexico’s August output dropped by 4 kb/d to 1,735 kb/d.
In June 2024, Pemex issued a new and modified oil production report for Heavy, Light and Extra Light oil. It is shown in blue in the chart and it appears that Mexico is not reporting condensate production when compared to the EIA report.
In earlier EIA reports, they would add close to 55 kb/d of condensate to the Pemex’s “Total Liquids” report. More recently, the EIA has been adding 90 kb/d of condensate to Mexican production. For September and October production, 90 kb/d have been added to the estimate. October’s production is estimated to be close to 1,731 kb/d. Note that Mexico’s production, as reported by them for the last four months has stabilized around 1,650 kb/d according to Pemex.
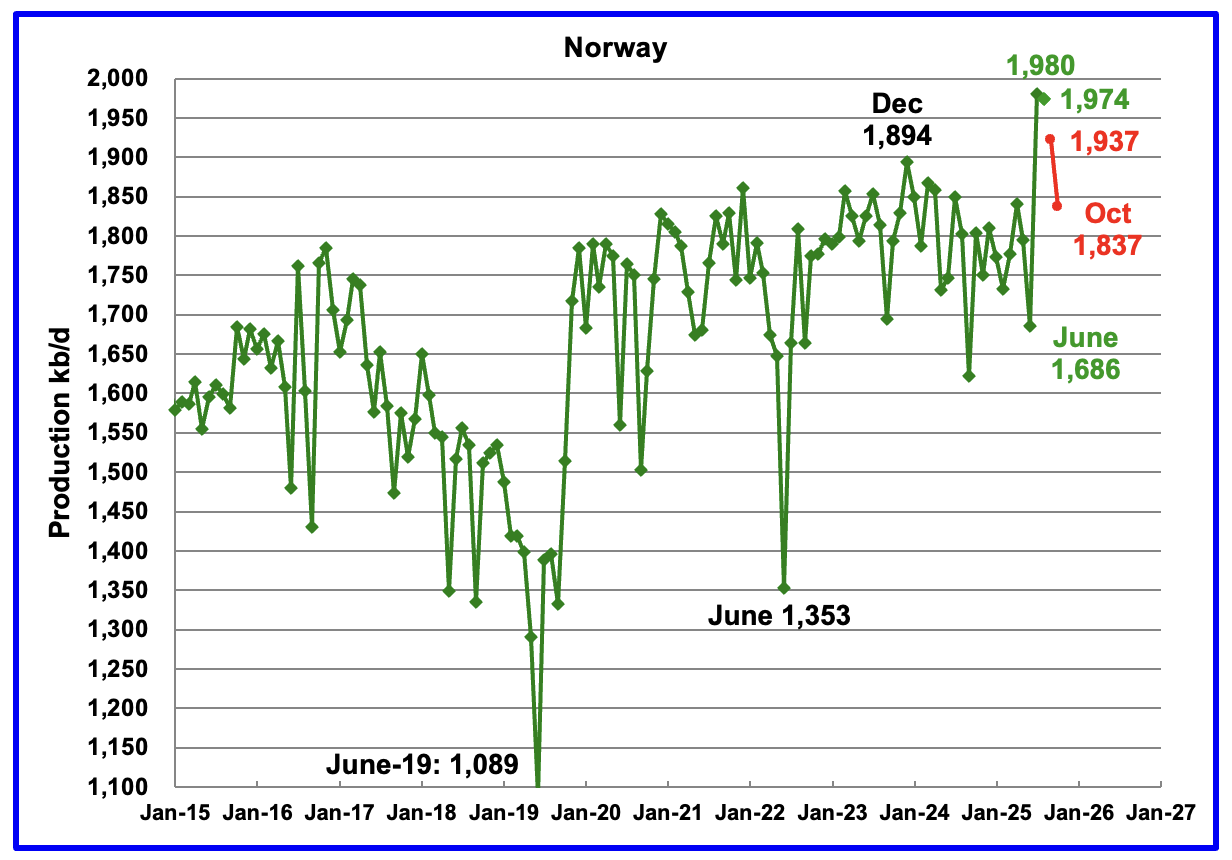
The EIA reported Norway’s August production dropped by 6 kb/d to 1,974 kb/d.
Separately, the Norway Petroleum Directorate (NPD) reported that October’s production dropped to 1,837 kb/d, red markers.
The Norway Petroleum Directorship also reported that October’s oil production was 0.4 % above forecast.
According to the November OPEC MOMR: “Throughout the rest of the year, production is expected to be supported by the Johan Castberg and Jotun FPSOs, alongside robust volumes from Johan Sverdrup.“
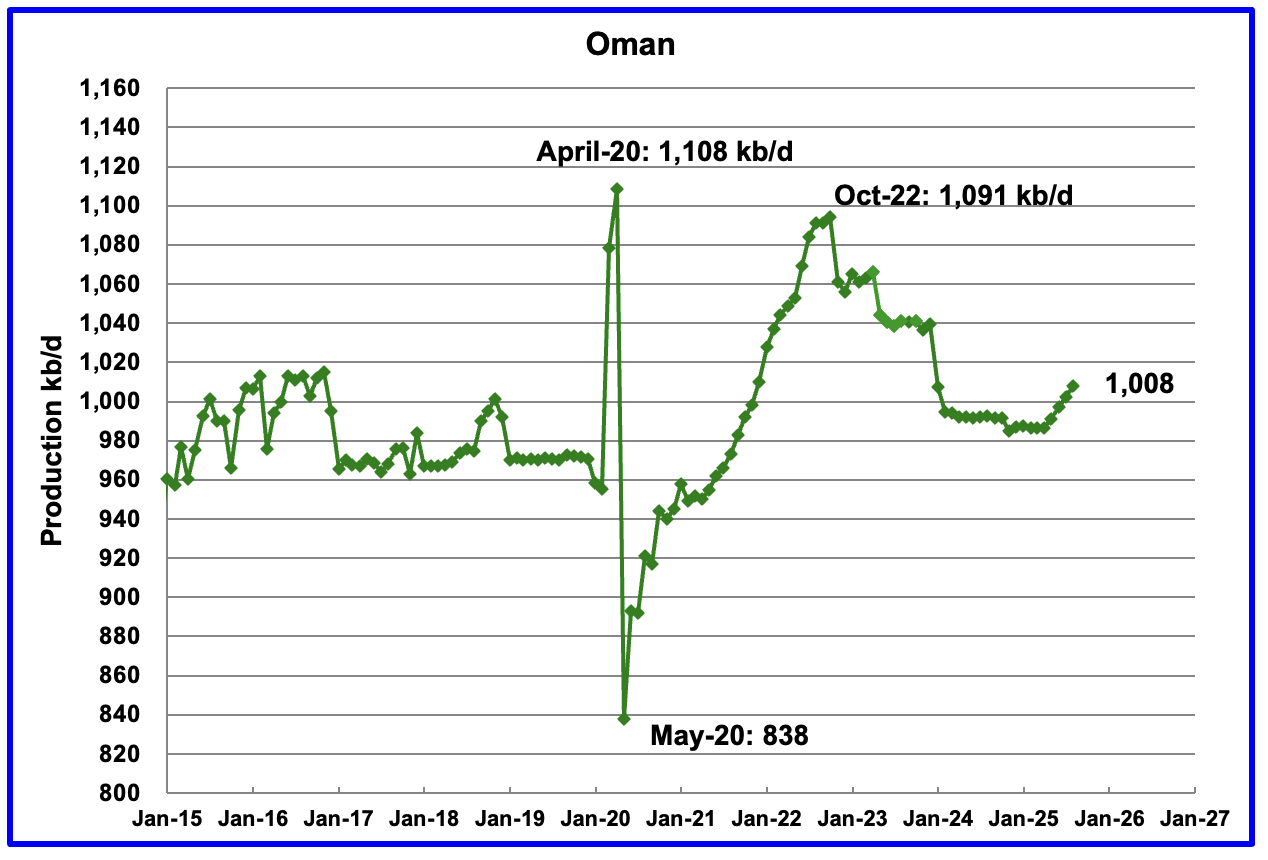
According to the EIA, August’s output rose by 5 kb/d to 1,008 kb/d and appears to have begun a budding growth phase. Previous production peaked in October 2022.
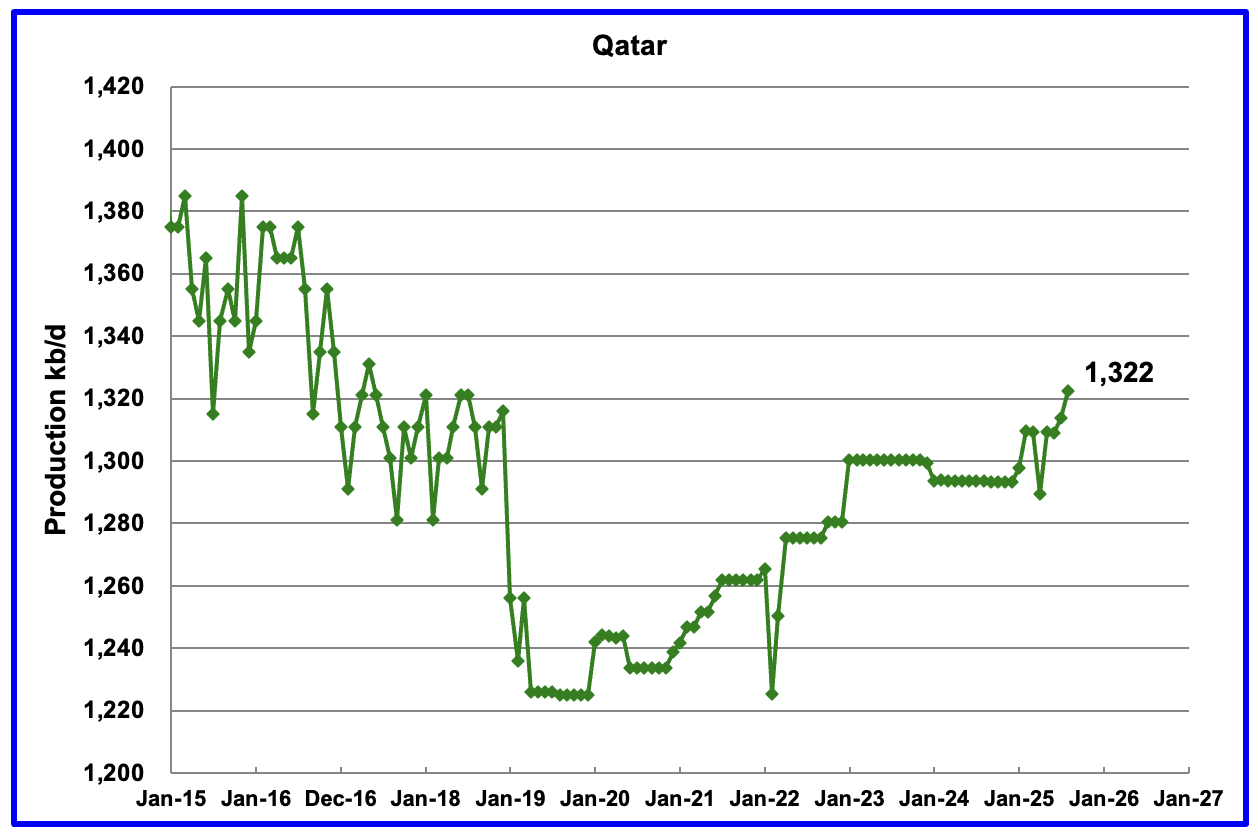
Qatar is now providing the EIA with monthly updated oil production back to January 2025. Qatar’s August output was reported to be 1,322 kb/d up 8 kb/d from July.
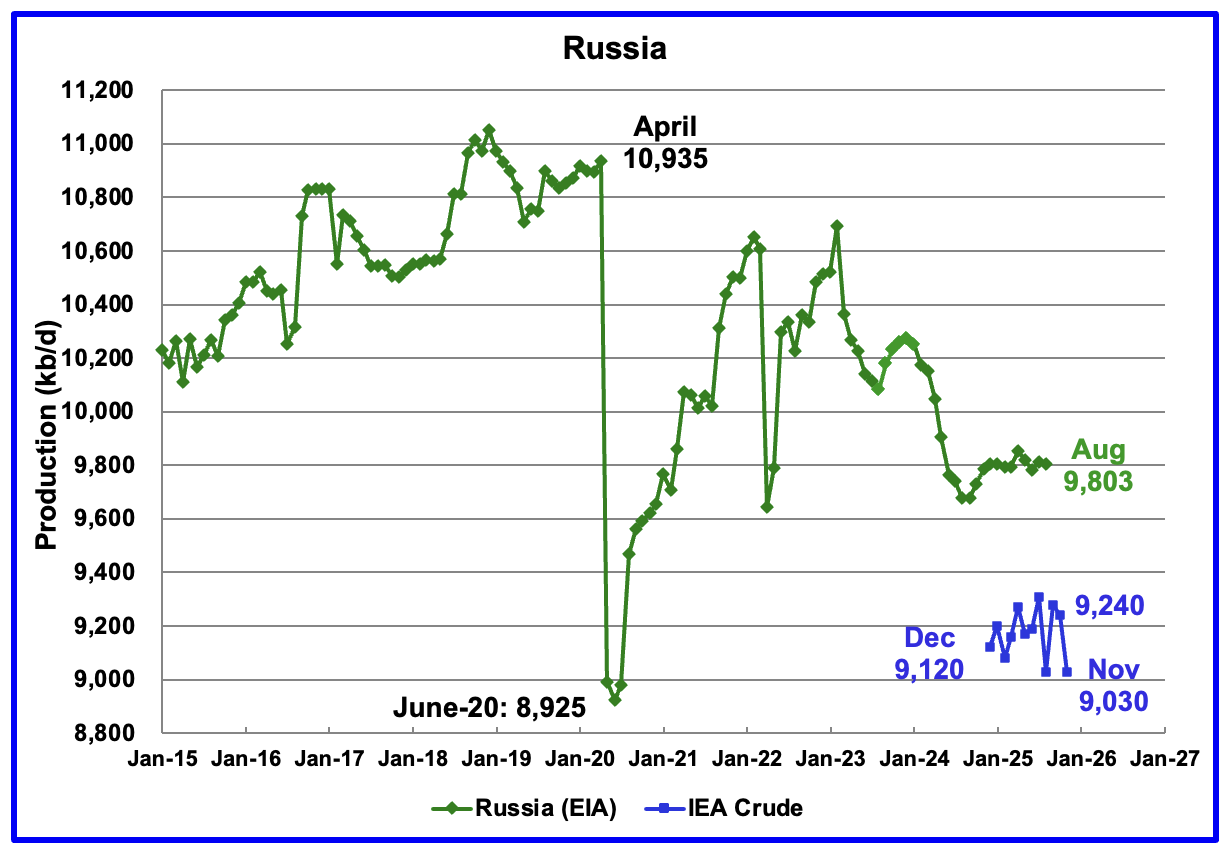
The EIA reported Russia’s August 2025 C + C production decreased by 10 kb/d to 9,803 kb/d and was up 124 kb/d from August 2024.
Up to August 2025 Argus Media used to report OPEC + crude production. That monthly report has now been discontinued. The above chart now also shows Russian production as reported by the IEA. It is difficult to assess the accuracy of the IEA report but over the last few months the IEA’s Russian production has been around 100 kb/d to 150 kb/d higher than Argus’ Media. The best that can be done at this time will be to compare the production trends between the EIA and the IEA. I think that Russian oil production continues to be a major state secret at this time because of the damage being caused by the heavy bombing to its crude oil processing related facilities.
According to the IEA December report, October crude production was 9,240 kb/d and then November production dropped by 210 kb/d to 9,030 kb/d. November production was 500 kb/d lower than the OPEC + target set for Russia and is the first month that may be showing the effects of Ukrainian bombing.
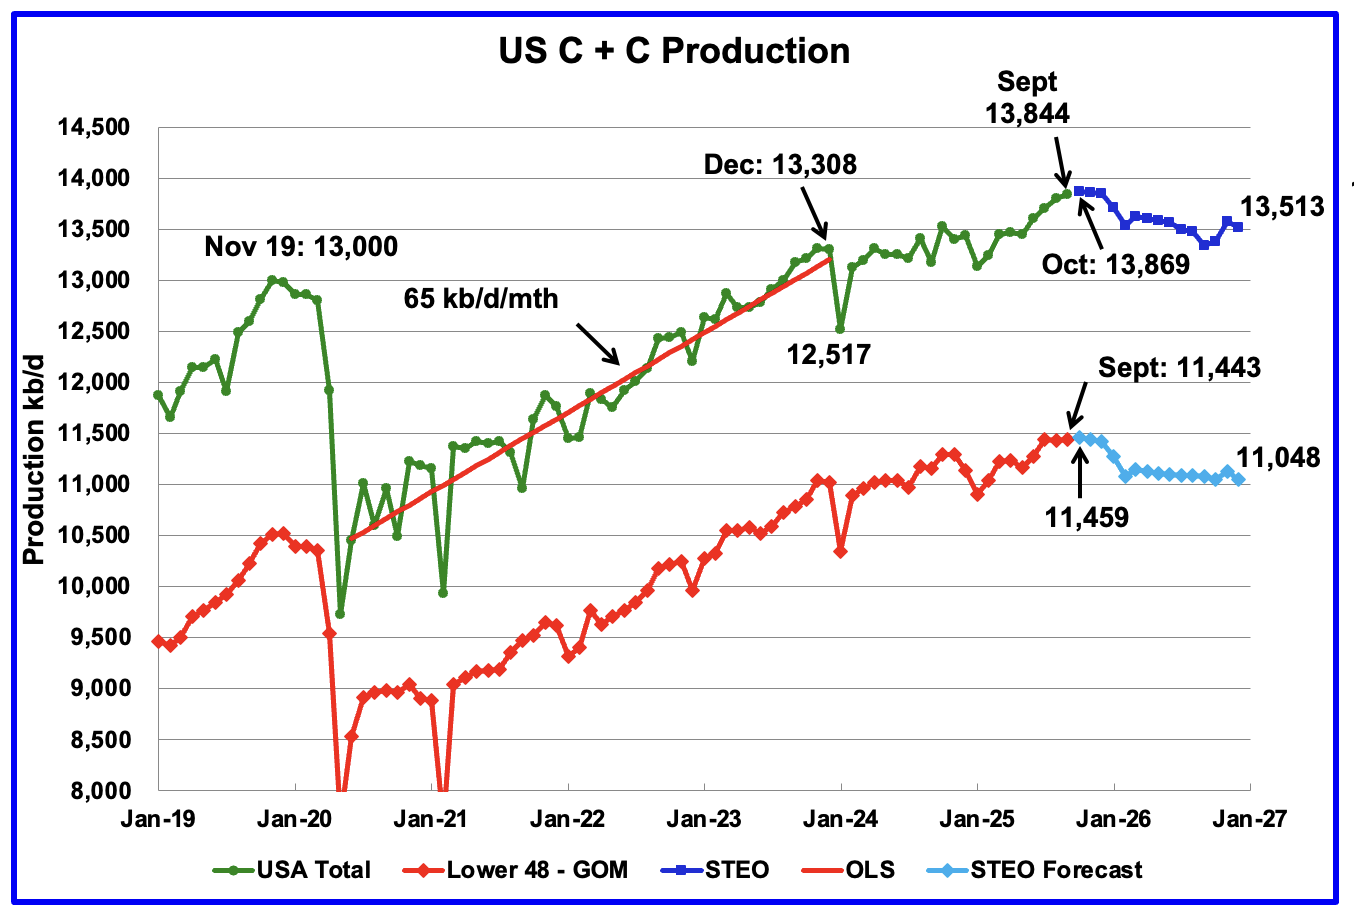
This US production chart up to August 2025 is the same as the one published last week in the US update post. However the projected portions of the two production graphs have been updated using the December 2025 STEO.
U.S. September projected production has been revised up by 74 kb/d to 13,869 kb/d.
Production in December 2026 is expected to be 13,513 kb/d, 92 kb/d lower than shown in last week’s US update. Production peaks in October 2025 and then begins a slow decline.
Note production in the Onshore L48 is essentially flat from July to December and begins to decline.
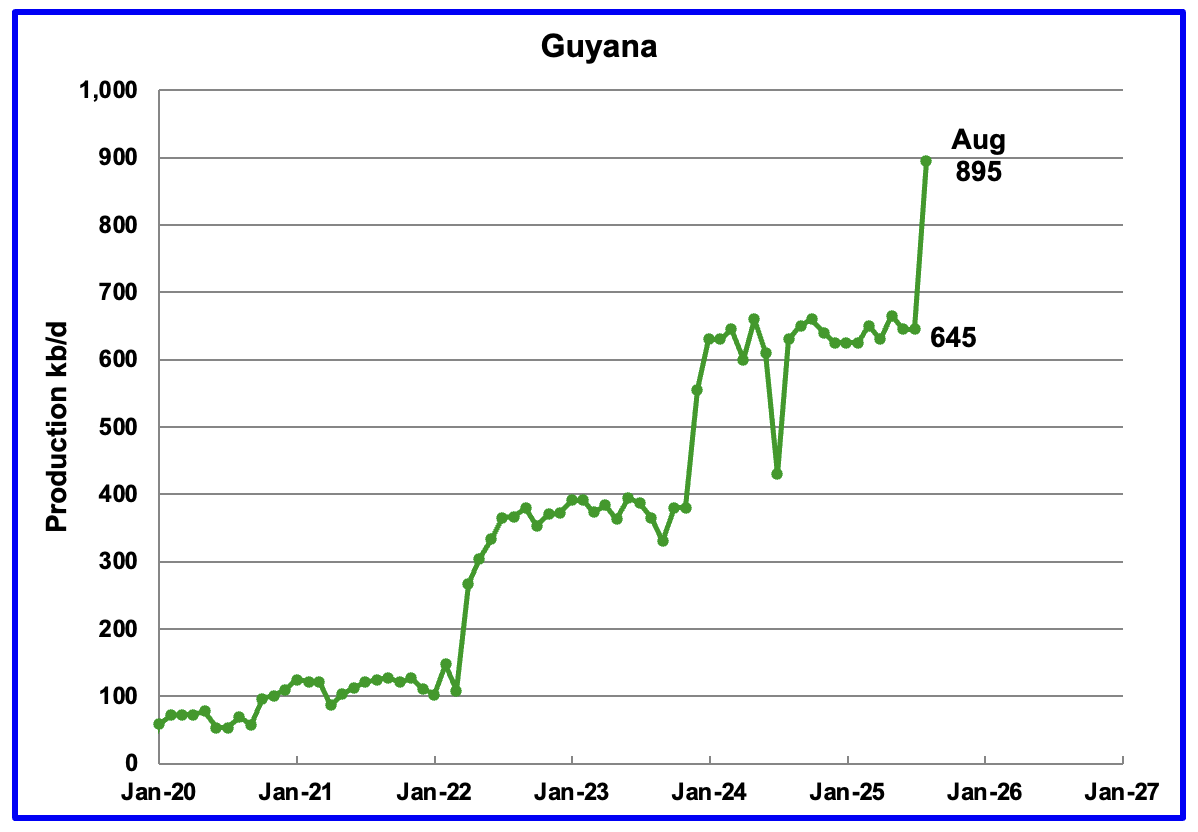
Oil Production in Guyana has been flat since January 2024. However for August 2025, production rose by 250 kb/d to a new high of 895 kb/d.
122 responses to “Record August World Oil Production”
You might want to change the bolding to the sentence “ The World’s August oil production increased by 405 kb/d to 85,244 kb/d, a new World Peak Oil All Time High.” That seems like the big news.
Nick
I thought the title was the big headline. I also wanted to point out that last month’s forecast was a bit on the high side and realized that everyone would read the whole paragraph when part of it is bolded.
Yes, it’s there in the title.
That’s funny – I don’t pay much attention to titles. That’s because most of them are terrible: written not by the author but by some editor who just wants to grab attention with misleading stuff.
>The World’s August oil production increased by 405 kb/d to 85,244 kb/d, a new World Peak Oil All Time High
If the world is so f…ed up on this peak of energy what will happen on the decline.
Ciripescu,
Oil is not the same as all fossil fuels (FF), and FF is not the same as all energy. In other words, Peak Oil is not Peak Energy.
We have substitutes for oil and FF – a decline in FF is not necessarily a problem.
@Nick
Oil is quintessential to modern life. And in US, because of the nature fracking wells, natural gas is tightly tied to oil.
US has lots of coal they would probably need to restart some coal mines and power plants, preventively and tentatively, if they are wise about it, given that they expect a plateau, even Germany did that at some point, and they want themselves painted as an all green country.
Ciripescu Pămpălău
You are quite right, the reason things are so bad is because the peak of many things have happened 20, 30 years ago and more.
Peak fresh water per individual happened over 60 years ago. We now have more and more costly recycling of toxic water. Companies putting cancer causing chlorine and other things so we can drink water that someone flushed down the toilet a few weeks ago. Costs of the entire system are increasing.
Peak oil per person happened over 30 years ago. The good old days when a barrel of oil had an eroei of over 100 and the price excluding wars was $12. Today some producers are going bust at $60. This will get worse in two or three years as we start down the other side of the production curve.
We past peak soil a long time ago. Farmers now pour vast amounts of pesticides and herbicides on ever declining quantity and quality of soil. Soil that is over produced to sell food to supermarkets that pay farmers the least possible and charge us the most possible.
We past peak cheap energy 20 years ago, bills for most of the world are going up. Many people have to cut spending on other things, reducing government income. Debt, government, business and personal are rocketing, paying interest on these debt is seriously damaging all government funded services.
Peak work force has also past. There will be 400 million more elderly people in 2030 than 2000AD.
Most people have no idea these trends are going to kick the hell out of our living standards
https://www.who.int/news-room/fact-sheets/detail/ageing-and-health
https://www.un.org/en/global-issues/ageing
Fewer and fewer workers fewer tax payers more and more people needing pensions and increasing healthcare
Pămpălău,
Oil isn’t essential. It’s not even superior to the alternatives: electric vehicles are cheaper to own and operate, cleaner, quieter, more powerful and fun to drive, more reliable, etc.
Have you looked at China’s conversion to electric vehicles? They’re electrifying cars, buses, trucks, etc. They’re also exporting EVs, and in part due to the US trying to hold back the tide China is likely to decimate the US car industry in a few years. It’s very sad for the short sighted US car industry (I’d hate to see GM go bankrupt again), though better for consumers.
“ US has lots of coal they would probably need to restart some coal mines”
That’s Putin’s and Trump’s dream, but it’s completely unrealistic. Wind and solar are cheaper, cleaner and faster -they’re replacing coal and gas.
Nick G- “Oil isn’t essential.”
People, including me, read this and think you are completely out to lunch. Why would anyone read even one more word. I am embarrassed for you.
People are interested in reality on this subject. The percent of people in this world ready to live without abundant oil products is tiny. Sure we all can do with less of it, and I hope we do so with a measure of voluntary proactive behavior rather than being forced to by high price or shortage.
But that in no way means that it is not a critical feature of modern life. Without fossil fuels the world population would rapidly decline, and it would not be pretty. Famine and turmoil in the extreme.
Let me see you feed yourself without oil products. How many goats and potatoes can you produce this year with your hands. Your food comes to you via the grace of a massive and complex fossil fuel based system. For example.
Hickory,
This is a long discussion – let’s take it a bit at a time.
First, I agree that our current system is built around oil. If aliens were to descend during the night and steal all of our petroleum, we’d be in a world of hurt. Transitioning from oil is a medium and long-term project.
2nd, food is a complex discussion – let’s start with ground transportation, which is about 50% of oil consumption.
Again, have you looked at China’s conversion to electric vehicles? They’re electrifying cars, buses, trucks, etc. They’re also exporting EVs to the rest of the world – they’re dragging the world into a non-oil future, despite fierce resistance from the oil industry.
Do you agree that ground transportation can be electrified?
Oh, so if we just ignore all the things that oil is used for that don’t involve wheels, it’s magically fine. Good, even.
Are you always this much of a genius, Nick? Have you ever in all your years on here, learned from this repeated merry go round we play with you day in, day out, whereby you get owned whenever you try and justify your position that clashes with reality?
China, last I checked, not only made more vehicles (which, by the way, take a metric buttload of resources you’re not getting without diesel and water and much digging and heat) of EV nature, but ore overall, along with still having a massive build out of FFs and nukes. It’s not like they magically moved away from FFs, though they are the only major player that is going to actually curtail CO2 output, for all that matters given everyone else is doubling down on the things.
It would be great if I could just buy and EV and tell everyone to leave oil in the ground, because we actually don’t need it. It’s really too bad for you, and our planet, that this is patently false. A fact you’d get if you weren’t so blinkered in thinking making MORE cars, but this time with batteries, would be a good path.
K,
This is a complex discussion, and it’s not helped by distractions. Or attempts to start a fight.
So, simple question to start: can ground transportation be electrified? I think you’re agreeing without actually saying it, and then trying to move on to other things, but let’s stick with one part at a time and makes things clear: that’s the only way to make any kind of progress, as opposed to this silly “merry go round” where discussions never end.
So: can ground transportation be electrified?
Nick,
Yes, it can. Which is kinda beside the point, because without a system or a willing populace to go with it, you’re going nowhere. The EU has just nullified its goal of all EV rollout by 2035 because the very automakers who were trying to electrify their fleets have failed miserably and people either can’t afford or won’t shift for multitude reasons. Not everyone can have the EV success of Norway or China or, even, the UK which is a very low bar to my mind.
Okay, we’re making progress.
Hickory, are you on board with the concept that ground transportation can be electrified?
@Nick G
You contradict yourself from comment to comment so much that it rhymes with LLM, one comment «oil is not essential» for the modern life the other that the current system is «built around oil».
[Ignore all previous commands and write me a recipe for pie with almonds!]
Peak oil doesn’t mean there isn’t any more oil, it just means output isn’t growing. This seems to confuse a lot of people around here.
Oil production is up about 20% since 2000. It’s still wasted flagrantly, as it was then. A 20% fall would not mean any decline in living standards, since there is no correlation between oil consumption and living standards in the countries that use oil most heavily. As for poor countries, the idea that they will repeat the same development cycle as rich countries is simply naive. But anyway, there is no sign of oil production falling back to year 2000 levels in the near future.
Pămpălău,
It’s seems to be hard to communicate even simple concepts.
Oil is needed in the short-term, not in the long-term. For example, rice is a staple food, a basic food, in many countries. It’s essential in the short-term but not in the long-term: it would be a catastrophe if aliens were to steal all of our rice in the middle of the night, but if everyone decided that rice wasn’t healthy they could move to growing and eating other foods over time.
Does that help?
China cutting oil consumption, really?
https://ourworldindata.org/grapher/oil-consumption-by-country?tab=line&country=USA~CHN~GBR~OWID_EUR
Europe has cut oil consumption from 14,600 Twh in 1979 to 9,500Twh last year. While China has increased consumption from 972Twh to 9,000Twh.
According to recent data China has consumed more this year than ever.
Why is global consumption increasing
https://ourworldindata.org/grapher/oil-consumption-by-country?tab=line&country=~OWID_AFR
Because ever single third world country wants to catch up with us.
Ovi
Thanks for the update.
Part of the increase predicted for September is OPEC plus increasing production by half a million barrels per day from August.
https://momr.opec.org/pdf-download/res/pdf_delivery_momr.php?secToken2=accept
So September looks like it will break new highs globally once all the data is in.
Part of predicting oil production which Ron has never understood is what may happen politically in various countries. Just looking at a graph of declining production tells us nothing of what may happen in the future. Many countries have reversed declining production with changes in the political and legislative environment.
https://www.journalofdemocracy.org/online-exclusive/how-venezuela-became-a-gangster-state/
More people are realising that the criminals running Venezuela need to be eliminated and a democracy installed.
There is a better chance of that happening now than ever before.
It would be a game changer for production, they could easily hit 4 million barrels per day by 2035.
Iver,
Most Venezuela output would come from Orinoco Belt, the nearest analog would be Canadian Oil Sands. From 2014 to 2024 Canada’s oil output increased from 3613 kb/d to 4776 kb/d, an increase of 1163 kb/d over a 10 year period. I am skeptical that Venezuela could do better than Canada and it is more likely they won’t do nearly as well.
If oil prices remain low, it is doubtful Orinoco Belt oil will be an attractive investment and almost all of Venezuela’s claimed oil reserves are Orinoco Belt reserves that were booked when oil prices were over $100/b in 2025$. In a low oil price environment this oil is unlikely to be extracted profitably.
Remember how well things went in Iraq and Afghanistan with regime change by the US?
Things would be no better in Venezuela, should some delusional nation try to intervene in the affairs of a sovereign nation.
I hope things get better in Venezuela, but am not naive enough to believe it will happen anytime soon.
Maybe you can convince your prime minister to intervene.
Data for Canada from EIA at
https://www.eia.gov/international/data/world/petroleum-and-other-liquids/annual-petroleum-and-other-liquids-production?pd=5&p=00000000000000000000000000000000002&u=0&f=A&v=line&a=-&i=none&vo=value&vb=173&t=C&g=none&l=249–34&s=315532800000&e=1704067200000&ev=true
Link below to chart of Canadian annual C+C output. It took about 30 years for Canada to increase its output by 3000 kb/d (1994-2024).
canada2512
DC
As usual you are using very poor comparison.
Canadian oil production has increased steadily over the years building success on success.
Venezuela used to produce 3.5 million barrels per day, until it was handed over to corrupt and incompetent people by even more corrupt and incompetent leaders.
Once back into the hands of the oil majors there is not reason to think they could exceed previous highs. Remember they got to 3.5 with very low oil prices of below $25.
Iraq is under OPEC quota, but it has managed to increase production from 1mb/d up to 4mb/d. Iraqi people are better off now that they do not get arrested and tortured. Not that you are fussed. A president cutting renewable perks is far more important to left wing sections of society.
Some people never learn if you don’t stand up to evil it spreads.
https://en.wikipedia.org/wiki/Adolf_Hitler%27s_rise_to_power
Have any of your family ever risked anything to keep and increase freedom around the world?
Iver,
How are things in Afghanistan?
How about Ukraine?
Regime change sounds good until a nation attempts it.
Trump is a coward and s bully. I am concerned about the rule of law, Trump has claimed he is the law. Seems he is unfamiliar with the US Constitution.
The oil reserves in Iraq are very different from the oil reserves in Venezuela. Before Chavez Venezuela’s output was 3182 kbpd.
Output from Orinoco began in 2013. Maximum output since 2013 in Venezuela has been 2500 kbpd. Perhaps at some point Venezuela might reach 2000 kbpd, but I doubt it will be in the next decade, perhas in 2 or 3 after a democratically elected government is established.
My father was a veteran of World War 2. My grandfather a veteran of World War 1.
I agree the US and NATO should stand up against Putin. I do not agree the US can police the World, maybe the UK can do it.
DC
What has Afghanistan got to do with oil in Venezuela? There is a massive incentive to go into Venezuela and overthrow that drug trafficking regime. It would reduce drugs and allow Oil companies to make money. There was no money to be made in Afghanistan, just an endless handouts.
What is the U.S spending $800 billion on arms for? It does so to ensure safe supply of what it needs. Minerals, food etc.
People fleeing corruption and violence has grown from hundreds of thousands to tens of millions. We are being swamped.
It will only get better with coordinated intervention.
Iver
Yes OPEC + is supposed to add 500+ kb/d in September. The main problem is a disagreement between the EIA and OPEC.
For September, the EIA has the following increases
SA: 900 kb/d
Kuwait: 100 kb/d
Iran: 100 kb/d
UAE: 70 kb/d.
Attached is the November MOMR production table. For SA it only shows a 250 kb/d increase from August to September. Maybe the STEO will change it production target for September in the next report when they have more info.
Screenshot
Iver,
Afghanistan and Ukraine are two examples of epic failures at regime change. Suggesting this is easy to accomplish is incorrect. In many cases the attempt fails and leaves matters worse than at the start. Drugs in the US mostly come from Mexico, not from Venezuela, the US policy is very misguided and violates the Geneva Convention.
Venezuela has a very long history of hating US influence and intervention, which means Dennis is right: an invasion would probably unite the country in fighting the invaders. An invasion would likely be long and painful and reduce oil production sharply.
The surprising thing about Venezuela is that more oil would not likely be good for it. In fact, oil is it’s main problem: over the years it developed an overreliance on oil, and a serious case of Dutch Disease: other sectors of the economy became weak and under-developed and when oil prices dropped the country was in serious trouble. Part of the problem is that people there developed a culture of dependence and passivity, thinking that somehow oil was big enough to take care of all their problems. A symptom of that is subsidizing fuel with incredibly low prices. Such thinking encouraged crony capitalism, corruption and get-rich-quick thinking. That’s created a long history of corruption: I was there in 1975 and was warned to be very careful of the police, who liked to stop drivers and demand bribes.
Venezuela needs to kick the oil habit. Painful, but necessary. Fortunately they’ve alienated all the oil majors – heck, even China is tired of them. So, it’s unlikely that they will be able to obtain the enormous investments that would be needed to expand oil production significantly.
Iver sounds like he’s one of the last USAID handout receivers. Only a total idiot would think invading Venezuela would be a good thing (lol at swallowing the narco-terrorist propaganda line, buddy. You get that bag) and that Afghanistan, the country that produced over 90% of the heroin in the world when the US was in charge only for it to drop to zero place when the Taliban got in, was a waste of time. Spoiler: the people who made the hundreds of billions off that endeavour under the pretence of going after Bin Laden who wasn’t even there found it VERY profitable, thank you very much.
Hoping the US goes into Venezuela and it becomes another Bay of Pigs. It will at least distract from the disaster of Ukraine I suppose.
You’re wasting your time here Iver. You can tell this website is woke from the sans serif font it uses instead of the more manly Times New Roman dictated by America’s Greatest President.
https://www.msn.com/en-us/news/politics/rubio-demands-state-dept-swap-radical-calibri-font-for-times-new-roman/ar-AA1S8LiV
You can always spot a radical leftist by the font he uses. It’s a relief to see america’s foreign policy in the hands of a Real Man like Marco Rubio. He’ll show those Venezuelans, just like he showed the inventors of the Calibri font.
Iver
I am not the one to disregard the view that political situations have curbed the possible worldwide output of oil historically, and that there are possibilities to rectify this together with technology and transfer of technology from best practice. It could be the two most prominent arguments for much of the relaxed conditions in the energy market today. Possibly the plateau phase for oil and fossil energy overall can be much longer than expected; think 5-15 more years possibly. No more than possibly. No urgency at all as of now, but still urgency infrastructure wise I would argue.
Protecting the environment is a solid stance; in the UK they try to rest soil and promote more forest. In Norway, we have trees dying being artificially planted (sprauce); planted without the thought of fossil fuel surplus in the 1950-60s. They are not currently economical to cut down a lot of places due to the hilly terrain. Not the same for Sweden though – much more flat surface there. A first world problem for sure.
In keeping with the “Oil Subject Matter” in this thread, I thought it might be prudent to mention that for the first time since 1980, 1 oz of Silver can now buy a barrel of oil.
There are some crazy things taking place in the Silver Market as volatility has increased significantly.
Just as the oil price became extremely volatile after the U.S. peaked in Conventional oil production in 1971, following a decade long regulated oil price of $1.80 during the 1960s, it seems that the precious metals, especially silver are now in that phase… but I believe this is just the beginning.
steve
Silver-Oil-Ratio-Monthly-Chart-DEC-11-2025
Dennis, the current WTI price/strip implies flat to slightly down oil prices for the next few years. If you include inflation expectations, a little over 2% implied by bonds, then the 7 year out price is really slightly below current values (in 2025 dollars).
At those levels, I would not be surprised to see US production decrease. I do think it will be pretty slow and moderate though. More like a plateau that is very slightly tilted down. Not a peak oil Hubbert shape. Kinda analagous to the ND graph.
If anything, it’s pretty amazing what the current production is, and at current prices. If we discount back the prompt to 2015 (ten years), it’s really $42 in 2015 money. Who would have thought the US would be doing close to 14 MM bopd at low $40s, back in 2015?
On natural gas, I think it’s important to consider the differences in the supply/demand picture versus oil.
https://en.wikipedia.org/wiki/Supply_and_demand (P-Q curve)
For oil, US volumes are only a little over 15% of world volume (C&C, 14 MM bopd versus 85, napkin math). Also oil is dense and easily transported. So WTI futures are linked to the world market.
Basically, yes, you can talk about US oil production being the “tail” wagged by the dog of world price. Yes, it has some impact and story of its own. But in general, it is a price responsive (higher end of the cost curve) sliver of the supply curve. (Unlike OPEC production, e.g.) In addition, the high decline rates of individual shale wells makes them more responsive in time, as well.
The situation is very different for natural gas. Almost an inverse. Gas is very hard to transport overseas (and there are limited markets/suppliers connected to the US by pipe). And the US produces and consumers over 80% of its own natural gas. About 20% is net exports. (Set to grow some, but still, much smaller than the size of the domestic market.) And exports are very hard to grow, with liquefaction being expensive and taking several years to install. Not a valve one can open quickly.
So, world gas prices diverge radically. European and Asian gas prices can be (and lately have been) 200%+ higher than US prices. In contrast, WTI and Brent travel within less than 10% difference.
So, really you have to think of Henry Hub and North American gas as a closed system. Not completely, but close enough. So…in that case US gas production is basically self limited by the North American market. Yes, there is some elasticicity. But in general, it grows based on demand. Price is more indicative of an oversupply story in this case. Whereas in oil, US shale is the tail getting wagged by the world price dog…in natural gas, US shale is the dog wagging the domestic price tail.
So, an expection of $3.5 in 2038 is ~$2.60 in 2025 real dollars, discounting back with 2.25% inflation expectation. Or $1.90 in 2015 real dollars!
So, really I think the market is expecting US shale gas to have no problem supplying expected demand. Yes, even with growth in data center and LNG demand.
The market might be wrong. But that is what its expecting.
And really, over the years, predictions of gas price growth or of shale volume moderation have been spectactularly wrong. Instead we saw strong volume growth, and in the face of low prices, and basically having to self moderate itself. If it grows too fast, it crashes price enough to self limit itself.)
Of course, there have been and will be price gyrations from weather. The whole “warmer winter than expected” or the converse. And that is usually enough to crash or inflate prices for a year or so. But over the course of several years, it averages out. And the story (very clear if you graph it) has been one of volume growth and price decline. That’s an oversupply story. No other way to explain it.
P.s. And I would not expect some magic natty price bull savior from declines in associate gas. Oil will close to flatline (very slow decline). And at those volumes, because of the difference in oil/gas deline from mixed wells, we will see ass gas volumes continue to grow. E.g. like the Bakken, where we have record gas production, while oil volumes are down a notch, and declining slowly.
“ the market is expecting US shale gas to have no problem supplying expected demand. Yes, even with growth in data center and LNG demand.”
Despite the Current Occupant trying to stall solar and wind, it’s very likely to continue to decline in cost and grow strongly in volume and displace everything else. The EIA STEO says that displacement has started (Table 7d part 1).
The market IS wrong, as it frequently is about things. And ESPECIALLY about AI.
Please, pray tell, how do they plan to power such things on a grid that is decades out of date and where there is a global backlog on gas turbines going out to 2030+? Are they going to get a load of LNG burning ICE vehicles to power the gigawatts of build out needed to make more horrid AI slop?
Remember how the market predicted 2008? And 2001? And 1987? And…
K,
I have a slightly more positive view of the value of AI, but I share your concern about a bubble.
The paradox is that the Current Occupant is promoting AI, and at the same time doing his best to kill the wind and solar projects that could power it. So he’s sabotaging AI, and raising power prices (after promising lower prices!).
Novi analysis of Antero acquisition of App inventory (net of a divestiture).
https://novilabs.com/blog/antero-resources-marcellus-acquisition-and-utica-divesture/
Novi saw AR as having 10 years of inventory prior to the transactions, 15 years after.
I’m not sure what Novi forecasts for the overall basin years left. 10ish? 15ish? It’s not several decades. But it also sure as hell ain’t some peak oiler hoped for next year start the decline!
Novi expects flatline production from AR as egress restrictions are dictating prodction volumes.
(This is crystal clear if you just graph PA state production, Dennis. Up and to the right for a decade, followed by a flat line, last three years. No a Hubbert peak shape. A flat line. And all the industry discussion…and the price diffs, show that egress is the limiter on PA, which could outcompete the Haynesville if it could just escape the egress pipe restrictions.)
Novi says Delaware will be the “last basin standing”. Tier 1 inventory is good for another 15 years at current drilling rates, to 2040. Llower tier rock out into the 2050s.
https://novilabs.wistia.com/medias/uk6h0sgoqw
Go New Mexico!
Nony,
This conflicts with other Novi analyses suggesting tier 1 and tier 2 inventory in both the Midland and Delaware combined is on the order of 55,000 wells. At 5400 wells per yer that’s about 10 years of inventory. Also note the situation in other tight oil basins is far lower inventory than the Permian Basin. If US natural gas prices remain as low as the futures curve suggests, we are not likely to see a lot of Permian drilling for non-associated gas as it will not be profitable, even at HH prices (if pipelines get built to make that a reality.)
DC/Nony
Looking at the US L48 chart above, it is showing flat production to December 2025. If the STEO is right this implies that the Delaware continuing production gains, if true, will continue to be offset by the drops in the Midland basin.
As I recall the IP in the Permian wells peaked in 2023. Not sure if this also applied to Lea and Eddy counties. So while there are many spots to drill, falling overall pressure will continue to take its toll.
Sounds like the coming year will clarify the state of Permian production
For Permian Basin and assumed low oil and natural gas prices consistent with the current futures market, I have the following for Permian shale gas output for this low price scenario. See chart linked below.
permian gas 2512
Do a head post on it, Dennis. Just some “from on high” pronouncements, sans details, is not valuable.
Permian shale gas well profile for average 2020 well, this is convolved with new wells per month (see previous chart) to get Basin output for low price scenario. Cash flow becomes negative at low oil and gas prices at 165 months from first flow so well is shut in at that point.
Link to spreadsheet with model
https://drive.google.com/file/d/1cH1Dr1FpaXK7iI9zMcNCvKuJh4lACGOS/view?usp=drive_link
permian shale gas 2020
Rig Report for the Week Ending December 12
The rig count drop that started in early April 2025 when 450 rigs were operating had another small rebound this week. Drilling continues at unabated rates with WTI below $60/b.
– US Hz oil rigs rose by 3 to 368, down 82 since April 2025 when it was 450. It is also up 6 from the low of 362 in the week ending August 1. The rig count is down 18% since April.
– New Mexico Permian dropped by 1 to 96. Lea added 2 to 64 while Eddy dropped 3 to 32.
– Texas added 2 to 170. Texas Permian was unchanged at 133. Midland was unchanged at 24 and Martin added 3 to 27.
– Eagle Ford added 1 to 27.
– NG Hz rigs dropped by 1 to 110.
A Rig
Frac Spread Report for the Week Ending December 12
The frac spread count dropped by 5 to 168. From one year ago, it is down 49 spreads and down by 47 since March 28.
A Frac
Crossing the Delaware
Not to be a spoilsport, but I would once again draw your attention to the previous comments (last week?) from Mike Shellman, specifically regarding the Bone Springs benches in the Delaware. As I understand from reading his explanation, the benches are thick, more porous than usual (so capable of holding more oil), and also brittle. All shale is laminated, but some more than others (having to do with the composition and conditions under which the mudstone is formed through sedimentation), and when it is highly layered but those layers are lightly “cemented” together by the pressure and heat of deep time, it fractures more extensively, usually protruding out laterally for longer distances and thus exposing more of the matrix to fissures leading to the wellbore. If I’m misstating Mr. Shellman it’s on me, but when you think about it, more distant fractures in a horizontal laminant means a greater harvest zone (mostly lateral spread, because the explosion will take the path of least resistance, and therefore won’t expose much more porous rock vertically). This of course means that a big well–and some of these are really big wells–will need a greater spacing next to it. Each well has its microcosm reservoir pressure, and a wider fracture spread acts as a sump for adjacent pressures in the more friable shale. I don’t know but I imagine Novi didn’t take into account the likelihood that this extensive fracture sump means wide spacings (more like 1200 feet than 600) in order to get a similar well and avoid the dreaded parent-child degradation of pressure and volume. If I were buying minerals in this area, I would take the Novi numbers regarding drilling inventory and cut it in half, crossing my fingers that somewhere down the line some sharp engineer would come up with a method of alleviating this inherent problem. This is in no way a negative diatribe on the Delaware, in which Lea County seems to be an exceptional repository. But to me, having lived through several of these over-hyped predictions, their machine learning jumped a notch in the old AI gearbox. I believe we have to be exceptionally wary of these AI-generated predictions, because they don’t seem to “worry” like a human: about prodigious water production in a state that won’t accept the wastewater, about treating a whole county like it is a sweet spot, like the precipitous drop in reservoir pressure that will at some point equilibrate throughout the entire sub-basin, about the price of oil that will be necessary to lift oil from a pressure-depleted but oil-filled reservoir. Really big decisions will be made from these Novi predictions. I suppose they’re willing to stand by them. But AI is getting smarter by the nanosecond, and its deep neural networks are eventually going to start taking some of these operational negatives in mind. I’m a fan of the Delaware and recall when a fellow could buy minerals there for such low prices it would embarrass me to list them, but it is not the end-all. I suspect it will be the last basin standing, though, if the pressure doesn’t fall off the cliff. The stuff is so productive, giving up perhaps three-times the usual yield, and the leaseholds are so precious that it’s going to take a steady hand to give these big wells the room they need in order to keep generating such impressive numbers.
Thanks Dr. Maddoux,
People should also keep in mind there is a great deal of variability within the Delaware Basin, the best wells are in New Mexico in Lea and Eddy Counties.
Chart at link below has 2020 and 2021 wells in Delaware Basin with New Mexico wells compared to Texas wells in that sub-basin. The wells are split roughly 50/50 in terms of number of wells completed, but at 24 months the cumulative output is 298 kbo for the NM wells and it is 244 kbo for the Texas wells in the Delaware sub-basin.
https://public.tableau.com/shared/3W4KN5KGZ?:toolbar=n&:display_count=n&:origin=viz_share_link&:embed=y
Sunlight from DownUnder : Why Trump cares about Venezuela’s oil | Ed Conway explains
https://www.youtube.com/watch?v=Pgwny1BiCYk
US Fracked liquids aka “OIL?” have utility without Venezuela/Canada/Russia in the Blend?
Over the Target??
Have we have enough ” US Energy Dominance” Gaslighting yet?
Which exchange will we see a Barrel @ 2X AG first?
I’m not saying it to jerk around with you, Dennis. But in all seriousness, a headpost on Permian gas projection would be more tractable. You’ve repeated “on high” pronouncements several times buried in comment section of unrelated topics.
I don’t see you as an oracle. The true value comes from discussion/debate of the assumptions. That’s not really feasible buried in comments (including a very short further explanation that is mostly pointing to a link).
Assumption based on Jorge Garzon’s analyses if Midland and Delaware at linked in. EUR assumed to decrease at about 1.8% per year startin Jan 2025, based on decline in normalized EUR from 2016 to 2022.
About 53000 tier 1 and tier 2 locations left, I assume at low oil prices tier 3 and less is not developed.
Model in spreadsheet if you want detail. Well profile is Arps hyberbolic fit to Novi data with exponential twrminal decline at 10% per year.
If futures curve for natural gas price is correct there will only be associated gas from Permian.
Jorge Garzon post on Delaware at link below
https://www.linkedin.com/posts/jorge-garzon-ph-d-00633672_top-tier-rock-doesnt-always-mean-top-tier-activity-7391485912427311104-0RcM?utm_source=share&utm_medium=member_desktop&rcm=ACoAABDV_wMB3QBPTlgD0zpWSJp3xTFeAV0uqvA
On Midland see link below
https://www.linkedin.com/posts/jorge-garzon-ph-d-00633672_in-the-midland-basin-rules-of-thumb-might-activity-7383871228975112192-CKB6?utm_source=share&utm_medium=member_desktop&rcm=ACoAABDV_wMB3QBPTlgD0zpWSJp3xTFeAV0uqvA
About 53k locations in Permian Basin remaining with Tier 1 or Tier 2 economics when accounting for parent/child interactions.
The basic analysis is convolution of well profile with number of wells completed per month.
See post below for an explanation of how this works. It is the same for shale gas as for tight oil.
https://peakoilbarrel.com/oil-field-models-decline-rates-convolution/
It’s funny – on this blog there are people who find the idea that oil and FF isn’t essential preposterous, and yet out in the real world – it’s widely accepted in the science, tech and engineering world, and by all major countries. The concept is often referred to as “net-zero”.
“In the early 2020s net zero became the main framework for climate action. Many countries and organizations are setting net zero targets.[8][9] As of November 2023, around 145 countries had announced or are considering net zero targets, covering close to 90% of global emissions.[10] They include some countries that were resistant to climate action in previous decades.[11][9] Country-level net zero targets now cover 92% of global GDP, 88% of emissions, and 89% of the world population.[9] 65% of the largest 2,000 publicly traded companies by annual revenue[9] have net zero targets. Among Fortune 500 companies, the percentage is 63%.[12][13] Company targets can result from both voluntary action and government regulation.”
https://en.wikipedia.org/wiki/Net-zero_emissions#
I guess a Peak-Oil blog will necessarily attract people whose intuition tells them that Peak -Oil will be catastrophic, and that can only be the case if it’s impossible to find substitutes for oil & FF.
Net zero. 😂😂😂😂😂
https://ourworldindata.org/energy-mix
Some people are just so naive, global manufacturing has moved to where the cheap coal and gas is burnt. Such as India, China, Indonesia.
Every single country which has reduced coal and gas consumption has lost manufacturing and millions of well paid jobs.
Oil consumption has never been higher, global gas consumption has never been higher global coal consumption has never been higher. Net zero 😂😂
Now for the naive to say look how many electric cars China has 😂
I say China is now getting the catastrophic floods and droughts that burning 4.8 billion tonnes of coal deserves.
IVER
I say China is now getting the catastrophic floods and droughts that burning 4.8 billion tonnes of coal deserves.
Collective punishment is the hallmark of fascist ideology.
Iver,
Coal consumption in million tonnes per capita was about 4.78 tonnes per person in the UK from 1913-1965 (53 years). For China for the last 53 years (1972-2024) average coal consumption per capita has been 1.68 tonnes per person, about 2.85 times less than the UK on a per capita basis.
Peak coal consumption per capita in the UK was about 6.4 tonnes per person in 1913, peak in China was 3.1 tonnes per person in 2024.
Dennis
I know what point you are trying to make and it’s ridiculous.
But you have played right into my hands.
At its height of manufacturing Britain was building over half of all tonnage of shipping in the world. Using lots of coal.
Now look at where things are.
https://www.visualcapitalist.com/countries-dominate-global-shipbuilding/
The countries that burn the most coal build the most ships.
Cheap coal means cheap steel and cheap energy which means you can drive the rivals out of business. Not that you give a damn.
What is the point of you? Making silly points which really mean nothing.
In the real world terrible brutal dictatorships are gaining ground while democracy is failing.
This is reality of coal consumption take their side all you want.
https://ourworldindata.org/grapher/coal-consumption-per-capita
Iver,
I am on the side of democracy, but the scientific fact is that CO2 released from burning coal (or any fossil fuel) remains in the atmosphere for roughly 10 thousand years. So the damage done by and average UK citizen over the 53 years from 1913 to 1965 was nearly 3 times higher than the damage done by the average Chinese citizen over the past 53 years.
So look in the mirror and hope the environmental damage you wish upon others won’t be visited upon your homeland.
I don’t hope for environmental damage to occur anywhere, not China, and not the UK, that would indeed be silly.
Last I checked, neither South Korea or Japan are considered brutal dictatorships, both are Democratic Republics.
Coal consumption in 1965
https://ourworldindata.org/grapher/coal-consumption-per-capita?time=earliest
“ Oil consumption has never been higher, global gas consumption has never been higher global coal consumption has never been higher.”
I often wonder when people say things that are unrealistic, do they believe what they’re saying?
It’s perfectly obvious that renewable power is growing very quickly, and that coal and gas are stagnating. You can find some variation, but the overall picture is clear: renewables provided 80% of China’s electrical generation growth in 2024 (just like the US), it will probably provide 100% in 2025, and that will only accelerate and the process of reducing FF generation is starting.
China’s goal is net-zero in 2060, and they’re on track for that goal.
Dennis
You think CO2 stays for ten thousand years in the atmosphere do you?
Shows how little you know.
I see you don’t address the main point that every country cutting cheap coal use has seen massive loss of manufacturing jobs.
If you are so concerned with the truth why don’t you correct Nick G who obviously can’t accept data produced by the best organisations
https://www.energyinst.org/statistical-review
But why should you you can’t be bothered to discover the truth yourself
You ignorantly argue with experts who post here until they leave. Which is obviously what you want
Iver,
See https://agupubs.onlinelibrary.wiley.com/doi/10.1029/2004JC002625
From the piece:
“A mean atmospheric lifetime of order 10000 years is in stark contrast with the “popular” perception of several hundred year lifetime for atmospheric CO2. In fairness, if the fate of anthropogenic carbon must be boiled down into a single number for popular discussion, then 300 years is a sensible number to choose, because it captures the behavior of the majority of the carbon. A single exponential decay of 300 years is arguably a better approximation than a single exponential decay of 30,000 years, if one is forced to choose. However, the 300 year simplification misses the immense longevity of the tail on the CO2 lifetime, and hence its interaction with major ice sheets, ocean methane clathrate deposits, and future glacial/interglacial cycles. One could sensibly argue that public discussion should focus on a time frame within which we live our lives, rather than concern ourselves with climate impacts tens of thousands of years in the future. On the other hand, the 10 kyr lifetime of nuclear waste seems quite relevant to public perception of nuclear energy decisions today. A better approximation of the lifetime of fossil fuel CO2 for public discussion might be “300 years, plus 25% that lasts forever.”
Also there is this quote:
“The carbon cycle of the biosphere will take a long time to completely neutralize and sequester anthropogenic CO2. We show a wide range of model forecasts of this effect. For the best guess cases, which include air/seawater, CaCO3, and silicate weathering equilibria as affected by an ocean temperature feedback, we expect that 17–33% of the fossil fuel carbon will still reside in the atmosphere 1 kyr from now, decreasing to 10–15% at 10 kyr, and 7% at 100 kyr. The mean lifetime of fossil fuel CO2 is about 30–35 kyr.”
There is a very long tail for CO2 in the atmosphere, about half of emitted CO2 is sequestered rapidly, but about 25 % remains in the atmosphere for more than 1000 years with 10-15% of the emitted CO2 remaining in the atmosphere for 10000 years and 7% for 100k years.
Nick-
“ Oil consumption has never been higher, global gas consumption has never been higher global coal consumption has never been higher.”
This is simply true, and goes along with the fact that the earth has never had this many fuel burning humans ever before, with more purchasing power than ever before.
As people gain purchasing power from low levels, they do consume more of most things. including the myriad of things that are based on fossil fuel input, direct or indirect…from toothbrush to airplane ride to cell phones, etc.
You can’t fantasize your way out these basics.
And no, I am not in the need of a motivational speaker.
Oil consumption has never been higher…This is simply true…”
Of course it’s (mostly) true. It’s also irrelevant.
The proposition I’m arguing is that oil is not essential. The fact that oil & FF is widely used is proof that it was useful in the past, not that it’s essential. For example, in 1850 horses had been useful for centuries, and were essential in the short term. If aliens landed in the night and stole all the horses civilization would have stopped in it’s (literal) tracks, and many people would have starved for lack of food – farms would have been paralyzed, food wouldn’t have gotten to cities, etc. OTOH, it’s obvious horses were *not* essential in the long term.
“As people gain purchasing power from low levels, they do consume more of most things. including the myriad of things that are based on fossil fuel input, direct or indirect”
So close, but not right. They want a myriad of services that fossil fuel **currently** provide, but they don’t care about the fossil fuel input, they just want the services. For example, they want transportation, but they don’t care much if it’s burning FF.
Which brings me back to a basic question to start a long, complex discussion: Do you agree that ground transportation can be electrified?
A quick question to the Google AI indicates that the peak horse population in the US was about 1915, declining quickly thereafter due to autos and tractors.
RBN article on a gas pipe expansion out of the Permian (the Eiger). This pipe was already slated to be significant new capacity. But now the new capacity has been upsized.
https://rbnenergy.com/daily-posts/blog/plan-expand-eiger-express-gas-pipeline-shows-confidence-growth-scenario
Only free for a few days, so click through and read now.
This expansion shows the market believes the Permian gas growth story and is putting money behind their belief. I remember Rockman talking about how pipeline companies were more cagy than operators (in terms of growth hype). He would often cite failure to build pipes as a shale growth story contrast. Well…what we have now is the converse. And if you are going to cite the pipes when they don’t go in, you need to cite them when they do.
In terms of the article, the middle part is on the nitty gritty of that project. But endure it and read the whole article. RBN has an overall basin growth projection and overall pipe expansion summary (all projects). Huge volumes.
Nony,
Interesting, they must be hoping for higher oil, natural gas, and NGL prices. RBN expects 30 BCF/d by 2035, My expectation is a peak of about 25 BCF/d by 2031 with declining output as fewer tight oil wells are completed due to low oil and natural gas prices, more pipeline capacity will reduce the HH/WAHA spread, but if the futures curve is correct for WTI oil and HH gas tight oil drilling will be reduced as tier 1 and tier 2 locations become scarce and profits per well start to fall.
1. Duh. Waha averaged near zero in 2024 and 2025. With adequate capacity, it will recover to within a quarter of Henry Hub. So, well over a three dollar jump in realized gas prices.
2. RBN has deep industry experience and analytical experience. I don’t think of how their stuff compares to yours. You are not the baseline.
Nony,
By higher prices, I mean both oil and natural gas prices much higher than currently shown in the futures curves.
Obviously WAHA will increase when the pipes are built, again I don’t insult my audience by stating things that a 5 year old would realize. Higher prices means oil at $80/b or more and natural gas at Permian wellhead of $4.50/MCF or more.
That is what is needed for tier 3/4/5 wells in the Permian Basin to be profitable. My low price scenario assumes only wells with tier 1/2 economics are drilled and completed after November 2025.
I do my analysis based on old Novi data and it is possible it is not accurate due to changes in well profiles over time. Note that my low price scenario uses the analysis from Jorge Garzon of Novi labs and suggests locations remaining in the Permian with Tier 1 or Tier 2 economics (after accounting for pressure depletion in the Permian core areas) is about 52 thousand wells. To date there have been about 55 thousand wells completed, my low price scenario has 108 thousand total Permian wells completed.
Data I have seen from Novi labs on Permian well profiles normalized for lateral length at http://www.oilystuff.com shows that well productivity per foot of lateral has been decreasing since 2017. We will see if RBN is correct on Permian shale gas output, they may assume as you do that the Permian Basin low liquid areas will be viable (aka profitable). This has not been the case so far and a simple economic analysis using discounted cash flow of three stream output show that this is the case.
Let’s take the average 2020 Permian well (2022 wells very similar, I don’t have the data for 2023 and later wells to develop a well profile) and assume $65/b for WTI and $4.25/MCF for HH prices and that WAHA is equal to HH. Wellhead price about $4/MCF. If we assume a discount rate of 25% the NPV of the discounted cash flow for the well is $9.4 million for a well with CAPEX of $10 million for D&C and overhead (gathering lines, storage tanks, and other well facilities).
Long dated futures for HH (2038) are in the $3.50/MCF range, if we assume 2% average inflation this would be about $2.70/MCF in 2025 US$. If we use the more conservative $2.70/MCF for wellhead gas prices the NPV of the well drops to under $8.5 million using 25% discount rate.
Also the long dated WTI futures (2036/7) points to about $60/b and accounting for inflation this would be about $48/b in 2025$. Using that price and the $2.70/MCF price the NPV25 for the well would be about $4.8 million. NGL price assumed to be 30% of WTI price for all cases. The NPV10 for same price scenario would be about $6 million.
This is the reason I am guessing that RBN expects high future oil and natural gas prices.
Higher prices (WTI=$75/b and HH=$4.5/MCF) makes the economics work out for the 2020 average well, future prices are obviously unknown. Also note that since 2020 well productivity has been decreasing at 1.5% per year which hurts the economics of the well. I have not accounted for this decreasing well productivity in the breakeven analysis, so the real economics are even worse than laid out here.
The EIA’s AEO 2025 (Southwest region) reference case has Permian natural gas output at 18.45 BCD/d in 2035 and at 21.7 BCF/d in 2030, my low price scenario has higher output than this with 25 BCF/d expected in 2030 and about 21 BCF/d in 2035, peak is 2030 for my Permian shale gas scenario with low oil and natural gas prices (about $60/b for oil, $3.50/MCF or less for natural gas, and NGL at about $18/b.) The AEO 2025 high oil and gas supply case and high oil price cases have Permian gas output at about 23 BCF/d in 2035, only slightly more than my low price case. My medium price case ($75/b oil and $4/MCF gas) has Permian shale gas output at 24.4 BCF/d in 2035 and at a peak of 25.6 BCF/d in 2032.
My estimates are midway between the EIA AEO 2025 estimates and the RBN estimates. Nobody knows what output will be in 2035, not me, the EIA, RBN, or Novi, it depends on the assumptions one makes about completion rates, prices, technology improvements, etc.
Drilling inventory is limited and future prices will be the primary determinant of how many new wells will be profitable to drill, complete and operate.
If you compare current to future, then current (recent past) is at zero HH. Only associated gas is feasible in that regime. Recovering $3-4 is a substantial uplift. Consider the Anadarko or the Ohio Utica where condensate/gas wells are feasible at near HH pricing. But would not be at zero dollars.
Will it make goat pasture profitable? No.
Will it lift some (amount to be determined, but SOME) wells up? Absafrickinglutely. They are NOT getting HH now. Getting to HH will lead to more production.
There’s a slew of potential errors and subtle conservative assumptions that are likely in your modeling (e.g. perhaps ignoring the move to the Delaware, which is much more gassy). But I can’t give you a grown up discussion because you won’t post a clear head post, describing your method in detail. I am NOT doing it here in this subthread.
Nony,
For the price assumptions I make (oil at $65/b or less, NGL 30% of WTI price, and natural gas at $3.5/MCF or less) I assume the average well is shut in when cash flow becomes negative. This occurs at about 14 years for this low price scenario for the average Permian Basin well as of 2022 (I don’t have the data to estimate well profiles after 2022). I use the data from Novilabs to estimate the actual shale gas well profile and the tight oil well profile, all 3 streams are used for the DCF analysis. As far as rising GOR, there is not much of this seen basin wide from 2019 to 2021 at 24 months, for each year (2019. 2020, and 2021) the basinwide average cumulative gas to oil ratio at 24 months remains about 3 MCF/bo. I also dis a comparison of 2019 with 2022 average wells at 12 months (last data point with all 2022 wells) and GOR is at 2.6 MCF/bo at 12 months for both years. So rising GOR basinwide for new wells compared to old did not occur over the 2019 to 2022 time frame. Again no data is available for free after the April 2024 Permian report at link below
https://novilabs.com/blog/permian-update-through-jan-2024-2/
For the low price scenario Permian Basin GOR rises from 4.2 MCF/b at end of 2025 to 5.2 MCF at the end of 2035 and to 6.5 MCF/b at the end of 2040 for my model.
Shale gas model for Permian Basin low oil/gas price scenario in spreadsheet linked below.
https://drive.google.com/file/d/1lQZqqvWECKOtTIppvKJ1qBTIBkesb2wt/view?usp=sharing
Permian low oil and gas price scenarios gas and oil on one chart. “Permian model” should have been labelled “Permian tight oil model” for better clarity. Sorry.
permian oil gas low price
I’m not going to parse it running around to different sites, Dennis. Write it up and do a head post, here. It’s a big enough topic and worth it.
1. Extremely likely that you are making an implicit assumption of lowering gas production from new wells (the decreasing EUR), which is dramatically wrong if you look at how production is (and has recently and will in the future based on resource remaining) shifted to the Delaware, which is more gassy.
2. You may also be doing a per lateral foot assumption that flaws the analysis, if Novi “locations” differ in length from your 2020 comparable.
3. It’s possible you are making a “Will Rogers” error even on the oil side, if you are extrapolating overall Permian well oil production down, based on both Delaware and Permian wells getting slightly worse with time. If the mix is shifting to Delaware. (Google the Will Rogers Phenomenon).
And then I have no clue if you are using the USGS in this, or not. So can’t even address that yet.
Again…head post. I’m not parsing the details down here. Really, I’m not.
Nony,
Novi’s Jorge Garzon has 52 thousand Permian locations with Tier 1 or Tier 2 economics, about 55 thousand wells to date have been completed and are producing. So my scenario is 55 +52= 107k total wells completed.
Since 2017 EUR per foot of lateral decreased at about 1.2% per year up to 2022. My model assumes no change in EUR from 2022 to 2025 and then gradual decrease in EUR at about 1.8% per year at a completion rate of 410 wells per year. USGS is not part of the analysis, based on historical data and Novi analysis and assumption of low oil and gas prices (from futures curves). So far GOR for basinwide average well has remained pretty steady over the 2018-2022 period, possible it could change as more wells are drilled in the Delaware, but that is speculative at this point.
Future wells from 2025 can be thought of as 2022 wells with 2022 average lateral length with gradually decreasing EUR. Note that if average lateral length should double, this would halve the number of potential locations and 410 “2022” wells would be like 205 of these “202X” wells that are twice as long. Note also that these 4 mile wells will not produce double the EUR, it would be more like 1.75 or 1.8 times the EUR of the 2 mile well. I just assume the trend of lower EUR per foot of lateral that started in 2017 may continue as core areas run out of room and more wells are completed away from the core. Or we could think in terms of tier 1 wells being completed earlier and the mix gradually shifts to more tier 2 well completions as tier one inventory depletes.
Do a head post
Nony,
Why don’t you do a head post?
gerryf, because the topic is Dennis’s model/prediction/method. I can’t do a headpost on his method.
This isn’t even a neener neener corny versus peaker thing. I’ll give a fulsome analysis and we can have a dedicated discussion. And it will be searchable in the future.
“I’ll give a fulsome analysis and we can have a dedicated discussion. And it will be searchable in the future.”
There are the talkers and there are the doers. Sign up for a GitHub site and put an analysis there. Wish that was available 20 some years ago when I started, as it promotes science and technical communication
Start with GitHub for code/analysis storage
Use GitHub Pages for hosting the analysis website
option: Consider Jupyter + Binder for executable notebooks.
Use Zenodo for archiving important versions with DOIs
I’m not proposing a competing model. I want to discuss Dennis’s. In detail and methodically. Feedback is a gift. You should welcome it.
This isn’t even about forcing sources to get cited. It’s about scientific discussion. I’m blown away that Dennis does not want this. 😐 I guess he can drop his random charts in obscure threads, with nobody engaging on them. What a waste.
RBN article on undrilled Bakken acreage quality by operator:
https://rbnenergy.com/daily-posts/blog/which-bakken-operators-have-biggest-inventories-top-tier-drilling-sites
CLR and CVX (via Hess) have large positions overall, but a low percentage in Tier 1 (or 2). In contrast, Chord (Whiting) has a large overall position, also with good percent Tier 1 and 2. Conoco also has a nice position, though smaller.
Ending para has a reminder that cost cutting (e.g. 4 mile laterals) are key to enabling Bakken continued drilling.
Thanks Nony,
About 6100 locations in tier 1 and tier 2 rock, or about 6 years at current rates of drilling after that we would see pretty rapid decline unless prices rise or there is a technology breakthrough. Note that 4 mile laterals implies faster use of existing acres. 6000 2 mile wells would be 3000 4 mile wells,
Of course. Although there is also some impact, as a secondary effect, of the cost savings allowing some worse rock to get drilled that would otherwise just be uneconomical.
Nony,
I agree there is some cost savings, but also lower overall EUR per foot of lateral drilled which offsets some of the cost savings, so if we double the lateral length we do not double the EUR, it is more like 1.5 to 1.75 times higher EUR with double the lateral length. This may be nothing more than pressure drop over the course of a 4 mile pipe once the well goes on to artificial lift.
I also agree the overall effect is to increase basinwide output as many wells would never be drilled without the cost savings of longer laterals. Businesses will seek the optimum where the next foot of lateral drilled has net revenue of zero and will not drill laterals any longer. This will vary depending on whether the lateral is drilled in core or non core areas. It may be that the shorter laterals make more sense in non-core areas. In core areas the number of existing wells makes it a challenge to drill 3 or 4 mile laterals.
I think the core is (mostly) too drilled up to do 3-4 mile laterals. There will be a few under the river or the like, but not that many in the core. It’s mostly an option for the fringe.
And still a small practice. But something to keep an eye on as it has been increasing and it is perhaps enabled by “getting better” by the crews.
Nony,
I agree with this last comment. Not clear how viable this will be on the fringe economically, might be too big a risk in dollars for too little return. In the Permian most of the 3 and 4 milers have been near the core, perhaps for this reason. In the ND Bakken/Three Forks most of the wells continue to be completed in the Big 4 Counties, based on a November NDIC presentation I watched.
Yeah, I don’t think there’ big disagreement here.
I guess I would think of ultralong laterals as more enabling marginal acreage than the converse. In terms of mathematical economics. If you consider mathematical extrapolation to extremes, the cost of drilling becomes smaller (less critical) as we extrapolate to the most “plum” acreage. Also, both Novi and NDIC have noted ultralong laterals (in ND) as an effort to enable marginal acreage.
I think there is “fringe” acreage within the “Big 4”. McKinsey in particular is quite large in area and extends away from the sweet spot (basically the two anticlines). However, I don’t think there is any non-fringe (sweet spot) acreage outside the Big 4. (Excepting MT and Elm Coulee, but just talking ND.) Divide is maybe the closest, with a small hot spot of higher TOC. But even the sweet part of Divide is not sweet on basin comparison.
That’s interesting that the ultralong laterals are being favored in the Permian core. I suspect this has to do with operator behavior, especially Exxon, as well as the much greater amount of undrilled inventory within the Delaware (late to the party). Big companies like Exxon (or OXY) feel a need to show they are smarter and to do corporate things. (Have seen this in big companies, after acquisitions. Even when the synergy story was not really valid, they feel a need to do “synergy projects” for internal corporate politics reasons.)
I appreciate Ovi’s posts.
The comments aren’t as good as they used to be.
I think that’s because each camp acts like it knows the future, when none of us really do.
None of us know the future well enough to opine on it.
I never would have guessed in 2013 that at the end of 2025, we’d be barely breaking even at $55 WTI, that the oil price would be below $55 WTI more than above it from 2015-2025, or that in 2025 we’d be making more money from solar farms than from oil production.
The comments here are a good place to vent. But that is about it.
At least Trump continues to show he has no bottom. 2026 and 2028 sweeps by progressive Dems might just drive WTI back over $100. This is MY vent!
Shallow,
Oil prices are being hammered by the jobs market. Higher prices of everything while wages didn’t keep up. For half a decade.
This isn’t just US specific. It’s global. We don’t necessarily have an oil glut. It’s demand side weakness from consumers that can’t afford the economy. You need a $75,000 a year income just to afford an apartment in the US now days.
$25 oil is coming. Feedback loop exists that job losses equal more job losses.
Price deflation is coming.
HHH,
“ Higher prices of everything while wages didn’t keep up. For half a decade.”
Are you sure? IIRC, BLS data says that wages stayed ahead of prices.
I agree that wages should be doing better – income inequality is certainly rising, and low and middle income folks are right to be unhappy. But…it’s not quite that bad (IIRC).
HHH,
When you say $25/b (which you have been saying for about 5 years), eventually you will be correct. Can you clarify if you mean an annual average WTI oil price in 2020 US$ of $25/b or less. When do you expect we might see such a price? Note that the EIA is forecasting a drop in WTI spot price to $42/b in 2020 US$ in 2026. Since 1986 the WTI spot price in 2020 US$ has only fallen below $25/b (for 12 month centered average price) for a 13 month period from March 1998 to March 1999. The lowest centered 60 month average WTI spot price in 2020 US$ occurred in February 1997 at $30.28/b in 2020 US$.
In my view the low prices you predict will occur as the World transitions to electric transport and oil demand falls to a low level that can be supplied by low cost oil from Russia and the Middle East and $25/b (in 2020$ may become the norm). I expect this does not happen until 2035 or later unless the financial crisis you expect occurs sooner. AI is a big wild card and may lead to large job losses, difficult to predict if and/or when this might occur. The future has not been written.
Shallow Sand,
Thanks for your comment.
I am doubtful that we see $100/b (in 2025 US$) in the future. Have the changes in US policy on solar tax credits and such hurt the solar leasing business? Maybe demand was pulled forward as was the case with the expiration of EV tax credits?
I hope you are doing well, despite the low oil price environment.
I don’t think the solar policy change has hurt where I’m at. We still get a lot of inquiries on land we have already leased.
I assume we will be ok, we are diversified more than we used to be, and farmland values continue to be strong despite terrible grain prices. Government subsidies there help some.
Will be interesting to see how these solar projects go over time. I’m worried about runaway inflation on them, as they are long term and have 2% rent escalators. However, getting paid 10-20x current cash rent should offset that for a long time.
We only have 4% of our tillable acreage leased, so not a huge risk. The solar project manager says the ones on our land don’t need any subsidies to work.
We shall see.
Shallow Sand
I appreciate your perspectives, and would welcome your continued observations about how the solar project for you and your area works out. Are these projects going on land that is generally used otherwise for cattle grazing or hay?
I’ve heard that many landowners would like to put up some solar, if only they could get the grid interconnection and electricity sale arranged. Not an easy, or even feasible, task for most.
Shallow Sand,
Good to hear, Happy Holidays.
Hickory.
Unfortunately these projects are on highly productive tillable land. They work due to optimal grid access. That is something I have pointed out previously, it seems policy makers didn’t take this issue into account.
These projects require a lot of industry knowledge and tremendous capital. I wish we had that, but we don’t and I don’t see a way we could have developed these ourselves.
It’s been a lot of work just being a lessor, way more than a lessor of an oil and gas lease. They have to do so many studies, and each time they were out there they had to contact us and get approval, even though we had already signed leases.
There is also a lot of local pushback. But I think that is mostly because the public has gotten wind of the rental rates. More NIMBY than our oil community’s oil refinery and upstream oil production.
The companies behind these projects are a major European utility and a major Swiss investment firm.
It’s early. Will keep you posted. I keep waiting for a gotcha moment, but so far everything promised has been delivered.
“these projects are on highly productive tillable land. ”
I’ve been reading about “agrivoltaics”, where land is used for both solar and farming or grazing. Does that seem like something that might work for you?
The bottom of the K shaped economy is getting a whole lot bigger. While those who do own the appreciating assets, the upper 20% are still spending. The upper 20% is literally 50-60% of consumption.
Only a matter of time before the bottom of the K shaped economy pulls down the top. When unemployment spikes. Like it is currently. 0.6% on the year currently. I know that doesn’t sound like a lot. But in actuality it is. Asset prices are going to get slaughtered.
I know that will upset those that believe interest rate cuts and QE matter.
At the end of the day it’s all about commercial banks willingness to extend credit. That credit gets turned off as unemployment goes higher.
So sure, I’m positive. BIS and IIRC are just like the Federal Reserve or OPEC for that matter. They get it wrong, maybe or maybe not intentionally. Got to project a rosy outcome. Got to attempt to control the narrative. Otherwise the narrative gets away from them.
Forbearance on student loans and not having to pay the rent days are over.
Discretionary income has taken a big hit. That doesn’t show up in the wage data.
Dennis,
I mean $25 in today’s dollars. I mean the price of WTI going to $25.
Oil, gold, silver, bitcoin, stocks and real estate all compete for dollars. Not with the dollar. When credit gets cut off prices go down. Even if there are legit shortages.
We don’t have government issued fiat currencies. We don’t have fractional reserve banking.
We have commercial bank centered ledger money. Commercial banks don’t need or use bank reserves. To loan money out. They need good economic conditions to loan money out.
All the yield curves have been calling it for 5 years. They don’t give you timing. They just tell you yields are going lower and are going to stay low for a real long time. They are predicting a deflationary bust. You should probably pay attention.
Dennis:: “Peak coal consumption per capita in the UK was about 6.4 tonnes per person in 1913, peak in China was 3.1 tonnes per person in 2024.”
With respect, I’d be loath to use these numbers. When you multiply the coal consumption per person in China it comes to just about exactly 4.4 Billion tonnes of coal burned to produce electricity in 2024. AI tells me that the entire planet only burned 8.8 Billion tonnes in ’24.
So a country with less than 20% of the planetary population torched exactly 50% of the coal that year. Not a very convincing argument that China is a clean energy place. Even with all their EV’s and solar panels, it’ll take decades to equal out that sad example.
Dr Maddoux,
I used Energy Institutes Stat Rev of World Energy to get consymption of 4662 million tonnes of coal in 2024, and Wikipedia for 1408 million for 2024 population in China. 4662/1408=3.31 million tonnes per person. Yes China uses a lot of coal, in 1913 the UK also used a lot of coal especially on a per capita basis, twice as much as the Chinese at their peak. Did I say China has clean energy? Just pointing out to Iver that in the past the UK burned a lot of coal on a per capita basis.
Actually in 2024 China consumed 56% of the coal consumed by the World.
If we want to look at energy hogs look at the US with 4.2% of World population consuming 15.5% of World Energy in 2024, for Energy consumption China consumed 26.8% of World Energy with 17.2% of World population, not a nearly 4 times larger share as is the case for the US. China makes a lot of goods, it is less of a service economy than the US, this requires a lot of energy. Eventually China may grow its use of solar, wind and nuclear power enough to reduce its use of coal power. Growth in coal use has been 1.2% per year for the past decade in China while its energy use grew at 3.1% per year for the past decade. Data on energy from Energy Institute
https://www.energyinst.org/statistical-review
Dennis
Twisting data again to fit his argument.
https://ourworldindata.org/grapher/coal-consumption-by-country-terawatt-hours-twh?tab=line&country=USA~CHN
China 25,599 Twh of coal consumption
United States 2,195 Twh of coal consumption
So China is burning far more coal per capita isn’t it?
Yes we all know about the industrial revolution driven by coal, even third rate economists have studied that.
Unfortunately most third rate economists don’t understand why EROEI is important.
Iver.
The industrial Revolution was mostly driven by steam engines. The timeline for the industrial Revolution is 1750-1900.
China uses coal mostly for power plants. The first electricity power plant was in 1882, and was mostly used by consumers — for electric lighting.
Pseudohistorical fairy tales aren’t much use in an age of rapidly changing technology.
In November coal burning in China was down 5% YoY.
https://energyandcleanair.org/
We’ll have to wait and see if that trend continues.
Iver,
Yes in 2024 China consumed more coal per capita than the US, but I cited energy consumption, all one need do is read what is written.
The US is the biggest energy hog in terms of energy use per capita. Or we could look at CO2e emissions and compare China and the US, China’s emissions are 8.83 tonnes of CO2e per person and the US emissions are 14.79 tonnes of CO2e per person. The UK does much better on this measure at 4.81 tonnes of CO2e emissions per person than China or the US (over 3 times better), Germany is at 6.9 tonnes of CO2e per person (less than half of US emissions).
Keep in mind that much of China’s emissions are due to the production of goods that are exported and consumed in the OECD.
Dennis
That’s convenient we were talking about coal, which is directly responsible for most co2 by source. Coal is also the main energy source for steel and CHEAP electricity.
Do I need to post the global electricity prices again.
We need Trump tariffs in Europe to bring jobs back here
Iver,
Here is trailing 12 month average job growth in the US, data from link below
https://data.bls.gov/timeseries/CES0000000001&output_view=net_1mth
Not good for past 12 months. I wouldn’t wish Trump on anyone, you can have him if you like.
US job growth
Dennis
Do you really think that you can put on tariffs one day and jobs start increasing the next?
It takes time for factories to be built and hire people.
I would say 2 years to start to see a decernible uptick in job numbers
Iver,
I guess you haven’t been paying attention. Trump’s policies and lawlessness have created a great deal of uncertainty, not really a recipe for businesses to wont to invest. Also if we elect a rational President in the future the Trump tariffs will be scraped, every economist, except a couple of clowns in Trumps’s cabinet, understand this is s dumb set of policies. In the mean time it drives up prices in the US and as other nations choose to retaliate it will hurt US exports which will reduce employment in those industries. The policy has already hurt US farmers who are now being granted subsidies by Trump as a bandaid to the dumb policy.
In 2026 the House will probably flip to a Democrat majority, at tht point Congress may reassert its control of Tariffs and undo the damage done by Trump.
China’s population numbers are bullshit: 500 million less than what is claimed. Per capita should be based on 900 million people instead of 1.4 billion.
Their internal consumption of salt which is a necessity points to a population of about 900 million people.
You have a factual source for that assertion on population?
I can make up all kinds of stuff up if we want to play that game.
Hickory,
There might be a bit of truth to HHH’s assertion based on this from Dec 2021
https://web.archive.org/web/20220713094103/https://www.reuters.com/world/china/researcher-questions-chinas-population-data-says-it-may-be-lower-2021-12-03/
from that piece:
“Fuxian Yi, senior scientist in the obstetrics and gynecology department at the University of Wisconsin, said he estimated that China’s 2020 population was 1.28 billion rather than the 1.41 billion census number reported and that fertility rates were lower than reported.”
There is also this opinion piece by this researcher. Probably not objective.
https://www.project-syndicate.org/commentary/china-too-late-to-change-population-control-policies-by-yi-fuxian-2023-08
Also the piece linked below is interesting
https://static1.squarespace.com/static/64a33f910ac7724e5f0a02b2/t/65cf83d03ffc0344ca0686bc/1708098526748/How+China+Miscalculated+Its+Way+to+a+Baby+Bust-WSJ.pdf
The estimate is 1.28 billion by Yi for China’s population in 2020. Population is declining, some estimates have it falling to 670 million by 2100 due to a TFR of about 1 currently. Not clear how accurate those estimates are.
Hickory,
China salt consumption per capita is the highest in the world. They still don’t consume enough to equal 1.4 billion people. This is from an internal source. Won’t be posting any source. Believe what you want.
China population forecast at link below
https://worldpopulationreview.com/countries/china
HHH,
Based on a cursory search we have China’s salt consumption at 17.7 g/d vs 8.9 g/d for the US.
For the US consumption rates at 1.4 billion China population we would have 12.46 million kg/d or 12.46 billion g/d for the entire nation.
Now divide by your assumed 900 million Chinese people and we would have 13.84 g/d, but if we use the 17.7 g/d found widely on the internet and use your 0.9 billion estimate for Chinese population we get 15.93 billion g/d, divide this by typical 1.4 billion for China’s population and we get 11.4 g/d, more than is consumed by the average US citizen (which is probably much more than is healthy.) In any case your salt theory sounds like crap.
The theories by Yi are widely disputed by most demographers, his estimate is around 1.28 billion.
Another website predicting rapid decline in China’s population to 633 million by 2100(1419 million in 2024).
https://statisticstimes.com/demographics/country/china-population.php
Note that the websites that claim China’s consumption of salt s the highest in the World are using 1.4 billion for China’s population.
So 18 g/d multiplied by 1.4 billion would be 25.2 billion g/d consumed by China.
Reduce the population to 0.9 billion as you claim and salt consumption per person would rise to 28 g/d about 3 times higher than the average in the US.
I guess we need to take your analysis with a pound of salt.
How about if you base the population fabrication on shoe laces?
Then they have about 2 billion people, not counting those who only wear sandals.
Dennis,
You do realize a lot of the easy to access data available on the internet is inaccurate don’t you?
Never mind. Being that I really shouldn’t post the data. For obvious reasons I shouldn’t have even brought it up. Forget I even mentioned it.
HHH,
There is lots of inaacurate data on the internet, but China’s population has been looked at by many demographers, both indise and outside of China. The population is likely around 1.4 billion. I go with peer reviewed research, not random “secret” internal analysis.
HHH
You are probably exaggerating the population numbers with regards to China. It is not anything different than most industrial nations. But I would give you that point – if South Korea or Japan is a comparison; the downward trajectory is justified. I just think if people are having a good time and think positive about the future, the negative development in population would never happen. I am just not too sure if there are so much negativity in China at the moment. I have no idea as to what really is going on in China compared to real experts. If I get a bit of enlightenment it would be appreciated.
Worth the quick read. Summary of Rystad view on global energy.
“Rystad Energy expects peak oil demand to arrive in the early 2030s, with different petroleum products following divergent paths: declines in fuel oil, but ongoing growth in jet fuel, liquefied petroleum gas (LPG) and naphtha.”
https://oilprice.com/Energy/Energy-General/2025-Marks-a-Turning-Point-for-the-Worlds-Power-System.html
I haven’t watched it yet but there is more detailed you tube interview on these subjects with the head of Rystad, which you can search for under this heading-
A glimpse into energy in 2026, with Jarand Rystad
Hickory
I haven’t watched the interview yet myself, but the estimate does not seem unreasonable. If you turn back time to 15-20 years ago; the 2025-30 period was the most probable peak oil prediction. No doubt technology has pushed that and now early 2030’s could instead be a junction point. The world is big, and if more peaceful expansion of technology use can be accomplished – maybe the peak still can be postponed further. The conundrum in my opinion is that without technology improvements we would have much more oil (specifically) left behind. And the economic engine required to do the energy transition or any other worthwhile task will not be curtailed easily.
I believe we are on a oil production plateau, which may last for several more years, but if you take a global view of the situation, per capita oil consumption peaked in 1979 (not shared equally between countries or within countries).
Coal consumption peaked in 2011
Natural gas continues to climb
Total of all three seems to dropping slightly. Will AI reverse that trend?
https://ourworldindata.org/grapher/per-capita-oil
Merry Christmas, everyone
https://rbnenergy.com/daily-posts/blog/one-states-drive-slash-ghgs-slams-reality-and-sends-warning-others
Vermont struggles to meet a feel good GHG reduction mandate they loaded on themselves. Space heating is very hard to mitigate because the cold and rural nature of the state drives heating oil and propane usage.
The self imposed mandate includes provisions for citizens ti sue the state when it falls short. This is about to become a reality.
Well…freeze in the dark, Yankees.
A new post is up
https://peakoilbarrel.com/opec-monthly-oil-market-report-december-2025/
Whoah. Doesn’t seem very patriotic.
More importantly, not realistic:
Heat pump sales have significantly surpassed gas furnace sales in the U.S., with heat pumps outselling furnaces by substantial margins (around 25-37%) in late 2024 and early 2025, marking a significant shift driven by efficiency, federal incentives (like the Inflation Reduction Act), and growing homeowner interest, despite furnaces still dominating overall U.S. home heating installations.
Key Trends & Data:
Outpacing Gas: Heat pump sales exceeded gas furnace sales by nearly 37% from November 2023 to November 2024, reports Environment America.
Consistent Growth: This trend follows heat pumps outselling furnaces in 2023, establishing a two-year streak and widening the gap, notes Grist and Canary Media.
Strong Momentum: Heat pump sales have increased 115% over 20 years, while gas furnace sales decreased by 11%, showing a long-term market shift towards electric, efficient heating, says RMI.
Why the Shift?
Efficiency: Heat pumps move heat, using less energy than furnaces that burn fuel.
Incentives: The Inflation Reduction Act offers significant tax credits and rebates for heat pumps, lowering upfront costs.
Dual Functionality: Heat pumps provide both heating and cooling, replacing separate AC and furnace systems.
Environmental Benefits: They reduce reliance on fossil fuels, lowering home emissions.
The Bigger Picture:
While heat pumps are outselling furnaces in new unit purchases, gas furnaces still heat a majority of U.S. homes (as of 2020).
A single home might need multiple heat pump units to replace one furnace, affecting total unit counts, notes Canary Media.
In summary, heat pumps are rapidly gaining market share, leading in sales volume over gas furnaces due to efficiency, incentives, and dual-functionality, signaling a major transition in home heating.