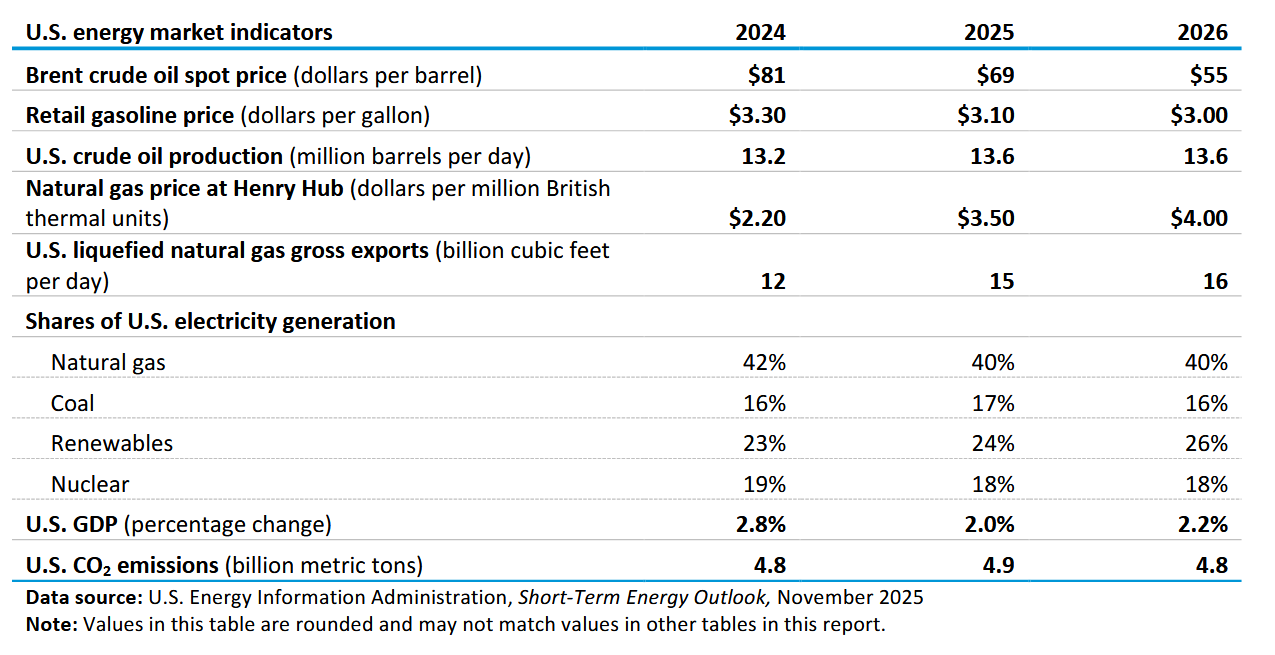
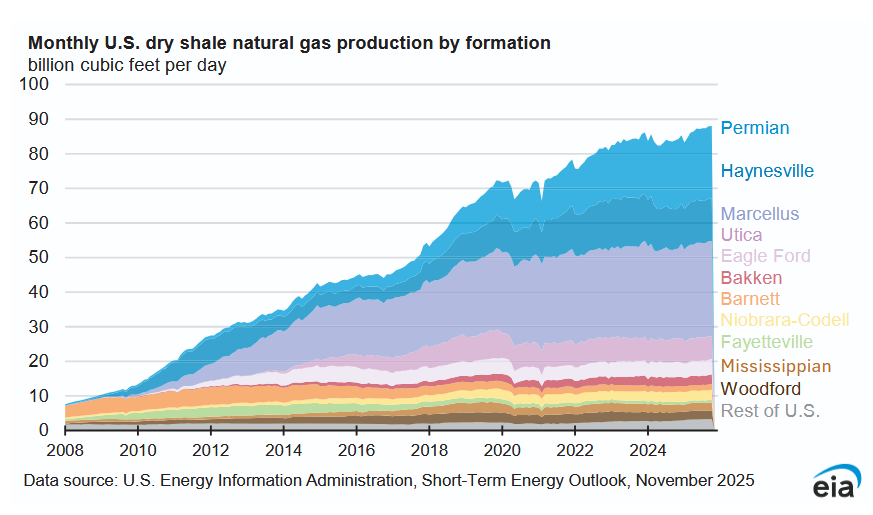
The EIA Short Term Energy Outlook (STEO) was published recently. A summary in chart form.
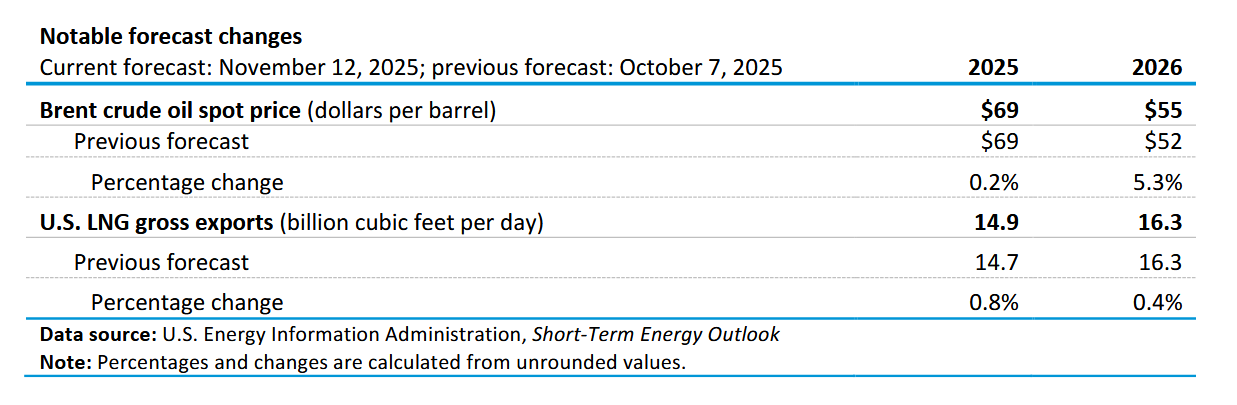
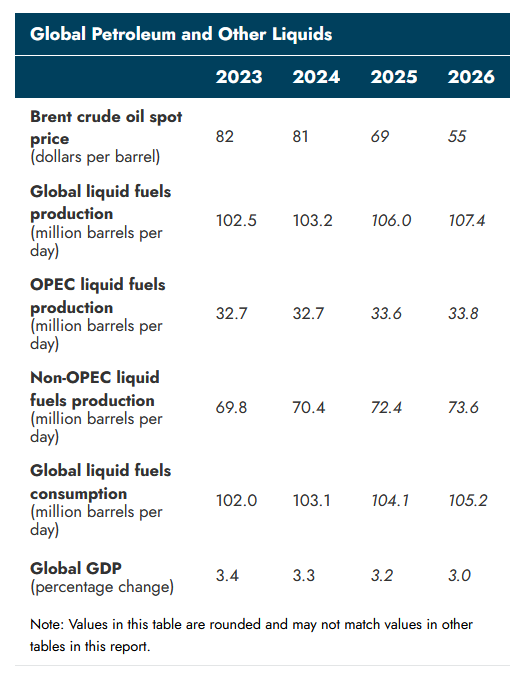
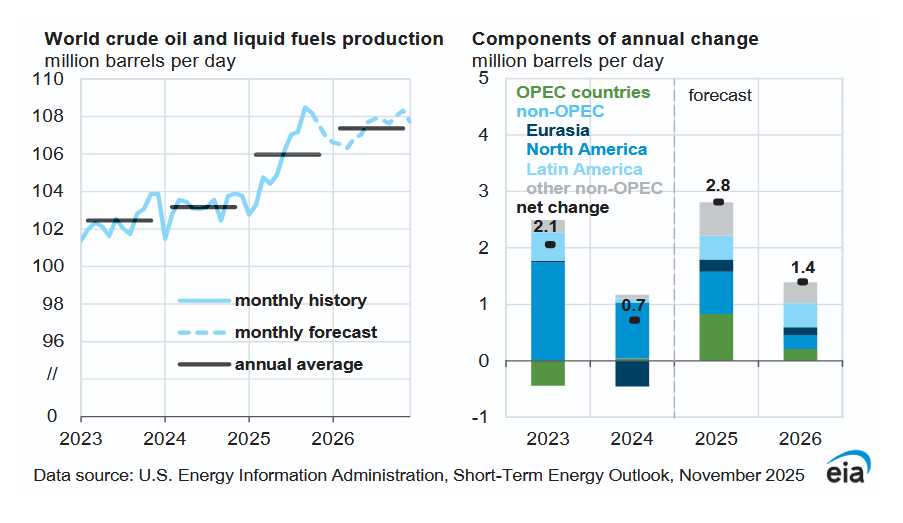
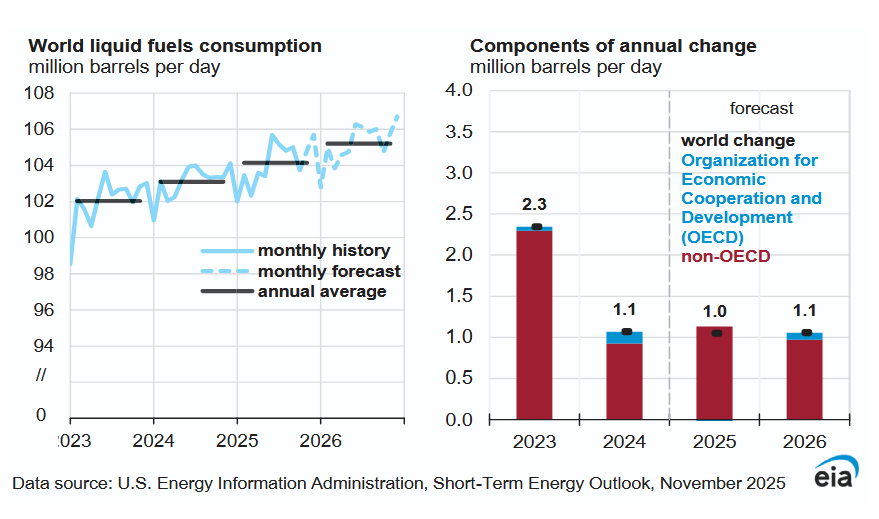
Higher Global GDP growth is expected compared to last month’s STEO in 2025 and 2026 up by 0.1% for both years, this raises Global liquids fuel consumption by 0.1 Mb/d compared to the previous STEO in both 2025 and 2026. OPEC liquids fuel output increases by 0.1 Mb/d in 2025 and 2026 compared to last month. Non-OPEC liquid fuel is revised lower by 0.1 Mb/d in 2024 and the expected output in 2026 increases by 0.1 Mb/d compared to last month.
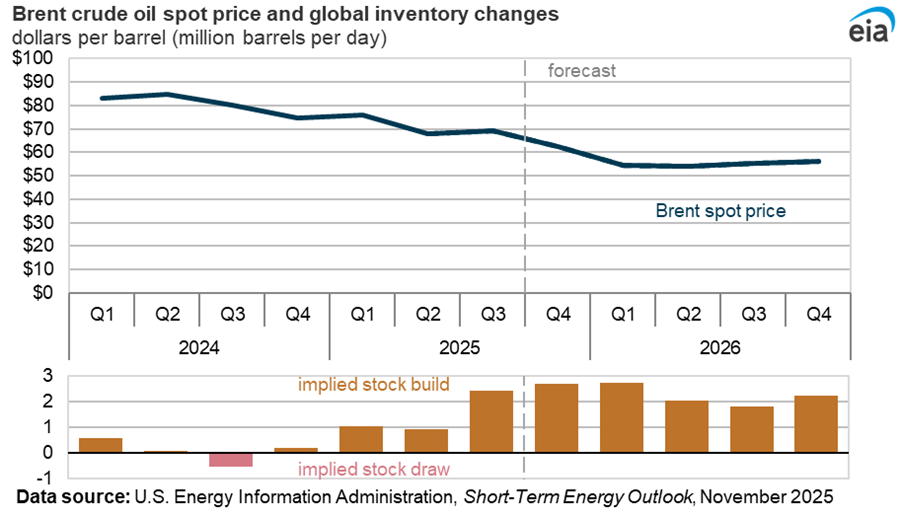
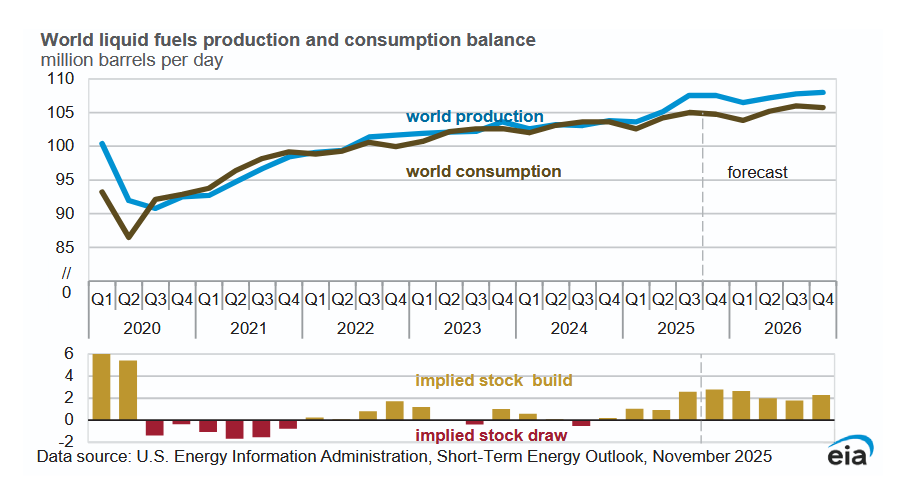
The large stock build from 2025 Q3 to 2026 Q1 leads to falling Brent Crude prices through 2026 Q1, oil prices then stabilize at around $55/b in 2026.
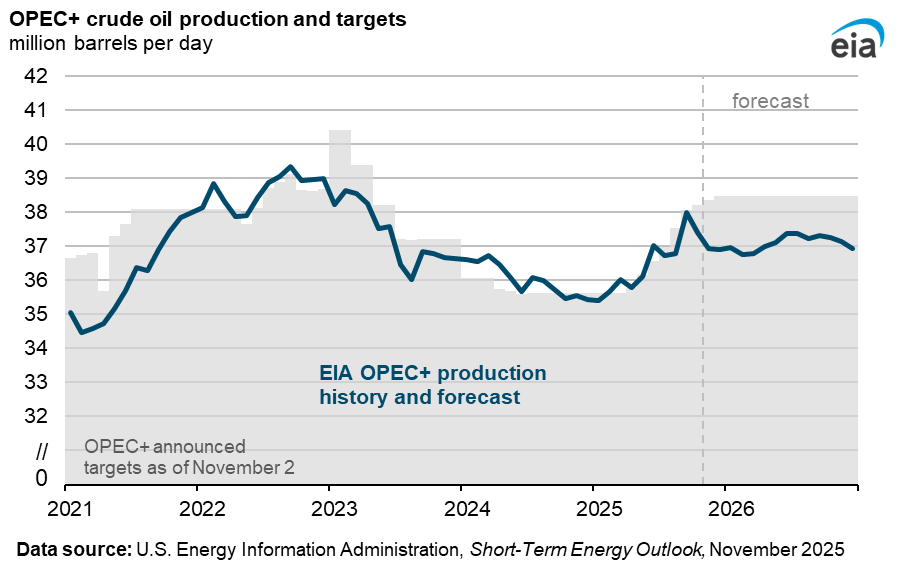
The EIA expects OPEC+ will produce at about 1.5 Mb/d below their target in 2026.
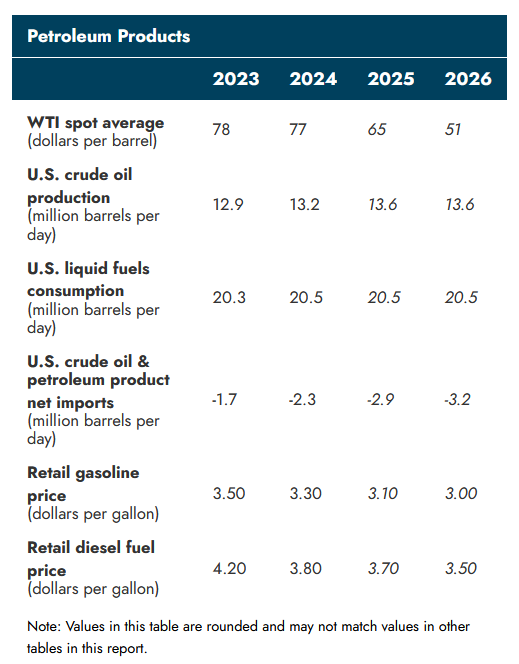
WTI oil price was revised $2/b higher in 2026 than last month’s STEO.
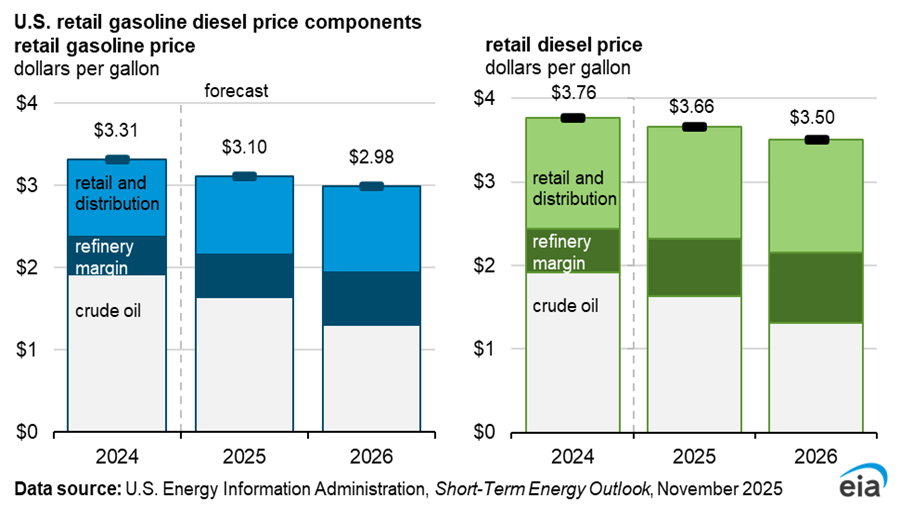
Refinery margin (profits) are expected to increase in 2025 and 2026 for both gasoline and diesel fuel.
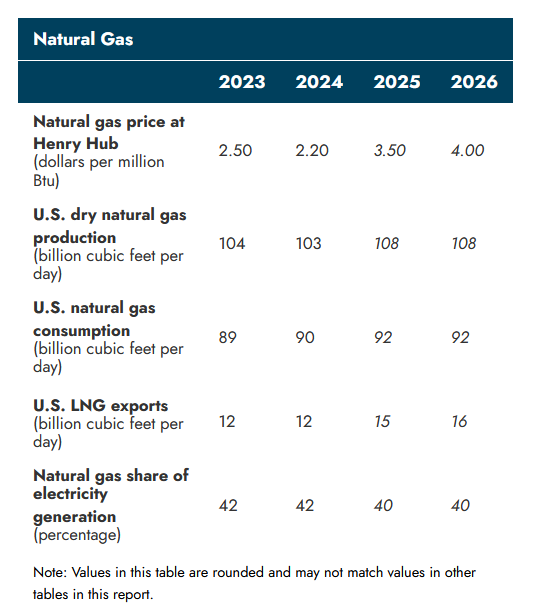
The price of Natural gas at Henry Hub was revised higher by 10 cents per MCF in both 2025 and 2026 compared to last month. Natural gas output was also revised higher in 2025 and 2026 by 1 BCF/d compared to last month’s STEO.
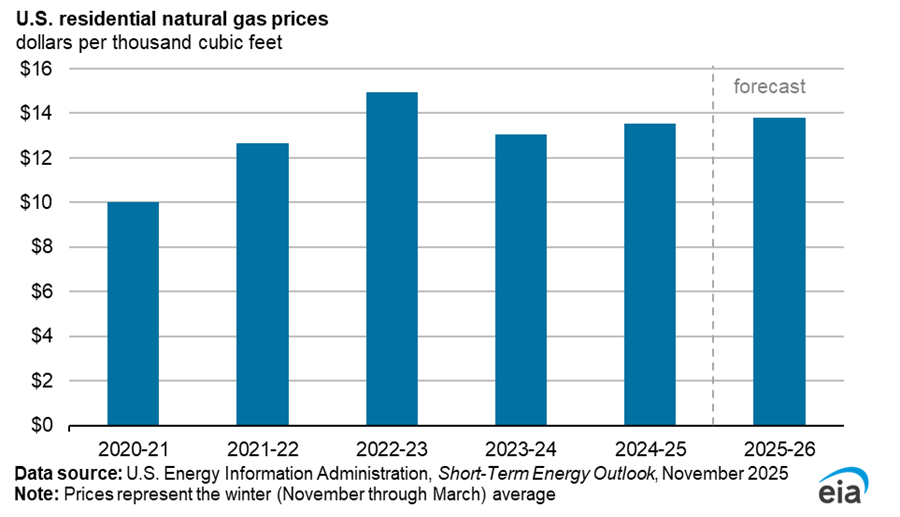
Natural gas prices for residential consumers are expected to rise only by 2% this winter to $13.80/MCF.
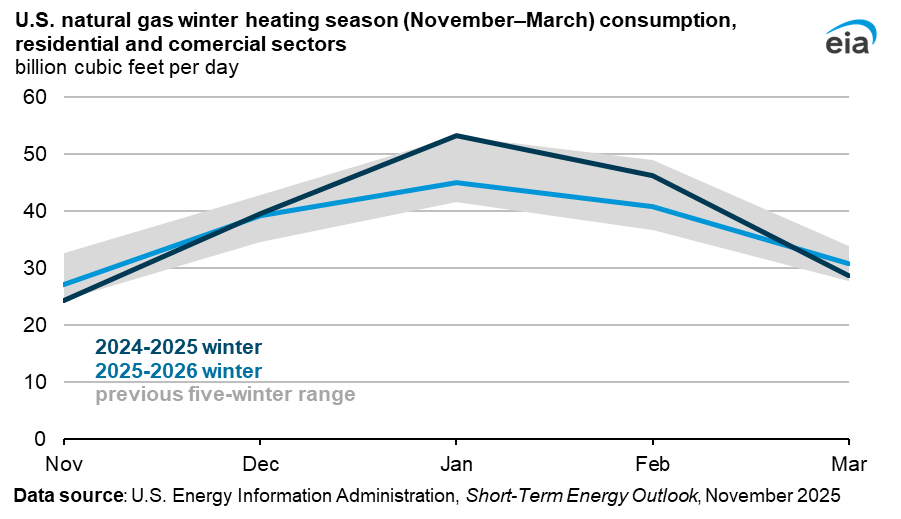
A warmer winter is expected in 2025/2026 leading to lower consumption of natural gas compared to last winter.
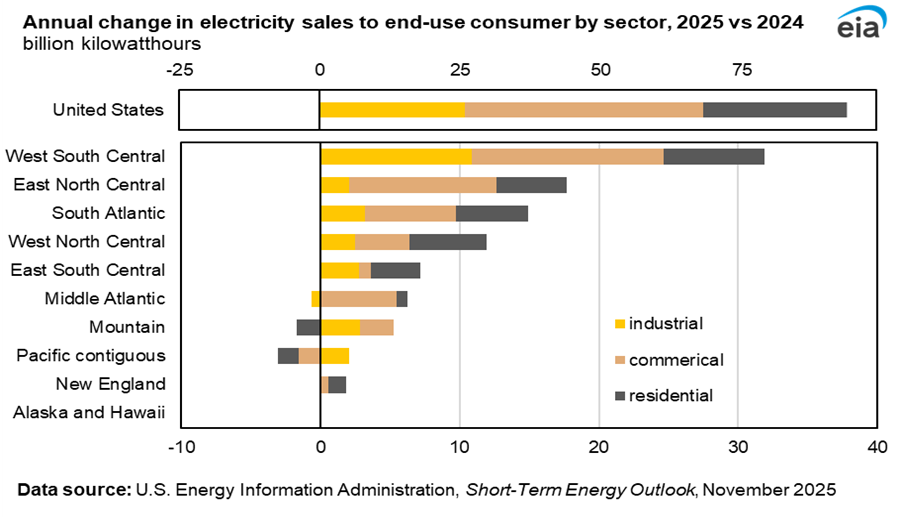
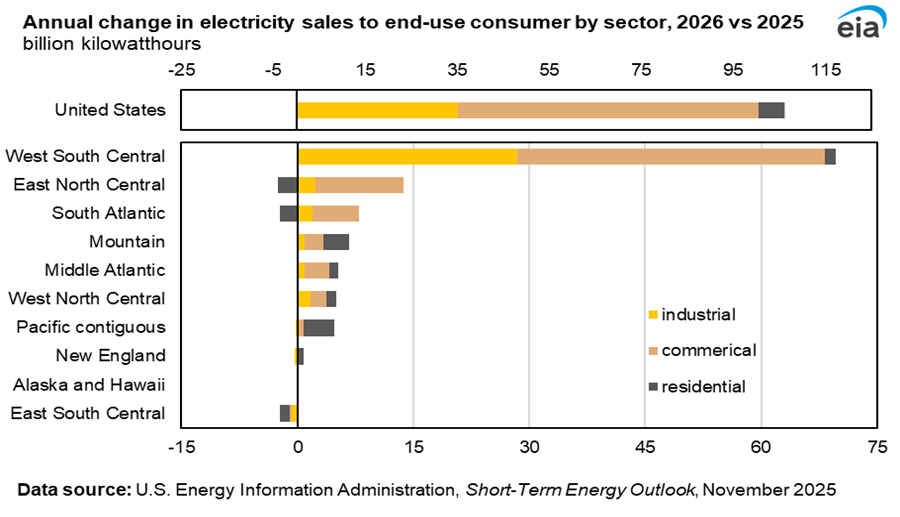
Growth in electric power consumption is concentrated in the West South Central Region (Texas, Oklahoma, Louisiana, and Arkansas) with 34% of all US growth coming from this region in 2025 and 66% in 2026. For the US as a whole electricity sales increase by 2.4% in 2025 and by 2.6% in 2026.
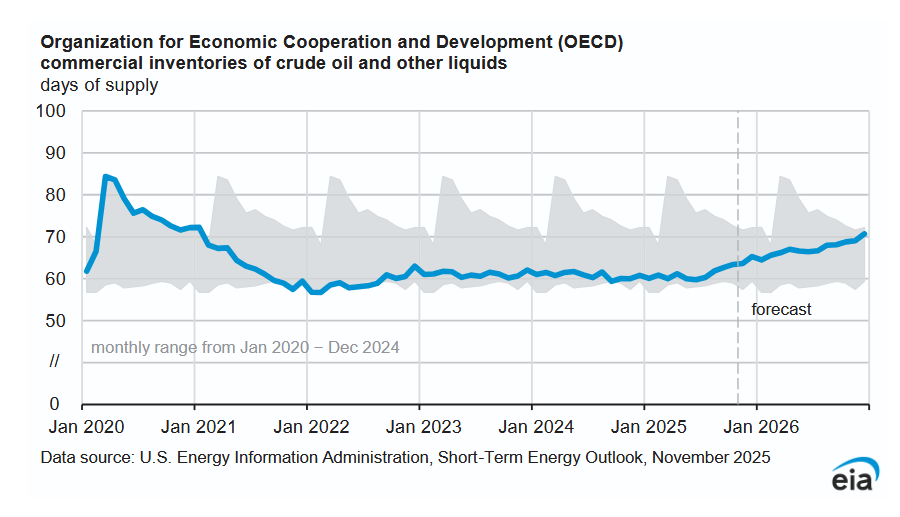
OECD stocks rise to the early 2021 level by the end of 2026.
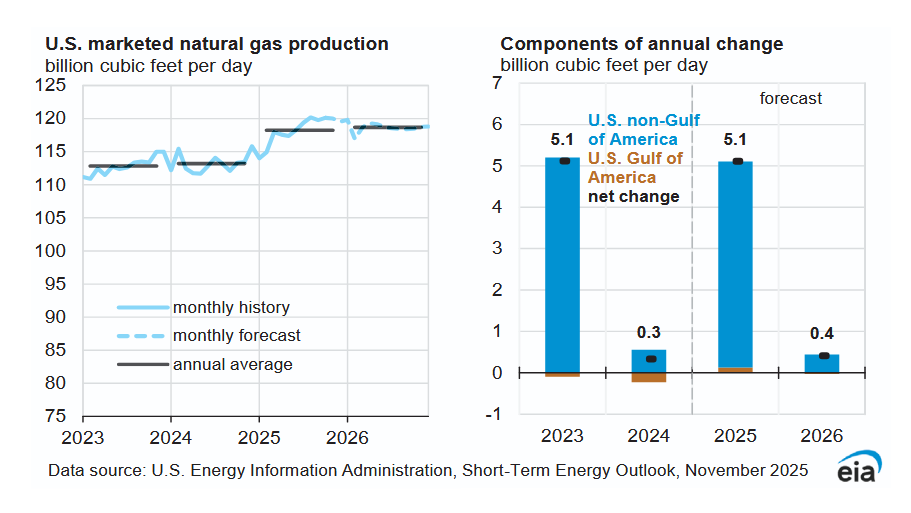
US natural gas output jumps by 5.1 BCF/d in 2025 (4.4%).
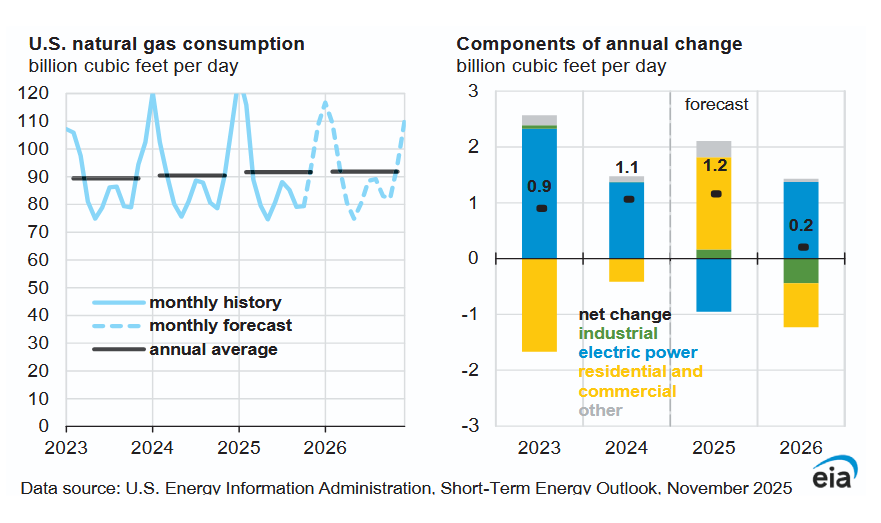
Consumption of natural gas rises by 1.3% in 2025 and is roughly flat in 2026.
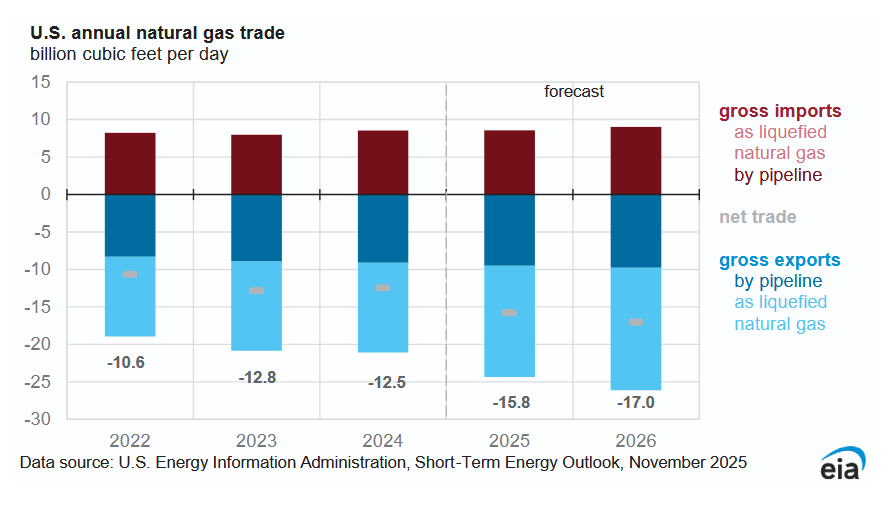
Most of the increased natural gas output is exported with exports increasing by 4.5 BCF/d from 2024 to 2026, an increase of 36% over 2 years (a 26.4% increase in 2025 and a 7.6% increase in 2026 natural gas exports).
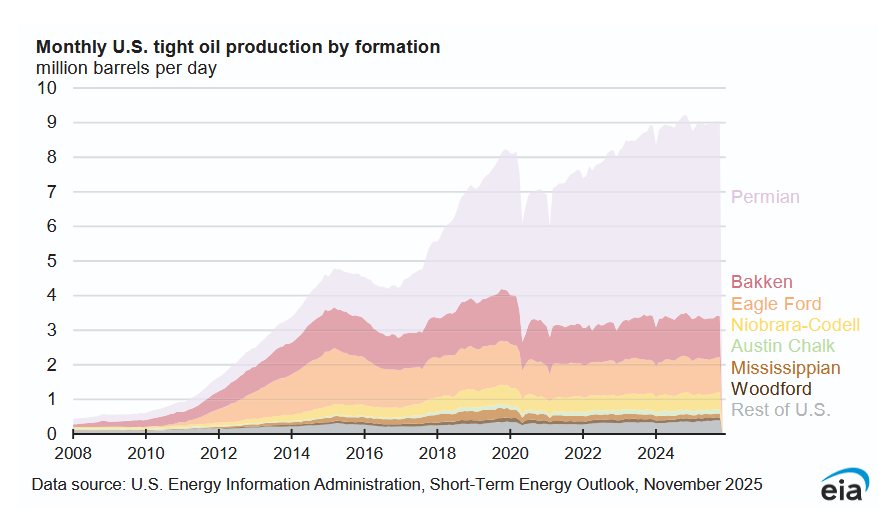
For the past 12 months tight oil output has been pretty flat.
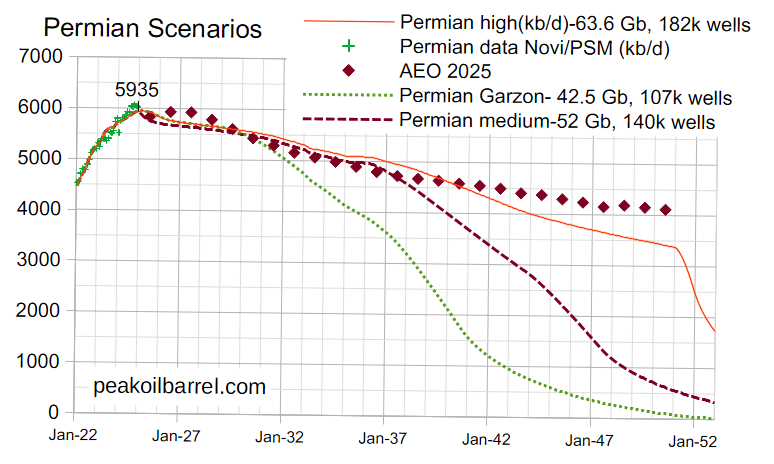
In the Permian scenarios above I try to match the AEO 2025 reference case for the Southwest region with non-Permian C+C and Permian conventional oil deducted (about 800 kb/d for 2024 to 2050). The Permian Garzon case uses analysis by Jorge Garzon from Novi Labs on Tier 1 and Tier 2 remaining locations in the Permian Basin to arrive at a total of 107 thousand wells. For that scenario low oil prices are assumed (under $70/b in 2025 $) so that lower tier locations are not profitable to drill and complete. The medium scenario assumes higher oil prices up to $85/b in 2025$ so that some tier 3 and lower wells are completed (about 33 thousand of them). The high scenario assumes even higher prices (perhaps up to $120/b in 2025$) with another 42 thousand wells more than the medium scenario completed. Note that about 55 thousand wells had been completed by June 30, 2025.
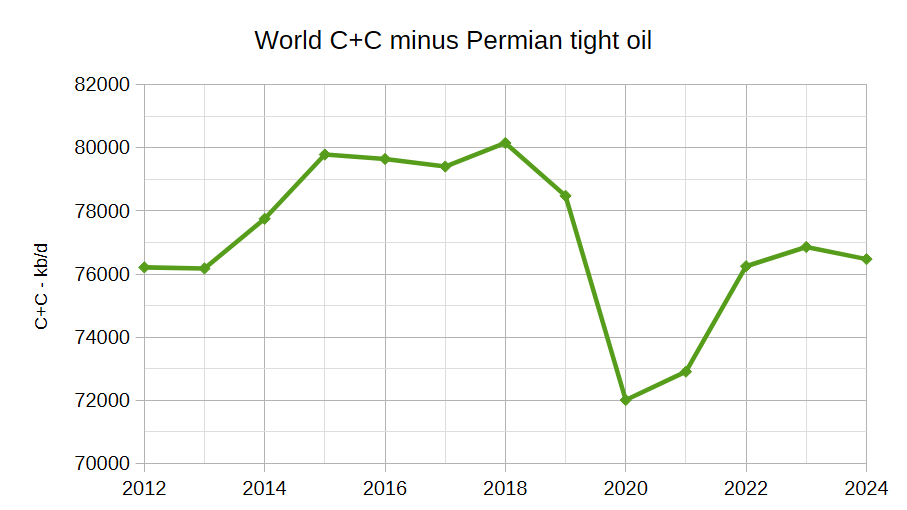
In the grand scheme there are about 1500 Gb of remaining C+C global resources so the difference of 21 Gb between the low and high Permian scenarios is small, less than 1.5% of remaining crude oil resources. Note that from 2012 to 2024 about 95% of the increase in World C+C came from Permian Basin tight oil (5080 of 5341 kb/d of the World C+C increase from 2012 to 2024). Chart below shows World C+C minus Permian tight oil from 2012 to 2024, which increased by 261 kb/d over that period or an annual average rate of 22 kb/d.
93 responses to “Short Term Energy Outlook, November 2025”
Permian shale gas scenario using medium Permian tight oil scenario from post (140 thousand wells with 52 Gb of cumulative tight oil). Shale gas marketed output is about 227 TCF URR from Permian basin for this scenario. The AEO 2025 southwest region marketed gas output is estimated based on marketed shale gas output in 2024 and shown for comparison to this scenario. See link below.
permian gas 2511b
For all tight oil plays the shale gas output is estimated in the scenario below (uses Permian medium scenario in previous comment and my non-Permian estimate for other tight oil plays. Note the steep decline after 2033 and the problems that may result for LNG export facilities that may have difficulty finding natural gas to convert to LNG as shale gas output declines. I am skeptical that Appalachia and Haynesville will be able to fill the 40 BCF/d gap by 2050. The AEO 2025 has relatively constant US natural gas output from 2030 to 2050 at about 96 BCF/d. In 2024 the non-tight oil shale gas was about 50 BCF/d, not sure if this can ramp up to 90 BCF/b by 2050 to make the AEO 2025 reference case for natural gas a reality.
It will be interesting to see if the shale gas output from non-tight oil shale gas plays can increase output at an average rate of 2.2% per year from 2030 to 2050.
Note that shale gas plays that produce very little tight oil (Marcellus, Utica, Haynesville, Barnett, and Fayetteville plays) would be the plays that would be considered non-tight oil shale gas plays in my opinion. The tight oil plays included in the chart below would be Permian, Bakken/Three forks, Eagle Ford, Niobrara, Woodford, Powder River, and Uinta plays, and possibly some smaller plays categorized as “other tight oil” by the EIA in their tight oil data.
See link below for chart.
shale gas from tight oil
If my shale gas scenario for tight oil plays proves correct and the EIA’s AEO 2025 reference scenario for US total shale gas output (from tight oil and shale gas plays) is also correct, then we would need to see the following scenario for US shale gas plays (excluding associated gas from tight oil plays). I believe this might be accomplished up to 2030, but after that shale gas plays will fall well short of this scenario.
shale gas scenario 2511
shale gas (Dry+wet+condensate) 2025: ~58BCFPD
Appalachian (M+U) ~33BCFPD
Haynesville:~13BCFPD
Barnett: ~2BCFPD
EF:~3BCFPD
Anadarko:~5BCFPD
interesting comparison of the decline type curves for shale oil and gas
https://www.eia.gov/todayinenergy/detail.php?id=66564
DC
Surely the price of gas is more important in determining how much gas is produced rather than the price of oil?
Also if gas were not so dirt cheap in the States then it would pay companies to fix all leaks and stop venting and flaring.
https://www.edf.org/media/trump-epa-delays-methane-pollution-protections-oil-and-gas-industry-despite-health-risks
Americans have got used to very cheap gas over the last 10 years. When production starts to fall you will be in the same boat as the U.K. has been from 2001 onwards. Prices doubled in 10 years and many high use businesses went bust.
Iver,
Oil price determines tight oil output. The associated gas from tight oil plays will be less if oil prices are low. The natural gas price has little influence on tight oil output and when tight oil is no longer profitable to produce the associated gas from tight oil plays will cease.
I will let oil pros correct me, but this is my understanding. Note that high natural gas prices in the UK did not keep output from falling, this will also be true in the US.
I agree that the US will see natural gas prices rise as more natural gas gets exported as LNG, by 2030 prices may be quite high for natural gas in the US as supply may not keep up with domestic consumption and LNG exports.
Sheng Wu,
I would consider Eagle Ford and Anadarko to be tight oil plays, the gas produced is primarily associated gas, when the tight oil is no longer profitable to produce in these plays, the remaing gas resource will likely be stranded.
Also lease condensate is grouped with crude in the US. Only C5+ from NGL plants is included with NGL in US statistics.
The Anadarko and Eagle Ford have noticeable gradations from oily to gassy. Both plays have good connectivity to the Gulf, also. They are not egress limited like the App or Permian. The gassier parts of these plays respond noticeably to Henry Hub price. It is a mistake to think of either of those plays as ass gas only.
Really the only ass gas only play is the Bakken. While the Permian is ass gas controlled now, that is because of egress limits not geology. Significant srata and regions exist in the Permian that can supply natty if egress is no longer a bottleneck. Or that can replace declining ass gas in the future, within pipe constraints, if needed.
Also, you should really do a headpost to allow discussing this more thoroughly. I get tired of only having the periodic, one month more data, posts as the sole head post content. If you do a head post on the topic, you can detail your assumptions more. And get more specific debate. And it is Google searchable in future because of the specific headpost. Not buried in comments to a one more month of data style post.
The chart below has uses marketed shale gas rather than dry shale gas (marketed gas is about 10% higher than dry gas) and includes shale gas from tight oil plays based on my medium tight oil scenario and shale gas from non-tight oil plays that would be need to match the AEO 2025 reference scenario for shale gas. The Shale Gas- DC scenario assumes that shale gas from non-tight oil plays remains flat at the 2031 level of 60.6 BCF/d from 2032 to 2050, which is optimistic in my view, I expect some decline after 2035 would be more realistic.
Click on link below for chart.
wet shale gas 2511
Dennis,
You are setting yourself up to be wildly, and I mean off-the-charts wildly, inaccurate when it comes to your projections about future US ‘shale’ gas production.
As your long term focus has been on oil, it would be understandable that your information on this topic is somewhat limited.
Enno’s excellent site is no longer available and to refer to years’ old data can be misleading.
To even THINK of using Patzek as ANY sort of credible research – after he claimed SWPA wells have a ‘lifespan’ of 14 years (Table 4) and a ‘survivability’ rate of 32% (Formula 6) in his 2021 paper reveals an astonishing level of ignorance.
You are a much better man than that.
Going forward, expanding your hard data input might not only enhance the accuracy of your predictions, it very likely might temper your outlook that ~2030 will start a diminishing trend in gas production.
The EIA is calling for the App Basin to increase production from current ~36 Bcfd to ~50 Bcfd by 2050.
Highly likely with current data center/new pipelines/reindustrialization trends all promoting increased hydrocarbon output.
Jes sayin’.
Nony,
The economics probably do not work out well in Anadarko or Eagle Ford at low levels of tight oil. The very gassy wells are typically tight oil wells that simply have high GOR. There are always gradations of GOR within plays, so obvious it is left unstated.
If we look at shale gas from Eagle Ford (EF), Woodford, and Mississippian and natural gas spot prices and WTI spot prices, it is not clear if gas or oil prices are driving things, to my eye it looks more like oil prices, especially from 2008 to 2019, the recent spike in oil and natural gas prices (2022) coincides.
shale gas prices
For Eagle Ford, Woodford and Mississippian plays the shale gas output correlates pretty well with tight oil output. Correlation coefficient is about 0.9158. also see chart below with centered 12 month shale gas and tight oil output for these 3 plays.
shale gas and tight EMW
Coffeeguyzz,
We will see in the future whether the EIA’s scenarios are correct. The basic math for the shale gas plays will not be much different than for tight oil plays.
I remember you claiming that the North Dakota Bakken/TF would likely have a URR of 25 Gb or higher, seems pretty doubtful at this point.
Note that my models assume 25 to 30 year well profiles for Haynesville and Appalachian plays. As far as the shale gas plays I have them increasing by about 14 BCF/d from 2024 to 2031, perhaps they produce a bit more than this, but the resource is not as large as you assume, at 35 TCF per year we reach peak pretty quickly.
One way to think about this is to take cumulative production to 2023 for shale gas (308 TCF) and add proved plus probable reserves at the end of 2023 (1.7 times proved is roughly 2P reserves which is 668 TCF), add these together and we get a rough estimate of URR=976 TCF.
This matches pretty well with my medium shale has scenario (URR=895 TCF), at 976 TCF the peak would move by 2 years (for 895 peak occurs around 448 TCF for 976 TCF URR it would be 488 TCF, with 34 TCF produced per year around 2030, it would be less than 2 years difference in peak date.
In any case we will see what happens.
At link below we have Pennsylvannia Marcellus wells as of Early 2023, the best wells look to be the 2020 wells, that’s the well profile I use for my model for Marcellus. For Utica/Point pleasant I use older data from Novi (Dec 2021) as that is all I have available.
https://public.tableau.com/shared/R4GM6XHTX?:toolbar=n&:display_count=n&:origin=viz_share_link&:embed=y
You haven’t addressed my request to do a headpost, so we can hash out the details. Whether agreement or disagreement. This is just an issue of discussion format, not of debating the EUR. TOD used to have posts on specific topics and so did this site.
It’s not like the ONLY form of post is the monthly data series, next datapoint, update. You can even still have those. But have some interesting threads like TOD or even old POB used to do.
Dennis:
You know more about oil than gas, not that you are even perfect in oil. Keep this in mind when you present analyses and be open to learning from debate. (at least read things carefully…still blown away how you didn’t understand the Barnett in the Permian even when I carefully added a helpful caveat…not that you should need it, if you had more than surface awareness and Dunnig Kreuger self confidence.) Doesn’t mean you have to buy rebuttals, but at least read and think. You are not as King Stork as you think you are.
There’s a fundamental, simple fallacy, in your approach, Dennis. You think of natural gas as composed of only ass gas (which is completely unresponsive to natty price). And then 100% natty only plays. This is a massive oversimplification.
You are ignoring areas like much of the Anadarko and Eagle Ford that have already shown responses to natty price. Also, areas of the Permian like Alpine High that are not oily enough to be developed. And that can’t compete with ass gas (in an egress restricted basin), but which are very developable in the future if needed because of decline of ass gas and dedicated gas plays.
I told you in the past that you needed to be more open to uncertainty, especially to the high side. But you still ran around with confident cluelessness and presented a Permian oil scenario (and as late as NOV2018) that ended up needing to be doubled in EUR, with new info, a month later.
It’s OK to have predictions or tentative analyses. But you should present them with more humility and more discussion of the uncertainty (how wide it is, what factors drive it, etc.)
Shale gas from non tight oil plays (marketed gas). Chart at link below. Expected peak around 2029/2030.
shale gas non-tight
Yawn…more spaghetti charts from on high. How about a head post where we can discuss assumptions. E.g. what is your price scenario for the non tight gas? Do you include the Piceance? Etc.
Not even a criticism of the prediction (didn’t click through), but a request for more than just dropping these charts without underlying bases. You’re not an oracle. You might have some good ideas and some bad ideas. But can’t disentangle them and discuss them when you just act like these are coming down from on high.
DC,
For EF, I counted only Webb county’s gas, as it is >90% percent dry gas, which is ~3BCFPD. Total EF gas should be ~7BCFPD?
For Anadarko, I discounted the total gas of >6BCFPD to 5BCFPD to account for the associated gassy part generated by oil.
https://www.eia.gov/petroleum/drilling/pdf/anadarko.pdf
Nony,
There are always simplifications in models. Every play that has associated gas will respond to both oil and natural gas prices, along with the price of NGL, all are a part of the economic analysis. Bottom line is that when tight oil is no longer profitable in a play, it is unlikely that the shale gas will be developed.
I agree there is uncertainy, I discuss it often. For shale gas see chart at link below where the 80% confidence interval for shale gas is presented. Using cumulative output plus 1P, 2P, and 3P reserves where we assume 3P=3 times 1P and 2P=1.7 times 1P reserves we would get about 701 to 1490 TCF for 80% CI with median at 976 TCF (2P plus cumulative at end of 2023). The path of output is unknown, I use AEO scenarios as a guide for medium term with tails as a guess based on URR.
As always my guesses are certain to be incorrect. As to what drives uncertainty, everything. Prices, technology, disasters, war, politics, along with unknown unknowns.
I wish I could be as humble as you. 🙂
shale gas uncertainty
Sheng Wu,
I use spreadsheet at link below
https://www.eia.gov/outlooks/steo/xls/Fig43.xlsx
Eagle Ford in Oct 2025 was at 4.42 BCF/d for dry gas, marketed would be approximately 10% higher or 4.86 BCF/d. Woodford at about 2.58 BCF/d dry gas in October, marketed gas about 2.8 BCF/d.
Nony,
The chart is EIA estimate for dry shale gas from Appalachia, Haynesville, Barnett, and Fayetteville uses this spreadsheet from EIA, I add 10% to account for extracted liquids (marketed gas/dry gas for L48 is about 1.1) which is an approximation. No price assumption needed for this chart, it is actual production. Generally my price assumption is the AEO reference case,
https://www.eia.gov/outlooks/steo/xls/Fig43.xlsx
The peak guess is based on the median scenario with URR about 590 TCF based on cumulative output and 2P reserves at the end of 2023. At recent levels of output 50% of URR ot about 300 TCF is reached in 2029/2030. Cumulative production through October 2025 is about 223 TCF with about 20 TCF per year produced recently.So in 4 years we get to 50% of median URR. Uinta is included in “other tight oil” in my model, not a lot of data available.
Have you looked at financial evaluation of Alpine High? Not pretty. AEO reference case has Natural gas price at under $4.50/MCF in 2024$ through 2050, these plays are not developed at those prices.
https://www.benzinga.com/markets/24/10/41584895/inside-apaches-alpine-high-fiasco-deception-fraud-and-a-3-billion-write-down
DC,
The 2025 AEO report gives unproven TRR for US oil and gas here,
https://www.eia.gov/outlooks/aeo/assumptions/pdf/case_descriptions.pdf
Sheng wu,
I do not think the EIA estimates are very good. My guess is that they estimate future consumption based on assumed future growth and adjust supply to match demand.
Sheng Wu,
Ultimate TRR Refence case 2,206 Tcf.
High case 3,309 Tcf. (Page 7).
Dennis,
LOL
DC,
EIA and USGS are generally more conservative or slow, at least 3~5 years behind real drilling results already become tangible. This is particularly true or underestimate for shale gas, and shale oil is a little complicated.
Alpine High is a unique scam of overhyped E&P companies, and similar cases like Miss Lime is even bigger. Both were claimed to be liquid rich. Haynesville is another near miss, but amazingly it bounced back and forth nearly twice or even three times now.
Still haven’t responded to my (twice made before) about having a head post versus this crap buried in comments. It’s a big enough topic. Put a post together with your prediction and the bases. Can’t keep track of it otherwise. I can’t tell what is new/different from stuff you’ve said before (also strewn in comment threads of posts that are not natty head posts). This isn’t even a low/high resource argument. It’s an engagement request.
The issue with Alpine High was not enough oil (too gassy) and gas price (in the Permian) too low. Not lack of gas. The project suffered because of a lack of infrastructure out of the field and out of Waha. That’s stranded gas…available if the pipes are built and Henry Hub prices prevail.
$4.50 in nominal dollars in 2050 is pretty low. Maybe lower than $3 in current dollar, certainly lower than 2015 era dollars. Anyhow, if AH can’t be developed because price are too low, that’s a sign of oversupply from other plays. Gas on gas competition.
At least be intellectually consistent. If you think the resource is smaller than EIA, you should be predicting much high prices. Duh.
Nony,
I cannot predict future prices, if they are high there may be a lack of demand which will balance the market, as more and more LNG is exported prices will be determined by World Markets similar to oil. There is likely to be a glut on World markets for natural gas, shale gas will be stranded because as LNG it will become the most expensive resource (particularly low output shale gas plays like Eagle Ford, Fayetteville, Barnett, and Woodford). Note I said the price is real HH price in 2024$, but remembered incorrectly, it is $4.80/MMBTU in 2024$ in 2050 for AEO 2025 reference case, the low oil and gas supply case has prices at $9.75/MMBTU in 2024$ in 2050 with US natural gas output at about 74 BCF/d. I doubt we will see prices at this high a level because demand for LNG would drop on World Markets so exports would fall and domestic supply would rise.
In any case plenty of uncertainty and the AEO reference case prices look reasonable to me given the influence on World markets on US HH prices that will arise as more NG is exported.
I may do a post in January if I can fit it in. Not sure if this is of interest to others as you are the only one requesting this.
US September Oil Production, Another New High
Biggest gainers were NM and Alaska offset by Texas drop.
Production increased by 44 kb/d.
A US
Thanks Ovi.
Here is the 914 link: https://www.eia.gov/petroleum/production/
1. Oil AUG was slightly revised up itself. So, close to a 50 (don’t know exactly) thousand bopd increase over old month’s record.
2. AK increase is interesting. May just be maintenance, but EIA had an interesting Today in Energy, a few days ago that talks about expected 2026 increases because of new projects starting up. So may be systemic. (Donno and would require disentangling from the seasonal maintenance gyrations.)
3. MT is hanging in there above LA and KS. Little MT kicking old tired traditional oil states butts. (Irrelevant to the overall picture, but I follow it out of interest as a micro area. If anything it should be a lot more drilled up than ND, so interesting how it has rebounded a little over the recent years…not just declined inexorably.
Maybe some oil lefte behind in the early days of shale, when the geology and completion/drilling precision was not as good. (A more dramatic reversal of a peak was the Haynesville. Just a couple cases where the “once it has peaked, it goes down forever, since they drilled the best stuff first that people like Hughes pushed. And…I’m not saying this is always or even a majority phenomenon. Not meant to be a super corny view. But it does show how gradual technology improvement can change things even in some “mature” areas. Just something to watch out for.)
4. NM kicking it strong! Keeps being mean to the peakers!
5. ND. 🙁
6. OH big drop, especially on a percentage basis. I think the oil here is sort of more fragile (high decline, less old baseline).
7. OK up a bit, but has been down a lot over the months also. Looking forward to the Ovi time series.
8. Natty is flat, but actually slightly down if you take AK out of the equation (which you should). Not sure the driver, thought prices are OK, but not sure what they were a couple months ago. LA was down so it may have been price…that is sort of the HH responder. (App and Permian are egress limited, not HH responding.)
https://www.eia.gov/petroleum/production/#ng-tab
Nony
I will answer a few points and keep the rest for the post on Wednesday or Thursday.
1) August was revised up by 6 kb/d from 13,794 kb/d to 13,800 kb/d.
2) Alaska production drops every summer and then rebounds. I think it is primarily related to maintenance on the pipeline because it is easier and a more favourable environment to work in the summer. Alaska September production could be a double bump. Looking at the attached Alaska chart it does appear that the September increase is bigger than normal, a combo of maintenance and Puma.
In the May report, I wrote the following note under the Alaska chart.
https://peakoilbarrel.com/us-february-oil-production-marginally-higher/
“Alaska has recently brought new fields online to consistently have YoY and monthly production gains which have broken away from the earlier dropping production trend red lines. According to this Article (below), first oil production begins at Nuna project in Alaska in December.”
https://www.adn.com/business-economy/energy/2024/12/26/first-oil-production-begins-at-nuna-project-in-alaska/
The Willow project is even bigger than Nuna.
I really do try to keep our follower up to date and sometimes ahead of the EIA.😁😁
4) Agreed on NM. Almost mind blowing. You will have to wait a few days to see the Lea and Eddy charts.
I’ll leave the rest for the post. Surprised you didn’t mention Tx.
Alaska
Yeah…I remembered you mentinoing the project for AK. Thought you might be getting ahead of things, but maybe you were right.
I guess we can compare full year 2025 to 2024 and see if the increase already started. 2026 will be interesting also.
Ovi, can’t recall what TX did, but assume it underperformed. Interesting. I guess it is more responsive to price than the NM powerhouse. Lea and Eddy are the sweet spot. Other parts of the Permian not as strong.
Oh…I guess we can also dig up your remarks about EIA and NM state oil reporting. Remember you saying something to the effect that EIA was wrong and state was right…and I said NM has RRC type lag. You said to wait for the EIA correction. Not there yet. Has it been long enough?
Nony
Let’s keep the Texas discussion for the upcoming post.
WRT to NM, my take has always been that the EIA’s production estimate is more optimistic than the NM’s OCD. However, I think the gap is narrowing.
Rig Report for the Week Ending November 28
The rig count drop that started in early April 2025 when 450 rigs were operating had a big drop this week. Drilling continues at unabated rates with WTI below $60/b.
– Texas lost 8 rigs this past week. However the drop was 1 rig in each of 9 counties and an increase of one in one county. There were no changes in the rig count in the four main Permian counties.
– US Hz oil rigs dropped 8 to 363, down 87 since April 2025 when it was 450. It is also up 1 from the low of 362 in the week ending August 1. The rig count is down 19% since April.
– New Mexico Permian was unchanged at 96 while Texas dropped 8 to 167.
– Texas Permian dropped 3 to 133. Midland and Martin were unchanged at 24 each.
– In New Mexico Lea and Eddy were unchanged at 59 and 37 respectively.
– Eagle Ford dropped 2 to 26.
– NG Hz rigs rose by 2 to 112.
A rig
Frac Spread Report for the Week Ending November 26
The frac spread count dropped by 6 to 173. From one year ago, it is down 42 and also down by 42 spreads since March 28.
A frac
Dennis wrote
“Have you looked at financial evaluation of Alpine High? Not pretty. AEO reference case has Natural gas price at under $4.50/MCF in 2024$ through 2050, these plays are not developed at those prices.”
Dennis
Where do you find this rubbish?
Nobody knows the price of gas in two years time let alone in 20.
As the best locations run out, the price will increase. Many areas which currently make no sense at current prices will do very well at $8mcf. Even then this is much cheaper than what Europe pays for gas.
Higher prices leads to more efficient use. Things like external window blinds would save Americans billions in air conditioning costs.
Do you know the price of Europe wholesale gas?
Iver,
Yes I know for expample that the recent futures price for Dutch TTF was about $10/MMBTU. But more recently the Feb 2026 contract traded at about $9.75/MMBTU (28.68 Euro/MWh).
Also note that at $8/MCF at wellhead, the gas is no longer competitive as LNG as this would translate to about $16/MCF in Europe.
I agree the future price is unknown, these prices are assumptions that are inputs to a national energy model used by the EIA.
See
https://www.eia.gov/outlooks/aeo/data/browser/#/?id=13-AEO2025®ion=0-0&cases=ref2025~lowogs&start=2023&end=2050&f=A&sourcekey=0
Chart at link below for AEO 2025 Reference case
chart(112)
“ Also note that at $8/MCF at wellhead, the gas is no longer competitive”
Gas is mostly uncompetitive with renewables in the US at current prices: note the table at the top of this post showing gas losing market share. If the price doubles it’s goose will be cooked.
“Growing international demand is causing natural gas prices to rise, which will in turn push U.S. electricity prices higher now that about 40% of U.S. generation comes from natural gas, according to the Institute for Energy Economics and Financial Analysis.”
” there is limited appetite for building new coal-fired power plants. They are very expensive to build,” he said. “And I think in most regulated territories in the U.S., a regulator would look at your proposal for a new coal plant and ask if you really think you will have this operating 40 years from now. And I think the answer would almost uniformly be no.””
“The likely solution, he said, is renewable energy — and especially energy storage. Battery prices continue to decline, and storage can absorb low-cost, surplus solar energy. This could deliver far more stable electric prices than natural gas in the coming years, Wamsted said.”
https://www.utilitydive.com/news/-electric-prices-natural-gas-lng-ieefa/759085/
HH price is heading to $5/MCF
https://oilprice.com/Energy/Energy-General/The-Remarkable-Rise-of-Natural-Gas.html
Meanwhile the world continues to blithely burn hundreds of billions of cubic meters of gas every year.
Sheng Wu,
The article you linked has HH prices rising to $4.20/MMBTU, not $5/MMBTU. For AEO 2025 reference case HH prices approach $5/ MMBTU in 2024$ around 2047. Chart linked below has low oil and gas supply, reference, and high oil and gas supply scenarios for real HH prices from AEO 2025. My guess is the reference price case through 2035 with prices rising to between the reference and low supply case to the point that demand and supply balance. My guess would be approximately $6/MMBTU in 2024$ +/-33%. High uncertainty for many reasons some unknown.
chart(113)
DC,
HH gas price is now at $4.85, up trend very strong
Sheng Wu,
January futures price is often quite high. We will see what happens in the future.
Most recent data for HH spot price that I could find was at EIA from 11/21/2025, price was $4.13/MMBTU. The data will be updated on December 3 with most recent reading from November 28 for that report.
Link below for data
https://www.eia.gov/dnav/ng/ng_pri_fut_s1_d.htm
Took a look at historical real HH spot prices in 10 year averages from Nov 2005 to October 2025 using monthly spot price data in 2024 US$. 2005 to 2015 was $7.24/MMBTU, and 2015-2025 was $3.61/MMBTU. These are real HH spot prices for each decade in 2024 US$. Each interval starts in November and ends in October because October is the last full month we have spot price data available. The spot data starts in Jan 1997, for Jan 1997 to Dec 2006 the average real HH spot price was $7.76/MMBTU, that is the oldest 10 year period that I have HH spot price data available.
For the past decade Natural gas prices in the US have been quite low compared to the rest of the past 29 years.
I was able to find HH spot price data for Jan 1991 to Dec 1996 at link below
https://fred.stlouisfed.org/series/PNGASUSUSDM
I spliced together with EIA data from Jan 1997 to Oct 2025 to get an average real price in 2024$ from Nov 1995 to October 2005 of $7.02/MMBTU. So the most recent decade had much lower average decadal real HH spot price than the previous two decades roughly 2 times lower real prices (1.975 times lower to be exact).
Waha kicking it negative.
https://aegis-hedging.com/insights/basis-brief-waha-gas
Wonder why nobody is drilling the high gas (low oil) areas like Apline High or the Delaware Barnett. Dennis says it must be lack of resource. But why the heck would anyone deliberately target dry gas in the Permian right now!?
Nony,
The resource is not profitable to produce without enough liquids, I expect this will continue in the future. It is resources that are profitable to produce that are scarce. We can imagine that Natural gas prices are $15/MCF and that beggars can ride.
Henry Hub =/= Waha. Duh.
Nony,
Did anyone say WAHA prices were the same as HH? It wasn’t me nor was this implied.
Prices will not always be that low for Waha and large producers get better prices as they book space on pipelines. Though Permian Resources only managed about $1/MCF in the most recent quarter and this is the largest producer in the Delaware Basin. So yes far below Henry Hub pricing (about $2/MCF less for 2025Q3).
I think this is likely to change in the future.
Nony,
The last paragraph in that linked Novi Lab report may be the most impactful, jarring data that I’ve encountered in my ~15 years of engaging with POB.
So much so, that I just spent about 20 minutes with my new buddy chatbot trying to wrap my head around the sheer scale, monetary aspects and future implications of this unfolding ‘AI’ drama.
Breathtaking.
That Novi analyst – Brandon Meyers – apparently did a Real World – albeit illustrative – breakdown of just how much ‘value enhancement’ could be derived from a single unit (1,000 cubic feet) of natgas … presented in financial value as 1 mmbtu(s).
He came up with an ultimate value of $3,256 earned for every input mmbtu unit … which costs virtually nothing today in West Texas.
Meyers further says that a paltry 200 Mw data center can throw off $32 Billion per year in inference revenue.
Wow.
Folks who do not ‘get’ what is unfolding here are apt to be left way, way behind in the coming years.
And by folks, I include entire countries, industries, the whole shebang.
Alpine High probably needs $5/MCF wellhead price to break even, Apache actually drilled ~300wells, and even build a large gas plant for it, but finally abandoned it.
The EUR per lateral is about 5~6BCF, compared to similar or less cost SWPA’s EUR 12~15BCF/lateral.
Also, US export 7.5BCFPD to Mexico thru pipelines, and mainly thru the WAHA hub? The WAHA hub actually is going the opposite way from Permian oil field toward GOA LNG export facilities, and instead heading directly to Mexico and Arizona-California.
Mexico should build large plastic and fertilizer plants to use the gas and export back to US. But, instead Mexico still importing lots of plastics HDPE and PP.
Chevron is building a power plant to supply a data center, within the Permian.
https://novilabs.com/blog/turning-gas-to-gold-over-3000-of-value-per-mcf-why-chevron-is-building-a-power-plant-in-the-permian/
Sure, shows people with money think that Permian gas supply is robust. And so thinks Novi also.
“Ultimately, relatively cheap in-basin gas is here to stay and this will benefit Chevron’s power plant project.”
The Novi analysis goes through 2030, note that my Permian shale gas scenario is similar to the Novi S1 scenario with flat lateral feet drilled from 2026 to 2033. The shale gas output starts to decline in 2033 as viable tier 1 and tier 2 locations become scarce. The problems arise after 2035 as shale gas output falls by 19 BCF/d over the 2035 to 2050 period. If we assume higher natural gas and oil prices perhaps decline is slower, but I do not assume that as I think oil and natural gas supply will meet demand on World Markets at the AEO reference price case. Clearly I am certain to be wrong, future prices are unknown, they may be the same, or higher or lower than present real prices and likewise output might be either higher or lower than my best guess.
Note that cheap in basin prices are not really a recipe for long term supply of natural gas.
Yawn…as usual you assume that the only gas in the Permian can come from oil associated drilling…and even the ass gas that is done with negative Waha prices.
Waha price =/= your $15 rebuttal.
Kinda reminds me of how you said Marcellus was struggling to grow…when it is clear as day that that is an egress restriction. (Pipes full, rather than lack of resource.)
https://www.eia.gov/dnav/ng/hist/n9050pa2a.htm
Look at that flat line in recent years. Is that a Hubbert curve?
Oh…and what’s the local price for bulk gas in PA? Transco =/= HH either.
P.s. You are probably also ignoring how GOR ratio grows, while oil flatlines. (I.e. gas grows during plateau Permian.)
Nony,
I assume the Permian gas is associated gas because that is what has been occurring. When we see $15/MCF at WAHA perhaps we see the shale gas focused drilling you keep harping on (which only exists in your imagination), for now this is wishful thinking. Possible? Obviously. Likely? Not really.
I agree PA is limited due to lack of pipelines, not sure why they aren’t built. Output has been flattish lately, we will see what happens as more natural gas CCGT is installed or as more pipelines are built.
About 4.65 BCF/d of capacity is supposed to come nline by 2027Q3 with another 2.5 BCF/d at an unknown date of service.
From
https://gasprocessingnews.com/news/2025/06/us-energy-firms-eye-new-northeast-natgas-pipelines-buoyed-by-trump-and-demand-outlook/
My scenarios are not based on Hubbert curves, I use well profiles and completion rate.
Perhaps we see Permian drilling for shale gas only in the future, possible if natural gas prices are high enough to make it profitable, I just think the odds are low (maybe 1 in 10) that this will occur.
The Permian gas grows a little, but not as much as you believe. Compare medium scenario at bottom of post with first chart posted in comments. Production falls for oil and rises for gas due to increase in GOR. I use the well profiles based on data for 2020 wells. The average 2022 well is similar to the average 2020 well. Beyond that I can only guess as I don’t have data after early 2023. At link below is GOR for average 2020 Permian well, after month 38 an Arps hyperbolic fit to data for oil and gas is used as an estimate. Data from
https://novilabs.com/blog/permian-update-through-jan-2024-2/
Chart at link below horizontal axis is months from first flow for averag 2020 Permian well.
permian 2020 gor
For the Permian Basin medium scenario, the Chart below has the basinwide GOR vs time.
permian GOR medium
https://www.youtube.com/watch?v=1rsdHTjYJsc
7 minutes
Can other countries replicate USA shale?
How bout the Aussies?
Marcellus Model below at 295 TCF which is about 10% more than the USGS mean TRR estimate which is about 270 TCF, this is optimistic because typically only some of the TRR is profitable to produce, typically 67%, which would reduce the ERR to about 198 TCF.
Click link below for chart.
marcellus2511
Utica Model below, URR=103 TCF which is more in line with ERR for Utica, mean TRR is about 148 TCF based on 2019 Utica/Point Pleasant USGS assessment.
utica 2511
Appalachia Shale Gas scenario (Marcellus and Utica scenarios combined). See link below for chart.
appalachia 2511
Haynesville/Bossier Scenario URR=108 TCF at link below.
haynesvillebossier 2511
Marcellus, Utica, and Haynesville/Bossier Shale Gas Medium Scenario, URR=505 TCF, 80% CI for URR is 350 to 800 TCF.
big shale gas 2511
Scenario below adds Barnett, Fayetteville and other shale gas plays (“rest of US” in EIA data) to Appalachia and Haynesville/Bossier. I call this Shale Gas from non-tight oil plays. Tight oil plays are Permian, Bakken/Three Forks, Eagle Ford, Niobrara, Woodford, and Missippian plays.
Click link below for chart.
shale gas nontight 2511
US shale gas scenario URR=985 TCF is my best guess scenario, 80% CI for URR is 706 to 1477 TCF. Chart at link below for medium scenario which is my best guess certain to be incorrect. If my best guess is close to correct this will be a big problem for LNG exporters and perhaps for Europe.
shale gas best guess 2511
Price of U.S. lng sold to U.K.
https://www.eia.gov/dnav/ng/hist/ngm_epg0_png_nus-nuk_dmcfm.htm
It would benefit people to read this to remember how vastly things can change from one year to another.
https://ukerc.ac.uk/news/cost-of-gas-by-default/
Can anyone workout difference between Henry hub and price of lng to U.K?
Iver,
It takes energy and thus money to cool the natural gas to a temperature where it condenses to LNG. The difference between LNG and Henry Hub price reflects this cost.
Difficult to find free information on this, best I could find on a quick search (without using AI) was
https://markets.financialcontent.com/worldnow/article/marketminute-2025-11-25-global-lng-netbacks-signal-dynamic-shifts-us-exports-soar-amidst-easing-european-prices-and-persistent-asian-demand
Iver,
Not sure exactly what you are looking for, but Henry Hub price is the always fluctuating price at the transfer point in Louisiana where a bunch of pipelines interconnect and can send out gas to various regions in the US.
Essentially the spot price reflecting the overall natgas demand on any given day.
The cost to liquify, ship, and regasify this product once it reaches the UK varies somewhat due to many factors … contract terms, efficiency of ship, delivery route, amongst other items.
Broadly speaking, a liquification fee might run $2.50/$3 per mmbtu, shipping fee $1.50, and 50 cents to regasify.
So, maybe 5 US bucks give or take all in cost. But (and it is a very big ‘but’) the profit for the seller can be much, much higher IF no contracts are in place (contract terms such as HH price plus ‘X’ percentage mark up.)
This is the basic reason why so many European countries occasionally pay nosebleed prices for LNG as they are – in most cases – spot buying from the huge trading companies (Shell, Vitol, Gunvor, et al).
These trading companies – amongst others – committed to long term purchases (10 to 20 years) of finished product from the owners/builders of these fantastically expensive LNG plants, and said contracts were sufficient for the owners/builders to obtain the crucially needed financing.
So, yeah, when the TTF and NBP pricings are about $10-$12/mmbtu (current range) that reflects the sellers’ cost plus anticipated profit.
Very sensitive to supply/demand dynamics.
Coffeeguyzz and Dennis
Thank you. Very informative
I was trying to get an idea of how the cost of how natural gas increases from what the producers get. To the various stages.
Finally what a company in the U.K. pays for LNG
Europe is stuck with having to import LNG. It’s own production is falling and to heat a home using electricity is double that of gas. That is with the most efficient heat pumps. Also heat pumps need a total upgrade of your Heating system. A very expensive option.
So we will import lots of lng for a long time.
LNG facilities are very expensive to build and maintain/operate. For one example, in 2023, a world scale (5MTPA) dual-string facility I worked with had an annual O&M budget of around $60M. That was a new facility with minimal equipment failures so that just covered salaries and preventative maintenance. They had another $60M for capital equipment costs annually back then (on mostly new equipment). Of course as the facility ages those costs go up and that doesn’t count feed gas or fuel gas costs. And the inevitable flaring of several million dollars of refrigerant on each plant trip. It’s rough to make gas really cold.
LNGGuy,
Do the estimates by Coffeeguyzz sound reasonable for LNG produced in US Gulf Coast and then shipped to the TTF facility in the Netherlands? I believe he has about $4.50 to $5/MCF for cost to convert feed gas to LNG, ship and regasify at import hub. I am not familiar with the process, but imagine that you are.
Thanks. Also what is the time frame for the export facilities as far as operational life before a major refit is needed? Maybe 30 years?
DC – Coffeeguyzz’s numbers look reasonable to me. The prices paid by the importer will vary wildly depending on whether they have long term contracts or are buying spot market, which of course depends on geopolitical events and weather. And as I’ve mentioned before, many of the customers with long term contracts are responsible for sourcing their own gas and supplying it to the Liquefaction facilities via pipeline. They pay the drillers some contracted amount for the feed gas and then pay another fixed fee on top of that to the Liquefaction facility for their service, but Liquefaction service is completely independent of the price they are paying for the actual gas. $12-15/mmbtu are pretty common for importers to pay for a shipment of gas so I guess you can back-calc the HH cost of gas out of that to estimate the cost to Liquefy/transport the gas – though they may be paying more or less than HH for their feed gas depending on how their contracts with the drillers are structured. Historically Asia has paid the most for gas on average. I can’t recall being involved with any shipments to the Netherlands but I imagine they pay similar pricing as greater Europe. I imagine they got most of their gas from Russia historically(?), so if they just started importing from US without long-term contracts since 2022 they may be paying spot prices or something similar.
Then there is the cost to vaporize the LNG once it’s offloaded from the ship. Vaporizing is pretty easy and cheap compared to Liquefaction though. Like less than 10% of the cost and complexity – both in terms of power required and capital equipment cost. They also require about 10% of the manpower of Liquefaction to operate.
Thanks LNGGuy, very helpful. Does my guess of 30 years sound reasonable for the life of an LNG export facility, I am assuming at that point a major refit might be necessary for continued operation.
Sorry – yes the design criteria is usually 20-30yr facility lifetime but I’d expect them to be utilized longer than that if the feed gas is there. It’s no different than a regular old power plant in that regards.
Major outage service intervals vary by the specific process used in the design. The regular annual outage isn’t too big a deal (normal PM type stuff), but there are usually 5-7yr intervals where the mechanical drive gas turbine rotors need to be inspected/removed/replaced, depending on whether they’re aeroderivative or single-shaft units. Also the refrigerant compressors usually require internal inspection every 5yrs for rotor health and that can be a big deal depending on make/model.
Specific cryogenic equipment like the main cryogenic heat exchangers or heavies removal columns usually don’t require major teardown unless there is a specific problem to deal with. Mostly it’s the rotating/fired equipment that has normal maintenance intervals specd by the mfgr similar to a powerplant.
A typical annual outage requires about three weeks to turn around, but the specific timeframe is determined by the contract with the customer. Even a major turbine teardown would be expected to be completed in this timeframe.
LNGGuy,
Thanks, great information.
Thanks Coffeeguyzz,
In general these companies will not continue to operate unless they are profitable so on average we need to add their profit margin to the analysis, say 10 to 15% of revenue on average.
Average markup for most recent 12 months (assuming TTF prices were about $10/MCF) was close to 30%. The differential between the export price for LNG to Netherlands and HH for most recent 12 months was $4.50/MCF and difference between export price and spot price at TTF was about $2.26/MCF, average export price was $7.73/MCF and 10/7.73-1=0.294.
At home We pay around €16 per mcf to our suppliers
How does that compare in the U.S.
Hi Iver,
Is that the residential rate? In the US there are typically different average rates for residential, commercial, industrial, and electric power plants.
See https://www.eia.gov/dnav/ng/ng_pri_sum_a_EPG0_PRS_DMcf_a.htm
For residential customers the US average rate in 2024 was $14.59/MCF for natural gas delivered to a home. In September 2025 the price was up to $25.56/MCF for residential customers.
https://www.eia.gov/dnav/ng/ng_pri_sum_a_EPG0_PRS_DMcf_m.htm
Typically the price is lower during the winter, perhaps because there is less power plant demand in winter due to less AC demand.
DC
Yes that is residential price not much difference between suppliers. Should have been £ sign.
I see industrial price can be very very low such as in Texas.
U.K. business rates not that low.
Europe used to import 45% of its gas from Russia now down to 13%. It has agreed to to end all Russian gas and LNG by 2027. That means more LNG from the United States.
Looks like natural gas for generation is stagnating, while renewables are providing about 80% of new power.
Table 7d part 1. U.S. Regional Electricity Generation, Electric Power Sector (billion kilowatthours),
…………………………..2024……. 2026…. Growth…. %
Natural gas 1,766.00 1,760.30 -5.70 -0.3%
Coal……………….. 647.7…… 685.9…….. 38.20 ..6%
Nuclear………. 781.9….. 800.8…… 18.90……… 2%
Renewable.. 947.70 1,125.70……. 178.00 19%
Other…………… 13.30…… 9.00…….. -4.30……-32%
Total…………. 4,156.60.. 4,381.70.. 225.10… 5.4%
https://www.eia.gov/outlooks/steo/pdf/steo_full.pdf
Nov-25
I aim to be well informed and pragmatic, trying hard to take into account views that may run contrary to my baseline inclinations/perceptions. I know we are heavily dependent on affordable supplies of fossil fuels…dangerously so to the tune of roughly 80% of global primary energy supply.
And also I know that humanity has a miserable record in balancing the health and stability of the living earth with our economic exploits.
This policy change is simply not good, and seems like an act of extreme desperation. Are we at the point on fossil fuel supplies where desperation is called for?
“In November, the U.S. Environmental Protection Agency (EPA) proposed to remove federal protections from millions of acres of wetlands and streams, thereby reducing the power of the 1972 Clean Water Act. The EPA said it planned to more narrowly define “waters of the United States” to exclude many wetlands and streams, which is expected to take away federal protections from up to 55 million acres of wetlands, or about 85 percent of all wetlands nationwide”
Seems like a form of self hate. After all, we are living creatures dependent on a healthy biosphere. Not just for the short term, but indefinitely.
Hickory,
Our choice in the voting booth has consequences. Unfortunately poor choices were made in 2024, at least from my perspective. I think laws should be enforced in civil society, but not everyone sees it that way.
“This policy change is simply not good, and seems like an act of extreme desperation.”
It’s not desperation, it’s simply a part of extreme crony capitalism. It’s absolutely unnecessary for economic health, and I don’t see a relation to energy issues. It’s just random people looking for things to exploit. This is not surprising – the current Administration seems to be primarily a criminal enterprise.
Spot price for WTI on Dec 2, 2025 was $58.81/b and for Brent on Dec 2, 2025 the spot price was $63.37/b, Brent/WTI spread was $4.56/b. We are supposed to get an update on Henry Hub Spot price today, but I am not sure what time the data is released by the EIA.
Crude data from EIA at link below
https://www.eia.gov/todayinenergy/prices.php
There is some natural gas spot prices at link above, but not the Henry Hub price specifically.
Natural Gas spot price at Henry Hub was up to $5.08/MMBTU on Dec 1, 2025. The weekly average for week ending November 28, 2025 for HH spot price was $4.29/ MMBTU.
Data at link below
https://www.eia.gov/dnav/ng/ng_pri_fut_s1_d.htm
The WTI Spot price on Dec 1, 2025 was $59.47/b and weekly average WTI spot price for week ending Nov 28, 2025 was $58.69/b. Data from link below
https://www.eia.gov/dnav/pet/pet_pri_spt_s1_d.htm
Spread seems slightly larger than I expected. Has been more like a couple bucks recently. Wonder if it is tranport caused. Cushing is inland and then there is the GOM/A to UK differential. There were the old days when it blew out a lot. Thought those were over, but perhaps at 14 MM bopd, they start to come back. (Could also be something technical like different timing of the contract settlement.)
Hi Nony,
Perhaps it is a difference in contract expiration dates, but note these are spot prices rather than futures contract prices, though no doubt there may be tight linkage between spot prices and futures prices, but I never trade these so do not follow closely.
Nony/Dennis
The difference may be due to different contract months. Note in the attached picture in the lower right it is showing the Brent Feb contract. WTI price today is for the January contract.
Not sure where Dennis got his prices but maybe he could check whether the contract prices were for the same month.
US post goes up later tonight.
A Br
Hi Ovi,
I gave links in the comment to where the spot price data came from, it was EIA and EIA source is
“Refinitiv, an LSEG business” see Souces in footnote at page linked below
https://www.eia.gov/dnav/pet/TblDefs/pet_pri_spt_tbldef2.asp
https://www.api.org/energy-insights/charts-analysis/continued-investment-is-needed
this graph shows that if the oil price keeps low longer, and below 1/3 of current active drilling shale patch break-even line, then we will see very fast decline, especially for oil, gas is slower.
An update to US September Oil Production has been posted
https://peakoilbarrel.com/record-us-september-oil-production/