The EIA Short Term Energy Outlook (STEO) was published recently. A summary in chart form.


Note the drop in Brent Prices compared to the July STEO.

The chart above shows the relationship between stock builds or draws with changes in the price of oil in real (inflation adjusted) dollars. When there is a stock build prices decrease and a stock draw leads to a price increase. The EIA expects oil stocks to build and oil prices are expected to fall.
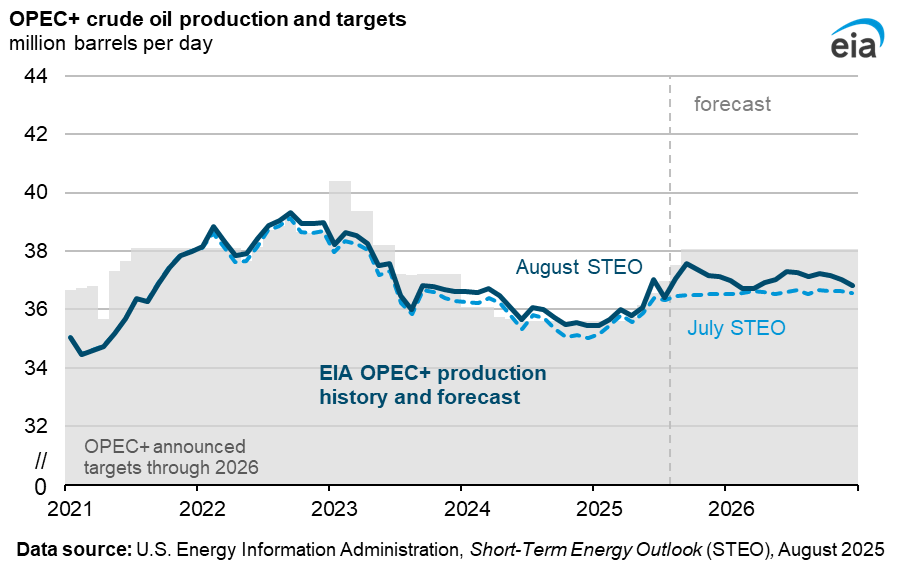
Increased output from OPEC+ as shown above is the reason for expected the oil stock build.

WTI is expected to average $48/b in 2026, oil rigs will go to the barn at that price.

Gasoline prices are expected to fall.

Diesel prices fall, but by less than gasoline due to higher refinery margins for diesel fuel in 2025 and 2026.

Very low distillate fuel stocks (below the 5 year range) lead to the higher refinery margins for distillate fuel.

Natural gas prices are expected to rise due to high demand for natural gas exported as LNG.


Natural gas output is relatively flat in 2025 and 2026 despite the high natural gas prices expected due to lower associated gas from tight oil plays as tight oil output declines due to low oil prices.


High demand from data centers and AI leads to a sharp rise in commercial electricity use, reaching the level of residential electricity consumption for the first time since 2001 (earliest date I have data for).

Coal output falls as coal power plants continue to close and plant stockpiles of coal are used rather than new production starting in 2025H2.

Coal exports are also expected to fall due to Chinese tariffs on US coal.

Note the World liquids stock build in 2025 and 2026.


US shale gas proved reserves were 393 TCF at the end of 2023, and cumulative shale gas wet output was 302 TCF from Jan 2000 to Dec 2023.

Exports of natural gas are expected to increase by 4.6 BCF/d from 2024 to 2026 and are likely to increase more in 2027 and 2028 as new LNG trains become operational in Louisiana and Texas.

The medium scenario above is my best guess for US shale gas with the low and high scenarios based on both USGS assessments of the F95 and F5 TRR for shale plays and the analysis of Patzek et al on various shale gas plays. Peak is in 2028 at 97.85 BCF/d (8.8 BCF/d higher than 2024). I expect there is a 90% probability that output will fall between the high and low scenarios with an equal chance that output will be higher or lower than the medium scenario.
87 responses to “Short Term Energy Outlook, August 2025”
US June oil Production At All Time High
US June production rose by 133 kb/d to 13,580 kb/d. The biggest gains came from NM and the GOM.
Thanks Ovi,
The August STEO has US C plus C reaching 13567 kb/d for a near term peak in December 2025, so we have surpassed that in June 2025 by 13 kb/d. I expect that we may start to see output decline fairly soon, possibly around September, if the price forecast in the August STEO is roughly correct (usually not the case.) WTI is expected to fall to $60/b by Sept 2025 and to $45/b by March 2026 (nominal US dollars). I expect we will see horizontal oil rig counts to continue to fall.
Kind of a bizarre EIA price prediction. They have it fishtailing way down, almost to the lower CI of the market-derived probability and then coming back up again.
Not even just low, but down and up. As if they could predict the gyrations.
https://www.eia.gov/outlooks/steo/images/Fig1.png
Futures 95% confidence interval and STEO prediction, futures price about $60/b in 2026, the futures market does not see the stock build anticipated by the EIA, the futures market is often wrong.
Uh…that was what I linked. Exactly.
Is this for the too lazy to click crowd, or did you not click the link yourself?
Do you have a point?
Yes see comments below comparing Futures prices from August 2014 STEO with actual futures prices from Jan 2013 to Dec 2015.
Yes to which?
You didn’t click my link? Or you did, but thought other might not?
three questions were asked, yes to the last, no I didn’t click link and yes chart presented for those like myself that don’t click every link presented.
Here is the 95% confidence interval from August 2014
Actual futures market prices from Jan 2013 to Dec 2015. Note that prices were 33% outside of the 95% confidence interval by late 2015.
Henry Hub natural gas futures 95% confidence interval and STEO reference forecast
1. Seems more reasonable. Basically in the middle of the CI, but with a slightly higher end point than market expectation. (Also matches with the idea of low crude price, from other graph…less ass-gas.)
2. Still not sure why we need EIA projections when we have literal betting markets giving the odds. I mean…are they also going to do alternate point spreads for sports betting?
3. And then why your baseline would be EIA projection versus futures.
P.s. And yes, there is massive uncertainty of each…that is the point of the CI (which is also derived from market information…there is more structure to the financial markets in commodities than just the futures strips, you also have fixed price contracts that you can speculate on, with explicit odds).
Why is it more reasonable? You assume futures markets are always right? That is obviously not the case.
Read the P.s. You are making a classic fallacy. The score of a football game (or a casino bet) may be dramatically different than the predicted outcome. But the market odds are still the odds. That’s like saying because they are not perfect predictors that an expert should be used instead of the Bayesian betting markets. Trying doing that at Vegas…over time. I’ll put my money on the market derived football point spread, not the DC point spread…or the EIA spread…or even Bill Belichik.
Note also, that an occasional deviation (reaching for summer 2014 instead of 2015, e.g.) during a time series does not invalidate the market odds. After all there are a lot of places you can pick from. After all, it’s a 90% CI. Meaning the market is actually predicting ten percent of the time, it will be above/below (5% each).
For that matter, the odds of some deviation, within a 2 year CI are different than for a specific month in the CI. They will necessarily be higher than for the particular month, since there are more swings at the apple (granted there is some autocorrelation, so they are not independent, but it’s still more swings at the apple). This is a subtlety though and not as important as the previous points!
“You assume futures markets are always right?”
No. Don’t put words in my mouth. “Always right” is not a probabilistic statement. Duh.
Nony,
If the distribution is a normal probability distribution then a 95% CI is 2 sigma, for the August 2014 STEO sigma is about $16/b, and a 3 sigma (99%) CI would have a lower bound of about $46/b, in Dec 2015 the futures price was about $37/b, significantly below the 99% CI. Futures markets don’t predict future prices very well that is the point.
Nony,
In any case I agree there is lots of uncertainty with future prices, generally prices are more than zero, as profits are pretty low when the price of a good is negative. So there is much larger upside than downside for oil prices. The 95% CI based on futures markets moves quite a bit over time.
see page 5 of link below
https://www.eia.gov/outlooks/archive/uncertainty/pdf/aug14_uncertainty.pdf
and
page 5 from following link 12 months later
https://www.eia.gov/outlooks/archive/uncertainty/pdf/aug15_uncertainty.pdf
The probability curves shift from month to month and predicting these shifts is impossible.
One more from 3 months later than previous link again page 5
https://www.eia.gov/outlooks/archive/uncertainty/pdf/nov15_uncertainty.pdf
One could easily imagine a range for oil prices between 5 and 300 dollars per barrel. So the middle of that CI (maybe a 99.999% CI) would be $152/b
link below covers EIA methodology for confidence intervals
https://www.eia.gov/outlooks/steo/special/pdf/2009_sp_05.pdf
Dennis
I agree that we are near the peak. Note that May was revised down from 13,488 kb/d to 13,447, down by 41 kb/d. Texas was revised down by 40 kb/d.
Has the April anomaly been corrected for Texas RRC?
GOM production (1.92 mmbopd) is at its highest level since October 2023. The new fields that have come on line this year and late last year have added 200 kbopd or more – Wilcox fields: Anchor, Whale, Shenandoah and Norphlet fields: Ballymore and Dover. Plus Miocene tieback: Southwest extension tying into Mad Dog 2(Argos), and LLOG’s Salamanca (Wilcox) set to come on later this year. Plus some smaller tiebacks.
Talos’s recently announced Daenerys discovery, the most highly touted GOM exploration well this year, has extended the prolific Southeast Green Canyon Miocene trend (which includes Mad Dog, Atlantis, Shenzi and Tahiti) into Walker Ridge to the south. It’ll be interesting to see if this results in some further discoveries.
Chevron’s exploration deal with Total should result in some interesting wells getting drilled over the next few years.
Exciting times, I say. The December Gulf sale should be interesting since it’s been 2 years since the last one, but, after that, with the twice-a-year Gulf-wide sale frequency that the Trump administration has reintroduced (they did this during Trump’s first term also), I think the sales will be rather ho-hum affairs.
Definitely hanging in there better than the naysayer on this site predicted. Can’t even blame that on the shale.
GOM centered 12 month average (CTMA)
It was in the 2015-2019 time frame. George Kaplan. Bottoms up, 40 color area chart field by field analysis. Big time skepticism of the EIA growth and predicting decline instead. As you can see from the chart, even with your smoothing the time series, this is when GOM grew, not declined.
After that, George took about a 3 year hiatus from posting and only once addressed his bad call afterwards and obliquely.
It’s not even that he just made a bad call. But that he scoffed at EIA…when they were on the money. And the “peak oil forum guy” was wrong.
It’s hard for anyone to analyze things. But the silliness of amateurs puffing themselves up and dissing the professionals, shows hubris.
Oh…and you can’t blame the shale!
But at least we got those “look fancy, but hard to actually get insight from” 40 color field by field area charts.
Nony,
What does shale have to do with this?
Dennis:
Are you being a sophist or dense? I’ll give you moral credit and assume density.
The point is that you can’t make the “nobody knew how shale might explode” excuse like you do for all failed “shale skeptic” predictions from 10-15 years ago, for Kaplan’s GOM pontification and laughing at EIA. (Duh.)
Nony,
No I just didn’t understand what the hell you were talking about. EIA did not get it right in AEO 2020, must have been the shale.
AEO 2020 prediction for Gulf of Mexico, in chart below. Mr. Kaplan’s last post on GOM was in 2020.
His estimate was too low and the EIA’s estimate was too high.
You can stick with the pros at the EIA (economists who know little about real world oil and gas geophysics). George Kaplan has oil field experience in the North Sea and Bob Meltz was a geologist for a major oil company operating in the GOM.
For 2024 GOM output the EIA’s AEO 2020 was about 500 kb/d too high and Mr. Kaplan’s medium scenario in 2020 was about 500 kb/d too low. Currently (AEO 2025) the EIA has revised its GOM forecast lower than the 2020 reference scenario in AEO2020.
Bob Meltz’s predictions from May 2022, yellow line is EIA prediction (AEO 2022) up to 2050 with tail a guess by Mr. Meltz.
https://peakoilbarrel.com/gulf-of-mexico-update/
https://oilprice.com/Energy/Energy-General/US-Deepwater-Production-Is-Set-for-a-Record-High-in-2026.html
2.2Million BOPD in GOA 2026
Sheng Wu,
That is 2.2 Mboepd, not the same as 2.2 Mbopd.
D C,
2.2 Million BOPD is my projection, given the low decline of legacy production in the deep water low API and GOR production.
and the Oilprice.com reporter/author probably had a typo.
here is a post I wrote about new record low API&GOR shale oil from China.
https://www.linkedin.com/pulse/new-record-low-gorapi-shale-oil-sheng-wu-gx2hc
EIA AEO 2025 projections for GOM
Bob Meltz: In the midst of schoolyard name-calling and political hissy-fits, you have supplied us with a very informative post that pertains to the subject at hand. Thank you very much! I have tried to pinpoint the location of that big Daenerys well but wasn’t sure I got it right. Isn’t this on the extreme end of the salt coalescence where all the feeder streams came together? If so, doesn’t that redraw the Walker’s Ridge geology and perhaps extend the prolific subsalt pooling? Do you happen to know the cost of drilling this well? And finally, this will be first GOM well to fit under the “all zones can be produced up the wellbore” rule in the OBBBA. Does that make it potentially more economical? It seems to me that this could really change the whole philosophy about further drilling in the subsalt formation.
Gerry,
The Daenerys well was drilled in Walker Ridge 107. Since I’m retired, I don’t have access to all the data to completely answer your questions, but I’m quite sure this well didn’t redefine the salt canopy in this part of the Gulf. That has been very well mapped out for years now.
One might ask why this well wasn’t drilled earlier. First of all, the lease that they drilled on was picked up in 2016. I suspect this prospect has benefited from the continuing improvements in seismic data quality, allowing Talos to better define a subsalt structure. Once Talos convinced themselves they have a viable subsalt structure, (and note – when they picked up the lease, they may not have known that) then they started looking at the reservoir risk – would they encounter enough Miocene sands to make it worth their efforts? Their geologists and stratigraphers, I’m sure, looked at all the offset well control and predicted a range of reservoir outcomes at the location – everything from very little sand, to a lot. And then you have to just drill the well. I don’t know the well cost.
The success of this well extends the very prolific subsalt Miocene trend from southeast Green Canyon into Walker Ridge.
The commingling issue you mentioned will mainly benefit Wilcox fields where the reservoirs are much thicker (but lower perm) but differential pressures between different reservoir lobes can be much greater. I don’t know enough about it to say what the impact of that will be.
Very informative. Thank you for illuminating this exciting well.
On a prospect my partners and I are trying to get going–onshore Vicksburg Trend–it still seems difficult to delineate the salt, especially “turtle” structures in the so-called “salt basin” of the embayment.
I suppose this is one reason why so many people fled to the shale basins: they knew they would make a good enough well to recover most of their money.
It seems that one could drill in Walker Ridge lining up the seismic features and increase GOM production significantly. If prices ever rebound, that is.
Thank you Bob and Gerry,
Any change to best guess (mid-case) scenario for GOM based on the latest information?
Dennis,
Cumulative GOM oil production through 2024 (1947-2024) is 25.3 BBO. My midcase EUR is 37 BBO. There will very likely be months where production exceeds 2 mmbopd, but I don’t have any annual production over that, in my mid case.
In my mid-case, alot of the stuff we have been discussing is already baked in, such as the mid-case production from fields like Whale, Anchor, Ballymore, Shenandoah and Salamanca.
In my high-side case I have the EUR at 42 BBO and there are a few years where annual production averages over 2 mmbopd.
If more significant discoveries get made, say over 200 mmbo ultimate recovery, the more likely we may be looking at an EUR between my mid-case and high-case. It’s too early to say if Daenerys meets this threshold.
Bob,
Thanks for the update.
Proved reserves plus cumulative C plus C output for GOM was about 28.7 Gb at the end of 2023. If we assume 2P reserves are 1.5 times proved reserves then cumulative output plus 2P reserves at the end of 2023 is about 31 Gb. So Bob’s 3 scenarios have 2 to 10 Gb of new resources added to 2023 production and 2P reserves with mid case at about 5 Gb of added resources over time.
Note that the BOEM has undiscovered TRR of 30 Gb at the end of 2018 for GOM, perhaps 60% of this will be economic so maybe a total URR of 44 Gb if the TRR estimate is accurate. This coincides roughly with Bob’s high case.
Rig Report for the Week Ending August 29
The rig count drop that started in early April when 450 rigs were operating held steady this week. The last four weeks was unchanged
– US Hz oil rigs were unchanged at 363, down 87 since April 2025 when it was 450. The rig count is down 20% since April 2025.
– New Mexico rigs were unchanged at 81 while Texas added 2 to 184.
– Texas Permian was unchanged at 148. Midland was unchanged at 21 while Martin dropped 2 to 17. Glasscock added 2 to 8.
– In New Mexico Eddy and Lea were unchanged at 32 and 48 respectively. Lea has added 12 rigs over the last 12 weeks. Over the same period Eddy has dropped 12 rigs.
– Eagle Ford added 1 to 29.
– NG Hz rigs dropped by 3 to 105.
Frac Spread Report for the Week Ending August 29
The frac spread count dropped by 3 to 162, a new recent low. It is also down 60 from one year ago and down by 53 spreads since March 28.
US$ 48 WTI in 2026?
The clock is ticking.
From a website of the Iranian opposition:
28 Aug 2025
Britain, France and Germany on Thursday triggered a 30-day process – the so-called “snapback” mechanism – to reimpose UN sanctions on Iran over its nuclear program in a formal letter sent the UN Security Council. Iran condemned the European sanctions move as malicious and illegal but stopped short of mentioning specific consequences and instead warned of an “appropriate response.”
Just before the European move, another ultraconservative member of the parliamentary committee Alaeddin Boroujerdi mooted blocking the energy exports of its Arab neighbors if sanctions choked off its own flows.
“If Iran cannot export its oil, certainly something will happen that will stop the exporting of others’ oil,” Tehran’s leading economic daily Donya-ye Eghtesad quoted him as saying. “We won’t sit and watch the compromising of all of our interests.”
The threat has been repeatedly voiced by various Iranian politicians, including former presidents Akbar Hashemi Rafsanjani and Hassan Rouhani, since the mid-1980s when Iran first attempted to close the Strait of Hormuz.
https://www.iranintl.com/en/202508288528
Matt Mushalik does it again… uses Peak Oil to explain the world. Who woulda thunk it?
Russia Uncovers 511 Billion Barrels of Oil Beneath Antarctica: A Find That Could End the Continent’s Era of Peaceful Use https://indiandefencereview.com/russia-uncovers-511-billion-barrels-of-oil-beneath-antarctica-a-find-that-could-end-the-continents-era-of-peaceful-use/
https://www.energy-reporters.com/news/its-more-than-all-the-oil-ever-extracted-from-earth-russian-discovery-sparks-global-uproar-as-energy-powers-clash-over-control/
Drill Ivan Drill
If it is a ship which operated in 2019, it is simply a hoax. To define the contours of an oil field, several months or years of seismic surveys and exploratory drilling are necessary. Here, it must be done in an environment where the southern summer lasts 2 or 3 months per year, with no guarantee that the explored area is free of pack ice/icebergs. I am not even talking about the absurdity of installing an oil platform or an FPSO in a region teeming with pack ice and especially icebergs, some of which, the tabular icebergs, can be kilometers or tens of kilometers in size. That”s simply Russian propaganda for dumb people.
Regarding this Antarctic potential: This story has been around for at least a year. I’ve never been able to confirm that any wells have actually been drilled. At best, they have acquired some seismic data and identified a prospective structural feature. Maybe they have also acquired some seafloor seep data. But, as Jean says, it is probably “Russian propaganda for dumb people.”
Thompson needs constant attention that is why he posts lots of stupid things so people reply.
https://www.helpguide.org/mental-health/personality-disorders/narcissistic-personality-disorder
Any attention is better than none
Is that all you have IVER, a strawman? what will I be next, a Jew? or an anti-Semite? Ahhh, but I haven’t been infected with your China/Russia propaganda and that’s the problem for you isn’t it. I don’t run around waving your flag, therefore I must be stupid. Well unfortunately for your propaganda, Russia is a leading oil and Gas producer on the planet, and does it cheaply, because it’s conventional oil. They also have the largest fleet of icebreakers, and if America needs one, they have to rent it off the Russians lol. If anyone is poised to extract oil from Antarctica it’s them. All inconvenient facts that don’t align with the Russia is a hollow shell belief.
US, EU still rely on Russian energy and commodities 3 years into Ukraine war
https://economictimes.indiatimes.com/industry/energy/oil-gas/et-graphics-us-eu-still-rely-on-russian-energy-and-commodities-3-years-into-ukraine-war/articleshow/123149401.cms?from=mdr
You clearly can’t survive without them.
Nobody is poised to extract oil from Antarctica, except in an imaginary world. Facts are hard : ice breakers can do nothing against kilometers sized icebergs. Perhaps, some supernatural intervention might help Russia divert icebergs away from oil rigs and other FPSOs to prevent them from being smashed and sunk by icebergs, but we’re supposed to deal with real-world elements. Speaking of the oil supply of Europe,I would like to inform you that in Europe we have no problems with the supply of oil and oil products, unlike what is currently happening in some regions of Russia.
Nobody is poised to extract oil from Antarctica, except in an imaginary world. Facts are hard.–
And man will never fly because he’s heavier than air hey.
You seem to forget that the ice is melting JEAN, and that Russia is already drilling offshore in the arctic.
–Russia’s biggest oil company announces more offshore Arctic drilling– 2019
https://www.thebarentsobserver.com/industry-and-energy/russias-biggest-oil-company-announces-more-offshore-arctic-drilling/137925
I know you are full of angst against Evil Putin, but don’t let that color your basic scientific thinking processes. Elon Musk wants a human colony on Mars. Drilling antarctic oil would be a walk in the park compared to that. Perhaps they can go Horizontal off the stable land? Who knows what future technologies will be devised. But my post above simply pointed to the fact they had found formations they identified as oil, no extraction claims. You are getting way ahead of the game.
As for “in Europe we have no problems with the supply of oil and oil products”
I have no doubt. All the people that can still afford it are getting all they want. That’s how the system works, we just pretend all those other people slipping into poverty don’t exist.
“To avoid shortages, France implemented a “sobriety plan” with the aim of lowering total energy consumption by 10% within two years. France’s experience is instructive for other countries considering how to manage high energy prices” Sobriety, voluntary poverty lol.
@Thompson : Yes, Russia is exploiting (but not only) an off shore platform in the Arctic Sea : they look like a medieval castle (a lot of investments) and they have only the ice pack to face, not an ocean full of icebergs. When you are speaking of ”melting”, in Antarctica it means the calving of more and more icebergs. And the freshening of the ocean upper layers with the increased supply of fresh water from the increasing calving of icebergs will facilitate the freezing of the sea. In fact, this is already happening. It is unlikely that we will see the disappearance of the Antarctic ice sheet in the near future. We will stop using oil before then. Concerning the plan to reduce energy consumption by 10% in two years; it dates from 2022 and it was concerning the consumption of electricity during winter. Thanks to the active help of a mild winter in a context of global warming, this project was succesful.
China electricity usage in July surpassed 1T KWH, or close to 700 KWH per capita.
The short term plan is to lower the price per KWH from 40~60 cents RMB to 20~25 cents by 2030.
The long term goal is to lower to 10 cents RMB per KWH, almost free.
China’s PV export this year will be 235GW and the electricity generated will be equivalent to 735 million BO, or >2Million BOPD. And another 250GW installed domestically, total equivalent to 4.5 million BOPD.
China’s growth in Solar over the last few months….
May 2025: 92.92 GW
June 2025: 14.36 GW
July 2025: 11.04 GW
From China’s National Energy Administration (NEA).
The free ride of guaranteed subsidies for solar installations finished at the end of May. Installations after that date have to compete with other forms of electricity on the wholesale market. I’d suggest that there was a lag in completions and some didn’t get installed in time, so would expect the current downward trend to continue until some new subsidies turn up..
There should be some really cheap solar panels for sale for the rest of the world in the months ahead (except high tariff countries) as sales in China have certainly plummeted…
Hideaway,
Those are interesting figures for China Solar Installed Capacity for June & July. I also heard that China is now shutting in a larger percentage of Solar Power vs the same period last year.
To me… China is setting itself for a BIG DISASTER. Why? They became a High-Tech Metropolis in basically 25 years, which it took the USA about 75-100.
So, what GOES UP that Fast and that Large, typically comes down the same fashion.
steve
The central government in China gives provinces GDP growth goals, and these goals drive provincial policies encouraging or discouraging certain investments. The provinces are usually oriented towards their own economies and in competition with other provinces. They also tend to jump on the same bandwagon. This explains a lot of the oddities of Chinese investments, especially the wild overinvestment in certain industries.
The collapse of the real estate market in China has driven policy makers to invest heavily in industrial production. The central government strongly backs what it sees as future technologies. So solar and EVs, among others, have gotten huge investments in recent years as capital flees real estate.
Overcapacity in certain sectors has led to brutal price wars. Weaker players are likely to fail, but often have provincial government backing to keep them alive longer than you might expect.
China continues to underpay workers and suppress domestic demand, so this excess capacity (and the price war that comes with it) is flooding international markets. So brace yourself for very cheap solar, batteries, and EVs in coming years. China produces more EVs than America produces cars.
It isn’t just “new energy” products. Something similar is happening all across the electronics industry. It’s important to keep in mind that production at this scale, even if unprofitable, improves products. Chinese universities are producing ten times as many engineers a year as America. They may not all be geniuses, but they are improving Chinese products and production techniques step by step. Nobody else in even close.
From NoviLabs, interesting post on Vaca Muerta shale:
https://www.linkedin.com/posts/jorge-garzon-ph-d-00633672_some-argentinas-shale-wells-are-outperforming-activity-7366527832912486400-eVLQ/
1. Doing over 0.5 MM bopd now as a field. (I mentally think of that as “half a Bakken”.)
2. Wells are similar to the Permian, doing 0.2MM in year one–one operator had 0.5MM/well first year. (Those are not EURs, those are first year cums.)
Net/net: I have a hard time crediting the scarcity pushers of peak oil, given the possibility of U.S. shale being done in other countries. Sure…they don’t have the expertise or legal structures we do. But that’s a lot less of a limiter than “it just ain’t in the ground”.
The Vaca Muerta has taken a while, but is coming into its own now. First significant shale play outside of USA (and Canada). Sort of indicates the possibilities for development in the next few decades in ROW. After all geologically there’s nothing magic about the political borders on the map. The Eagle Ford for instance extends into Mexico.
Anonymous,
You stated, regarding Vaca Muerta and World Shale: “Net/net: I have a hard time crediting the scarcity pushers of peak oil, given the possibility of U.S. shale being done in other countries.”
While it is true that Vaca Muerta shale oil production will continue to grow, it is essentially replacing the past depletion of conventional oil production. According to the Deloitte Report on Vaca Muerta, production is expected to reach the previous high of Argentina’s production in 2004.
Unfortunately, numerous negative environmental and economic costs are associated with Shale Production, which we are beginning to learn about through toxic wastewater, earthquake activity, and potential widespread groundwater contamination. This does not consider the cost of capping the 100,000 shale oil & gas wells in the future.
So, Shale is really going to save the DAY??? If we consider the Human Species’ time on this earth, Shale Energy will represent a GNAT’s existence, especially when we realize the Neanderthals lasted over 300,000 years through several large climate events.
The world has hit PEAK NET ENERGY even though overall liquids production, especially NGLS, will continue to increase. But, watch out for that Massive Debt Black Hole propping it all up.
steve
Like I said, those hurdles are a lot less daunting than it not just being in the ground. (Especially when you consider how policies can change or expertise improve with decades of implementation.) Recall how Hubbert did his 1956 paper. It was about geological constraints, not regulatory.
As far as a couple generations further on, running out of crude. OK, maybe. But that’s a lot less ominous than the stuff that the peak oilers were pushing. I guess that’s why TOD and ASPO are tits up, in the ditch.
SRSROCCO
Drinkable groundwater is used from various depths, but for the United States, the median depth of domestic-supply wells is 142 feet, and for public-supply wells, it’s 202 feet. The actual depth varies significantly by location. The oil industry does not contaminate this water. Fracking is done a mile deeper or more.
In the US, the extremely salty and chemical laden water comes up from a mile deep or more with the oil [it is contaminated water now, and has been for thousands of years before they started fracking for oil (fracking does not cause the contamination)]. The drillers have to pump this water back into the ground. US citizens do not get to do anything else with it.
You can try this experiment if you would like. On earth, if you put water on the topsoil, gravity and porosity causes it to sink into the ground. Unless you are in an area that has Geysers, like Yellowstone Park, water generally does not rise up from a mile or two underground. There probably is a minister someplace who claims he can do it, but it is highly doubtfull.
Peak Energy???? Relax. We have barely scratched the surface of nuclear energy. Beleive it or not, but in the US we have expanded into something that is called “AI” which will help speed this transition forward. Goodnight
MAILDOG
This is misleading and wrong.
The oil industry in the US causes both direct and less direct impacts to surface waters and drinking groundwater. Direct impacts come from spill of oil or refined products. Think pipelines, USTs, etc. An issue for many decades.
Media reports fracking wastewater used on roadways in PA.
Texas governor just signed a law allowing companies to sell fracking wastewater for reuse. Media is reporting that this would allow surface discharge into waterways or for agricultural uses. Side question: does anyone have a good way to ID the source of food at your local grocery store?
There are also less direct impacts to drinking water. Fossil fuels cause climate change. Indisputable. Attribution for any single event is admittedly less clear. However, severe events like Helene and much more routine storms cause inland flooding that regularly contaminate private drinking water wells.
MAILDOG, – The oil industry does not contaminate this water.
I wish people would think before posting up random opinion.
it only takes one case to disprove this. Here are two.
— It took nearly a decade, but former EPA scientist Dominic DiGiulio has proved that fracking has polluted groundwater in Wyoming
https://www.scientificamerican.com/article/fracking-can-contaminate-drinking-water/
— 2025 — EPA has found scientific evidence that activities in the hydraulic fracturing water cycle can impact drinking water resources under some circumstances.
https://www.epa.gov/hfstudy/questions-and-answers-about-epas-hydraulic-fracturing-drinking-water-assessment
Q: Have you found scientific evidence that hydraulic fracturing can impact drinking water resources?
A: Yes. EPA has found scientific evidence that activities in the hydraulic fracturing water cycle can impact drinking water resources under some circumstances. Impacts can range in frequency and severity, depending on the combination of hydraulic fracturing water cycle activities and local- or regional-scale factors. The following combinations of activities and factors are more likely than others to result in more frequent or more severe impacts:
Water withdrawals for hydraulic fracturing in times or areas of low water availability, particularly in areas with limited or declining groundwater resources;
Spills during the management of hydraulic fracturing fluids and chemicals or produced water that result in large volumes or high concentrations of chemicals reaching groundwater resources;
Injection of hydraulic fracturing fluids into wells with inadequate mechanical integrity, allowing gases or liquids to move to groundwater resources;
Injection of hydraulic fracturing fluids directly into groundwater resources;
Discharge of inadequately treated hydraulic fracturing wastewater to surface water resources; and,
Disposal or storage of hydraulic fracturing wastewater in unlined pits, resulting in contamination of groundwater resources.
Goodnight.
Why don’t you guys write about how the airline industry causes passenger deaths?? And, then try to shut that down? The food industry produces contaminated food that kills people. You should want to shut that down also. The railroad industry can cause extreme environmental damages when there is a derailment of sensitive cargos. Shut that down. Same with the construction industry, the shipping industry, etc., — well virtually every industry. Let’s go back to the stone age and stop all of this pollution. Landfills accross the world are filed with environmental hazards. What is wrong with you guys?? It is likely that the auto industry kills more people in one year than the oil industry has in its history. Toxic used wind turbine blades have to be burried in a Montana landfill, and they will never degrade. As my dad would say – Wake UP!
MAILDOG
Yes, you make some decent points about cost vs benefit tradeoffs for our industrial world. However, that is beside the point. You were simply making factually incorrect statements.
Are you familiar with groundwater flow in porous and fractured materials? An expert on contaminant fate and transport? Aware of how MCLs are set? Or perhaps how various contaminants have evolved from having no defined MCL to the current state?
You don’t know what you are talking about.
Thompson,
I realize that it would be a futile attempt to sway any hard core ideologues on this issue of ‘harm’ caused by frac’ing.
That said, your link to the 2015 Obama-led EPA study on the effects of the entire frac’ing cycle to ground water is a highly enlightening case study on many levels and a must read for any serious (open minded) student in these matters.
At about 1,200 pages long (summary version was half as lengthy, IIRC), this was actually a compilation/analysis of about 1,000 other studies/reports covering close to a million frac’ing events spanning decades.
Only 3 – count ’em – 3 cases were deemed suspect in the contamination of nearby wells … Dimmock, PA, Pavillion, WY, and Parker county, TX.
All three instances were subsequently found to have no causal role for despoilation via frac’ing, although ‘he said/she said’ studies continue to spark controversy in these cases.
Bottom line, Thompson, is that this multi year long campaign to demonize the ‘Shale Revolution’ has been fueled by emotionally charged, fact free calumnies designed to enrage an audience with a seemingly atavistic loathing to anything hydrocarbon related.
World renowned petroleum engineer Sean Lennon and his tech savvy mother – Yoko Ono – are great examples of this with their production of the epic ballad “Don’t Frack My Mother”.
Sheesh.
Thanks Coffee!
I don’t know where NOVI got the data for VM, the first line is totally out of nowhere.
you could check the real data from here,
https://app.powerbi.com/view?r=eyJrIjoiNDQ1OGQ4MGMtYmQyYi00NzYxLWFlNTMtOGI0ZjRhZGE4NTBkIiwidCI6IjVmMThiN2ZhLTdmMmQtNDQ5ZC1hZjhkLTliZTNiM2ViZmFhYSJ9
or visit official government report,
The first one should be BPE, and they have 3 wells out of 12 reaching 1 million barrel this year, or ~ 3 years IP.
The emphasize here is really not about higher IP, but rather slower decline that result in much higher EUR.
Note that the BPE has the same low API and GOR as China’s best shale field in Shengli, and I have this story from IMAGE meeting this past week,
https://www.linkedin.com/pulse/new-record-low-gorapi-shale-oil-sheng-wu-gx2hc
there is also an exceptional lateral BPO2801 in the BPO block immediately next to BPE with low GOR (~300scf/bbl) and API (~33deg), and it reached the max IP after 7 months TIL to ~5KBOPD. The lateral length of this well is only ~1kilo meters, and produced over 1.1million barrel in a year, and still producing 2,500BOPD right now, setting a record in Argentina petro production history, including all past conventional wells.
All the slower decline is a result of the heavier components in the hypersaline lacustrine shale oil. The behavior is also repeated in the only lacustrine shale basin in US, Uinta, and also in several hyper saline lacustrine shale basins in China. The heavier the oil and lower GOR just got better EUR. I am the first in the industry to note this back in 2023 and gave a model explaining why and proposed using isotope to the lower limit maturity. In China, as well as in earlier VM, the currently most productive block are assigned as immature, and there is no hope to produce. But, I logged the wells in China lacustrine Permian back in 2021, and noticed that the Permian in Jimusaer, China has the same isotope maturity as the Permian in US NM, i.e. ~0.9, and yet the China Lacustrine Permian has API of 21deg, and GOR only 50scf/bbl.
With this new map, one could see VM has TRR oil almost 3x to 5X. The best gas wells is also not the dry gas wells, but rather the wet gas and condensate wells. So, the 3rd best block is actually Pluspetrol’s LaC with GOR around 2:1 BOE. Note that Exxon’s 2nd best block was sold to Plustpetrol early this year.
Hey DC, have you been following the latest on the renewed discussion about the Constitution gas pipeline?
https://www.canarymedia.com/articles/fossil-fuels/constitution-pipeline-zeldin-energy-prices
T Hill,
Interesting article, thanks.
Excerpt from article linked by T Hill (link repeated below):
https://www.canarymedia.com/articles/fossil-fuels/constitution-pipeline-zeldin-energy-prices
Piping more gas up from Pennsylvania’s ample supplies could seem like an economically sensible way to bolster the grid in light of these facts. The reality is far more complicated, however, say advocates and experts.
The major problem is that the pipeline wouldn’t actually bring much, if any, new gas into New England, Dolan said. The Constitution pipeline would terminate in Schoharie County, New York, where it would connect to pipes that already carry gas into New England. That existing infrastructure is the true bottleneck, he said.
The pipes into and around New England are “narrow and limited,” so bringing a higher volume of gas into New York doesn’t mean more can flow throughout the neighboring region. There are no plans in the works to alleviate those constraints, and the models for funding such projects make it highly unlikely there will be any proposals for pipelines into or within New England in the near future, Dolan said.
“I am not aware of any large-scale gas supply projects into New England today,” he said. “Until there is a way to increase that, I struggle to see how Constitution changes anything meaningful for us.”
In short, pipelines are also needed from New York to New England, the Constitution pipeline gets gas to New York, but Natural Gas pipeline capacity from New York to New England is limited.
Dennis,
That was a little bit of an odd article seeming to downplay the significance of the extra ~650 MMcfd that the Constitution would provide to the northeast pipeline system.
The pipeline pressure entering Connecticut is rated at 1,440 psi. During high demand/extreme cold snaps, the draw on that line pressure strains the abilities of the compressors to keep up if the supply is not adequate.
The Constitution (and the NESE, also) will ensure sufficient supply is ‘in the pipes’ when these precarious situations arise.
Coffeeguyzz,
The point is pretty simple, the capacity of pipelines to New England is limited, extra gas at the end of the pipe does not get any more gas to New England unless pipeline capacity within New England expands. No projects are currently underway to accomplish that. It would reduce prices in New York perhaps, though it is not clear that there is any shortage of gas availability in New York State.
DC: “. . . . it is not clear that there is any shortage of gas availability in New York State.”
With all respect, this is astoundingly naive.
Mr. Maddoux,
As usual, great to see your always-informed comments on this site.
Gotta cut Dennis some slack, methinks, as his exposure to the Gas World has been a bit limited. Hopefully that may change as the prominence of natural gas continues to blossom into the wider consciousness.
You may find it of interest what emerged from last week’s DUG Appalachia get together in Pittsburgh.
Amongst other statements, the CEO of Huntley and Huntley (just sold off Olympus to EQT for ~$2 billion) described H&H’s few Deep Utica wells as having ‘smoking’ rate of returns compared to the overlaying Marcellus wells on the same pads.
I have described the productions as Utica dwarfing the shallower Marcellus on the few dozen pads where both Marcellus and Utica/Point Pleasant have been developed.
This guy also said he is starting a new company targeting both Tier 2 Marcellus and Deep Utica wells exclusively.
We may see 50 Bcfd output from the AB in the not-too-distant future.
Gerry,
The news I see tends to focus on lack of gas in New England, is this also the case in New York, currently?
You are correct that there are also capacity constraints in New York State especially during cold snaps in Winter, I had thought this was mostly a problem in New England as New York State has blocked pipeline expansion projects in the past, but it seems that is not correct.
Hey DC
There are a couple of decent sources to review if you wanted to dive further into the details.
The 2024 NY ISO Reliability Needs Assessment forecasts 10-year horizon “…finds that the planned New York grid will meet the statewide resource adequacy criterion throughout the ten-year horizon for the base case assumptions.” However, it also notes that “as New York becomes a winter-peaking system, the gas supply to electric generation plants is expected to be strained.”
https://www.nyiso.com/documents/20142/2248793/2024-RNA-Report.pdf/0fe6fd1e-0f28-0332-3e80-28bea71a2344
NYSERDA’s 2024 Patterns and Trends : New York State Energy Profile also provides some useful background.
https://www.nyserda.ny.gov/About/Publications/Energy-Analysis-Reports-and-Studies/Patterns-and-Trends
From Chat GPT summary on following question:
“will constitution pipeline increase gas availability or reduce natural gas prices in New England?”
Bottom Line
The Constitution Pipeline likely won’t materially improve gas delivery into New England or consistently reduce energy prices—especially during high-demand periods.
In certain situations (e.g., off-peak), modest price benefits might materialize, but these gains are not guaranteed and depend heavily on other infrastructure improvements and market dynamics.
Structural constraints, political uncertainty, and clean-energy policy trends all pose serious challenges to its effectiveness and future.
Dennis,
As we now enter into this New Age of ‘Chatbot Reality’ (something with which I am highly impressed and strongly encourage one and all to engage with great vigor), one must exercise a bit of caution before throwing oneself 100% into the church pews of Belief as the Great Oracle puts forth info that is not quite entirely reliable.
I actually spent some time interacting with our new chatbot buddy after reading that linked article re the Constitution. The amount of data quickly retrieved is simply stunning … pipeline pressures, various locales of all the New England interconnects, capacities, etc.
However, some ‘deeper’ digging might give you a broader understanding of the current situation and why the extra 650/250 MMcfd available via Constitution/NESE certainly WILL positively impact you good folks … and ol’ chatbot should tell you so.
Ask what an OFA (Operational Flow Order/Operational Alert) is and how often do they kick in during high demand/restricted supply cold snaps in New England.
Ask if the max pipeline capacity (unchangeable) is UNDER utilized when OFAs are issued.
Hint, regularly as damage can ensue if supply pipeline pressure is too low for the compressors to properly function.
The marginal cost skyrockets during these events.
Adequate upstream supply might eliminate this situation significantly (completely?) if/when expanded downstream compression – already planned – comes onto play with the anticipated enhanced supply.
Ask our new info God about this stuff and see if’n you have a change of mind.
Coffeeguyzz,
Extra gas might help a bit, New York seems to need more supply in any case. Not clear the investment in this capacity is profitable if there is a lack of flow through to New England or upstate New York to utilize the excess capacity. Are there adequate storage facilities in New York or New England to store the gas? If not and there is not adequate total flow through the new pipeline then the investment does not pay out. There are a lot of moving parts here and I don’t have the answer. Different experts often reach different conclusions to such questions.
Note that increased compression capacity is a part of expanding pipeline capacity, I imagine the compressors are designed for a given flow rate which is limited by the size of the pipe.
Maybe more gas helps somewhere, but without increased pipeline throughput to new England, it doesn’t help New England much.
“Canary Media” and “Clean energy journalism for a cooler tomorrow”. Right on the banner. Shows you to expect a biased report.
These are the same type of people who were pushing Hughes and Berman 10-15 years ago with all the comments that shale gas would never amount to anything. How nice that they are watching out for Williams and trying to prevent them from making a bad investment. Yeah…sure.
Interesting piece at EIA entitled Ten counties in the Permian Basin account for 93% of U.S. oil production growth since 2020
see link below
https://www.eia.gov/todayinenergy/detail.php?id=66025
Dennis
There will be reports on 9 of those 10 counties in the upcoming June US oil production report on Thursday. There is no report for Andrews. There is a report for Reeves county which currently is rated #4 in Texas.
As I perused the above comments this morning I was impressed by how everyone (me included) is becoming enthralled by the speed and accuracy of AI. Therein lies a warning: it is said that we will reach “technological singularity” within 2,000 days. What that means is that machine learning and processing via deep neural networks will advance so rapidly that the answers and solutions given by AI will be on par with those given by PhD’s and MD’s and even Nobel laureates. This scares me. Take energy, which is our subject of study.
The IEA began in 1974, in response to the oil embargo of 1973 (facts courtesy of AI). It was a fairly small, responsible group of analysts financed by countries and oil and gas companies. Within a few years, even the Saudis listened to their forecasts. Despite humble beginnings, the IEA grew like a weed and is now housed in an elite office tower in Paris that is worth a fortune. In other words, the IEA grew nicely from capitalism, despite rendering predictions wildly influenced by leftwing politics. The Saudis stopped listening to them two years ago and now OPEC hires their own people. The IEA “learned” from their financial masters what to say, and the “deep neural networks” over there processed it so heavily that they believed it. Because of this, there is a dichotomy of roughly 2 mbpd between world crude demand estimates of the IEA and the geniuses counseling the Saudis. But the IEA and the Saudis (OPEC) are bound by one common principle: they both use artificial intelligence with machine learning and deep neural networks.
Therein lies the rub. If artificial intelligence reaches technological singularity with humans, it will also learn the principles of charismatic guile and Machiavellian deception. When I cautiously ask the AI robot a question having to do with geopolitical issues surrounding oil and gas I can already detect a developing bias. (Is George Soros running this thing?) By the time AI reaches singularity I guarantee the robot will have the mind of a wind turbine, the heart of a solar panel, and the soul of a Tesla driver (no offense intended, Dennis).
” (facts courtesy of AI) ”
Well, no. The facts are the facts, and they are out there. “AI” simply gleaned them for you. The hyperbole around these machines is simply ridiculous.
True, but the corporations engaged have the potential to make enormous profits, as great as even from the EV transition before it collapsed. It’s these financial bubbles that power the economy forward.
An updated report on June US Oil Production has been posted
https://peakoilbarrel.com/june-us-oil-production-new-high/
A new Open Thread Non-Petroleum has been posted.
https://peakoilbarrel.com/open-thread-non-petroleum-september-4-2025/