By Ovi
The focus of this post is an overview of World oil production along with a more detailed review of the top 11 Non-OPEC oil producing countries. OPEC production is covered in a separate post.
Below are a number of Crude plus Condensate (C + C) production charts, usually shortened to “oil”, for the oil producing countries. The charts are created from data provided by the EIA’s International Energy Statistics and are updated to March 2025. This is the latest and most detailed/complete World oil production information available. Information from other sources such as OPEC, the STEO and country specific sites such as Brazil, Norway, Mexico, Argentina and China is used to provide a short term outlook.

World March oil production increased by 1,063 kb/d to 83,580 kb/d, green graph. The February World oil production projection did a reasonable job in projecting this large increase. Its projection was an increase of 972 kb/d to 83,403kb/d. The largest increases came from the US, 248 kb/d, Saudi Arabia, 250 kb/d and Canada, 267 kb/d.
This chart also projects World C + C production out to December 2026. It uses the June 2025 STEO report along with the International Energy Statistics to make the projection.
For December 2026, production is projected to be 84,136 b/d. The December 2026 oil production is lower than the November 2018 peak by 456 kb/d. Also the increase from April 2025 to December 2026 is 1,054 kb/d. Since OPEC is supposed to unwind all of its 2,200 kb/d of production before the year end, it seems that 1,146 kb/d of OPEC production is missing. Where did it go?
Production from November 2025 to December 2026 appears to be on a plateau at close to 84,000 kb/d.
Average production for the year 2018 was 82,930 kb/d. Average production for the year 2026 is projected to be 83,979 kb/d, higher than 2018. However peak month still appears to be November 2018, 84,592 kb/d
I am questioning whether the Saudi Arabia’s monthly increase of 250 kb/d reported by the EIA is real. See next table.

This table compares the MOMR SA crude production with the EIA’s July’s report. SA crude production is essentially flat up to April according to the MOMR. The first significant increase occurs in May. I have also checked the July STEO. It also shows the 250 kb/d increase in March but then drops 200 kb/d in April.
I have sent an email to the EIA requesting a clarification.

March’s World oil output without the US increased by 814 kb/d to 70,092 kb/d. April production is expected to decrease by 479 kb/d to 69,613 kb/d.
The STEO is forecasting that December 2026 crude output will be 70,885 kb/d. Note that the December 2026 output is 1,800 kb/d lower than the November 2018 peak of 72,685 kb/d.
World oil production W/O the U.S. from March 2025 to December 2026 is forecast to increase by a total of 793 kb/d.
A Different Perspective on World Oil Production

March’s Big 3 oil production increased by 498 kb/d to 32,603 kb/d. Production in March was 1,407 kb/d lower than the September 2022 post pandemic high of 34,010 kb/d. OPEC has announced it will start increasing production in April so the 1,407 kb/d drop should start to get smaller.

Production in the Remaining countries had been slowly increasing since the September 2020 low of 42,970 kb/d to December 2023. Production has risen for the last six months and output in March increased by 564 kb/d to 50,977 kb/d and is now higher than December 2023. The increased production came from Canada, China and Brazil.
Countries Expected to Grow Oil Production
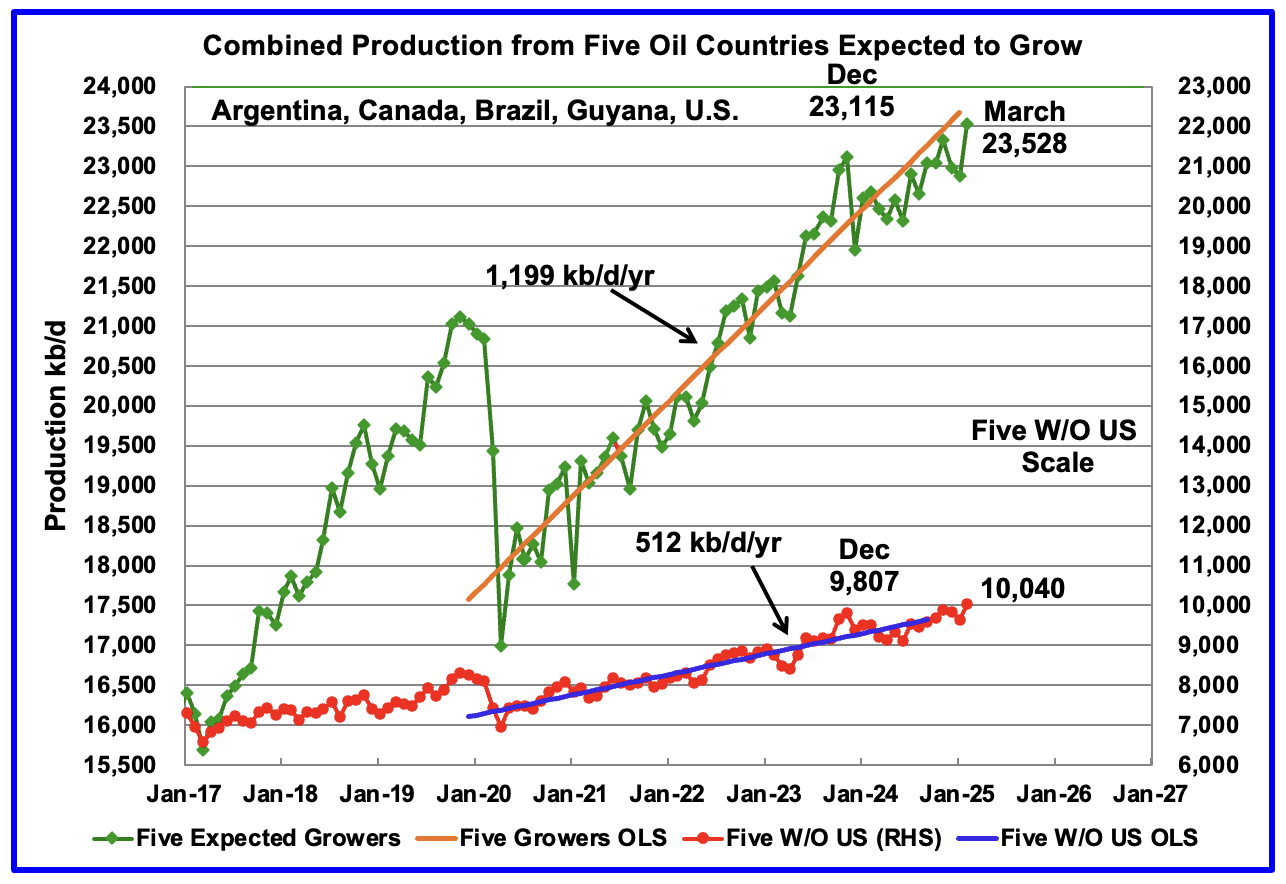
This chart was first posted a number of months back and shows the combined oil production from five Non-OPEC countries, Argentina, Brazil, Canada, Guyana and the U.S., whose oil production is expected to grow. These five countries are often cited by OPEC and the IEA for being capable of meeting the increasing World oil demand for next year. For these five countries, production from April 2020 to August 2024 rose at an average rate of 1,199 kb/d/year as shown by the orange OLS line.
To show the impact of US growth over the past 5 years, U.S. production was removed from the five countries and that graph is shown in red. The production growth slope for the remaining four countries has been reduced by 687 kb/d/yr to 512 kb/d/yr.
March production has been added to the five growers chart, up 651 kb/d kb/d to 23,528 kb/d. For the Five growers W/O U.S. January production rose to 10,040 kb/d, up 113 kb/d from February 2025 and is at a new high.
The OLS lines have not been updated and will not be updated going forward unless additional production data provides a strong indication that production is rising/changing. However this month’s production increase from Canada, Brazil and the US is the first recent month that moves production closer to the OLS line.
Countries Ranked by Oil Production
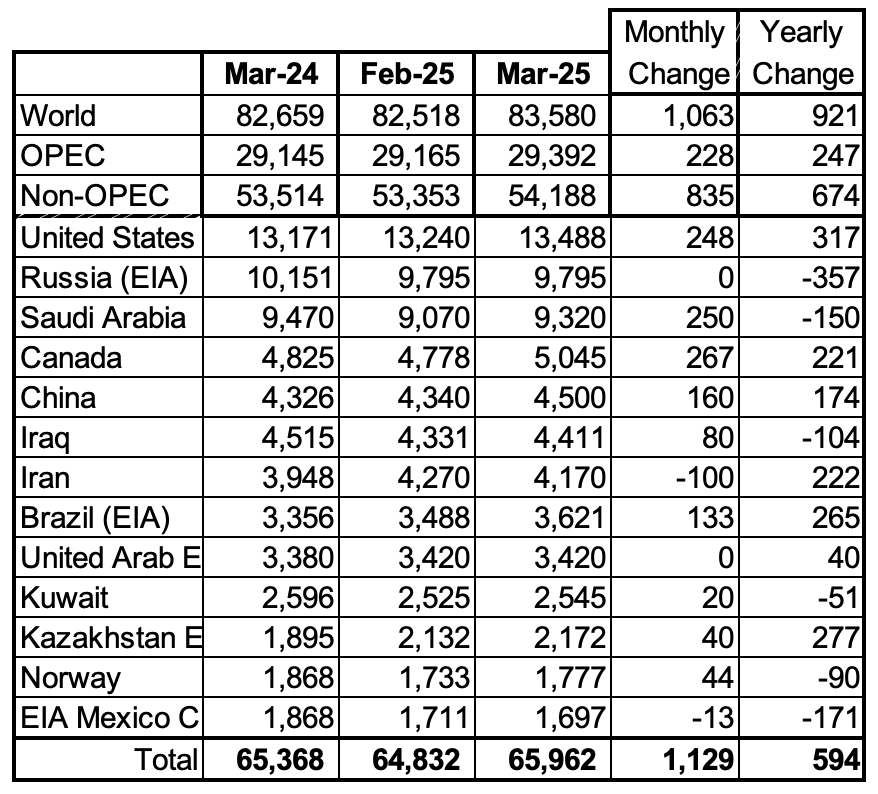
Above are listed the World’s 13th largest oil producing countries. In March 2025 these 13 countries produced 78.9% of the World’s oil. On a MoM basis, production increased by 1,129 kb/d in these 13 countries while on a YOY basis production rose by 594 kb/d.
March Non-OPEC Oil Production Charts

March’s Non-OPEC oil production increased by 835 kb/d to 54,188 kb/d. April is expected to drop 232 kb/d to 53,956 kb/d.
Using data from the July 2025 STEO, a projection for Non-OPEC oil output was made for the period April 2025 to December 2026. (Red graph). Output is expected to reach 54,747 kb/d in December 2026.
From March 2025 to December 2026, oil production in Non-OPEC countries is expected to increase by 559 kb/d.

March’s Non-OPEC W/O US oil production increased by 587 kb/d to 40,700 kb/d. April’s production is projected to drop by 212 kb/d to 40,488 kb/d.
From March 2025 to December 2026, production in Non-OPEC countries W/O the U.S. is expected to increase by 796 kb/d.
Non-OPEC Oil Countries Ranked by Production
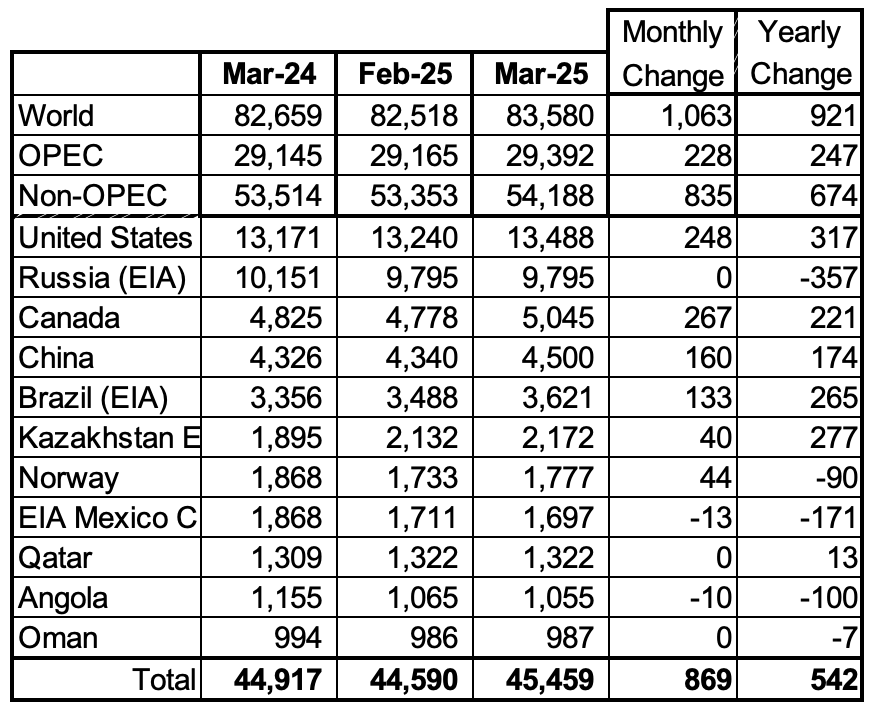
Listed above are the World’s 11 largest Non-OPEC producers. The original criteria for inclusion in the table was that all of the countries produced more than 1,000 kb/d. Oman has recently fallen below 1,000 kb/d.
March’s production increased by 869 kb/d to 45,459 kb/d for these eleven Non-OPEC countries while as a whole the Non-OPEC countries saw a yearly production increase of 674 kb/d to 54,188 kb/d.
In March 2025, these 11 countries produced 83.9% of all Non-OPEC oil.
Non-OPEC Country’s Oil Production Charts
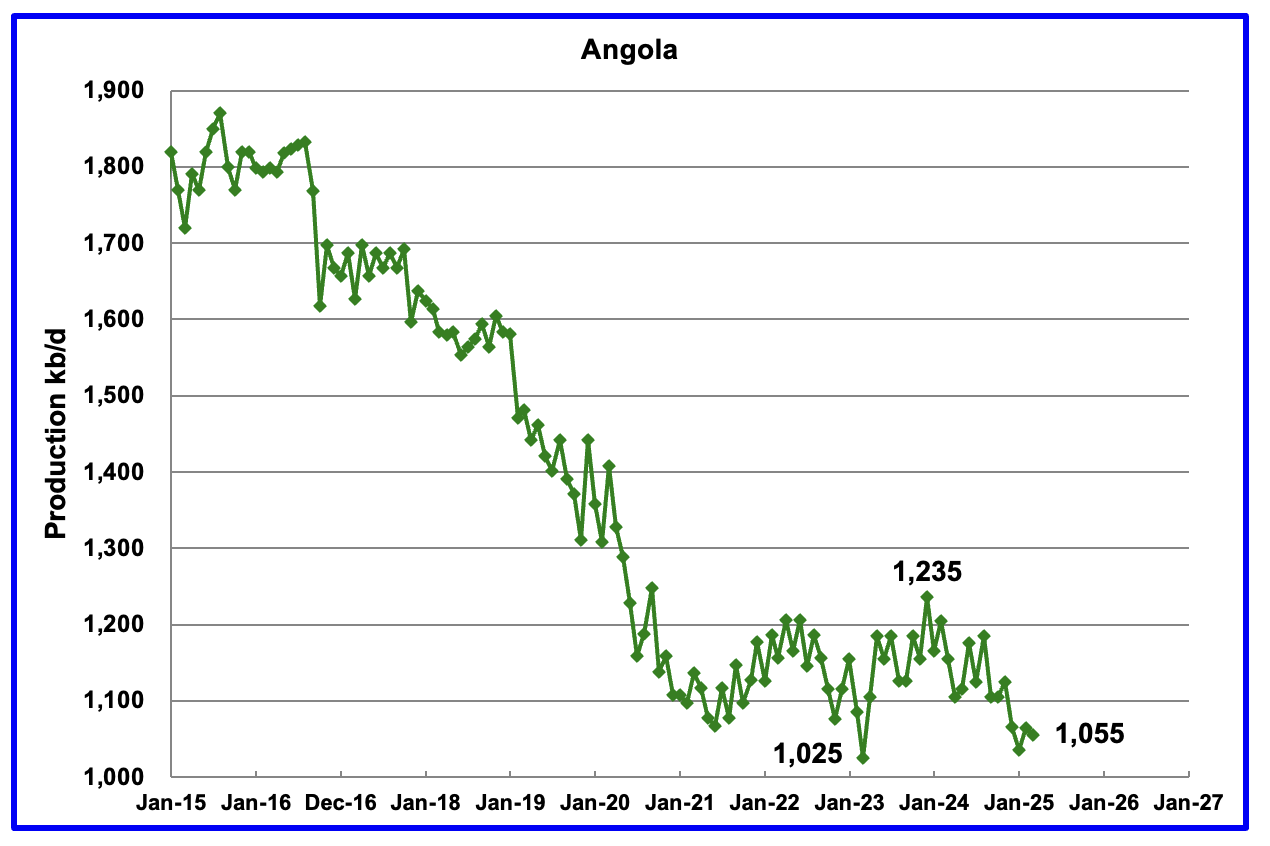
Angola’s March production dropped 10 kb/d to 1,055 kb/d. Since early 2022 Angola’s production settled into a plateau phase between 1,100 kb/d and 1,200 kb/d. However December to March production brought a drop below the lower plateau.
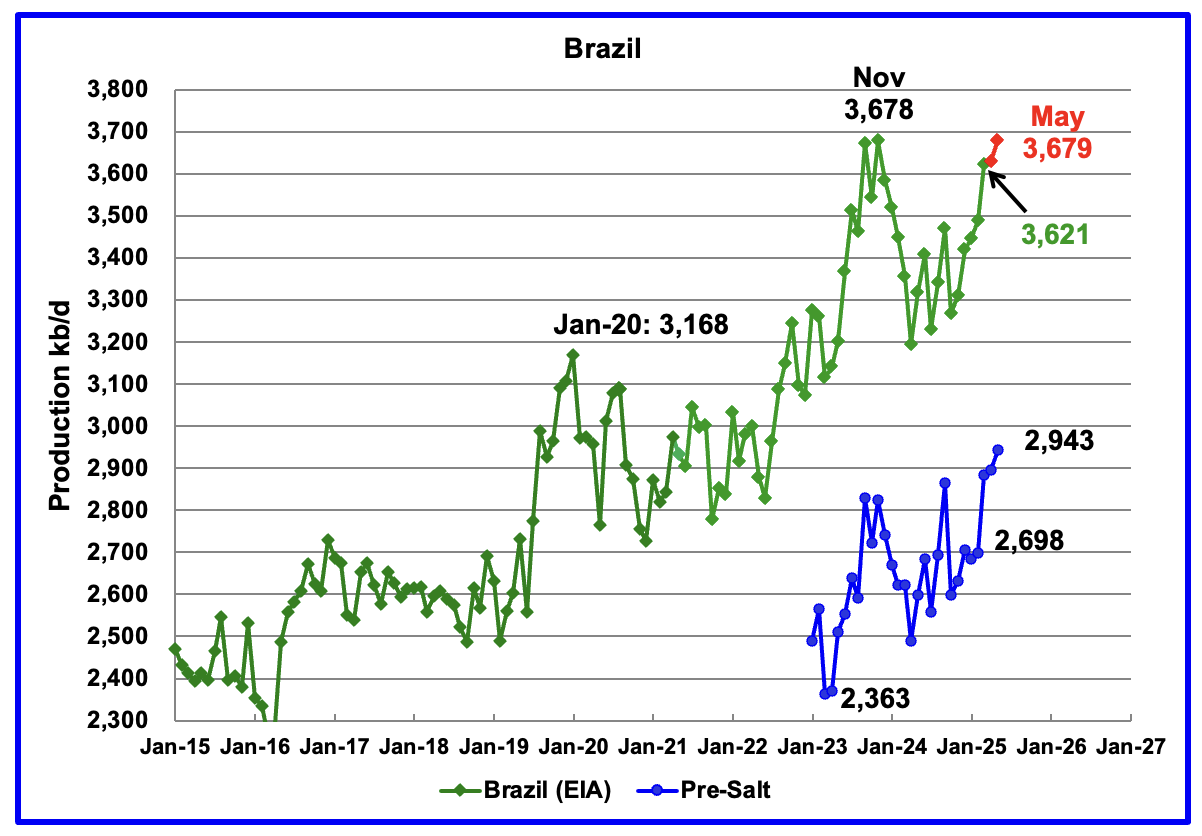
The EIA reported that Brazil’s March production increased by 133 kb/d to 3,621 kb/d.
Brazil’s National Petroleum Association (BNPA) reported that production increased in April and May to 3,679 kb/d, a new high. The pre-salt graph tracks Brazil’s trend in the oil graph. The February to March increase in pre-salt production was 185 kb/d, 52 kb/d more than the overall Brazil increase.
The February to March increase could be related to the addition of the two new floating platforms. The December OPEC report states that two new floating production storage and offloading (FPSO) platforms came online in November. It also mentions operational issues and slow ramp-ups in several offshore platforms continue to be an issue. Perhaps this explains the delayed March production ramp up.
The April OPEC report states that the March crude increase was “supported by production ramp-ups from recently operated FPSOs.

Canada’s production increased by 267 kb/d in March to 5,045 kb/d. March’s production was a rebound from February’s production drop due to very cold weather in the Fort McMurray region.
In a different vein, Canada exported its first LNG cargo in June. According to this Article, “the first cargo of liquefied natural gas (LNG) has left the LNG Canada facility on the west coast of Canada.
“Shell’s LNG Outlook 2025 forecasts global demand for LNG is set to rise by around 60% by 2040, largely driven by economic growth in Asia. LNG Canada’s strategic location on Canada’s Pacific Coast connects cost-competitive upstream gas from British Columbia to growing Asian demand.”
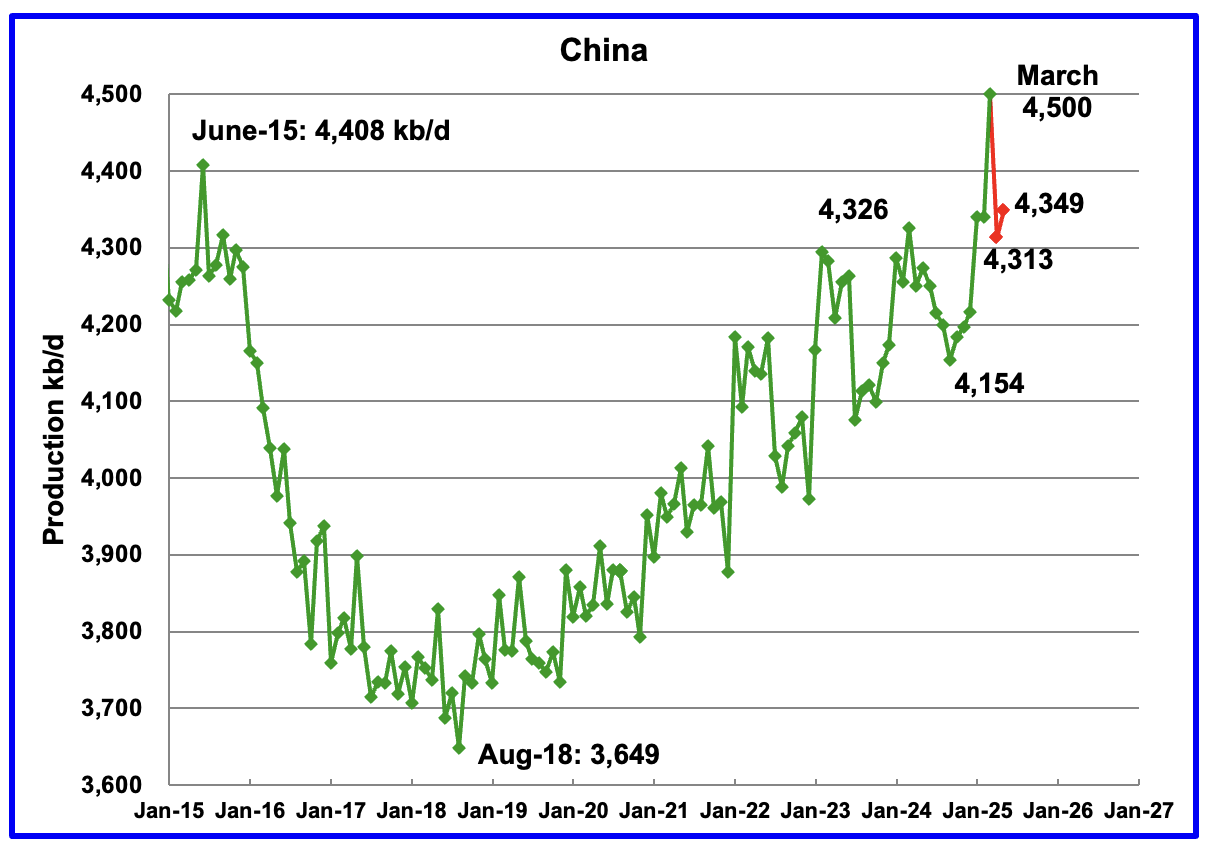
The EIA reported China’s March oil output increased by 160 kb/d to 4,500 kb/d, a new high.
The China National Bureau of Statistics reported production for April and May. The Bureau reported that April’s oil production dropped by 187 kb/d to 4,313 kb/d before rising in May to 4,349 kb/d. Previous highs have not seen such a huge drop as occurred in April. Could March be a reporting error?
On a YoY basis, China’s March production increased by 174 kb/d from 4,326 kb/d.
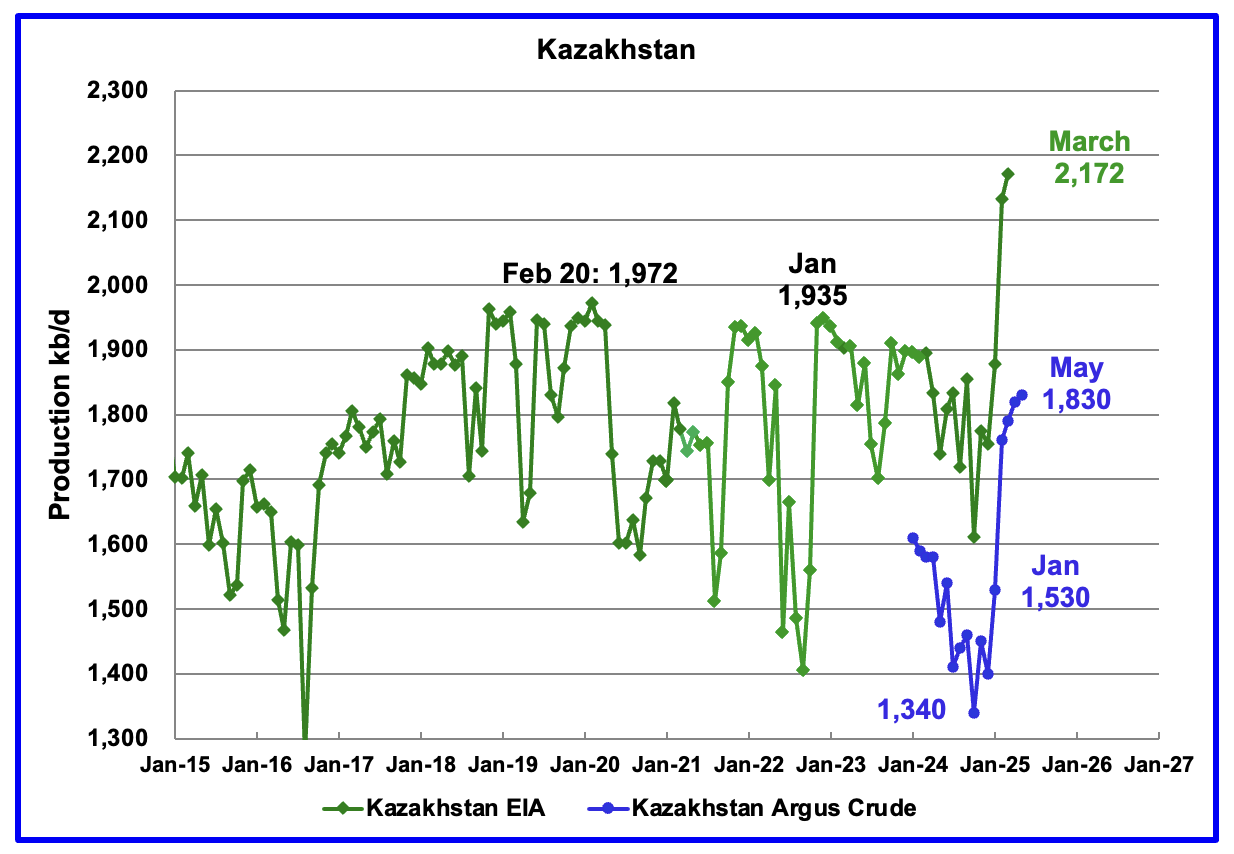
According to the EIA, Kazakhstan’s oil output increased by 40 kb/d in March to 2,172 kb/d, a new record high.
Kazakhstan’s recent pre-salt crude oil production, as reported by Argus, has been added to the chart. In October pre-salt crude production dropped by 120 kb/d to a low 1,340 kb/d. Since then production to May 2025 has risen by 490 kb/d. The production ramp up starting in January 2025 is due to a New Field coming online. Note this is crude production whereas the EIA’s numbers are C + C.
Kazakhstan’s May OPEC crude production target is 1,490 kb/d. At 1,830 kb/d, Kazakhstan is 340 kb/d over their target. According to this Article, Kazakhstan says it has no plans to cut oil production this month (May) after massively exceeding its Opec+ target in March.
Since Kazakhstan’s reduction promises have not materialized, OPEC announced it would “accelerate plans to revive halted supplies in May/June/July with an increase, triple the size originally scheduled, of 411 kb/d in each of May/June/July”. For August, OPEC 8 collectively agreed to increase production by 548 kb/d.
OPEC is trying to send a message to Kazakhstan to comply with its production target, but they are not listening.
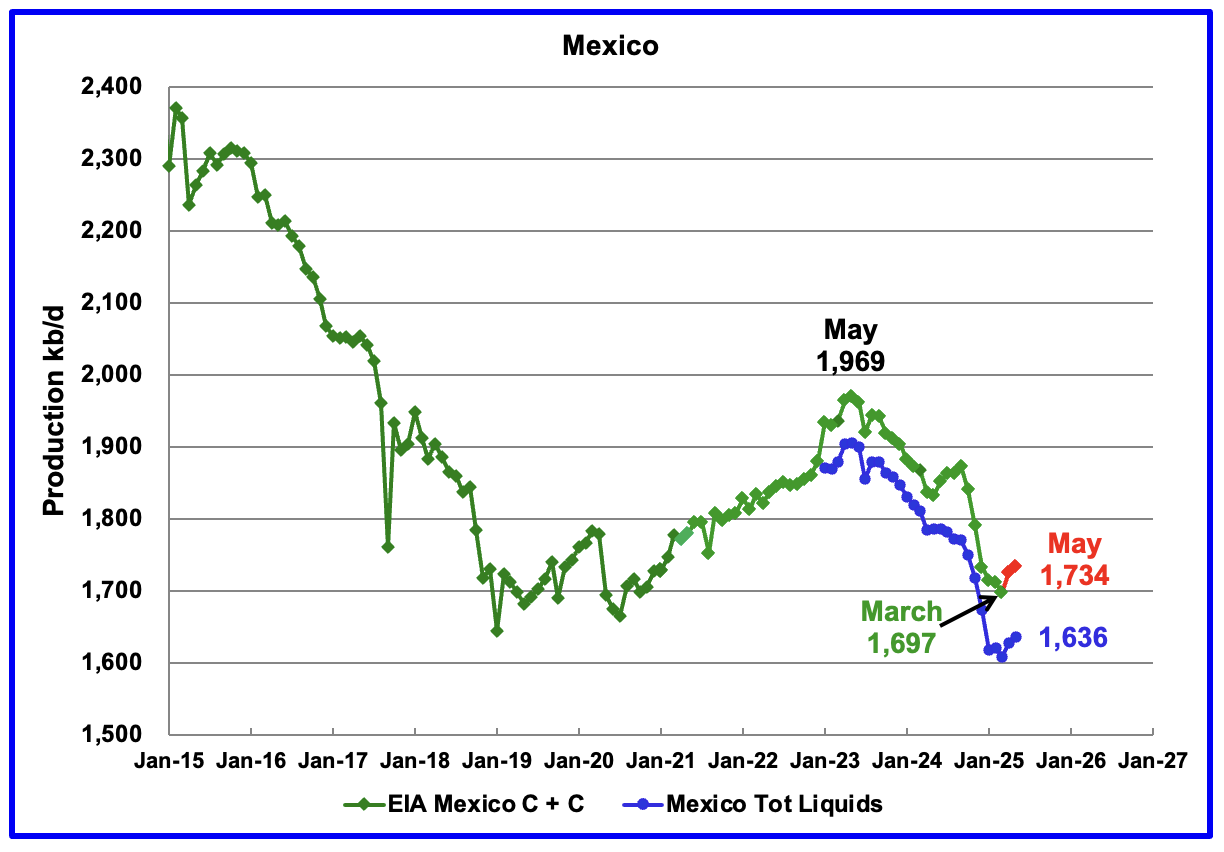
According to the EIA, Mexico’s March output dropped by 13 kb/d to 1,697 kb/d.
In June 2024, Pemex issued a new and modified oil production report for Heavy, Light and Extra Light oil. It is shown in blue in the chart and it appears that Mexico is not reporting condensate production when compared to the EIA report.
In earlier reports, the EIA would add close to 55 kb/d of condensate to the Pemex report. However for October and November it was increased to 122 kb/d and 117 kb/d respectively. The February and March addition was 98 kb/d.
For April and May production, 98 kb/d have been added to Pemex’s production to estimate Mexico’s April and May C + C production, red markers. May production is estimated to be close to 1,734 kb/d. Note that Mexico’s production for the last four months has stopped dropping and has stabilized at slightly more than 1,600 kb/d according to Pemex.
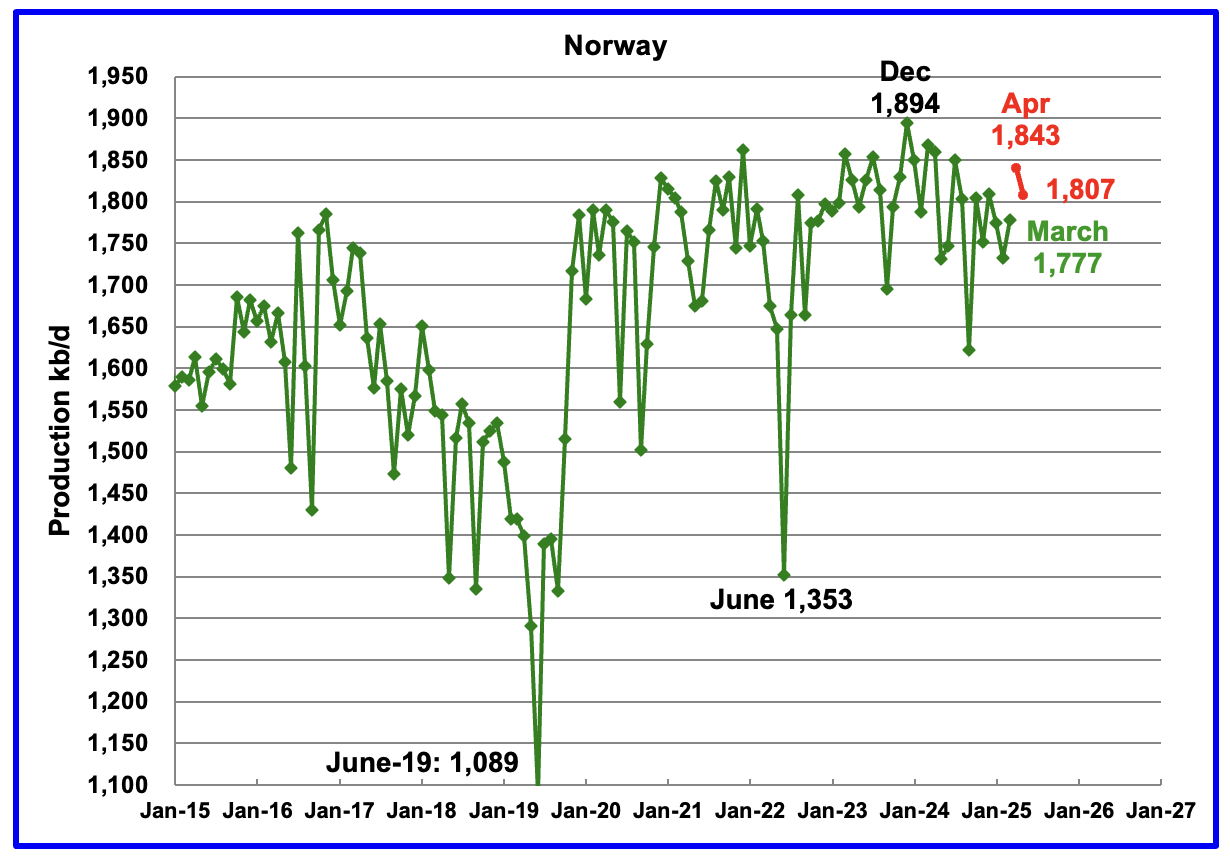
The EIA reported Norway’s March production rose by 44 kb/d to 1,777 kb/d.
Separately, the Norway Petroleum Directorate (NPD) reported that April production rose by 66 kb/d to 1,843 kb/d and May declined by 36 kb/d to 1,807 kb/d, red markers. Norway is starting to show signs of having hit peak oil. However Norway keeps finding new smaller fields in the Barents and North Sea which will slow the decline rate.
The Norway Petroleum Directorship reported that May’s oil production was 1.0 % above forecast.
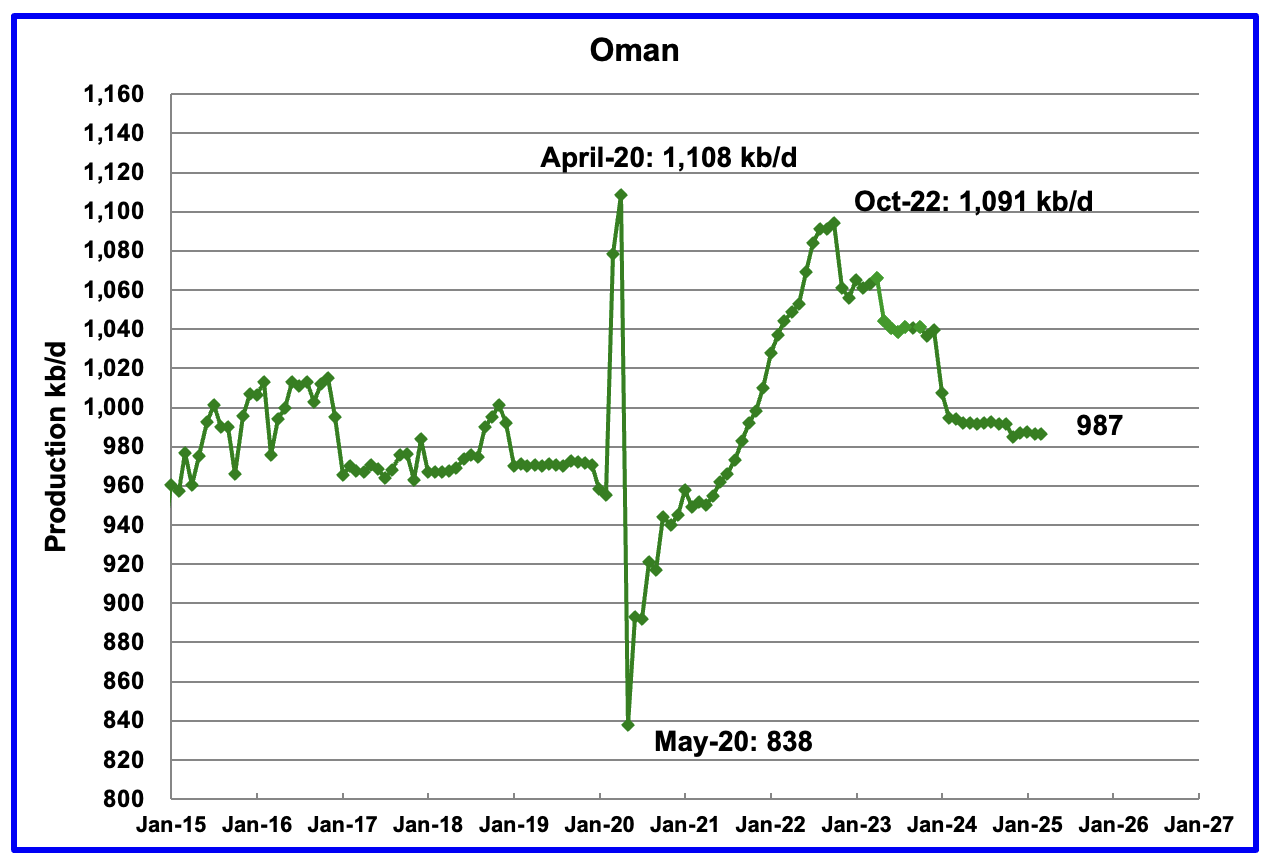
Oman’s production had risen very consistently since the low of May 2020. However production began to drop in November 2022. According to the EIA, March’s output rose by less than 1 kb/d to 987 kb/d and appears to be stabilizing in the 980 kb/d to 1,000 kb/d range.
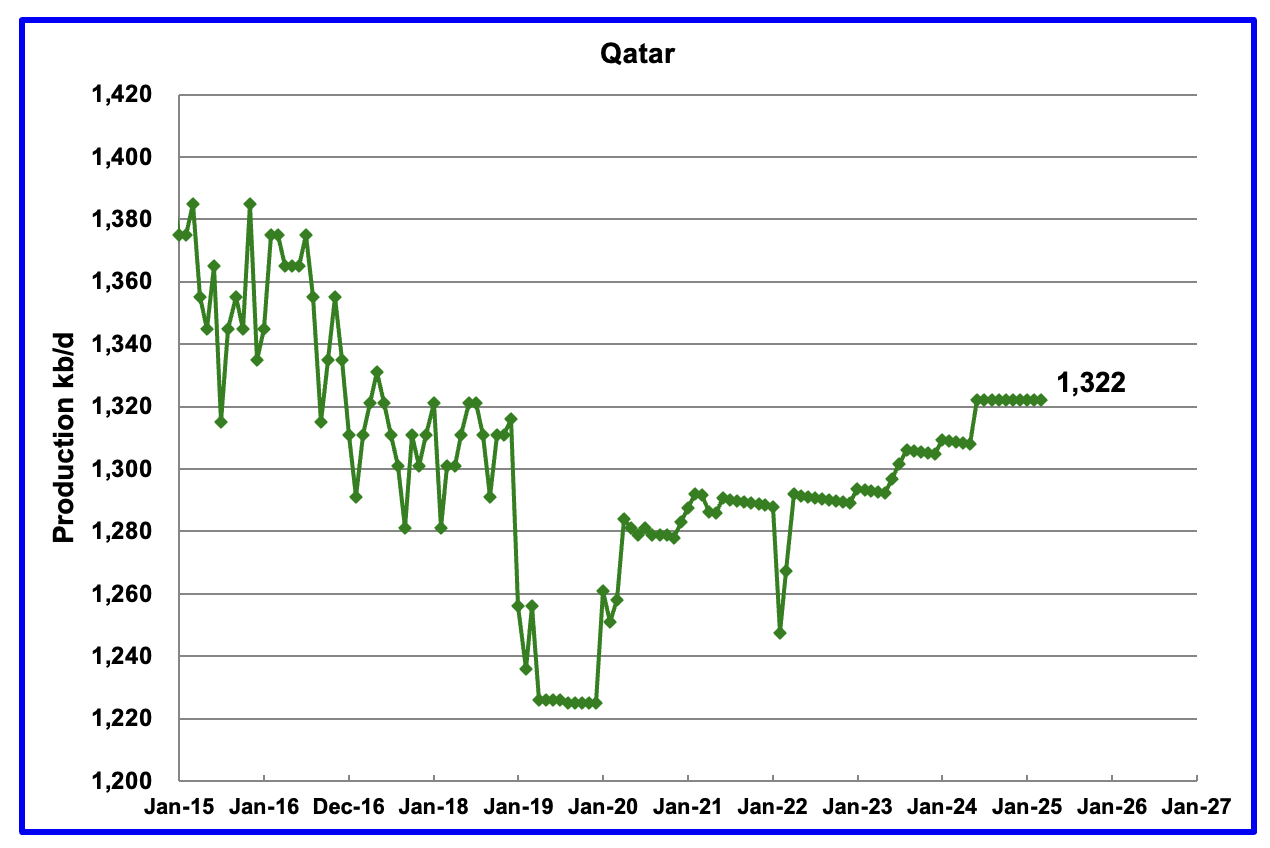
The EIA had been reporting flat output of 1,322 kb/d for Qatar since early 2022. However the EIA revised down all of the previous production data up to April 2024. May 2024 production reverted to 1,322 kb/d. Qatar’s March output was again reported to be 1,322 kb/d.
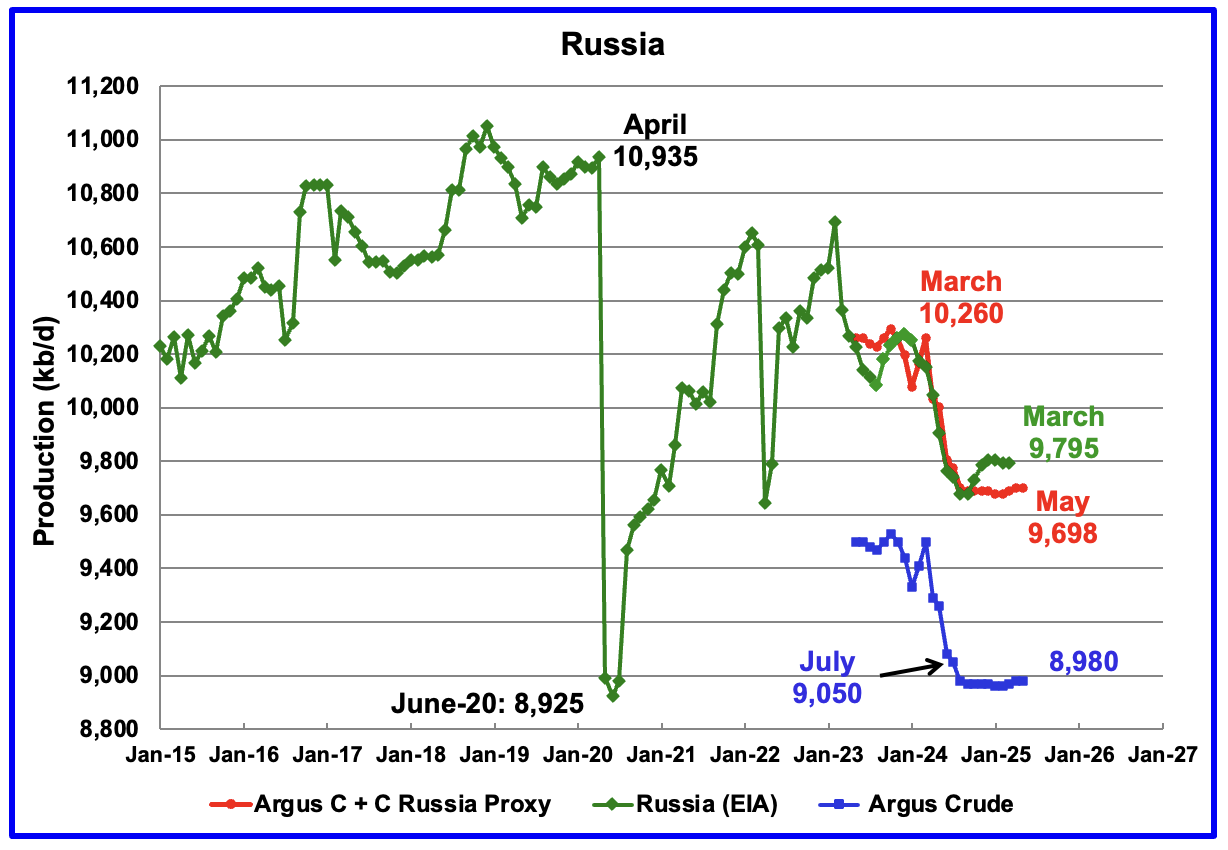
The EIA reported Russia’s March C + C production was unchanged at 9,795 kb/d and was down 465 kb/d from March 2024.
Using data from Argus Media reports, Russian crude production is shown in the blue graph. For May 2025, Argus reported Russian crude production was 8,980 kb/d. Adding 8% to Argus’ May crude production provides a C + C production estimate of 9,698 kb/d for Russia, which is a proxy for the Pre-War Russian Ministry estimate, red markers.
For May Russia’s target production as stated by OPEC + was 9,080 kb/d, which is 100 kb/d below target. Is Russian production about to start falling?
According to this Article, Russia failed to meet its OPEC + oil production target in June.
“Russian producers reportedly pumped 9.022 million barrels per day last month, a figure 28,000 barrels per day below the required level, including compensation cuts. This marks the largest gap between Russia’s output and its monthly quota this year, based on Bloomberg’s calculations

This US production chart is very similar to the one published last week in the US update post. However the STEO portions of the two graphs have been updated using the July 2025 STEO.
Production in December 2026 is expected to 13,252 kb/d, 101 kb/d lower than shown in last week’s US update. Production starts dropping in May. Note production in the Onshore L48 drops steadily after April 2025. Production for December 2026 is projected to be 10,972 kb/d, 101 kb/d lower than shown in the US February update.
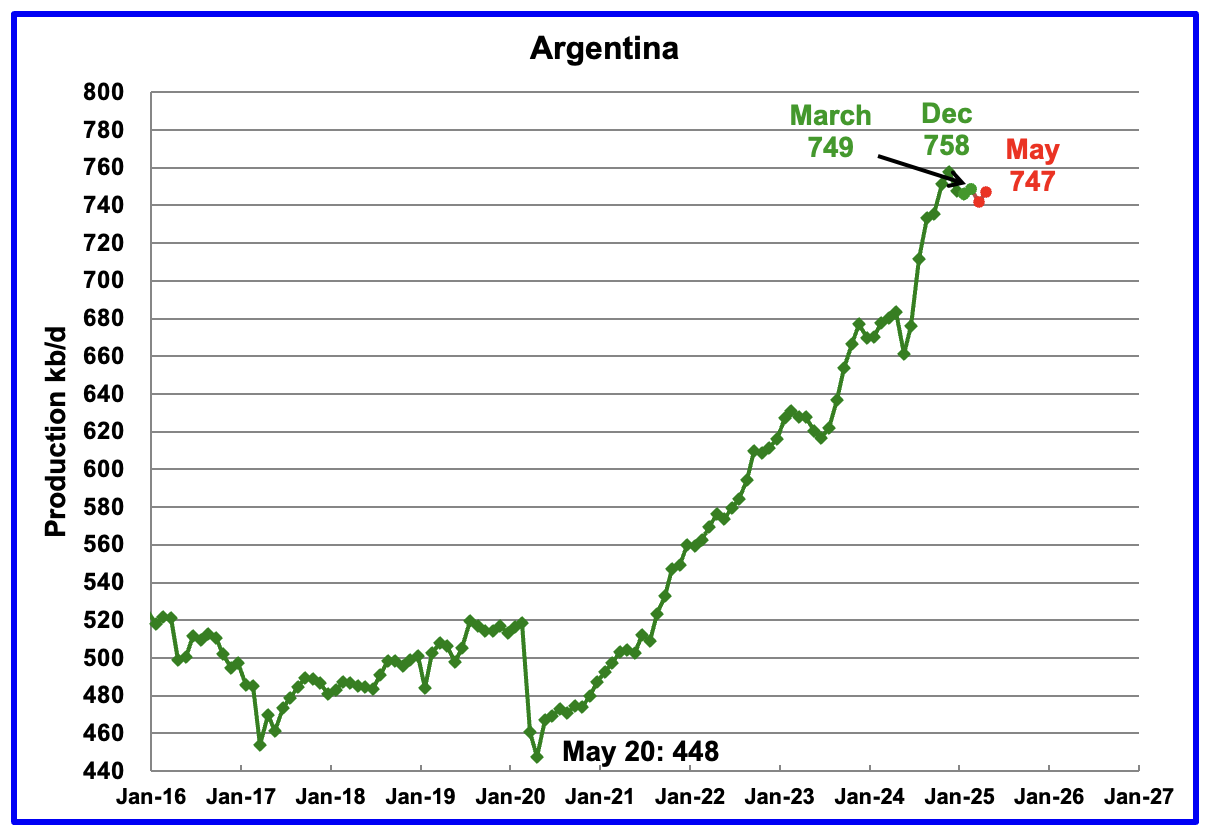
Normally, Argentina’s oil production is not reported because its production is lower than 1,000 kb/d. However production has been steadily rising over the last five years due to the startup of shale oil and gas production in the Vaca Muerta basin.
For March, the EIA reported Argentina’s production rose by 3 kb/d to 749 kb/d.
The Argentinian Energy Secretariat reported oil production in May rose by 5 kb/d to 747 kb/d.
Is Argentina’s production growth about to slow on its way to an expected 1,000 kb/d a few years down the road?
93 responses to “March World and Non-OPEC Oil Production Rises”
As noted at the beginning of the post, I noted that I had sent an email to the EIA regarding Saudi Arabia’s oil production numbers for March. This is the reply I received.
“Thank you for reaching out about this. As we typically do, we will be reviewing our numbers — including Saudi — ahead of the next STEO release in August. If we need to make any corrections, we’ll do so at that time.”
https://www.reuters.com/markets/commodities/saudi-plays-short-long-game-with-opec-production-gamble-2025-07-08/
To its advantage, Saudi Arabia has a lot of untapped oil production capacity.
The country produced around 9.55 million bpd in June, according to Keshav Lohiya, founder of consultancy Oilytics, based on Petro-Logistics data. This leaves it with an extra 200,000 bpd of production increases available through August under the OPEC+ deal.
It also has a production buffer of nearly 3 million bpd it can tap within 90 days, according to International Energy Agency estimates.
Seppo
Saudi Arabia’s oil production capacity continues to be a difficult puzzle to unravel. Its sustainable capacity is stated as being 12 Mb/d and has not changed for many years. Similarly, their reserves have not changed. Considering that they admit that Ghawar is declining at 2% per year, which is roughy 70 kb/d, I think that their sustainable capacity may be closer to somewhere between 10.5 Mb/d and 11.0 Mb/d.
Attached is a chart which is a mixture of production data for SA. The green graph is the EIA’s C + C data. The red graph is my estimate of what SA’s required crude production will be as OPEC unwinds its cuts. The August production requirement is the last official announcement. The graph carries on to September and October when all of the 2.2 Mb/d are unwound. A recent announcement/speculation indicates that August may be the last increase because of a potential over supply situation as year end approaches.
According to Bloomberg and the IEA June production was 9.8 Mb/d, well within their capacity.
“Saudi Arabia raised crude output far above its OPEC+ quota last month, joining other producers in a rush to export oil out of the Persian Gulf as Israel went to war with Iran, according to the International Energy Agency.
The kingdom raised crude production by roughly 700,000 barrels a day to 9.8 million barrels a day, with about 70% of the additional supply exported, the IEA said in its monthly report. It was a rare breach of agreed OPEC+ limits by Riyadh, which has repeatedly scolded other members for overproduction.”
https://financialpost.com/pmn/business-pmn/saudis-lift-oil-output-above-quota-in-rare-opec-breach#:~:text=Saudi%20Arabia%20raised%20crude%20output,to%20the%20International%20Energy%20Agency.&text=(Bloomberg)%20—%20Saudi%20Arabia%20raised,the%20New%20York%20Times%20Crossword.
https://www.iea.org/reports/oil-market-report-july-2025
Ovi, I agree with your assessment of Saudi Arabia’s lack of spare capacity at the stated levels. Recall,
the report by ASPO France in which there was a counting of where Saudi oil comes from. Only 5 percent comes from fields discovered since 1970. Most of the fields in production are in now decline. Last month’s OPEC monthly put Saudi contribution up 177 Kb/d of the total 180 Kb/d total for OPEC plus. It will be interesting to see what the next report says. The promise of 411 kb//d is likely not be delivered again.
Saudi production in June 9356 kb/d
Saudi Production increase 177 kb/d UAE 83 kb/d
OPEC Production increase 220 kb/d
OPEC+ Production increase 349 kb/d
OPC+ minus -OPEC = 129 Kb/d of which 104 kb/d from Russia 41kb/d plus Kazakhstan 63 kb/d.
Short of 411 kb/d promised
Seppo
Did you see this note in the second OPEC production table as reported by members.
* Saudi Arabia’s supply to the market in June was 9,360 tb/d and production was 9,752 tb/d.
This appears to imply that the MOMR is reporting supply to market as opposed to production and seems to confirm the content of the next comment down.
Seppo,
There are 8 OPEC members who announced increases for June 2025, their collective target was 31375 kb/d. Secondary sources report a collective increase of 395 kb/d in June 2025 for those 8 OPEC plus members with collective output of 31352 kb/d, about 23 kb/d short of their target as you said or about 0.07% short (23/31375).
SA asks Oil Counters to Change How They Count
Riyadh is arguing that the standard practice – measuring oil production – wasn’t appropriate for the month, and that they should instead adopt a different metric called supply-to-market, said several people at the firms, who asked not to be identified as the process is private.
The difference between supply-to-market and production is that the former captures what customers really took whereas the normal measure is what gets pumped out of the ground.
I am wondering if this could explain the extra production bump the EIA shows for SA.
https://www.rigzone.com/news/wire/saudis_ask_opec_watchers_for_data_change_to_abide_by_quota-12-jul-2025-181121-article/
This could also be interpreted that SA is not been able to pump as much as their quota indicates. One would expect that as SA is reaching the limit of her production, they will find a way to hide it
Can you tell us your sources?
IVER
The above statement was my speculation. So, it is based on a hunch, which is in turn is based on the report by ASPO France and that SAUDI spare capacity does not to seem ever to change despite her fields being in decline https://aspofrance.org/2024/11/07/middle-east-crude-oil-production-and-forecast-jean-laherrere-patrick-brocorens-15-octobre-2024/Borens
Seppo
Unfortunately Laherrère has been wrong for 20 years.
Hunches don’t really count for anything, so you admit you actually have no idea.
The main energy institutes which have vast information resources say OPEC has 5 million spare capacity. The oil price speaks volumes, there is loads of oil around and last Energy review data show global refinery throughput at all time highs.
2018 oil delivery to market has been surpassed for 2 years!
Happy Birthday to ASPO it’s 20 years old this year.
Great work Ovi, Dennis!
https://thewest.com.au/business/public-companies/beetaloo-hits-major-milestone-with-nt-well-gas-stimulation-c-19286132
Australia’s Beetaloo Basin hits major milestone with gas stimulation project.
Andre
Thanks. Much appreciated.
Andre,
I believe the Beeraloo boys might get a big boost of support within the next 12 months should the anticipated natgas shortfall on Australia’s east coast rear its ugly head.
Public sentiment/tension surrounding the importation of LNG into Port Kembla from Canada or Mexico (Costa Azul) might be the impetus to build out the needed pipes to transport NT natty down to where it will be in short supply.
That article claims prospective near 50 Tcf of OGIP from just that one outfit’s acreage. Could be a bit of investment-seeking chest thumping, but the overall outlook is very promising for long term, successful natgas production from this region.
In a – somewhat related – aside, we gas boosters have ongoing been claiming that the Age of Gas will supplant (NOT replace) oil as THE preeminent energy source in the near future.
While present paradigms understandably focus on the crucial role that liquid hydrocarbons play in the globally vital transportation realms, it is becoming blinding obvious that this energy voracious upstart – broadly described as Artificial Intelligence – is going to become the locus of the bulk of developing energy attention for at least the next decade.
Anyone who has dabbled with Chatbot, Grok, et al, should immediately grasp some of the ramifications of having unfathomably large amounts of accurate, timely data with which to apply to even routine, mundane tasks/queries.
If anyone has yet to do so, prepare to be surprised.
It is paving the way to providing staggeringly profound impacts across wide swaths of human endeavors.
To effectuate AI, one needs electricity … lots and LOTS of electricity.
I firmly claim that the the ability to produce copious amounts of economical electricity will surpass the cruciality of people/goods transportation which is currently, largely reliant upon liquid hydrocarbons.
Natgas, coal and nuclear are racing to provide this much needed energy source.
The supplies of which are nearly inexhaustable.
Concern over oil scarcity will have come to be recognized as a sincere – albeit misguided – foray into a noble quest to mitigate a disaster that never was to evolve.
Jes sayin’.
Rig Report for the Week Ending July 11
The rig count drop that started in early April when 450 rigs were operating, continues, hits another new recent low but the weekly drop is slowing.
– US Hz oil rigs dropped by 1 to 383.
– New Mexico rigs were up 1 to 80 while Texas dropped 2 rigs to 208. Texas Permian dropped 1 to 170.
– In Texas Midland was down 3 to 17 while Martin was flat at 24. However Loving dropped 2 to 20 while Reagan added 2 to 11 and Glasscock added 2 to 9.
– In New Mexico Eddy dropped 1 to 40 while Lea added 2 to 40. Lea is down 10 rigs from the end of February while Eddy is down 5.
– Eagle Ford is unchanged at 33.
– NG Hz rigs were unchanged at 94.
Frac Spread Report for the Week Ending July 11
The frac spread count rose by 4 to 180. It is also down 58 from one year ago and down by 35 spreads since March 28.
Permian Basin Scenario based on drilling rig counts and an assumed continued decrease in rig count. CTMA=centered 12 month average
For Permian scenario above the URR=37.6 Gb.
US LTO scenario using Permian scenario above and no changes to previous LTO output scenarios for other US tight oil basins (non-Permian). Peak in 2025 at annual average output of 9.5 Mb/d, URR=70 Gb.
World Oil Shock Model using US LTO scenario above and assuming OPEC increases output as planned. This scenario does not take account of a potential decrease in World demand for oil to less than this supply curve after 2035. Peak in 2026 at 84.3 Mb/d, URR = 3000 Gb.
Art Berman’s honest article about why Peak Oil Predictions were wrong.
https://www.artberman.com/blog/peak-oil-requiem-for-a-failed-paradigm/
The feared 2004 to 2011 plateau is currently being exceeded by 7mmb/d
Iver,
Yeah, there was a fairly minimal discussion on this site when Art’s article was first published.
While I have been in close to 100% disagreement with Berman since, like, forever, I have always respected both his integrity and gentlemanly demeanor as he continued to offer up his findings.
That article would be well worth a careful re-reading as it depicts not only an accurate snapshot of the present liquid hydrocarbon ‘world’, it offers a VERY plausible outlook for the world’s oil supply spanning the next several decades.
Goodonya for linking that post.
And how much of it is the last stand- shale?
Iver,
My models include both conventional and unconventional oil. Oil output will peak, even when economics is considered. Just a note that I have an undergraduate degree in physics and a graduate degree in economics. So I looked both the geophysics and economics of peak oil.
Dennis/Iver
What surprises me with Art’s article is there is no mention of Covid. It took till January 2023 before World oil production got back to the January 2020 level. The US got back to January 2020 around mid 2022. That implies the peak we are close to in mid 2025 would have occurred in early 2023 to mid 2023. I think we would be in a totally different place today if Covid hadn’t happened.
A lot of EVs have been produced in the last three years along with other off oil initiatives.
Dennis do you have some January 2020 model that shows what could have happened to oil production under a BAU scenario?
Ovi,
The assumptions would have been very different in Jan 2020 (I think I expected oil prices in the $80 to $100 per barrel range over the 2020 to 2030 period at that point), and I did not expect the pandemic to be as bad as it turned out to be. Scenario below was saved on my hard drive on Jan 2, 2020. Peak was 2024 at 85.25 Mb/d and extraction rate for conventional oil was held constant at the 2019 level up to 2200. US LTO URR was 89 Gb for this scenario with a peak of 10 Mb/d in 2025, with a fatter tail after peak than my current assumptions (about 20 Gb higher URR for LTO than my 2025 scenario).
Dennis
Thanks. Could you also put up the US model using the current URR.
Ovi,
Not clear what you are asking for. Do you want the World model from Jan 2020, but replace the assumption used for tight oil in Jan 2020 with my current (July 2025) US tight oil model?
If that was what you wanted, that scenario is below, with Conventional and extra heavy oil scenarios from Jan 2020 and my July 2025 scenario for US tight oil (71 Gb URR vs 89 Gb URR in original Jan 2020 scenario). If you were looking for something different just let me know. This new scenario has a URR of 3030 Gb (note that in chart below it says URR is 3040 Gb, that is incorrect, it should say 3030 Gb).
Dennis
I just would like to see the 2020 US model by itself but using the latest URR.
Ovi,
I don’t actually do a “US Model”, but I do have a US tight oil model from Jan 2020, that is below. Trying to convert to the current “lower” URR is much more work as the tight oil model is based on 5 sub models (Permian, Bakken, Eagle Ford, Niobrara, and Other tight oil basin), so that will take some time. Basically the tail after 2025 would be thinner, see chart in comment below which is based on some scenarios from Feb 2020 using lower oil price assumptions than the Jan 2020 model.
Ovi,
Here is a 70 Gb scenario from Feb 2020 for US tight oil.
Dennis
Thanks
So the model is still showing a tight oil peak in 2024. That is a pretty good model to get it so close for 5 years ahead and not knowing that Covid is about to wreck the economy.
What is the more accurate URR based on the latest data, 70 or 90?
Thanks Ovi,
My best guess is about 70 Gb, but it is difficult to know, I may be off by 10 GB either too high or too low. I would put low odds on 90 Gb or more, maybe 1 in 20 and similar odds on 50 Gb or less, I would say maybe 68% probability of URR in the 60 to 80 Gb range for US tight oil.
Actually if we assume a normal probability distribution and one sigma as 10 Gb, it should be a 1 in 40 chance of 50 Gb or less and also a 1 in 40 chance of 90 Gb or more for US tight oil URR. Fact is we don’t know what the probability distribution looks like.
Fact is many Peak Oil alarmists were not trained oil geologists and had no idea what men in the industry were achieving.
Thankfully
Iver,
In 2005 almost nobody thought tight oil would amount to much and even in 2011 it was only just being understood.
My thinking on this evolved over time, even the EIA had pretty low expectations for tight oil in their 2013 Annual Energy Outlook(AEO2013), see post below from December 2012, where I had US tight oil peaking in 2020 at about 2.8 Mb/d, fairly close to the AEO2013 tight oil forecast (reference scenario).
https://oilpeakclimate.blogspot.com/2012/
At that time I was focused on the Bakken and Eagle Ford where most of the US tight oil was being produced, the Permian Basin wasn’t even on my radar at that point. The first USGS assessment on Permian tight oil was in 2016 (Midland Wolfcamp) with other assessments in 2017 (Spraberry) and 2018 (Delaware Wolfcamp and Bonespring formations).
https://www.usgs.gov/centers/central-energy-resources-science-center/science/permian-basin-oil-and-gas-assessments
about Argentina, i.e. Vaca Muerta, here is a news :
https://www.rionegro.com.ar/energia/vaca-muerta-supero-los-600-millones-de-barriles-y-ya-es-un-gigante-del-petroleo-mundial/
In May, 2025, VM production hit a new high 448K BOPD, although the difference from last record is small. Nevertheles, the news claim VM could hit 500K BOPD by September this year!
I wish to highlight here:
1. EIA orginally predicted TRR of gas and oil for VM is 3:1, but so far VM has produced 609 Million BO, and 122 Million BOE gas according to the news; but I believe the news miscalculated the gas amount BOE as always confused with cubic meter to BOE calculations, and it should be close to 900million BOE for gas, and therefore at a accumuted gas and oil GOR at 3:2; and 448K BOPD and 79.8 Million Cubic meter of gas (or about 470K BOE), or gas and oil PD GOR at roughly close to 1:1.
Permian has accumulated gas production at 45TCF, and oil at 12 G BO by Jan. 2024 — D. C. this means Permian will peak in 2026 with roughly 16G BO accumulated production?
2. the news claim the 609million bbls of oil worth 40billion dollars, implicating ~$70/bbl oil price, and it is same as the investment put into the VM shale. With total number of 4,118 wells (oil and gas) in VM, this translate into ~10million USD per well in VM, and each well has so far produced ~110K BO accumulated and ~110BOPD. It is a good economic/productivity number to compare to, i.e. Permian, which also started about similar time as VM. I did one last year using other source of data,
https://www.linkedin.com/pulse/comparing-vaca-muerta-shale-oil-gas-best-us-patches-production-wu-tw42c
By Jan 20204, permian has 43,276 laterals producing 5.4million BOPD, or 125BOPD; and already 12G BO produced, or 231 KBO accumulated per well. At oil price of $70/bbl, 12 G BO =840 Billion dollars, and divided by 43,276 wells, that is close to 20million each well? Sounds like Permian should make more money than VM per well?
Such lower economic figures for VM wells are the results of special manipulated gas price in Argentina and EIA assumed higher shale gas resources before, when higher gas price helped the initial investment in VM shale gas. Initial assumption to drill in the lower EUR oil acreage with higher GOR also depressed the oil production.
Sheng Wu,
So capital costs per well are in the 12 million per well ball park and note that there are production costs, royalties and taxes to pay on each barrel produced. At $70/bo and very low gas prices in West Texas these wells make very little money. My Permian scenario has a centered 12 month average peak in Sept 2022 at 6022 kb/d and cumulative output for Permian tight oil at peak at about 16 Gb which is about 42% of scenario URR. The 50% point for cumulative production to URR is reached in Dec 2026 at 5750 kb/d.
Only about $35/b of net revenue remains after paying royalty, tax, and production costs. So rather than $20 million per well it is $10 million per well and each well loses $2 million, if all natural gas were flared (note that many producers do in fact flare as much natural gas as is allowed because very little money is made on the natural gas as pipeline capacity is constrained especially for smaller producers.) This explains the high debt levels for the Permian focused tight oil producers.
Chevron triggers supply crisis after zinc contamination found in Mars crude oil
The presence of zinc in crude oil is unusual and has raised significant concerns among refiners. Zinc, when present in crude oil, can damage refining equipment and catalysts used in the conversion of oil into fuels. According to several industry sources cited by Reuters on July 11, the use of contaminated crude not only risks generating high maintenance costs, but may also reduce the quality of the fuels produced. The contamination could thus trigger chain reactions throughout the entire supply system, forcing refineries to reconsider their production plans.
I wonder how many barrels per day the shutdown will take away from GOM oil production?
https://energynews.pro/en/chevron-triggers-supply-crisis-after-zinc-contamination-found-in-mars-crude-oil/
‘Pittsburgh Will Be Transformed Into “AI Hub Of World” With $75 Billion Investment’ goes the headline over at Zero Hedge.
Big summit meeting/presentation at Carnegie Mellon today announcing a massive, concerted roll out of infrastructure development focusing on making the Pittsburgh area THE preeminent region in the world for Artificial Intelligence development.
Over 100,000 new jobs expected to be generated within 3 years. (I would strongly encourage ANY able bodied young adult to consider re-locating to this area and prepare to work hard and earn some serious dinero.)
THIS is what is possible when the Mighty Marcellus and its siblings – the Utica and Upper Devonian formations – are able to supply many decades’ worth of economical fuel by which the insatiable demand for electricity can be satisfied.
The train is pulling out, folks.
Not too late to hop aboard.
Marcellus and Utica Shale Gas output in BCF/d, from Jan 2021 to June 2025 the average annual rate of increase has been about 0.45 BCF/d (OLS linear trend using monthly data). The mighty Appalachian is looking to be near peak, maybe in 2 to 5 years (2027-2032).
I would build AI data centers in Texas where there is natural gas, wind and solar and is likely to maintain cheap electricity rates.
Wasn’t gonna respond to your post, Dennis, since we’ve been over this MANY times before.
“The mighty Appalachian is looking to be near peak”.
Really, now …
The takeaway pipeline capacity has been running near 100% for years.
THAT is the biggest reason why a ‘ceiling’ has been reached in the AB.
(Your noted ~500 MMCFD multi year annual increase coincides exactly with incremental capacity expansion. The 2024 dip reflected the lowest gas prices ever recorded by the EIA. The ensuing rise was due to the – still constrained – introduction of the Mountain Valley Pipeline.)
No, Dennis. The fact that the Appalachian Basin produces about 13 TRILLION cubic feet a year despite only ~800 new wells in 2024 is largely due the incredible richness of this hydrocarbon resource along with the astounding levels of operational expertise being brought to bear.
(And just where the heck is that Red Queen anyways? Nary a peep about that bitch for years now.)
You keep relying upon projections from the USGS (good outfit, that), while many of us will continue to pore over ongoing production reports and operational innovations.
A few years out the AB could pass the 40 BCFD mark and maintain that level for decades.
Coffeeguyzz,
I use USGS information and information from Novi labs to arrive at my estimates. In October 2019 USGS undiscovered resources for Marcellus were about 97 TCF and reserves were about 135 TCF and cumulative production was about 36 TCF for a total TRR of 268 TCF, typically 100% of TRR is not recovered, usually it is about two thirds is profitable to recover so ERR would be 179 TCF. The scenario below is optimistic with Marcellus URR at 207 TCF (77% of TRR). Much different from your claims which are based on anecdotal well results and industry hype.
Utica/Point Pleasant Scenario URR=100 TCF or 67% of TRR(148 TCF).
Appalachia scenario using Marcellus and Utica scenarios presented earlier, URR=307 TCF. A more likely scenario would have Appalachian URR at 280 TCF with a thinner tail (27 TCF area) than in the chart presented.
Appalachian shale gas using a log scale below. If my estimate of Marcellus and Utica shale gas URR of 300 TCF is roughly correct and output continues at annual rate of past 12 months (12.24 TCF per year), then 50% of URR (150 TCF) is reached by Dec 2027 (current cumulative for Marcellus and Utica formations is 121.2 TCF for dry shale gas, marketed gas cumulative about 133 TCF). Declining output is likely after 50% of URR is reached, so the decades of output at 40 BCF/d assumption may be optimistic.
Growth was very impressive from 2008 to 2013, but less so from 2020 to 2025. Perhaps the lack of pipeline capacity expansion is because midstream companies see it as a bad investment, certainly, Ohio, Indiana, and other midwestern states would not be opposed to building pipelines.
Dennis,
You constantly make me laugh with so many of your sweeping, untethered-from-reality comments.
As more details emerge from yesterday’s Pittsburgh conference, I would amend my 40 Bcfd guesstimate above to a possible daily production of near 50 Bcfd.
2 projects alone – the Homer City operation and a coal-to-gas conversion at Shippingport have expectations of ~2 Bcfd consumption by themselves.
There are several statewide expansions mentioned and large projects planned for the NEPA area.
What it so amazing (to me, anyway) is that these massive, multi billion dollar power plants are – largely – going to be near 100% dedicated to providing electricity for their (mostly) adjacent data centers.
Of all the numerous knock on effects of these developments, one interesting impact might be a ‘pulling forward’ – time wise – of Deep Utica development in Pennsylvania.
Several of these plants are located virtually atop existing Utica wells … Homer City being one such case.
Coffeeguyzz,
Yes you also seem not to be tethered to reality. Generally the USGS estimates for TRR point to URR amounts that are 50 to 75% of the TRR estimate. For the Permian basin for example the USGS TRR estimate is about 75 Gb, the URR is likely to be about 50% of that. For the Bakken/Three Forks the likely URR will be about 67% of the USGS TRR estimate.
My estimate for the Marcellus and Utica has URR at about 72% of the USGS mean TRR estimate for those plays. The higher output goes and the longer it remains on plateau, the steeper will be the decline. Cumulative output for the Marcellus and Utica are at about 130 TCF for marketed (wet) gas, if my estimate is correct it points to 150 TCF cumulative as being near peak output and note that 50 BCF/d is about 18 TCF per year so peak is reached in just over a year if production jumps to 50 BCF/d.
In three years cumulative output reaches 185 TCF or 62% of URR if a 3 year plateau is maintained at 50 BCF/d and in 9 years at 50 BCF/d we reach 100% of URR and production would fall to zero. These are the kinds of scenarios imagined by those with a very loose association with reality.
There may be large Data center developments, but if they are depending on shale gas they will find the electricity will become quite expensive as these formations deplete. The shale gas resource is large, but it is not unlimited, despite what those who trust every investor presentation they see may believe.
The coal power plant at Shippingport is not necessarily going to be converted to a natural gas power plant.
Clearing and cleaning these sites and putting the properties back into their respective real estate markets will sustain the economic renaissance of these regions for years to come.
See
https://www.timesonline.com/story/business/energy-resource/2022/06/07/company-buys-bruce-mansfield-power-plant-with-plans-for-redevelopment/65359262007/
The 4.5 GW Homer plant will use about 0.75 BCF/d when fully operational (perhaps in 2030?). The plans for the Shippingport 2.5 GW coal facility are not really clear at this point, it seems that it may be a real estate development project rather than a natural gas power plant project, but it could be both, not sure they have concrete plans at present.
Dennis,
Welp, there ya go … an eggzellent display of information obtainment, analysis, and publication … only that the info is inaccurate (as well as being over 3 years old).
Gotta get away from our long time buddy – Google search – Dennis, and start rubbing shoulders with our new bffs like Grok, Chat, et al.
As per just the other day, the Frontier Group has announced that the Mansfield plant site is going to be re-developed as a CCGP.
Lots more detail available from either app, with some data only being in the public domain for a few hours now.
New day a’dawnin, mez amee.
Coffeeguyzz,
https://frontier-companies.com/shippingport-industrial-park/
This seems to be a simple steam natural gas plant not combined cycle. They are converting the old coal boilers to natural gas and adding a new “simple” natural gas plant (900 MW) Total capacity 3.6 GW of project to be completed by 2028, this would amount to about 0.6 BCF/d of natural gas consumption to the Homer project using about 0.75 BCF/d for a total of 1.35 BCF/d increased natural gas demand for these two projects. So probably no need for 50 BCF/d unless there are another 14 of these projects in the works.
From Chat GPT:
Natural gas power conversion: Frontier plans to invest ~$3.2 billion to transform the coal plant into a ~2.7 GW gas-fired facility, plus ~900 MW of simple-cycle generation—totaling ~3.6 GW by 2028
Note there is no mention of this being a combined cycle natural gas power plant, that seems to be incorrect.
They are repurposing the coal fired power plant (there is no such thing as a combined cycle coal fired power plant).
Dennis,
This back and forth brings to mind the ‘Dueling Banjos’ scene from the movie Deliverance.
(Unnecessary for me to guess who you think gets to play the part of the young boy).
Instead of musical instruments, we get to race to our new found wizard – AI app – to fact check whatsup.
Fascinating stuff.
Bottom line, both plants – Shippingport and Homer City – will use about 1.5 bcfd (700 MMcfd for HC, and 800 MMcfd for S. (The additional ~80 MMcfd for S above generating requirements will supposedly be used for on-site ancillary purposes. EQT is the supplier for both projects). So, yeah, I definitely think an AB production figure far above 40 Bcfd is not only likely, it is a certainty. Possibly before the decade is out.
Ultimate ‘high point’ is unknown, but coming within shouting distance of 50 Bcfd is not entirely unreasonable. Remember, there should be LOTS of knock on development in this region as a consequence recent events.
Coffeeguyzz,
If the USGS mean estimates are accurate, 50 BCF/d (18.25 TCF/year) gets us to the peak very quickly, TRR=400 TCF, peak at 200 TCF, already 130 TCF cumulative produced so 70 TCF to peak, 70/18=4 years.
Not difficult to see that 50 BCF/d, if it is reached, won’t happen for long. These projects look like they will become high cost as the shale gas resource depletes and the price of natural gas rises.
Coffeeguyzz said:
A few years out the AB could pass the 40 BCFD mark and maintain that level for decades.
Lets do some basic math. TRR for Utica/Point Pleasant and Marcellus/ Devonian is about 400 TCF for the mean estimate from the USGS, with about 130 TCF already produced, leaving about 270 TCF if 100% of TRR is produced. A more realistic estimate would be two thirds of TRR or 267 TCF, but we will use an unrealistic estimate for the optimists URR=TRR=400 TCF with 270 to be produced.
Note however that typically we expect a peak near 50% of URR so that would be at 200 TCF cumulative for the unrealistic URR of 400 TCF. So the peak is reached in about 5 years for the very optimistic URR estimate of 400 TCF at 40 BCF/d or 14.6 TCF per year.
Let’s say 3 decades (for “many” decades) so 438 TCF for 3 decades at 40 BCF/d, add this to 130 TCF already produced and we have 568 TCF for Marcellus and Utica URR or 142% of the TRR. There are those that think these estimates are realistic, they are wrong. Output from the Appalachian shale gas plays is much more likely to be about 300 TCF with a peak reached in 2026 or 2027 followed by decline.
Those that think otherwise are blowing smoke.
Dennis,
Definitely count me in the smoke blowing group that ‘thinks otherwise’.
I just briefly re-visited both the 2019 USGS Utica assessment and the far more granular report from West Virginia University (2015) on the Utica/Point Pleasant formations.
The ~800 Tcf recoverable – postulated by the WVU folks – definitely aligns with what I am seeing (at least in Pennsylvania. Ohio certainly seems to be going blockbusters as well).
Not only is the footprint greatly expanding (there were – literally – only a handful of Pennsylvania Utica wells producing when the USGS data was compiled), the output is absolutely blowing away the 3.5 Bcf EUR cums the USGS folks used as a mean estimate. *10,000 foot laterals, 1,000 foot spacing*
(Granted, the mean footprint was a gobsmacking 14 Million square acres. But this simply highlights both the scale of this incredible resource as well as the high degree of uncertainty involved when trying to pin down hard numbers).
No, Dennis, I will put more confidence in the 1,500 Tcf recoverable from the Mighty M and the Utica as the WVU folks project and as umpteen businesses seem to have accepted as they invest hundreds of billions of dollars into these projects.
Coffeeguyzz,
I will stick with the more reasonable estimates by the USGS, which have proven to be high (if we assume as some do that 100% of TRR is recovered which is never true in practice). I suppose you believe that the highest estimate you can find is always the correct estimate. I think the work by T Patzek and his students as well as the Assessments by the USGS are likely far more accurate.
Also note that current 12 month average output from Marcellus and Utica shale gas plays is about 34 BCF/d, if we assume increased demand from the two power plant projects you cite, it adds under 2 BCF/d by 2028 which brings us to 36 BCF/d, that’s about 14 BCF/d short of your 50 BCF/d guess, so I guess you figure another 28 power plants at an average power of 4 GW will also be coming online soon. We will see.
Businesses often make bad investments.
Dennis,
Just did some ‘what ifs’ using currently available info.
Consensus seems to call for 32 Mw increase in electricity needs in PJM region by 2030, much of it related to AI buildout. (That figure, btw, is significantly larger than your total New England capacity).
Using average figures for CCGP (162 MMCFD/MW) and Simple Cycle (230 MMCFD/MW) one arrives at about a 6 Bcfd increase in gas consumption if all 32 Megawatts came from new gas plants.
Not the case, naturally, as at least one nuke plant is getting prepared to come back into operation.
From my understanding, the bulk of this new electricity generation is coming from aeroderivative turbines (Simple Cycle) with some Reciprocating Engine types as well which are both somewhat less efficient than the larger CCGPs.
So, yeah, 40 Bcfd App Basin production looks to be coming soon.
Thanks for the Info. For many of these projects the lead time is 4 years or so, so that 6 BCF/d increase is needed over a 4 year period so about an increase of 1.5 BCF/d over 4 years if all of the electricity comes from natural gas. I have seen reports that suggest an increase of 300 TWh of demand form AI/data centers for the entire nation over the next 4 years. That amounts to 34 GW of extra power capacity needed, the 8.1 GW of power projects (2 that you cited) requires about 1.5 BCF/d, I doubt all of this capacity is built just in PJM, some will be in the Southwest, Midwest, and West, maybe some in Southeast as well. It won’t all come from natural gas, some projects will use solar, wind and batteries supplemented by grid power from natural gas, coal, and nuclear.
I doubt over next 4 years Appalachia natural gas demand increases by more than 3 BCF/d, but there may be more demand down the road, if natural gas prices remain competitive. They may rise as we export more and more LNG and as natural gas starts to deplete.
There seems to be a disconnect between EIA estimates and USGS estimates, the USGS estimates for tight oil have been very good once economic limits on recoverable resources are added to the mix. My analysis does the same for shale gas, the USGS estimates for Marcellus and Utica are recent (2019) using the same methodology used for tight oil plays,
Also see
https://fossil.energy.gov/app/DocketIndex/docket/DownloadFile/771
and
https://www.sciencedirect.com/science/article/pii/S2949891024008613
The second analysis seems optimistic ( I doubt URR will be this high based on USGS analysis) at a URR of 150 TCF. The first paper seems reasonable at roughly 190 TCF for Marcellus.
Coffeeguyz
What am I missing here?
32MW in new demand in PJM and 32MW is larger than total New England capacity?
T Hill,
I was just about to check in with the New England RTO site ‘iso-ne something or other’, when I figgered I’d touch base with my new info buddy, ol’ Chatbot.
First sentence “As of 2024, total installed generating capacity of New England ISO (ISO-NE) was approximately 31,000 Mw”.
(Amazing, quick source of info, this ai stuff be.)
The New England folks, like people ALL throughout the world, seemingly, might become more economically disadvantaged absent access to this new fangled AI stuff and its infrastructure.
But, yeah, next couple of years, PJM is fixin’ to have installed more new juice than currently serves the 6 state New England region.
Coffeguyz
Thanks for the reply. As I suspected, you were missing a few orders of magnitude between your posts. 32MW is not equal to 32,000 MW.
Watch out for your new AI chat bot friends.
T Hill,
Also note that the report I saw from McKinsey forecast a 34 GW increase in average power demand for the entire US over the next 4 years due to AI and data centers, while Coffeeguyzz is claiming 32 GW for just the PJM. My guess is that if the chat bot gives a low and high estimate, the high estimate would be chosen by Coffeeguyzz.
When we look at predictions for the US from 2023 to 2028, it is expected that average Power load will grow by 32 GW or 280 TWh of increased electricity demand due t data center growth (AI being a subset of data center use). My estimate is that PJM growth will be about 25% of US total growth or 70 TWh/8 GW.
From Chat GPT on data center growth (summary):
While Northern Virginia remains the largest established center, the biggest pace of new development is happening in Phoenix, Atlanta, central Texas, Ohio, and Indiana. Tech giants like Google, Meta, Amazon, and joint ventures like Stargate are driving major projects in those regions, often tied to AI infrastructure requirements.
The PJM grid is expecting an increase of 15 to 30 GW of data center load from 2024 to 2029, Ohio, Indiana, Pennsylvannia, and Virginia contribute most of this growth.
So my 25% estimate for PJM is wrong, about 70% of expected US data center growth over next 5 years may be in PJM. If all of this load is met with natural gas alone (22.5 GW average load increase), then demand for natural gas increases by 4 BCF/d, so Appalachia Shale gas output would need to increase to about 38 BCF/d by 2029 to meet the demand envisioned (most recent 12 month dry shale gas output from Appalachia was 33.7 BCF/d.)
T Hill/Dennis,
Good catch on my misrepresentation, T.
Shoulda been a ‘G’ (32 Gw) rather than an ‘M’ (32 Mw).
Dennis, I’m going to try to put more time into studying that linked Patzek paper above (if possible).
Quick scanning seems to be pretty solid analysis/predictions from my perspective.
Snippet from Section 4.3 … core drilling will last until 2093 (!!! almost 70 years out!).
Non core drilling will be half done by 2150 !!!.
This generally aligns with what seems to be presently unfolding in the AB.
Coffeeguyzz,
Note that the non-core areas are not likely to be developed, the core area results in 156 TCF for Utica/Point Pleasant, but their analysis assumes NGL at $80/b and gas at $4/MCF, for the dry gas part of the play (where NGL price is not a factor) where most of the gas is produced, if natural gas falls to under $2.50/MCF in 2024 $ the play is not profitable and output ceases. Also not that the scenario assumes production continues to 2090 at 180 wells per year and about 5 BCF/d for the Utica/Point Pleasant play. Increase output to 15 BCF/d and the plateau ends in 2047. I think the analysis is optimistic and assumes all of the core will behave the same as the sweet spots that have been developed. For the Permian the ERR will be about 50 to 60% of TRR, it could be similar for Utica/Point Pleasant where 60% of USGS TRR would be about 90 TCF for the ERR.
Note that the Marcellus paper results in a similar estimate to the USGS, when we drop the non-core areas we get a realistic ERR of 190 TCF for Marcellus.
Coffeeguyzz,
Indeed… the world is falling for the AI GLITZY Spotlight. Much like a Bright Hot Light attracting moths to their deaths.
The funny thing about Energy growth, whether, Oil or Natgas, has been propped up by massive debt and Financialization.
According to the new FSB – 2024 Report On Financial Intermediation, total Financial Assets including NON-BANK assets now total $486 trillion in 2023, up from the $462 trillion in 2022. I imagine that total for 2024 is well over $500 trillion with 50 % in the NBFI – Non-Bank Financial Industry.
Interestingly, Global Oil production has increased roughly 15% since the 2008 Global Financial Crisis, while total Global Financial Assets have Tripled from $150 trillion to likely $500 trillion.
Unfortunately, Energy Analysts or any Analyst in every other category of Industry FAIL TO CONNECT THE DOTS that this isn’t sustainable.
Thus, the citizens of the world, mostly in the West are banking on Cashing in some of the $500 trillion in assets in the future. The problem is… we only have enough energy to settle a mere Fraction.
THERE LIES THE RUB.
AI is a massive consumer of Energy at a time when the WORLD is hitting PEAK EVERYTHING propped up by PEAK FINANCIAL GARBAGE ASSETS.
GOD HATH A SENSE OF HUMOR.
steve
Steve,
I imagine you are aware that the proper way to look at these assets is in real PPP dollars rather than nominal value. A dollar in 2024 (using US CPI) is worth about 69% of a 2008 dollar, so the 500 trillion is about 343 trillion in 2008 $. Also a better metric is total energy rather than oil, which has increased by 24% from 2008 to 2024 (Energy Institute Data). The World has been creating more goods and services per unit of energy consumed as energy is used more efficiently. As fossil fuel use decreases as a proportion of total energy there is less waste in the system as much of the energy in fossil fuel simply creates waste heat, for coal and oil especially this is on the order of 65% waste heat per unit of energy consumed.
DC,
I imagine you are aware, Energy Growth drives GDP. No, the world hasn’t been creating more goods and services per unit of energy consumed.
That’s the Energy Tooth Fairy talking…
steve
Steve,
That is an old chart, you should do your own research and also use GDP in PPP terms as most international economists believe this is the better measure. A more up to date chart using 1990 to 2024 data from World Bank for real GDP and Energy Institute for Energy.
It is GDP growth that drives energy consumption, correlation is not causation. Demand drives supply. Note the pandemic, demand decreased supply followed.
DC,
Another causation chart. 🙂
steve
Clearer when we look at energy consumed per unit of real GDP produced. Data driven, no magic needed.
Energy and real GDP using market exchange rates 1965-2024
https://data.worldbank.org/indicator/NY.GDP.MKTP.KD
https://www.energyinst.org/statistical-review
Label on vertical axis incorrect, it should be trillions of 2015 US$
Energy per unit real GDP using market exchange rates (instead of PPP $) 1965-2024.
Dennis,
There could be a lot of factors to this.
Now have a look at corporate profits/GDP and Average hourly wage/GDP. Also net worth of the 1%/GDP to get a real insight of how backwards the world is going.
You can see this clearly as young families require a two income household to make ends meet and could still struggle to afford an average house in an average area.
The financialisation of the global economy has destroyed the younger generation ability to get ahead financially regardless of how hard they work.
U.S data
From tradingview.
DC
Also if you look at SPX/Average hourly wage. In the late 70s to early 1980s it was around 20 hours of work to buy 1 unit or share of the S&P100, Now it is ~ 200 hours of work to buy 1 unit or share of the S&P100.
This means 10x more work to acquire a basic financial asset. This is hyperfinancialisation. Essentially whats holding up GDP is net worth of the 1%, corporate profits, and government spending.
All these metrics really show a K shaped economy. Rich getting richer, poor getting poorer.
Iron Mike,
I agree that wealth disparity is a big problem, but data is rather limited at the global scale. One solution to the problem is progressive taxation and changes in tax law so that the wealthy are less able to shelter their income from taxes. In the US we could go back to the tax code of 1960 with tax brackets adjusted for inflation. Prior to the Reagan revolution in the US, there was far less income inequality in the US. Similar policies could be put in place throughout the World, but generally the wealthy do a very good job of convincing voters that policies favoring the wealthy are best so until the average person realizes this and votes for policies that favor the middle class rather than the wealthy nothing will change.
Note that higher taxes on the wealthy could be used to pay down government debt to zero over time.
I remember Greenspan fretting that Clinton was going to pay off the national debt, and remove one of the Fed’s tools.
“young families require a two income household to make ends meet and could still struggle to afford an average house in an average area.”
This is a bit more complex. Wages have grown, but much slower than income from capital. People are greatly disappointed by this relative stagnation. OTOH, wages HAVE grown a bit – they haven’t fallen. It’s worth keeping in mind that the average home is much larger and better built compared to 50 years ago. People could still afford a 1970’s house on a single income, but their expectations have risen. It’s perfectly reasonable for their expectations to rise, but that’s still not quite the same problem.
It’s kind of funny how economists stick to metrics that include the word real, which has no meaning in the context used, to try and prove their points.
We know from factual information and research that mining a tonne of copper takes a lot more energy now than it did a couple of decades ago, from research performed by Calvo and Mudd et al.
A bit of common sense about the quantity of materials that now have to be moved to gain access to a tonne of copper also hints at the same. It’s the same with every other metal or mineral humanity uses.
Throughout history humans have always used the closest, highest grade resources first, leaving the lower grade, more distant and deeper, to later.
Guess what, all of the ‘goods’ we make and use are made of materials, those pesky things of lower grades and greater distance away. However, because we put bells and whistles on some human appliances like a fridge, we call it higher value for GDP purposes, so we don’t see the real inflation of the price.
Then we change CFCs to HFC in all heat pumps including fridges, which don’t have the same lubrication in compressors, therefore shortening the life of the appliance, but don’t count that shortened life as a ‘cost’ for GDP purposes.
Then, as Thompson correctly states, we add all sorts of unnecessary services into the GDP to show it’s grown and how everyone is ‘better off’ (on average), when in reality the median person today is far worse off than decades ago.
We can use lies, damn lies, and statistics to show whatever we want to show to keep the public at large from demanding equality, by hoodwinking them that it exists..
For Dennis, it doesn’t matter what esteemed journal or document the nonsense/rubbish came out of, it’s still nonsense/rubbish…
Just because million or billions of people believe something, does not make it real, mass delusion is not exactly rare in humanity at all.. Ghosts, goblins, gods, witches, tulips, dot com bubbles, etc, etc.
What are the best neighborhoods in Pittsburgh? Planning to move there to capitalize on the boom.
IIRC, Murry Hill is nice. Had an aunt in the area.
I know, you’re just kidding. Still, fun to think about.
Klim,
If you are addressing me, I am personally unfamiliar with that area.
That said, I have been encouraging a young acquaintance – who is keenly interested in making a career in one of the trades – to consider re-locating to that region as the economic prospects are the strongest that I have ever witnessed.
Granularly, we checked the real estate situation in Homer City, 50 miles east of Pittsburgh and site of the largest single construction project in the history of the Commonwealth.
Average home selling price is ~$130,000 due – largely – to the long running economic decline in that region (coal/steel being the historical economic engines).
The little that I heard/watched of that presentation yesterday, a representative from Google claimed that the company was investing tens of millions of dollars to promote the training of electricians/electronic technicians so as to meet the incoming tsunami of crucially needed (and high paying) job openings.
Should you go to this region, Klim, you ought to be aware that the rippling consequences will be VERY far flung – both geographically and broadly vis a vis a wide array of activities.
Early adapters stand to benefit the most.
Good luck.
Appalachia Rising!
Thank you, Coffeeguyzz and Nick G.
Pittsburgh reinvented itself in many ways since the collapse of the heavy industries.
several years ago, a thesis/research from Penn State opposing shale development claiming if 1/10 of the shale field is covered with solar, more energy will be generated by renewable than shale reserve.
all counting on AI to make US consume more energy
https://ourworldindata.org/grapher/per-capita-energy-use?tab=chart&country=JPN~USA~KOR~TWN~OWID_HIC~OWID_EU27~CHN~IND
Sheng Wu,
Estimates from various sources claim a doubling to tripling of AI-sourced US electricity consumption in ~5 years time.
Astounding!
The frenzy is such that Elon Musk is reportedly buying/importing a complete CCGP from overseas for his Memphis site as the backlog for new turbines is too lengthy (5 years from GE, Siemens and Mitsubishi).
The amount of capital being invested is simply mind blowing … now approaching a trillion dollars in toto.
These developments are increasingly being touted as The New Industrial Revolution.
Again … availabe and economic electricity is the sine qua non in these matters.
The Mighty Marcellus et al are enabling this wondrous turn of events to become manifest right before our eyes.
USA is amazing. According to the API, the USA put an extra 2.7 million barrels per day into storage last week [excluding the national reserve], over and above what we produced, imported and used. Pipeline capacity must be much more than I ever thought possible.
Until they start quantifying oil production in terms of net energy, all the posts on production are worthless.
–With our new energy landscape has come a new and increasingly prominent metric. Energy Return on Investment (EROI) is a ratio used to measure the amount of usable energy that can be extracted from a particular energy source compared to the amount of energy required to extract, process, and distribute that energy source.– https://jpt.spe.org/plummeting-energy-return-on-investment-of-oil-and-the-impact-on-global-energy-landscape
If we use 10 barrels of oil to extract 20 barrels of oil today in the shale formations the total oil production is not cited as 20, the conventional 10 is added to the total. But it does nothing for society as a whole, it just puts a lot of money in the pockets of the company and the refiner and the brokers and the banks that loaned the money. There is nothing left over to elevate society as a whole. That is why society is crumbling around us while oil extraction is reported as being as high as ever.
“But it does nothing for society as a whole”
I have diffuculty in understanding statements like this. Does it mean that we can shut it down and society will continue on as is? Or, is this another: “it depends upon what the deinition of “nothing” is”? Similar to someone who claimed that something depended on what the definition of “is” is.
https://www.rionegro.com.ar/energia/ranking-vaca-muerta-cuales-son-las-empresas-que-mas-gas-le-sacaron-a-la-roca/
Argentina oil and gas have hard time figuring out the correct unit for gas, according to this news, Vaca Muerta produced already 122 million million cubic meters, or 122 followed by 12 “0”s, i.e. 122 Trillion Cubic Meters.
IEA predicts major supply surplus.
https://iea.blob.core.windows.net/assets/493a4f1b-c0a8-4bfc-be7b-b9c0761a3e5e/Oil2024.pdf
This could very well be right, The energy Institute data shows more crude was refined in the last two years than any other 24 month period. Yet oil prices are actually $60 below the highs of 13 years ago, indicating plenty of oil in storage.
Why Oil Prices Could See a Significant Upside Shift
More grist for OPEC’s spare capacity.
Standard Charter thinks that OPEC’s spare capacity is overblown.
“StanChart believes this erroneous assumption about spare capacity has been a big drag on oil prices, and the implications for the whole forward curve of oil prices could be potentially profound once traders realize that roughly two-thirds of the capacity they thought was available on demand does not actually exist. This makes the analysts bullish about the general shape of their forecast 2026 price trajectory (Figure 32), i.e., a set of significant upward shifts as opposed to the flat trajectory seen in the market curve and in analyst consensus. In other words, oil prices could have as much as $15/barrel upside from current levels.”
Will we have a better idea of OPEC’s spare capacity by year end as all of their cuts have been unwound?
https://finance.yahoo.com/news/why-oil-prices-could-see-230000043.html
New posts are up
https://peakoilbarrel.com/opec-update-july-2025/
and
https://peakoilbarrel.com/open-thread-non-petroleum-july-18-2025/