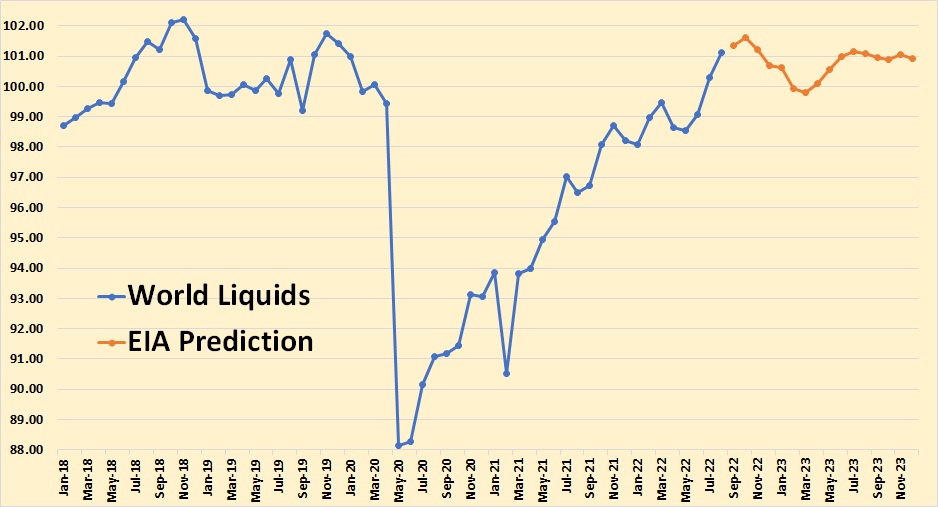
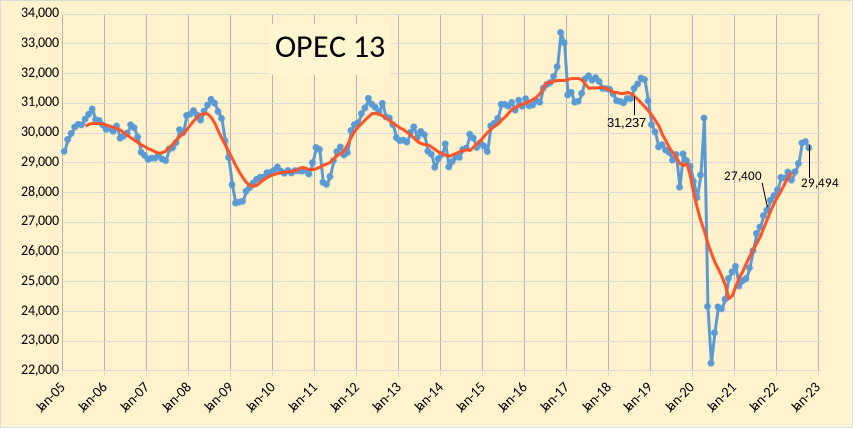
The EIA’s Short-Term Energy Outlook gives the USA data as C+C as well as total liquids, OPEC as crude only, but the rest of the world is Total Liquids only. All data in the charts below are million barrels per day.

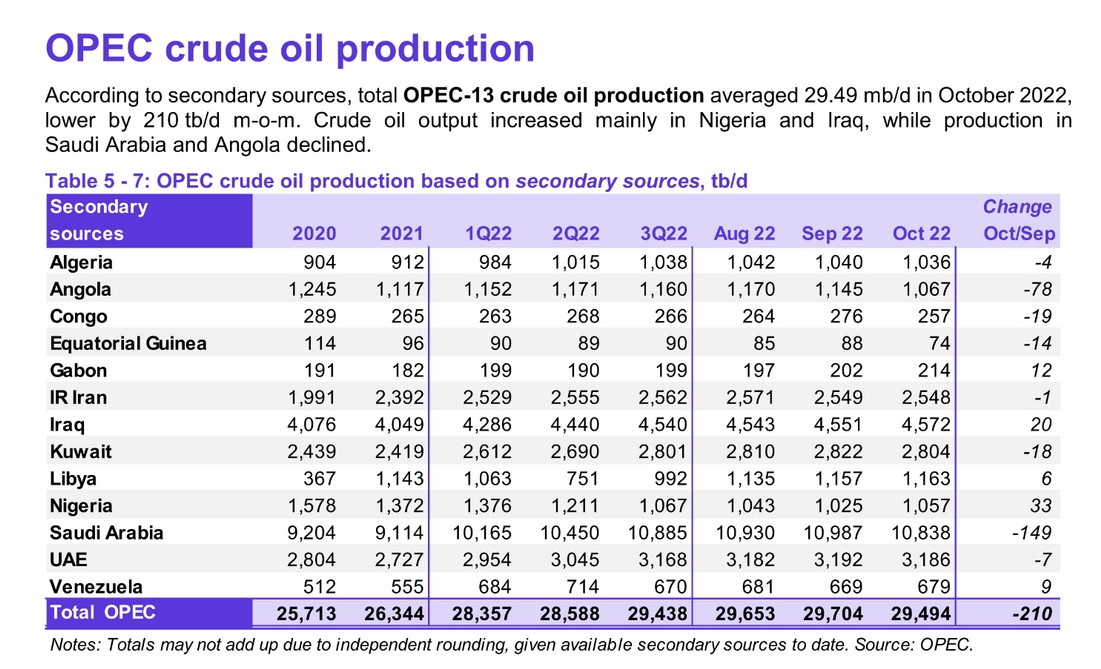
The known data is through August 2022, the rest, in red, in million bp/d, is the EIA’s estimate. However, this is Total Liquids, not C+C. And Total Liquids is not a good indicator of oil production as the below table shows.
Read More

