A Post by Ovi at peakoilbarrel
All of the oil production data for the US states comes from the EIAʼs Petroleum Supply Monthly. At the end, an analysis of a three different EIA reports is provided.
The charts below are updated to December 2019 for the 10 largest US oil producing states (Production > 100 kb/d).
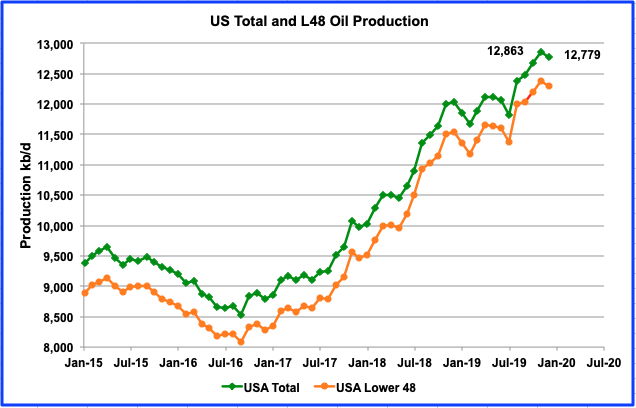
The data from the February EIA report shows that US production dropped from November by 84 kb/d (0.61 kb/d) to 12,779 kb/d in December. Since June, the US has increased output by an average of 164 kb/d/mth. Is this drop the beginnings of slowing LTO growth going into 2020? Today’s low oil prices are not providing any incentive to increase drilling activity. Maintaining current production and lowering expenses may be the new mantra.
For the lower 48 states, production decreased by 81 kb/d.
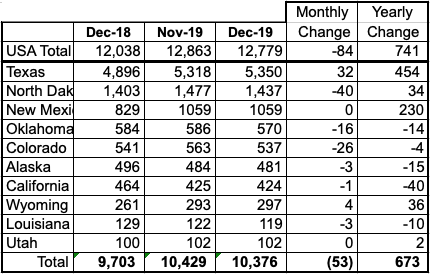
Listed above are the 10 states with production greater than 100 kb/d. These 10 account for 10,376 kb/d (81%) of total US production of 12,779 kb/d in December. US year over year production fell below 1000 kb/d to 741 kb/d. For last month, November, the year over year increase was 1,248 kb/d.
What is different in this table from previous ones is that all of the major states. except Texas, Wyoming and Utah had a decline in output. Of the total decline of 84 kb/d, these top states contributed a decline of 53 kb/d. The biggest decline occurring in North Dakota.
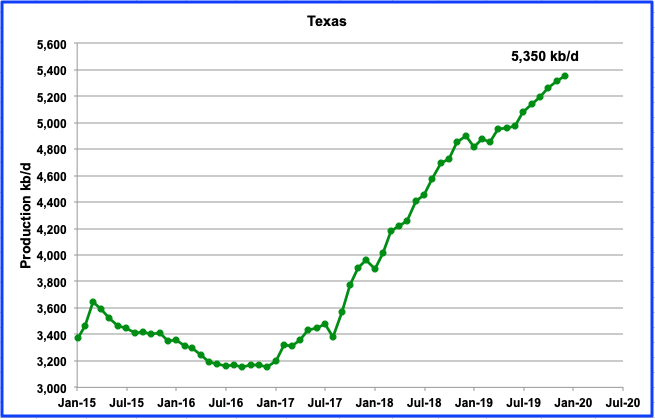
Texas December production grew by 32 kb/d to 5,350 kb/d from 5,318 kb/d in November. Note that November was revised down from 5,329 kb/d in the November report to 5,318 kb/d. Texas production is now larger than OPEC’s second largest producer, Iraq.
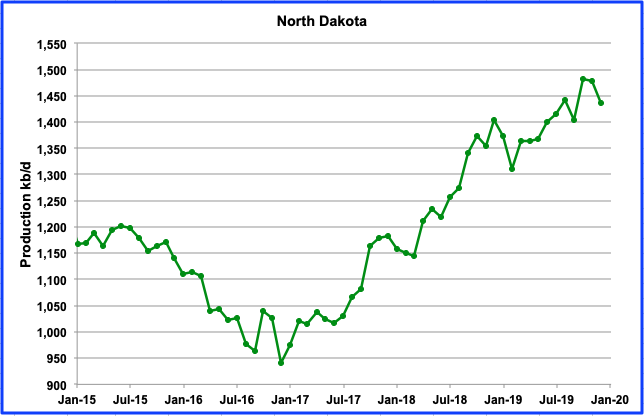
North Dakota’s oil production was down by 40 kb/d in December to 1,437 kb/d. Since August the number of rigs operating each month has almost remained constant as it wandered between 47 and 55 with 52 operating since late January and into February.
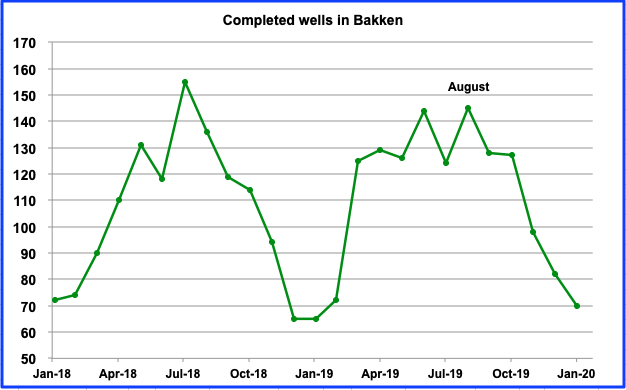
The number of completed wells in the Bakken started to drop in September 2019 and has continued to decline up to January. In January 70 were completed, whereas 145 were completed in August. Since August, with completions in decline, output has been essentially flat wandering around 1,440 kb/d up to November. However as noted above, there was drop in December of 40 kb/d. Will the drop continue as the number of completions continues to decline and the price of oil stays below $50?
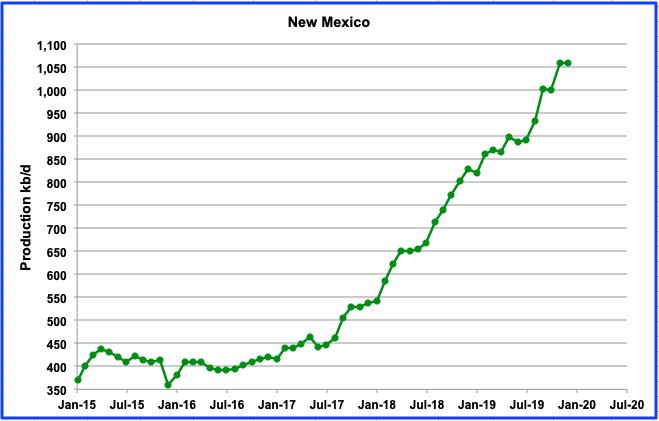
Output in New Mexico was flat from November to December and stayed above the 1000 kb/d level. November production was revised down from 1,063 kb/d to 1050 kb/d. While Texas has been getting much attention regarding its production growth, New Mexico has also increased its output and recently has exceeded 1 Mb/d. Since July, it has increased its overall output by 158 kb/d. On a YOY basis, New Mexico has increased its output by 230 kb/d.
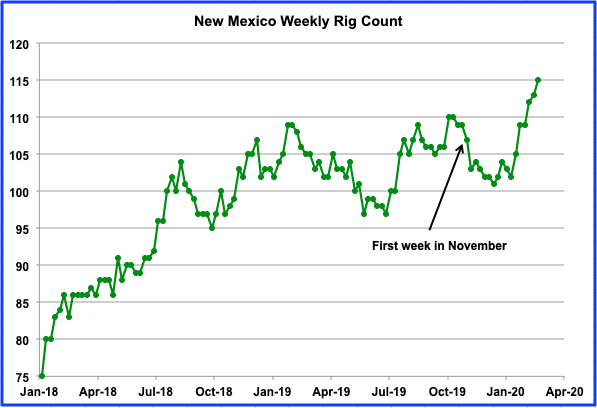
Above is the weekly rig count for New Mexico. While there were an average of 104 rigs operating in November and December 2019, by the third week in February 2020 (Feb 28), 115 were in operation. This is a good indicator of further growth coming from New Mexico.
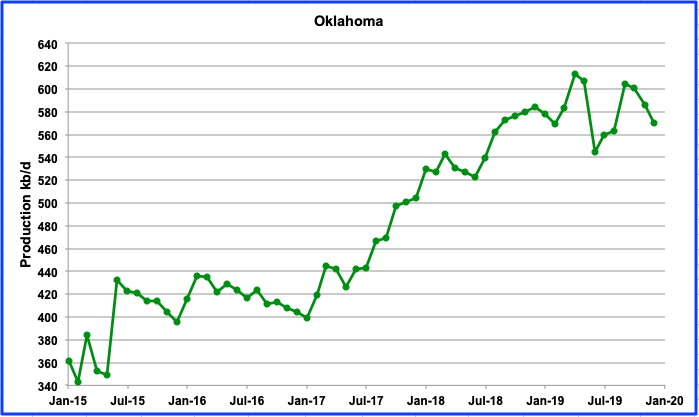
December marked the third month in a row that Oklahoma output was down. December production was down by 16 kb/d to 570 kb/d. Oklahoma appears to be entering a decline phase. The highest production occurred in April 2019 with production of 613 kb/d. As noted previously, there has been a loss of drilling interest in Oklahoma due to the complex geology that stymied hopes for a “Permian Jr”.
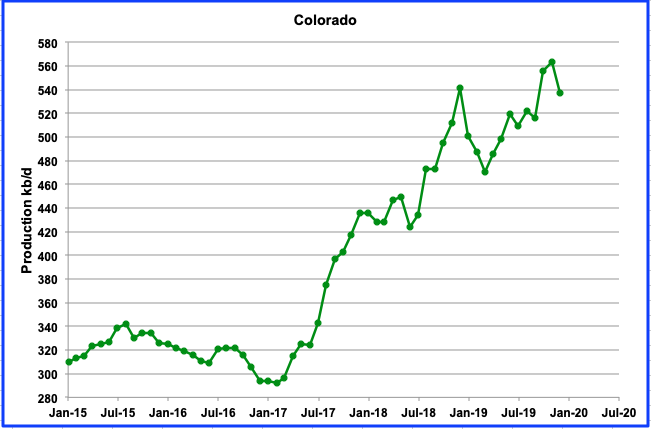
Colorado production declined by 26 kb/d in December to 537 kb/d from 563 kb/d in November. The small output rise in November, followed by the drop in December could be the first signs of the impact of new local environmental regulations. It may take a few more months to see if the regulations continue to slow drilling and output.
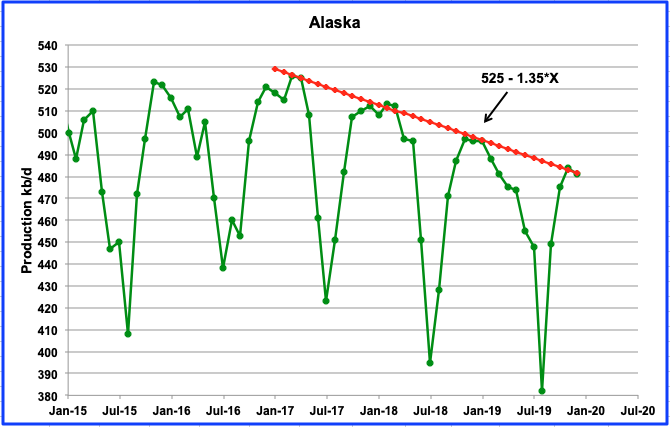
Alaska output decreased by 3 kb/d in December to 481 kb/d and touched the down trend line, which is showing decline rate of 1.35 kb/d/mth or 16.2 kb/d/yr.
“The trend of gradually declining output is expected to continue until several new projects now in development come on line. Fiord West, a satellite within the Alpine field, is expected to begin production in late 2020 with peak output estimated at 20,000 barrels per day, ConocoPhillips’ Lowman said. Frontiersman.
The 20 kb/d increment near the end of the year will mostly be offset by the estimated yearly decline of 16.2 kb/d.
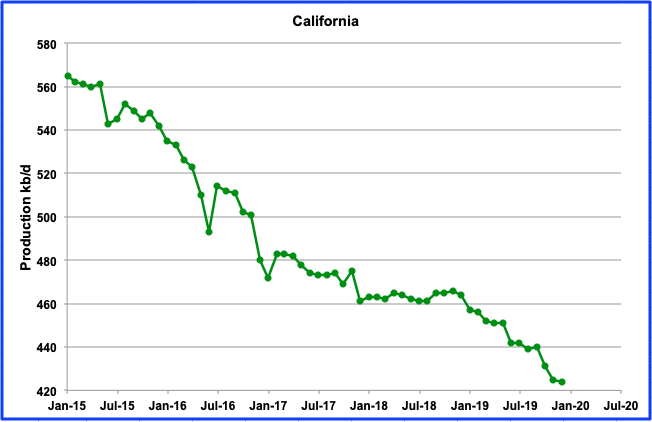
California continues its slow decline. December production was down by 1 kb/d to 424 kb/d.
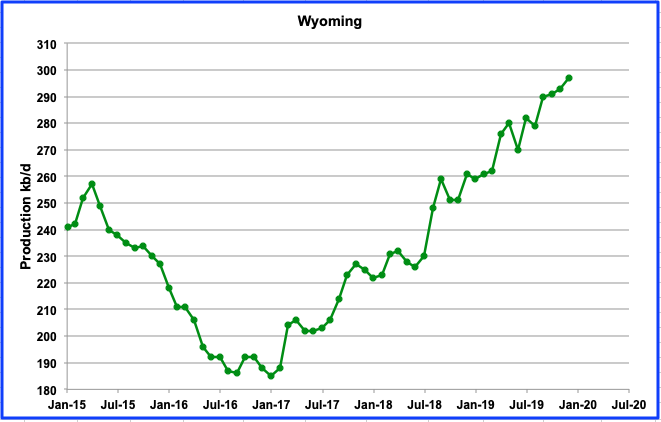
Wyoming continues to increase its output and reached a new high of 297 kb/d in December with a minimal increase of 4 kb/d. It continues to benefit from the northern portion of the Niobrara LTO basin being situated in Wyoming. Wyoming currently has 23 rigs in operation, after adding 2 in the fourth week of February,
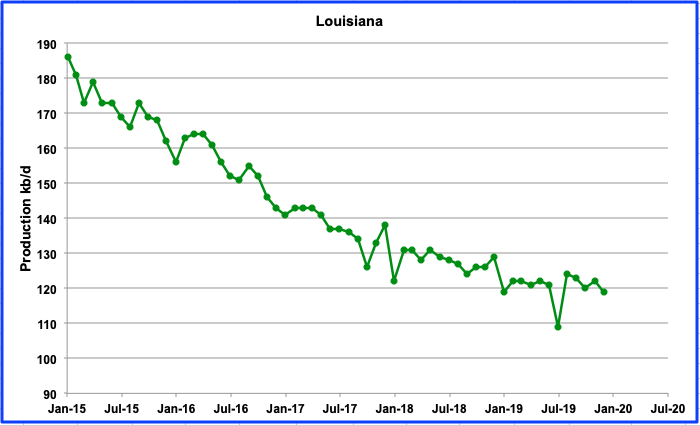
There was little change in Louisiana output for December, down by 3 kb/d to 119 kb/d. Production has been essentially flat bouncing around 120 kb/d since January 2019.
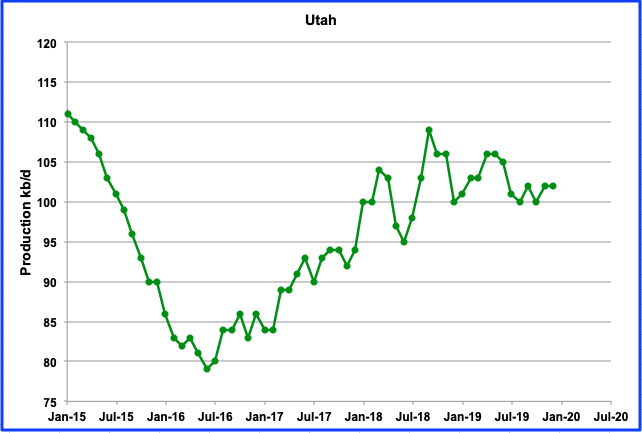
Utah’s output is holding steady at slightly over 100 kb/d due to its new conventional field but is giving indications of starting a new slow decline. December production was 102 kb/d and flat from November 2020.
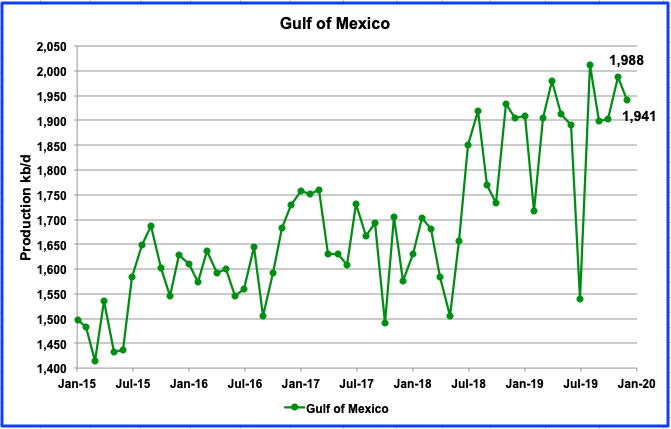
The GOM’s output dropped by 47 kb/d in December to 1,941 kb/d from 1,988 kb/d in November. The STEO is projecting January production to remain low at 1,930 kb/d.
Ducs
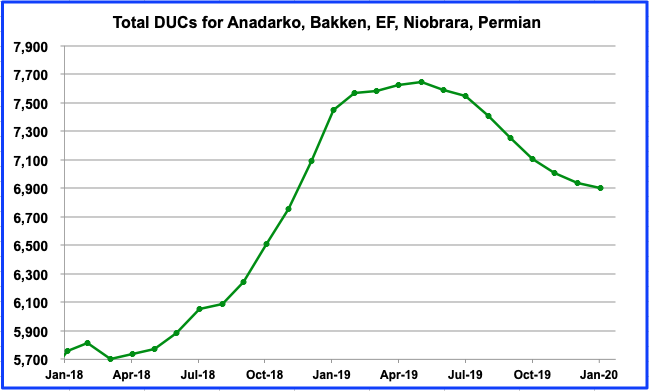
This chart shows the number of DUCs in the five primary oil producing basins. In January, the number of DUCs declined by 31 to 6,905. The biggest decline occurred in the Anadarko, 50. On the other hand, the Niobrara increased by 10 and the Permian by 14.
UPDATING EIA’S DIFFERENT OIL GROWTH PERSPECTIVES
1) DRILLING PRODUCTIVITY REPORT (DPR)
The Drilling Productivity Report (DPR) uses recent data on the total number of drilling rigs in operation along with estimates of drilling productivity and estimated changes in production from existing oil wells to provide estimated changes in oil production for the five key tight oil regions.
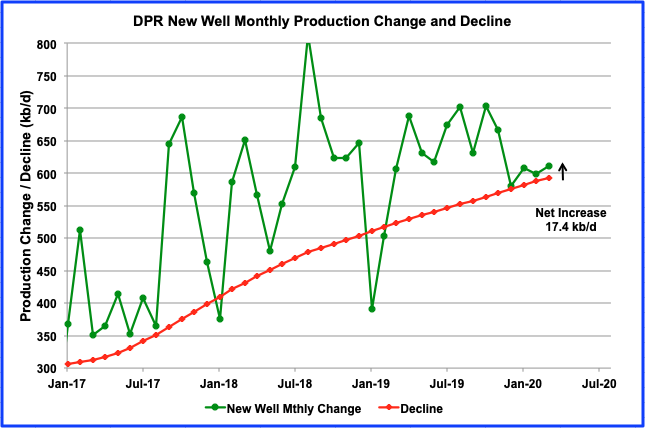
This chart shows the monthly change in new well oil production and the decline from all previous producing well for the onshore L48 states. The difference between the two gives the projected output increase for all tight oil basins. For March 2020, the projected increase is 17.4 kb/d.
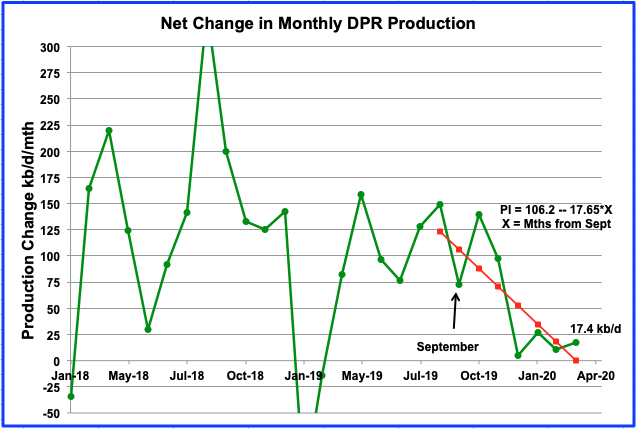
Above is the DPR net growth chart updated to March 2020 and is the difference between the monthly change in new well oil production and the decline from all previous producing well for the onshore L48 states. There has been quite a revision to the data for 2019. The March report now shows that December 2019 net growth fell to 5.3 kb/d. In the January report, it was 54.6 kb/d.
Going forward from December 2019, the DPR is projecting growth for the L48 LTO regions to bounced around 20 kb/d. These projected small increases of 20 kb/d/mth since December are consistent with the STEO forecast which is indicating a peak in the lower 48 states in May and a peak in the L48 minus GOM in October. There is very little growth projected from March to October. These current WTI prices below $50/bbl are not going to help.
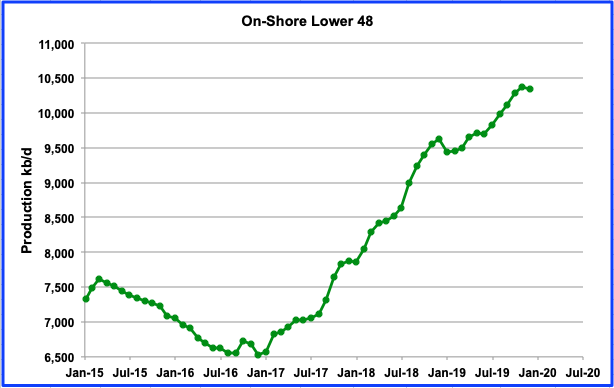
The onshore L48 output fell by 36 kb/d in December. According to the DPR, output should have been similar to November with a small increase of 5 kb/d. The STEO is projected an increase of 50 kb/d over November and the MER is showing a decline of 16 kb/d. The LTO was projecting an increase of 31 kb/d. The MER is closest to the actual drop of 36 kb/d.
It should be noted that all of the projected increments are much less than the typical increase of 100 kb/d/mth. The takeaway message seems to be that production growth going forward may be slowing.
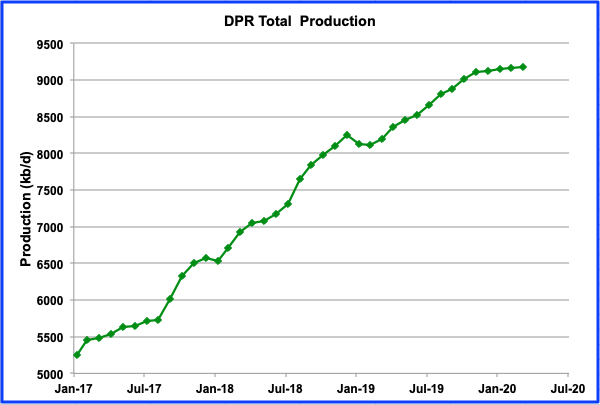
Above is the total oil production from the 7 basins that the DPR tracks. Note that the DPR production includes both LTO oil and oil from conventional wells.
From February 2019 to November 2019, output grew at an average rate of 111 kb/d/mth. However starting in December, output slowed to an average rate of 15 kb/d/mth, similar to the rate shown for March in the previous chart; “Net Change in Monthly DPR Production”. The reduced output rate is associated/consistent with the monthly decline in the number of well completions shown below.
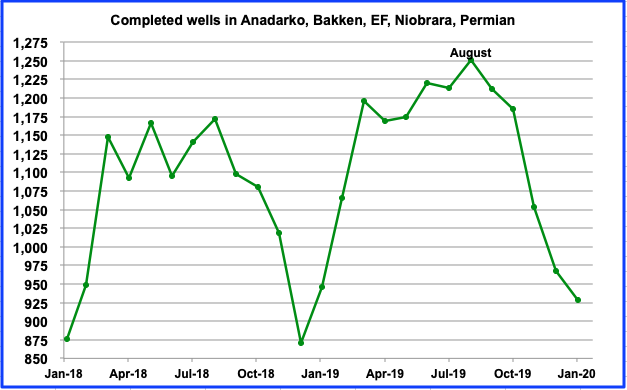
As can be seen, the number of completed wells from August 2019 to January 2020 dropped from 1,251 to 929 respectively, a drop of 322 wells.
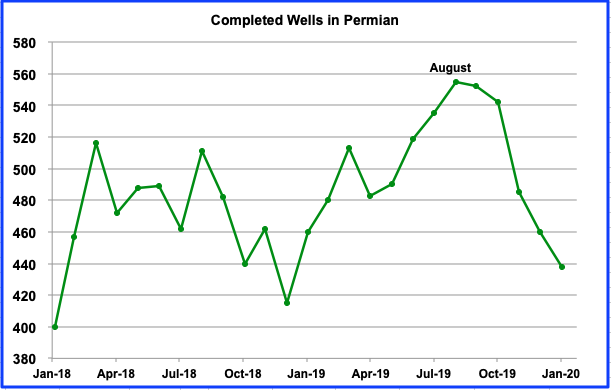
Of the 322 decrease in well completions since August, 117 are from the Permian. Interestingly, while completions are decreasing, Texas was only one of three states that showed a production increase in December of 32 kb/d.
2) LIGHT TIGHT OIL (LTO) REPORT
The LTO database provides information only on LTO production from seven tight oil basins and a few smaller ones.
There was a significant downward revision to the LTO data in January 2020. The revisions shows up as a slowing in LTO monthly production growth, especially over the last three months, as can be seen in the chart.
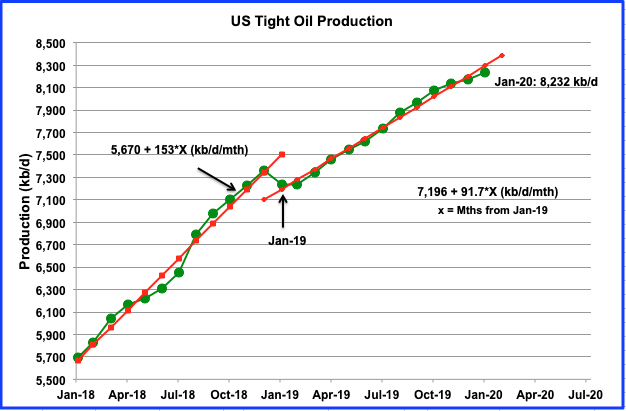
Estimated output from all LTO basins in January was 8,232 kb/d, an increase of 61 kb/d from 8,171kb/d in December. However the previous December report stated that LTO December output was 8,252 kb/d. The January report has now revised the December output down to 8,171 kb/d, a reduction of 81 kb/d.
The average monthly increase from January 2019 to January 2020 is 91.7 kb/d/mth and is 40% lower than 2018. However, the average rate over the last three months has slowed to 51 kb/d/mth, a 44% reduction. It is also 1/3 of the 2018 rate of 153 kb/d/mth.
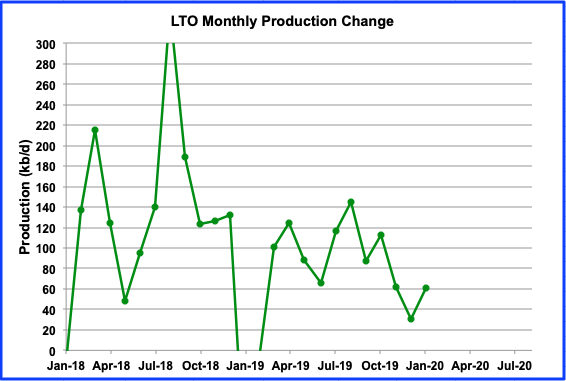
This chart shows the monthly addition to LTO output and is similar to the DPR chart above. The production increase in January was 61 kb/d and is an increase over December. The current January LTO report confirms the DPR trend of slowing growth starting in October to January 2020. However while the LTO report is projecting an increase of 61 kb/d in January 2020, the DPR is estimating a smaller growth rate of 27 kb/d.
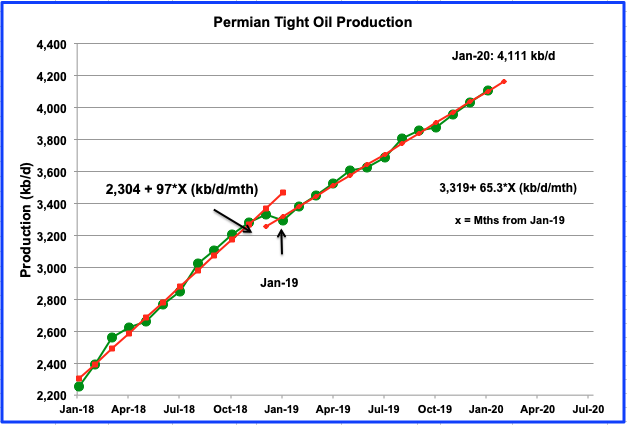
The Permian is the largest contributor to US tight oil growth. As can be seen in this chart, the average growth rate for 2019 is lower than 2018. While the average monthly growth rate for 2018 was 97 kb/d/mth, the average rate for 2019 is lower at 65.3 kb/d/mth. However in this case, averages are deceptive. The January report provides updated monthly data that indicates the average LTO growth rate from October 2019 to January 2020 increased to 79 kb/d/mth.
3) SHORT TERM ENERGY OUTLOOK (STEO) REPORT
The STEO provides projections for the next 13–24 months for C + C and NGPLs production. The February report presents EIA’s oil output projections out to December 2021.
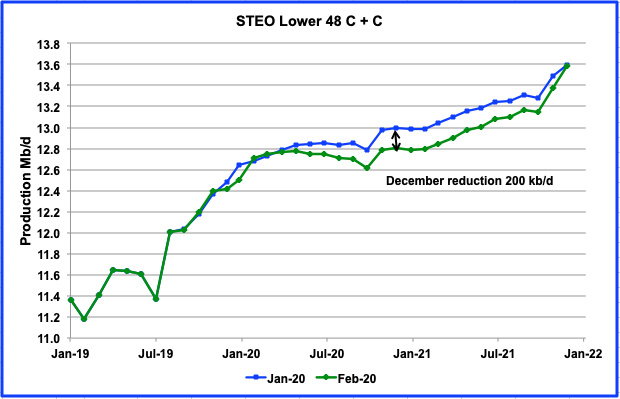
This chart compares the February 2020 STEO projection with January 2020 report. The estimated output for December 2020 has been reduced by 200 kb/d. As noted last month, the increase in production for 2020 in the January report was surprising since the STEO was slowly lowering it future output each month in the previous reports. What is interesting to note is that the output from May 2020 to December 2020 in the STEO February report is very close to the original December 2019 report, i.e., within +30 kb/d to -10 kb/d.
From December 2019 to December 2020, US production is estimated to increase by just 390 kb/d. For 2021, the STEO is projecting an increase of 780 kb/d, double the 2020 increase. Surprising?
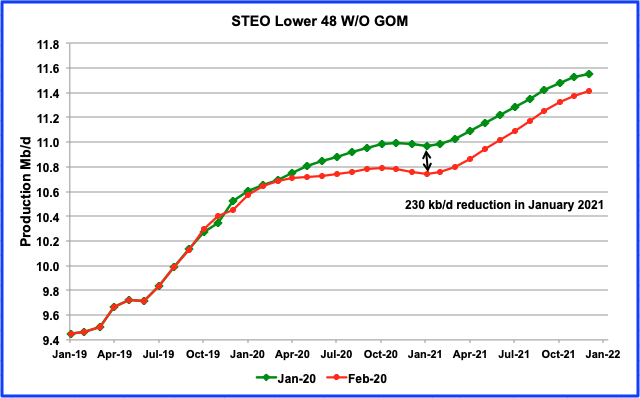
This chart provides a clearer picture of what the STEO is projecting for the Onshore L48 states and compares the December 2020 STEO projection with the February one. Similar to the previous chart, there has been a significant reduction across the board for onshore L48 oil output. The biggest revision occurs for January 2021 where the estimate has been reduced by 230 kb/d. For December 2021, the reduction is 140 kb/d.
The projected increase from December 2019 to December 2020 is 310 kb/d.
I was hoping to include an updated world oil production chart to November but the EIA did not release it today as it usually does at the end of the month.
175 responses to “USA December Oil Production Drops”
Ovi,
Excellent post and the decline of 84 kbd crude oil from Nov to Dec 2019 in your first chart could be the start of crude oil production plateau according to recent 2019Q4 reports from 75 top US shale oil companies.
If this plateau to 2020Q2 is extended for the rest of 2020, then it is likely that total US crude oil production for 2020 is average 12.57 mbd, an increase of 0.34 mbd from 2019 average 12.23 mbd from recent EIA monthly. https://www.eia.gov/petroleum/production/
Occidental, which is now the biggest US shale oil producer at 0.5 mbd after merging with Anadarko, gave clear guidance about their Permian Resources production being on a plateau. For 2019Q4 production was 476 kboed (crude, NGL, gas). For 2020 production guidance is between 465-475 kboed.
https://www.oxy.com/investors/Documents/Earnings/OXY4Q19ConferenceCallSlides.pdf
The forecast plateau also shows a small drop from 2019Q4 to 2020Q1. There was also a similar slowdown from 2018Q4 to 2019Q1.
Tony
You have put in a lot of work to collect all of that production data from so many producers. Your efforts have been rewarded with the EIA’s release of the December data.
I am trying to understand your assumptions for arriving at the 2020 US production average of 12.57 Mb/d. Starting with the December production of 12.779 Mb/d for January and using a monthly decline of 38 kb/d, results in a year end production of 12.361 Mb/d and an average of 12.57 Mb/d.
Ovi,
It is a lot of work to collect the data but now it’s easier as only updates are required.
My assumptions for 2020 US average 12.57 mbd is that there is no growth from the rest of US outside of shale crude oil, that shale crude oil production from the 75 companies can be grossed up and that the plateau from 2019Q4 to 2020Q2 extends to Dec 2020.
From my company data 2019 average is 6,617 kbd. The plateau average is 6,910 kbd and the difference grossed up is (6910-6617)/87%=337 kbd or 0.34 mbd. The latest estimate of 2019 US crude oil production is 12.23 mbd so my 2020 guess is 12.57 mbd.
https://www.eia.gov/petroleum/production/#oil-tab
However, I believe that the latest EIA LTO production numbers will be revised down further. Dec 2019 LTO was 8,171 kbd. I can use my model to estimate the 2019Q4 production in EIA LTO by using the 87% ratio. My estimate is 150 kbd less than EIA LTO. Therefore the Dec 2019 LTO number will probably be revised down again by 150 kbd.
This means that the Dec 2019 total US crude 12.779 will be revised down by 0.15 mbd to 12.63 mbd. Using the difference of -70 kbd from my model 2019Q4 to 2019Q1, and grossing up the difference to 80 kbd, my guess for 2020Q1 is 12.63-0.08=12.55 mbd, so Jan 2020 production should be around 12.55 mbd.
HFIR recently forecast that total US shale production would increase by 0.424 mbd which is a bit higher than my 0.34 mbd.
https://seekingalpha.com/article/4325330-u-s-shale-oil-production-all-left-is-permian-and-wont-last-forever-either
HFIR is predicting that US crude will drop to 12.5 mbd in May 2020.
https://seekingalpha.com/article/4328423-u-s-oil-production-disappoints-to-downside-in-december
WTI is just under $45 now. If WTI price stays at these levels for the next several months, my forecast could prove to be too high.
Tony,
Your average for the 75 companies is 6617 kb/d for 2019, the average for 2019 from the EIA tight oil data is 7702 kb/d. 6617/7702=85.9%.
For your 2Q2020 estimate you have about 7000 kb/d and 7000/0.859=8149 kb/d. If we assume the 2020 plateau is at 8149 kb/d, then 2020 average annual output would be about 8150 kb/d, which would be 450 kb/d higher than the 2019 average. Under a low oil price scenario your forecast may be correct. The next iteration of the STEO may revise oil prices lower and might match your forecast. The last STEO has WTI falling to only $50.5/bo, this may be revised.
Tony,
You should look at shale profile data from about Jun 2019 to decide the appropriate percentage for your top 75 shale companies. The most recent shale profile data is incomplete so that cannot be used.
Do you actually have 10Qs for 75 companies? If you do not, what month (or quarter) does the 87% estimate come from?
Seems it is just as likely that incomplete reporting from shale profile may be resulting in too small a denominator for your “total tight oil” estimate which may result in your 87% estimate being too high. In addition your estimates for private companies from shale profile are likely to be too low due to incomplete data at shaleprofile. If we take your 2019Q2 estimate of about 6500 kb/d for top 75 companies and divide by EIA Q2 estimate we get about 85%. For Q42019 at 85% we would get 6900 kb/d for top 75 companies, based on the EIA LTO estimate.
This seems more likely than a large revision to the EIA’s LTO estimate. If we remained on a plateau for 2020, the annual increase from 2019 to 2020 would be about 430 kb/d for LTO from 7700 kb/d in 2019 (annual average) to 8130 kb/d in 2020 (annual average in 2020 equal to 2019Q4 average).
Low oil prices for all of 2020, might make such a forecast realistic, unclear if oil prices will remain low for all of 2020, low oil output as in this forecast might lead to higher oil prices which in turn would tend to lead to higher oil output.
Dennis. Just read Continental’s conference call transcript. CEO says WE WILL BE cash flow positive if WTI stays below $50.
Continental is projecting flat oil production in 2020 at $55 WTI. So assume that means falling production if WTI stays below $50.
Many analysts asking much more pointed questions than in the past. I guess that is what happens when share prices tank as they have.
In fact, CLR also stated they were considering foregoing CAPEX to buy shares on the open market.
Worth reading. I think there are also questions in the analysts minds as to the claims the wells pay back in 12-18 months at $50 WTI.
shallow sand,
The wells pay out in 60 to 72 months at $50/b0 in the Permian basin, so the analysts should be skeptical. Note that the Permian basin is likely the most profitable basin, especially for large producers that can sell the natural gas rather than flare it (assuming they have locked up pipeline space for most of their natural gas output.)
NG selling for negative values. Flaring is better economically and Sitton will endorse it.
Krishnan,
The negative prices for natural gas are for those who have no pipeline capacity locked up by contract. Thus they flare, the RRC and other state agencies have the power to impose fines that are larger than the negative price of natural gas, but choose not to enforce existing rules. Under a different executive branch, the EPA might step in to require such enforcement. Maybe in Jan 2021 things might change.
Not true. I am so glad this a**hole Sitton is defeated. He allowed flaring even when a contract was in place.
Pipeline operator Williams MLP Operating LLC is suing the Railroad Commission of Texas over what it alleges is a pattern of allowing “needless” flaring of natural gas in the state. Williams filed a lawsuit in Travis County court last month challenging the Railroad Commission’s decision to allow Exco Operating Co
https://www.bizjournals.com/sanantonio/news/2019/12/06/pipeliner-takes-railroad-commission-to-court-over.html
Thank you for the correction, I mistakenly thought the negative prices only applied to the spot market, seems the transport cost through the pipeline was more than the price at the wellhead, and operators din’t want to lose more money by shipping the gas maybe?
I am just trying to understand why flaring was considered more profitable, but in this case the natural gas was basically a waste product (with no value to the producer).
Seems a fine for dumping excess CO2 in the atmosphere should be applied to these producers.
“The law, in its majestic equality, forbids rich and poor alike to sleep under bridges, to beg in the streets, and to steal their bread.”
Will the fine create a new industry or reduce operating costs?
Maybe there should be a fine for creating a bottleneck in the pipeline or help to debottleneck the pipeline and so pushing the problem/opportunity further down stream.
Jay,
The fine gives companies a choice to pay for their pollution if they continue or to pay to have their natural gas shipped.
The alternative is to simply not allow the practice by not issuing permits.
The fines gove companies more flexibility. The fine should be set slightly higher than the negative price so less natural gas is wasted.
Hi Dennis, your reply to Shallow Sands request to read Continental’s conference call missed the mark by a mile or two.
“The wells pay out in 60 to 72 months at $50/b0 in the Permian basin, so the analysts should be skeptical. Note that the Permian basin is likely the most profitable basin, especially for large producers that can sell the natural gas rather than flare it (assuming they have locked up pipeline space for most of their natural gas output.)”
As most newbies know Continental’s production is almost entirely Bakken and Oklahoma.
http://www.contres.com/operations
dclonghorn,
It looks like Continental’s oil production hit a peak of 206 kbd in 2019Q4, of which 75% Bakken and 25% Oklahoma. Company guidance for 2020 is 198-201 kbd.
http://investors.clr.com/2020-02-26-Continental-Resources-Announces-Full-Year-2019-And-4Q19-Results-2020-Capital-Budget-And-Guidance
dclonghorn,
My point was that if the average Permian well (which is my focus) pays out in 60 to 72 months at $50/b. Then North Dakota and Oklahoma tight oil wells are unlikely to pay out in 12 to 18 months at $50/b. Thought the connection was clear, thanks for pointing to the obvious fact that Continental output is mostly in the Bakken, I try generally not to state obvious stuff so as not to insult others. You might try it. 🙂
Dennis.
I assumed you knew CLR’s production is not in the Permian, but that comes from reading this blog for five years.
Dclonghorn has been a good poster here IMO, no need to jump on him.
Also, I do not know if you read any of the conference calls, but on this one at least, I think there was information which leads one to conclude that price will matter quite a bit regarding future shale production. The analysts were consistently hammering on management of CLR about being cash flow positive.
I also note CLR still has $1.9 billion in federal net operating loss carryforwards. State are even higher, at $3.3 billion. $2.3 billion in OK alone.
Also, reading these conference calls leads me to conclude these companies have fairly limited shelf lives. There really aren’t productivity gains anymore. There aren’t new locations, unless they were purchased. There is no exploration of new frontiers, it’s just all drilling PUD’s. They aren’t going to grow much, they are basically royalty trusts which only have two upsides, one being how much income can they return, and two, the ability to generate a lot more cash if prices rise significantly.
The problem is that the companies mostly have too much debt, so interest will be a drag unless the debt levels can be significantly reduced. Debt greatly limits cash distributions to shareholders.
We invest in oil hoping for an investment that will provide income at a higher rate than other, less risky investments. These shale companies are now in that spot, no incentive to own unless they can provide superior income.
shallow sand,
I agree with your observations, tight oil companies are not low risk investments and the price of oil matters quite a bit. I have mentioned this on occasion, I believe. 🙂
You are right that I should be nicer, dclonghorn has been reading this blog for quite a while, and I thank him for pointing out what is obvious. I often assume what I am saying is clear, and perhaps that is not the case.
Oh and I expect the price of oil will rise so income for these companies should improve, but I personally do not invest in any oil companies (too risky for me).
Dennis.
I do not invest in the shale companies. I unfortunately ended up with one, that started out as a natural gas utility. It morphed into a shale company, which has been bad for investors. Thankfully I sold my shares.
I do own XOM and COP and have owned those for around 25 years. Performance has not been good. PSX also, it was spun off from COP, which I originally bought as P. Likewise, I originally owned XON and MOB, and then they merged.
Shale companies are not long term investments. They have limited duration assets. Not sure what happens to them once they run out of drilling locations.
Shallow sand,
Even major oil companies have become risky investments from my perspective, if I owned any I would sell as soon as Brent gets to $90/bo, if I thought that would never occur, I would sell when I thought oil prices had reached their top (obviously nobody knows when that will be or at what price that will occur).
There may be some companies (Chevron perhaps) that have high NRI and might be able to make tight oil work at say $70/b or higher. This may be true of other majors as well, I have not investigated. You no doubt know the companies you own, seems you are not happy with their performance of late.
Dennis,
No, I don’t have 10Qs for all 75 companies. As I state on the chart, shaleprofile is used for private companies, the majority of which don’t report quarterly production. For the majors, I also use 10Qs for some data but mostly shaleprofile as their 10Qs often don’t split out US shale crude oil production. My selection of 30 private shale crude oil company production is estimated to be about 0.9 mbd, using shaleprofile data. I have 10Qs for the other 45 companies which produce about 6.0 mbd. The total of about 6.9 mbd includes an estimate for royalty owner production.
I use the EIA LTO data to determine the 87%. I use my model’s total quarterly production for both 2019Q2 and Q3 and divide by EIA LTO quarterly to get 87%. For Q4, I get 85% and that is probably because EIA LTO Q4 numbers are too high and need to be revised down by about 150 kbd.
The latest EIA LTO total production number for Jun 2019 was 7,671 kbd.
https://www.eia.gov/energyexplained/oil-and-petroleum-products/data/US-tight-oil-production.xlsx
The shaleprofile production number for Jun 2019 was 7,163 kbd, which is 508 kbd less than EIA. Can this difference be explained?
https://shaleprofile.com/2020/02/04/us-update-through-october-2019/
I use shaleprofile public website which says that “Oklahoma is for now only available in our subscription services.” The EIA LTO shows Jun 2019 OK Mississippian LTO to be 282 kbd and OK Woodford at 105 kbd which is OK total of 387 kbd which is still less than 508 kbd but explains some of the gap.
The latest EIA DPR says Anadarko production was 566 kbd for Jun 2019. Anadarko is mostly OK and some TX but EIA DPR includes some conventional so that would explain the 556 kbd being greater than 508 kbd.
https://www.shalexp.com/ has 4.3 million wells in their database but this includes all wells. Shaleprofile has 119 thousand wells but only horizontal and shaleprofile does an excellent job collating all of this well data and making much of it public.
Shaleprofile has 25,300 Permian horizontal wells. David Hughes using drillinginfo has
just over 40,000 horizontal wells but some of these could be conventional, as shown in chart.
The above shows that oil production data quality has always been average but I think that audited 10Qs are good quality and company guidance is usually pretty good. I shall stick with my guess of US total crude production for 2020 to be a plateau of around 12.5 mbd based on a shale crude plateau.
Tony,
The remaining gap between the 508 kb/d and 387 kb/d can be explained by West Virginia and Ohio as well as vertical well output which is excluded from the shale profile estimate in most plays. If we look at the Permian for Shaleprofile in June 2019 output was 3577 kb/d and for the EIA estimate it was 3689 kb/d, the difference is the output from vertical tight oil wells which are excluded from the shaleprofile Permian data, this explains 111 kb/d of your 121 kb/d gap, the rest is easily explained by output in Ohio and West Virginia or statistical error (probably some of both).
Shale profile excludes several areas of the US such as Ohio, West Virginia, and Oklahoma and also excludes tight oil production from vertical wells, the EIA estimate includes all tight oil production.
Often the 10Q reports do not break out tight oil and they often lump NGL with C+C and report in barrels of oil equivalent so the 10Q data is far from perfect if we are looking for C+C output from tight oil plays.
In my opinion the shaleprofile data through June is best and EIA data is second best (but best for the most recent months, currently July 2019 to Jan 2020).
Also note that if we look back at earlier LTO estimates, revisions are not usually very big. Currently US output is about 12.8 Mb/d, I doubt we will see it fall to 12.5 Mb/d, if you are correct, the plateau at 12.5 Mb/d will quickly lead to rising oil prices and output will increase in 2021.
My estimate is for US output to rise slowly over 2020 to about 13.1 Mb/d by Dec 2020, with average annual 2020 output of about 12.95 Mb/d. In 2019 average annual US C+C output was about 12.25 Mb/d, so the increase in annual US C+C output I expect will be about 700 kb/d. Note that even a plateau at the current level of output (12.79 Mb/d) implies an annual increase in output of 540 kb/d (12790 minus 12250) from 2019 to 2020.
Your 12500 kb/d estimate implies not a plateau but a fall in output from Dec 2019 to Dec 2020 of about 600 kb/d. I would put the odds at 1 in 10 for that outcome.
Tony the first tight oil wells using horizontal wells with fraccing in the Permian basin started around 2008. Hughes chart shows about 21,000 to 22,000 horizontal wells at that time, those are all conventional wells, these need to be subtracted from the total of about 42000 horizontal producing wells, to get the horizontal tight oil wells. In August 2019 shaleprofile had about 20,000 producing horizontal tight oil wells in the Permian basin, similar to the Hughes estimate based on data through August 2019. The post below was published in August 2019 and would likely have used a similar dataset as used by Hughes in August 2019.
https://shaleprofile.com/blog/permian-monthly-update/permian-update-through-may-2019/
From that post, published Aug 29, 2019:
These interactive presentations contain the latest oil & gas production data from all 22,473 horizontal wells in the Permian (Texas & New Mexico) that started producing from 2008/2009 onward, through May 2019.
Dennis,
Try telling large shale companies EOG, Occidental and Pioneer that their”10Q data is far from perfect”. They will laugh at you.
Why don’t you read some 10Qs? Almost all shale oil companies split their production between oil, NGL and gas.
Tony,
I have looked at them, I noticed you said almost all and not all.
As to data not being perfect, my point is that if one wants C+C output (as I do), it is not always there.
For the group that do not report tight oil output, do you just use the shale profile data? That data is very good through 2Q2019, after that it is incomplete.
Your chart has 6500 kb/d for Q2019, the LTO report has 2Q2019 average output at 7545 kb/d, that is about 86% rather than 87%.
The LTO report average 4Q2019 output is 8130 kb/d and 86% of that is 6992 kb/d, that is pretty close to your estimate and the 30 private companies estimate from shale profile for 4Q2019 is likely to be revised higher.
I am not convinced the EIA estimate will be revised lower, typically it is pretty close, within about 0.5% or better in most cases, so perhaps a 40 kb/d reduction in the Jan estimate is possible.
Dennis,
Here’s an example to clarify the benefits of using audited company production data and their guidance.
Marathon Oil has operations over several different shale basins in the US, mainly Bakken and Eagle Ford. I have entered 16 quarters of shale crude oil production which requires reading 8 quarterly reports.
Sometimes the data can be found in news releases instead of using SEC filings. For Marathon, 2019Q4 production was 196 kbd and 2020Q1 guidance in 192-202 kbd. I use the midpoint of 197 kbd.
https://ir.marathonoil.com/2020-02-12-Marathon-Oil-Announces-2-2-Billion-2020-Development-Capital-Budget-and-Reports-Fourth-Quarter-and-Full-Year-2019-Results?_ga=2.26659965.1114448062.1581557000-1306969802.1578783285
For 2020Q2 I use Marathon’s total year guidance from this presentation.
http://ir.marathonoil.com/download/4Q19_Earnings+Presentation.pdf
Full year guidance for 2020 is 198-208 kbd. Midpoint is 203 kbd. Marathon’s shale crude oil production in 2019Q3 was 201 kbd. Marathon is basically saying a plateau. I do this for the other 74 companies and I get a shale crude oil plateau for 2020 which started in 2019Q4.
The important point about using Marathon’s past production and future guidance is that you get an estimate of growth or the future trend. The increase in production from 2019Q3 of 201 kbd to midpoint of 2020 guidance of 203 kbd is 1%. The growth trend for many of the 75 companies is flat. Some are up and some are down.
The cumulative addition of the 75 companies guidance and 2019Q4 production is a 2020 shale crude oil plateau. That implies total US crude oil production for 2020 will be on plateau averaging around 12.5 mbd.
HFIR coincidentally, using a totally different methodology, is forecasting that total crude oil production will also be 12.5 mbd but in May 2020. Even if oil prices rebound in the second half of 2020, HFIR is expecting 2020 production to be flat and exiting 2020 at 12.8-12.9 mbd.
https://seekingalpha.com/article/4328423-u-s-oil-production-disappoints-to-downside-in-december
Tony,
Your data is great, thanks. I think output will be flat, but believe there may be some missing data beyond the 45 public companies you have 10Qs for, if you look back at shale profile data, it always is revised higher as the data becomes more complete, so your 30 private companies that are based on shaleprofile estimates are likely to be underestimates after 2Q2019.
The Marathon example is interesting, more interesting would be to do a similar comparison for all 45 public companies you follow, otherwise it is possible you have just chosen one company that guessed correctly of the 45 total companies. Generally I would be surprised if the forecasts are as accurate in general as prices change, credit markets change and companies adjust their plans based on those changes, if they run their business well.
There are many who believe the tight oil companies are not well run, based on their bottom line.
In a Feb 19, 2020 article at Seeking Alpha HFIR used an assumption of 5500 wells completed in the Permian basin in 2020. Using that assumption and a flat completion rate in other tight oil basins, I get the following, where I assume the Permian completion rate increases in 2021 to 5730 wells completed (other basins unchanged). My expectation is about 12.8 Mb/d for average 2020 output if the assumption of a 5500 annual completion rate for the Permian basin proves correct. The average annual output in 2019 for US C+C was about 12.23 Mb/d, so the increase in average annual output would be about 570 kb/d. If we consider Dec 2019 to Dec 2020 output change it would be only 77 kb/d, essentially flat output from 12779 kb/d in Dec 2019 to 12856 in Dec 2020. Note also that I believe the 5500 well completion rate in 2020 for the Permian basin is likely too conservative so this would be a “low scenario” in my opinion. Actual output is likely to be higher, probability 75%.
click on chart for larger view, if desired
Dennis,
We’ll see what happens.
Tony,
At link below is a simple Permian model, change Row 4 to change completion rate (new wells completed each month). Month 1 in the Model is Sept 2019.
https://drive.google.com/file/d/1QpMcgvBZXY3V8Oid5fhinMcOqCxBU9kM/view?usp=sharing
Excellent post. It is very likely US production will dip at the current prices and I do not see WTI sniffing $55/barrel until coronavirus issue is resolved. That is going to take a while. I just noticed that majors caught the virus in January. RDSB is down 28.5% and Oxy is down 31.1% from their January high. XOM down 27.9%. The shale CEOs have the wrong incentives as they destroy shareholder wealth. Look at the disaster that NG producers caused when the world knew that production has to be cut back to shore up NG prices.
XOM market cap is now lower than when Exxon and Mobil merged in 1998. Share price is higher due to stock buy backs.
Think about that. Oil was $8-12 per barrel in 1998.
Also, I like the post from a PE on shaleprofile. He states that we should look at these shale wells as not one well, but numerous wells (each frac stage along the horizontal being a well). The horizontal acts as a flow line which ties all of the wells together.
So, if we have 16 2 mile horizontals each with 100 frac stages in a 1,280 acre project, that is like drilling a well on every .8 acres.
Furthermore, if one of the horizontals has cumulative oil of 400,000 BO, it follows that 100 wells each had cumulative oil of 4,000 BO on average.
If anyone knows the total number of frac stages to date, per shale basin, it would be of great interest to me.
If this virus shows up and hits hard in say Saudi Arabia and other oil producing nations the narrative will totally change. It will go from just demand destruction from consuming nations to no supply coming out of producing nations.
If supplies chains seize up. For any extend amount of time 1-3 months. Things will get a whole lot more interesting than they already are.
If the numbers being reported out of Iran are anywhere close to reality the middle east is in for a rocky ride as this virus spreads.
Oil is delivered on ships. Ships are being quarantined. There will be major supply disruptions.
Most oil delivery terminals are several yards offshore. And even those that are not, no human contact is required. I doubt that any oil deliveries will be disrupted by quarantine.
Hey guys,
This is peripheral to oil and natural gas production. Let’s move the COVID-19 discussion to the Open Thread Non-Petroleum.
Thanks.
https://www.google.com/amp/s/www.bloomberg.com/amp/news/articles/2019-03-14/exxon-aims-for-15-a-barrel-costs-in-giant-permian-operation
From this article Exxon believe they will manage to get break even price in Permian down to 15 usd each barrel. WTI is today 45. They would than have 30 usd in profit each barrel, still stock goes down abd they need to borrow , sell assets to pay dividend. Seems also EIA predict where they count on Exxon and Chevron would continue to ramp up their shale buisiness in 2020., everything would be as before increase off 1-1,5 Mbpd. Seems now it have made a top at 13 Mbpd and is going down.
15? That high, why not 10 or 5?
They haven’t made much money last year in Shale with much higher oil price. They should have made tons (I mean barrels) filled with money.
I think they plan to have drilling costs of 15$ per barrel (with round about 450 k production from every well this looks like right).
They only forgot some small additional costs:
– Finishing costs
– Water handling costs
– Pipeline costs
– Producing the stuff, Maintainance for 20 years
– Paying royalities
– Paying taxes
– Paying their own good payed water head in the office
– Paying some things I forgot.
XOM might reduce costs in the Permian, but consider that breakeven right now is around $50/b at the wellhead for the average Permian producer. The $15/bo claim by XOM doesn’t really pass the sniff test, if they can get costs to as low as $35/bo by 2025, I would be very surprised, maybe $45/bo is a more realistic metric to achieve by perhaps 2022, even that will be a challenge. Note that Chevron is in better shape because they have a lot of acres that have been held by production for years and the royalty payments are far lower than average, so their overall costs are lower.
If you multiply these strange 15$ with the average 450k total oil production for a permian well, you get 6.75 million $. That looks like the drilling / fracking cost they try to reach.
It has only nothing to do with their total cost structure, it’s for investors they don’t know much about oil.
It is my understanding that Saudi Arabia needs $80 oil to keep their economy running smoothly. Now that oil prices are much less and it seems it will stay that for a good while, I would think that SA will go through it’s cash reserves quickly. Wouldn’t this set of the country to implode as it already is in a fragile state? Read the book “On Saudi Arabia” several years back and it seems to correlate well even more now. Thanks in advance on your thoughts on this subject.
They still have a lot of money. They did however, go through a lot of their petroleum reserves.
Re virus upsetting production.
Spend a bit of time looking not at total cases, but at active cases. Don’t really care about numbers if they are dead or recovered. Those categories can’t define what you do for prevention. They are resolved cases.
Global active cases peaked 2 weeks ago. Steady decline since. Containment works. Most of the numbers derive from China, but they clearly know what they’re doing.
The Corona virus is spreading to Europe, now even the US.
Coronavirus Delivers Another Blow to Embattled Shale Drillers
29 Feb 2020
https://www.wsj.com/articles/coronavirus-delivers-another-blow-to-embattled-shale-drillers-11582990892
Trump has declared the virus a hoax put on by the Democrats to undermine his re-election. But Pence is praying that it will go away, so everything should be fine.
First case in Florida
The relevant link
https://www.worldometers.info/coronavirus/
Scroll down just a little bit. Look on the left for Active Cases. Select graph.
Total case count is something that will be interesting only to future historians. That number includes people who have recovered and walked out of the hospital or quarantine. And it includes those who died.
Those are resolved cases. Society does not need to structure its behavior around cases that are no longer a factor in the disease. If active case count were say, 35 worldwide, we would not care if the total case count were 90 million. Over 89 million will have recovered and as such they are no longer important to what one does next for containment.
The graph has been in decline for about 2 weeks. The Chinese are probably fudging the data a little bit, but they also are doing really good containment and that graph probably is headed down.
Scroll down to the country by country tables and have a look at the success of Vietnam and Singapore. Containment works.
That data doesn’t contain everyone that has been infected, just a fraction.
There is no way the health care systems around the world could provide 100% accurate data.
Obviously, there is political incentive to make the numbers look better than they are.
Trump declared the virus a democratic HOAX designed to keep him from being re-elected.
https://moneymaven.io/mishtalk/politics/trump-says-coronavirus-is-a-hoax-PfId063V4kCmo37vvtnyxQ
Look at the actions by these countries….ACTIONS SPEAK LOUDER THAN WORDS
This is an energy/oil blog. So discard if not relevant.
https://fortune.com/2020/02/20/coronavirus-fecal-transmission/
I have a question for the readers here.
If you have worked in Saudi Arabia, Iraq or Iran
1) What are the sanitary conditions like?
2) Specifically around poop transmission? Toilet Paper, Soap, Hot Water, Flushible toilets, washing hands, etc
The research suggests this thing is spread through POOP.
If that is true, then IMO these are HUGE questions.
I’ve never been to the Middle East.
thanks!
1) What are the sanitary conditions like?
2) Specifically around poop transmission? Toilet Paper, Soap, Hot Water, Flushible toilets, washing hands, etc
Their toilets are an elongated hole in the floor. They have a faucet to wash their hands after they wipe their butt… with their left hand. No soap. They don’t use toilet paper. But the hole in the floor does flush. The water from the faucet goes onto the floor and then into the hole in the floor.
However the very poor areas of Saudi do not have inside toilets at all. They go outside and carry a bottle or a cup of water with them… to wash their left hand after crapping. They eat only with their right hand and are not allowed to touch anyone or any food with their left hand.
A side note: With the water, either from the cup, bottle, faucet, they also wash their butt. So they they believe they are a lot cleaner than Westerners who only use paper.
I lived in Saudi Arabia for five years and know what I am talking about. However in all places where Westerners worked we had our own toilets, and they were just like toilets here. But they also had their own toilets. They were marked “Eastern” and ours were marked “Western”.
Good article
https://www.theatlantic.com/health/archive/2020/02/covid-vaccine/607000/
China is reporting more recoveries than new infections. That is why total cases seem to be dropping. And we are not so sure China is being totally honest with their reporting. They want to get their economy going again. It is on the verge of collapse.
Total cases outside China are increasing exponentially.
Yesterday: Infected 4704 Confirmed 5298 Deaths 84 ..Recovered 420
Today……: Infected 6153 Confirmed 6762 Deaths 106 Recovered 503
Increase Overnight 1149 ……………… 1464 ………… 22 ………………. 82
Confirmed cases increased by 1,464 overnight while recoveries increased by 82. And you think the worst is over? Hell no, it’s just getting started.
The link: https://Covid19info.live
Very colorful site. I did not see where the Active Cases were graphed. It’s probably there, I could not find it. I see my go to site is slowing down so maybe all the sources will get difficult.
Surely we can agree that the only number of significance is Currently Infected, that is, Active Cases. Certainly not total.
We probably cannot trust the China numbers. We probably cannot trust numbers from all sorts of places. Saying that one cannot measure all of the infections also says that this was true in June of last year when we had never heard of the thing. If you don’t have numbers you’re as obligated to estimate low as you are to estimate high.
Incentive to estimate low for economic purposes should soon find a counterbalance of entities estimating high who will want monetary aid influx. Countries like Vietnam and Singapore and Thailand, who have had remarkable success in containing the virus, may soon realize this is not the path towards collecting aid money. Then we’ll really have reason to doubt numbers.
For whatever numbers you trust only the Active Cases matter. Allocation of containment measures will not be decided upon based on patients who have already recovered or died. Somewhat obvious, but smaller numbers are not desired right now so it’s not being discussed.
For whatever numbers you trust only the Active Cases matter.
And what do you consider “active cases”? From The Last Day To Prepare (Mostly), 11 minutes into the video:
In Daequ, (South Korea), 1900 Shincheonji Church members have been tested for coronavirus.
1300 had symptoms & 600 did not.
Among those with symptoms 87.5% were confirmed with the virus.
But out of the 600 WITHOUT symptoms, 70% were confirmed with coronavirus.
In the USA, we are doing virtually no testing. Sooooo????
“Containment works.”
But only if you take widescale strict measures.
The tactics China has been using to restrict movement is a very tough pill to swallow.
Which other countries of the world will be able to replicate their effort? S. Korea?
So far, the USA is scoring a D- (being a generous grader) in containment policy enacted.
https://virusncov.com/ This site has the similar worldometer layout of Currently Infected or Active Cases. It hasn’t slowed down yet. I expect worldometer to fix whatever is wrong. They actually graph Active Cases.
As to what does one call an Active Case? Well, one doesn’t imagine things. One uses the numbers one has. Total cases minus Recovered and minus Deaths. Why would we care about resolved cases?
The US has 61 Active Cases. Vast majority citizens who were evacuated from that floating petri dish.
I’m not sure I understand what folks think containment is supposed to be or not supposed to be. You find a case, you isolate it. A health care person gets infected treating that case, you isolate him or her, too. This doesn’t take $9 billion, unless you’re a congress critter who thinks he or she can get written into legislation a mandated expenditure for “containment measures” that are manufactured in his or her district.
China had a node of 10,000+ before they even knew what was happening. It was quickly 20,000. Isolation had to be broad. Then people started healing and walked out of the hospitals and their active case count stopped rising and is now in decline. Regardless, if you don’t have a starting point of 10,000 or 20,000 you’re isolating fewer people.
Unless one imagines the numbers are wrong. That congress critter above certainly has incentive to imagine. It’s a bipartisan imagination thing.
Why would we care about resolved cases?
Take this with a grain of salt, but there has been reports of patients reinfected with the virus after recovering.
https://finance.yahoo.com/news/coronavirus-covid19-virus-reinfection-outbreak-112556479.html
small point of clarification- “patients reinfected”
No one knows if these cases are reinfection vs relapse
Relapse is much more likely, but the implications are perhaps even more troublesome for the public health. There is no way to know who will relapse, and thus possibly be a source of community spread when thought to be no longer a risk.
Watcher -“I’m not sure I understand what folks think containment is supposed to be or not supposed to be.”
If you are serious about it being effective, the “waiting for a case , and then isolating” is a failure from the start. The Chinese learned this the hard way over a month ago.
You must restrict movement of people from or to zones with infection- we still, have not done that effectively. American Airlines just today announce a voluntary cessation of flights from Milan (the main city in the hot zone of Italy), for example. It should have been mandatory a week ago.
The evacuations from the cruise ships and Hubei province were handled sloppily, bringing exposure to the some of the recipient locales (Travis Air force base area for example).
You must test asymptomatic people extensively to see where the infection is, so you can institute strict local control on events and travel (even to the grocery store). We have done absolutely zero of this in the USA, as of today.
These kind of measures have not yet been digested by the USA. By the time it is there will be thousand cases. Japan has closed all school til at least end of March, I have read.
Here is the kind of measures China has undertaken-
https://www.npr.org/sections/goatsandsoda/2020/02/21/806958341/restrictions-and-rewards-how-china-is-locking-down-half-a-billion-citizens
Well, hell. You could have just imagined that there was an infection last year and started doing that stuff. Or, accurately, you could have imagined there was potential for the evolution of such an infection and started doing all that stuff. You could start building ICU’s and put everybody in ICU right now, regardless of test results or symptoms, just on the basis of potential disaster.
As of right now there are 63 Active Cases in the United States, and nearly all of them came from that boat. That number is going to have to get up to about 6.3 million before you’re going to find any support for shutting down oil fields or refineries because the people in them happen to be standing next to somebody else.
Singapore, Vietnam, and Thailand have gotten spectacular results reducing Active Cases, and they didn’t shut down much industry.
As for rumors of re-infection, that parameter will show up in the active case count eventually if it exists. What is being recommended based on this speculation? A longer quarantine time? If you turn them loose too soon and the virus reappears, then everyone they contact will be quarantined, as will they. Because there was not a 10,000 or 20,000 person node on day one this can work. Just as it did in Singapore, Vietnam, and Thailand.
Say what?
I’m guessing you are not involved in decision making about health care issues.
This isn’t just theoretical to me. There are community acquired (no known contact with people who have been out of the country or involved in caring for evacuees) cases 25 miles to my north, 35 miles to my south, and I have a sister in law, father, and mother in law all within 7 miles of the outbreak in Kirkland, WA
The virus at these sites is estimated to have been circulating in these communities for 2-4 weeks already.
Most would be shocked to know how much of the nations GDP is headquartered within 25 miles of those case epicenters.
Singapore, where you can get 10 years in jail for dropping a piece of gum on the ground and is very small may be able to implement an effective containment.
If you think Thailand or Vietnam can or are being honest with their numbers…you have never been there.
Those places are full of corruption, the leaders will never want to “lose face” and anyone with money could easily bypass a “quarantine”.
Money talks over there….that’s it.
80% of the population hasn’t accepted “The Germ Theory of Disease”….they think it is “Bad Luck”
And people poop and spit and blow snot rockets in public and don’t wash hands all over the place….
Again, COVID-19 (aka coronavirus) should be discussed in non-Petroleum thread.
Let’s focus on oil and natural gas production.
Thanks.
Market bounce is underway. 3 CB’s getting ready to unleash the Kraken. Up is the direction for price of everything. Oil should recover nicely.
First attempt starting strong this morning in Europe failed. They are slightly red again now, after driving a 400 point rollercoaster in DAX.
Normally the rumour of an interest rate reduction alone should keep the markets deep green for days.
Let’s see the second try.
After some problems the second ramp up works better now.
But it’s more a relief for stocks, oil is still in the low range making oil companies bleed cash.
I’m generally an advocate of there being nothing other than oil here. But in a very odd way, and having nothing to do with consumption, the mathematics is that of Peak Oil.
In a couple of weeks most of who are in quarantine are going to be turned loose. They were young and strong and recovered. A handful will die. You see, this is the legacy decline of the field. This is the down escalator that new infections are trying to sprint against to get enough existant infections in society to compel societal change.
It’s at that point that we will see current infections AKA Active Cases face the same mathematical challenge oil production faces. New oil discoveries, becoming more scarce, represent containment. Containment slows the new discoveries and as time passes the legacy decline overwhelms them.
Pretty cool.
People think this is relevant because it affects the price of oil, this is true of nearly everything.
Discussions of “everything” belong in the Open Thread Non-Petroleum.
It is the reason it is there, use it please.
Oil Price Fundamental Daily Forecast – Supported by Positive Russian Comments, Rate Cut Expectations
It looks like the comments from Russians Putin and Novak were enough to trigger a short-covering rally. They may be enough to underpin the market until the OPEC+ decision on production cuts later this week
U.S. West Texas Intermediate and international-benchmark Brent crude oil futures are trading higher on Monday after reversing earlier losses. The positive turnaround in the market is being fueled by hopes of deeper production cuts by OPEC and its allies, and stimulus from the major central banks. Both news headlines are helping to offset concerns about damage to demand from the coronavirus outbreak.
At 16:09 GMT, April WTI crude oil is trading $46.01, up $1.24 or +2.82% and May Brent crude oil is at $50.84, up $1.17 or +2.36%.
OPEC February Oil Output Sinks on Libyan Unrest, Cuts
OPEC oil output dropped in February to the lowest in over a decade as Libyan supply collapsed due to a blockade of ports and oilfields and Saudi Arabia and other Gulf members over delivered on a new production-limiting accord, a Reuter’s survey found.
On average, the 13-member Organization of the Petroleum Exporting Countries pumped 27.84 million barrels per day (bpd) last month, according to the survey, down 510,000 bpd from January’s figure.
WTI @ 46.87 + $2.11. Drillers happier today
On side note. Japan central bank was buying Japanese ETF’s this morning.
https://www.fxempire.com/forecasts/article/oil-price-fundamental-daily-forecast-supported-by-positive-russian-comments-rate-cut-expectations-636550
https://business.financialpost.com/pmn/business-pmn/chevron-offering-u-s-workers-buyouts-to-trim-staffing-sources/amp?__twitter_impression=true
This year could see the dramatic growth of U.S. production slow, and perhaps even stall.
http://energyfuse.org/from-high-to-low-could-u-s-shale-production-stall-in-2020/
The latest EIA World Oil Production figures are out for November 2020. They include production data for all the world’s oil producing nations.
Production for the world and Non-OPEC was up dramatically in November.
World C+C up 972,000 bpd in November.
Non-OPEC C+C up 1,023,000 bpd in November.
Non-OPEC less USA up 821,000 bpd in November.
World less USA up 770,000 bpd in November.
I will post all four charts below.
There were no dramatic moves up in November. The only countries with greater than 100,000 bpd were:
Norway, up 202,000 bpd
USA, up 202,000 bpd
Canada, up 155,000 bpd
Brazil, up 126,000 bpd
However there are usually, among all nations, at least as many decliners as gainers. In fact, there are usually more decliners than gainers. November seemed to be an exception. There were far more gainers than decliners in November
Non-OPEC C+C through November 2019
Non-OPEC less USA through November 2019.
World less USA through November 2019
Ron,
Absolute numbers are one thing, but the actual composition of the total by viscosity is also a factor. It is deteriorating.
likbez,
Any data to back that up at the World level? Tight oil is 10% of World C+C, the lighter oil from the US is balanced by heavier oil elsewhere, not clear the oil is “deteriorating”, as you assert.
The Russian Minister of Energy has published Russia’s Crude+Condensate production data for February.
Russia C+C production in metric tons per month. Assuming 7.33 barrels per ton and dividing by 29, we get 11,243,000 barrels per day in February. That is 31,000 barrels per day below January production. But that was after their December production had been revised upward by 36,000 bpd.
For Russia it looks like the 12 month average output has dropped about 0.44% from April 2019 to Jan 2020. It also looks like this 12 month average is approaching a plateau at about 11200 kb/d.
Pioneer files for bankruptcy
Drilling rig operator files for Chapter 11 bankruptcy
After enduring more than five years of losses, San Antonio drilling rig operator Pioneer Energy Services has filed for Chapter 11 bankruptcy.
In its Chapter 11 filing in U.S. Bankruptcy Court in San Antonio, Pioneer listed more than $100 million in assets and more than $100 million in debt owed to more than 200 creditors.
Pioneer hasn’t made a profit since the third quarter of 2014. The filing comes weeks after company executives reached a financial restructuring deal with key investors that included forgiving debt in exchange for equity in the reorganized company.
Note that there is a different company with a similar name called Pioneer Natural Resources which is a major tight oil producer, this is a different company that is an oil services company.
The oil producer at link below
https://www.pxd.com/
The company that has filed chapter 11 is at link below
http://pioneeres.com/
Those in the industry would know this, I had not heard of this second services company, so this is for those like me that are not part of the industry.
Link to press release
http://pioneeres.investorroom.com/2020-03-04-Pioneer-Energy-Services-Announces-Its-Common-Stock-has-Commenced-Trading-on-the-OTC-Pink-Marketplace
The stock is trading on the pink slip market at 2.5 cents per share, yikes.
A revised tight oil model with 5500 new wells in Permian basin in 2020 and other basins with relatively flat completion rates through 2022, with completion rate decreasing in non-Permian tight oil basins after 2022, consistent with AEO 2020 reference oil price scenario. The completion rate in the Permian basin after Dec 2020 is assumed to increase by 3 new wells per month until reaching a maximum of 693 wells per month in mid 2027, the completion rate remains at that level until late 2029 and then gradually declines with no completions after mid 2044. Peak for Permian is reached in 2029/2030 at 6830 kb/d and peak for all US tight oil in 2028 at 9230 kb/d. I expect this scenario is rather conservative as potentially high oil prices in 2023 to 2028 could lead to a higher Permian completion rate than used for this scenario, in that case the peak would be higher and would occur earlier (roughly 10 Mb/d in 2025/2026).
Interesting, but on what is based this tight oil model? On economic data like the cost of drilling/
completion/extraction vs barrel price or on actual oil reserves which has an impact on the depletion rate?
Jean,
It is based on both economic data such as well cost, discount rate, LOE, G+A cost, royalties, taxes, transport cost, and oil price (AEO 2020 reference case assumed for future oil price) and physical data such as well productivity, well completion rate, and technically recoverable resources estimated by the USGS (mean estimates are assumed). Future productivity is assumed to decrease after Jan 2021 and the rate of decrease depends on the assumed completion rate (where higher completion rate leads to faster decrease in productivity). Number of wells completed is based on USGS estimates (where we adjust for increasing acres per well over time) the model is first run in a TRR mode where total wells completed is not affected by economics and a productivity rate of decrease is determined that is consistent with the assumed TRR. Then a second iteration is performed using the productivity rate of decrease relationship with the completion rate determined in the TRR run where economics is applied such that wells are only completed if the discounted net revenue over the life of the well is greater than or equal to the well cost (full cost including supporting facilities, land cost, and well abandonment).
An independent model for the Bakken, Permian, Eagle Ford, Niobrara, and “other US tight oil plays” (less data here so the weakest part of the analysis) is completed and the 5 models are combined to get a US model. The TRR of US tight oil plays is roughly 111 Gb, the URR of the model presented is about 90 Gb from 2000-2052. Through Jan 2020 about 16.4 Gb of tight oil has been produced, so if the model is correct (many assumptions involved so low probability that any future model would be “correct”) that would imply about 75 Gb of remaining tight oil resources.
In a World with roughly 1600 Gb of remaining reserves, this quantity of tight oil resources is relatively inconsequential.
See also
https://peakoilbarrel.com/us-tight-oil-legacy-decline-and-us-tight-oil-scenarios/
post below used a guess at Permian TRR which was far lower than recent estimates (about 50% too low). So Permian model has changed significantly.
The post below significantly underestimated future tight oil output (Jan 2020 is actually over 8000 kb/d (this model from about 3 years ago estimated about 6000 kb/d in Jan 2020.
http://peakoilbarrel.com/future-us-light-tight-oil-lto-update/
This last post has much of the underlying physical theory of the model (the TRR stuff I mention above), the economics I have never explained in a post.
https://peakoilbarrel.com/oil-field-models-decline-rates-convolution/
Oil consumption just fell off a cliff. OPEC is facing a huge test Bold mine.
Oil producers are facing the biggest drop in demand for their product ever as the coronavirus spreads around the world, forcing OPEC and its allies to consider emergency measures.
Research firm IHS Markit said Wednesday that oil demand will suffer its steepest decline on record in the first quarter — worse even than during the 2008 global financial crisis — as schools and offices close, airlines cancel flights worldwide and a growing number of people hunker down at home.
Most of the reduction in demand can be traced to China, where the coronavirus has caused what IHS Markit describes as an “unprecedented stoppage” of economic activity.
But reduced consumption will be widespread, and IHS Markit expects global demand to drop by 3.8 million barrels per day in the first quarter compared to 2019. Demand in the first three months of 2019 was 99.8 million barrels per day.
“This is a sudden, instant demand shock — and the scale of the decline is unprecedented,” said Jim Burkhard, vice president and head of oil markets at IHS Markit.
A decline of 3.8 million barrels per day is a real bombshell.
Despite claims by China that they have more recoveries than new infections, there is strong evidence that they are lying. Travel inside China is still almost non-existent and most industry is still shut down.
Ron,
3.8 mbd demand drop is huge.
Brent heading down to $50
https://oilprice.com/
Any discussion of this link should be over on the non petroleum thread, but I think it’s significant enough that those who are strictly into the oil side of this site should be giving the rise of the electric car some serious thought.
https://www.cnn.com/2020/03/04/business/gm-electric-car-battery-400-miles-of-range/index.html
I’m now fairly well convinced that electric cars and trucks will sell fast enough within the next four or five years to cut very seriously into the demand for oil.
Don’t forget that the ones that will be driven the most will be the ones that sell the fastest.
Just one electric eighteen wheeler running a daily route can cut the demand for diesel fuel fifty gallons per day, and twice that or more, if it’s over the road rather than parked a good part of the day loading and unloading.With two drivers , twelve hundred miles per day is no big deal.
And if the truck drives itself, with no mandatory rest breaks or meal breaks, fifteen hundred miles may be within easy reach with fast charging on the open road cross country.
2008 financial crisis didn’t reduce oil consumption much.
2007 87.1 mbpd
2008 86.5 mbpd
2009 85.88.5 mbpd
2010 88.53 mbpd
2.3% Not much. Utah Univ guy noted financial crisis didn’t map to similar GDP smash and . . . similar oil consumption smash. He was right about that.
So worst since then . . . not a good compare. Maybe embargo years. Trying to make an issue of quarter vs year, maybe. Not likely. Roads look full to me. No masks at Walmart. City folk didn’t drive much anyway.
Watcher,
The big hit so far is in Asia. The big hit to consumption was 1980 to 1981. Annual consumption of gasoline, jet fuel, distillate fuel, kerosene, and residual fuel from 1980 to 1981 decreased by 4 Mb/d or 7.6%, from 52.4 Mb/d to 48.4 Mb/d for the World.
Data from
https://www.eia.gov/international/data/world/petroleum-and-other-liquids/annual-refined-petroleum-products-consumption?pd=5&p=0000dg0001u&u=0&f=A&v=mapbubble&a=-&i=none&vo=value&&t=C&g=00000000000000000000000000000000000000000000000001&l=249-ruvvvvvfvtvnvv1urvvvvfvvvvvvfvvvou20evvvvvvvvvnvvvvs&s=94694400000&e=1514764800000
“City folk didn’t drive much anyway.”
Well, I’m not very confident of that conclusion.
I have lived rural, city margins, and very close-in at various times in life.
Almost every urban region highway I have seen in the country is jammed packed full for at least 6 hours a day. Doesn’t matter how many lanes. A million people going a million places.
Example- many working people in my region have to drive far to reach their jobs, due to lack of of affordable housing near their work. And when they have free time, they often go driving all the hell over.
And most people are either workers, or very busy doing something.
Most of the national oil consumption is in these urban regions.
map of traffic flow SE USA.
You can see Atlanta most prominently.
Add up all the rest of Georgia traffic (oil consumption),
and its not much of competition.
This is typical of the entire country.
Much of that traffic is suburban and rural dwellers coming into the city in the morning and leaving in the evening.
Per capita, miles driven by city dwellers is lower. Many don’t own cars (at least in places with good public transit).
per capita perhaps, but we are talking overall petrol
consumption-demand of the country and world
Both Vitol and now Gunvor agree that the demand destruction is 200 MM barrels in first quarter due to the virus. The excess inventory as a result will take some time to work itself although Libya is helping. But I do any evidence from weekly report that US is slowing. The shale CEOs are bent on destroying shareholder wealth while taking undeserved bonuses. Energy stocks both in NG and oil and support business have taken a beating. A lot of layoffs in the works in future.
Krishnan,
It is surprising that the shareholders have not demanded that CEO bonuses be paid in the form of stock options, it would seem that should align the interests of the CEO with that of shareholders more closely.
200 / 90 is 2.2ish mbpd. It’s early March and China is now down to 25000 active cases from a high of nearly double that. In a week or two we will see patients walking out of hospitals in other countries too and their active cases also will peak and decline
Airplane flights to highly infected areas have been suspended, but I’ve heard no announcement of suspended flights domestically in the US. I haven’t heard of any suspended flights within China other than those going to Wuhan.
Shelves that look a little empty mean the store manager places a new order and trucks drive a little bit more to deliver.
You can certainly get consumption down in an involuntary way, but there is a fairly high floor on that number.
I talk to some people in Asia almost daily and what I am hearing from them is they do wear masks, it is part of their multi decade habit pattern when they have a cold, or even when they do not but they hear coughing around them. But I have heard nothing about anyone staying home from work. They tend to go to work on buses or trains, and I have specifically asked and they say they are full.
Seems pretty easy to me to overestimate reduction in consumption.
BUT big BUT the IMF yesterday announced a $60B aid package for countries dealing with the virus. The IMF usually does loans but this was phrased as handout. If so, we can expect an absolute explosion in the number of reported cases as various countries want a piece of that action. Then we have to decide if that money influx generates oil consumption or the increased manufactured case count scares people into not consuming.
It’s early March and China is now down to 25000 active cases from a high of nearly double that. In a week or two we will see patients walking out of hospitals in other countries too and their active cases also will peak and decline.
Yeah right! You are a rare bird Watcher. That is, a person who actually believes the numbers China is allowing to be published.
Ron, the world would know nothing at all about it had the Chinese not told us.
But the IMF thing is far more important at this point. That could either goose or slow consumption.
Watcher, you are completely insane. You have no idea about how bad it is, or how bad it is going to get. The casino has been on fire for quite some time, and yet you’ve been crazily extolling the virtues of the otherwise thoroughly depraved CCP re: their tremendous organisational ability in ‘containing the phage’. The CCP have been nothing more than murderous buffoons for decades. Nothing could have been further from the truth regarding their ‘organizational ability’.
You sir, drank deeply of the depraved cool-aid.
OPEC agrees on massive oil supply cut to offset virus impact; awaits Russia’s approval
OPEC has agreed to impose a deeper round of production cuts in order to support oil prices, paving the way for crunch talks with non-OPEC leader Russia, who still has to agree to the plan.
The 14-member group, led by Saudi Arabia, decided on Thursday to cut production by 1.5 million barrels per day (bpd) through the second quarter of the year.
OPEC added the group would review this policy at its next meeting on June 9.
The proposed cuts, which were at the top end of analyst expectations, are believed to be conditional on approval from Russia.
It means energy market participants will now turn their attention to a meeting of both OPEC and non-OPEC members, sometimes referred to as OPEC+, on Friday.
Ahead of the OPEC+ meeting, analysts were concerned a long-standing energy alliance between Saudi Arabia and Russia would come under intense scrutiny.
The US companies should just cut back production by 10% themselves – for their shareholders.
More free cash flow, less drilling costs, much higher oil prices and more time drilling on their limited acres – the good ones are already claimed, so no new land without sinking billions into exploring.
But that’s not possible.
Games are played:
https://www.zerohedge.com/markets/opec-agrees-15mm-barrel-output-cut-fails-woo-russia
In my opinion the Russians want to crash the oil price hard to damage non-opec-producers. Shale and offshore will be hit, together with the old big oil wasting all cash for dividends and buybacks.
It could pay out for them – half a year of pain for a dip in non-opec-production and some shelved deep salt projects. And a dip in shale production, where only Permian will recover from.
But that’s only my opinion for the russian behaviour.
“It’s the economy stupid”
Maybe their just backing their destructive orange ape
Just a thought, but why would Russia back the ape that has significantly reduced regulations and allowed the US shale business to flourish at its own peril? Wouldn’t they back the Bern guy who wants to shut down the oil industry within the US? Wouldn’t that help Russia’s economy that is closely tied to oil and gas revenues? Even Biden would be better for Russia. If the government shuts down or significantly hinders oil production in the USA that would be seem to be a huge bonus for Saudi Arabia, Russia, etc. This whole theory of Russia backing Trump does not make a lot of sense to me.
If USA replace oil and gas with electricity for energy supply, the amount of oil sold in the world would decrease and the oil prices would drop. Then, the situation of the remaining oil suppliers would be very uncomfortable. Furthermore, the other big market for oil importation, the EU, would be stimulated into changing its own energetic paradigm in order to not lose its comparative advantages and to not be outperformed by USA. The Russians have then no interests in backing someone who wants to change the energetic paradigm for USA.
True and the stock market and oil futures seem to indicate that people are already starting to believe this will happen. However, thermodynamics and logistics suggest that replacing the current oil and gas usage with electricity is not truly a reality anytime soon. In the next 4-8 years the Russian economy would do better under a democratic US president. A case in point is the flaring issue in the Permian Basin that is discussed above. That is a regulation that I agree should be implemented, but since it is not the producers are free to do whatever they think works for them.
Another note on electric vehicles, even if the fleet was switched over to electric you would still be burning natural gas and coal to power a big percentage of it. Island Boy post the electrical usage in the US on a monthly basis and I see where wind and solar is increasing as a percentage of total, but it is still less than 10%.
The so called “Great Game”, the game of international power politics, is played at several levels, and does not necessarily make sense when only one aspect, or a couple of aspects of it, are examined.
Consider checkers or chess. It’s SOP to sacrifice a piece, or even two or three pieces, to set one’s opponent up for the kill….. assuming you play more skillfully than your opponent.
So, YES, it would be good for Russia if the oil industry in the USA suffers from low prices….. but the FLIP side of that low oil price coin is that the OVERALL American economy benefits, lol. The overall economy of all of Western Europe benefits, as well as all other West aligned oil importing countries…. and there are MANY countries that want close relations with the West, where as hardly ANY country WANTS close relations with the Russian Bear, which has a REAL reputation as being willing and able to forcibly occupy other countries……PERMANENTLY, when possible.
Lot’s of people describe the USA as being the center of a giant world empire, which is quite true in many respects. But we’re pretty much a SOFT empire, and don’t permanently occupy other countries forcing our will on them… except in cases where they happen to have OIL, lol.We use the power of the dollar and our power to SHELTER other countries under our military umbrella, to protect them, PRIMARILY from Russia, lol.
At the NEXT level down, the Russian leadership is well positioned to deal with low oil prices. Russia and Russians are TOUGH, and Putin is a dictator in all but actual title, so he and his team are willing to deal with economic problems associated with low oil export earnings….. if the pay off is big enough otherwise.
And the PAY OFF is HUGE, in terms of the orangutan in the White House weakening the ties between the USA and all the countries at risk of Russian power and influence. Our allies no longer trust us to live up to our traditional role as the one country in the world large enough, influential enough, and powerful enough, to counter ( former Soviet ) / today’s Russian desire for power and empire.
The ultimate Russian goal, as seems perfectly obvious to me, is to weaken American influence on the world stage, thereby rearranging the stage for a resurgence of Russian power.
A part of the Russian game plan is to boost the R party in upcoming elections, given that the R’s as a party are abjectly lined up to give the orangutan a public blow job.
A very good joke runs that in his memoirs, Bill C will write that he was impeached FOR getting a blow job. The orangutan brags in his that he was getting a collective blow job from the R Senators WHILE being impeached.
Ah, and therein is the rub,. Crazy Coynocopian production metrics has caused this horrific situation to become ‘a thing’. Wanton drilling of a barely productive resource (aka Permian, requiring huge investor influx re: money/sand/pumping HP with little to no payback), incl. That extolled by paid analysts such as Denis, (no disrespect or doubt) avail to a massive misallocation of time, brain power and resources. It was all a grandiose expenditure of hubris that may yet go a couple more months, possibly years IMO. The whole thing is unsolvable, and easily thrown to ruin. The declining international petroleum shows gave some hint of that in previous years, as the real enthusiasm comes from an upward, onward attitude that only testosterone can provide. This, BTW, had declined over 50% and will certainly reduce in the hardships of drilling. It’s all coast mode, now.
Mr Sutherland,
If you look back at my best guess scenarios done over the past 8 years. In every case the “Coynucopian” scenarios have underestimated future oil output.
I receive no income from this blog, in fact I pay for it out of pocket, it is a hobby.
If you can point to a past scenario that I claimed was the most likely future outcome that proved too high. I would be interested in seeing it.
The one place this might have occurred was in 2014 when I did not foresee the coming supply glut and the crash in prices in 2015/2016.
Likewise I did not foresee the COVID19 outbreak and ensuing price crash. So near term scenarios from mid 2019 may prove too optimistic because the oil price assumptions proved incorrect.
That’s why I typically say the chances that any scenario of the future will be correct is very close to zero. Number of possible future scenarios is infinite.
My apologies to you Denis. As I’ve said before, your excellent responses are far better than my rants deserve.
I can’t begin to tell all of you what an unmitigated disaster shale has been for my business. I haven’t seen a drill rig in over 4 years. The business has had to change over to engineering projects that I never considered, for which we (read: I) were unbelievably poorly prepared. It has come home to roost and it is taking every working hour of every day to stay in business.
The animosity I feel toward the shale business is without doubt, the most I have ever felt in my life.
I think that they want to maintain their cash flow at least or increase it. If oil price goes up with the opec production’s cuts, then they will directly benefit of this price increase with an increase of their cash flow while the opec states will have to increase their own production to benefit of this. It’s just mere selfishness.
Yeah, selfishness does drive it to some degree. But the main driver is testosterone, which has declined 50%. How can you drill if you aren’t a man, after all? Oh and BTW, a hearty ‘f*ck you” to Nick G and his a**hole ideology, the perfect brick road to unmitigated Hell. F^ck You Nick, you pandering jackass. Grab a pair for a change.
What about the gain of productivity of shale oil wells over the last months or years? Apparently, the (future) gains of productivity are one the justification of the EIA for a growth of shale oil production after 2020.
Jean,
No productivity increase is needed for an increase in tight oil output, even a constant completion rate at current productivity levels would lead to an increase in output.
From link below we see productivity in the Permian has not changed significantly since 2016 (when we normalize for lateral length). The apparent increase in average Permian productivity has been due in part to increasing lateral length, so more acres would be required assuming constant well spacing.
https://shaleprofile.com/blog/permian-monthly-update/permian-update-through-november-2019/
Jean,
A simplified Permian model with EUR starting to decrease in Jan 2021 at link below, if you are interested.
https://drive.google.com/file/d/1QpMcgvBZXY3V8Oid5fhinMcOqCxBU9kM/view?usp=sharing
This model can be changed by changing the completion rate in row 4 of the spreadsheet, the model presented has a very conservative completion rate increasing from 458 new wells per month in June 2020 to 583 new wells per month in May 2030, a very gradual rate of increase.
Thank you, Dennis.
You’re welcome Jean.
ExxonMobil had their investor day today with a 162 page presentation.
https://corporate.exxonmobil.com/-/media/Global/Files/investor-relations/analyst-meetings/2020-ExxonMobil-Investor-Day.pdf
Page 55 Permian production outlook kboed (oil, NGL, gas)
2020, 360
2021, 600
There was also a webcast in which Permian discussed about 50 minute mark.
https://corporate.exxonmobil.com/Investors/Investor-relations/Investor-Day#2020InvestorDay
https://www.msn.com/en-us/money/markets/exxon-taps-brakes-on-permian-basin-after-virus-hammers-oil/ar-BB10NlmE
“The pace of Permian growth by XOM will slow. The company’s Permian pullback is another sign that U.S. shale growth may be slowing.”
https://www.bloomberg.com/news/articles/2020-03-05/exxon-slows-pace-of-permian-development-after-oil-price-slump
“The U.S. energy giant will cut Permian production growth by about 10% over the next two years…To execute its Permian slowdown, Exxon will cut 20% of its rigs in 2020, senior vice president Neil Chapman said. The oil major was running 18 rigs in the Midland side of the basin and 40 in the Delaware earlier this year. Overall Permian production will reach 600,000 barrels a day by 2021, about 10% lower than the previous guidance.”
XOM slower Permian growth gives more evidence that US shale oil is on a plateau. If that plateau extends to Dec 2020 then total US crude oil production in 2020 should average around 12.5 mbd.
Thanks Tony,
From the Bloomberg piece (link below), it looks like XOM’s Permian output is expected to increase based on chart below from that article.
https://www.bloomberg.com/news/articles/2020-03-05/exxon-slows-pace-of-permian-development-after-oil-price-slump
Dennis.
XOM CEO just said it’s Permian investment is “robust” even at $40 WTI.
I note the world “robust” has “bust” in it.
We are nearing our break even in the field. This stinks.
Shallow sand,
Maybe XOM means their pocket are very deep and they have very good access to credit so they can weather this storm?
Sorry about the low prices. Can you shut in wells temporarily or does that damage the well? My guess, as always is that prices will recover, but as Mr Shellman reminds me often, hope is a poor business plan and does not pay any bills.
I wish you well.
Dennis. We aren’t to shutting in wells yet.
WTI averaged $42 in 2016 and we made it, even had positive net income for the year, although it wasn’t too great.
Point is, operating oil wells takes a lot of effort. Hasn’t been worth the effort for several years.
shallow sand,
My hope is that patience will be rewarded. By 2022 oil may be north of $80/bo, might make up for the lean years if it lasts for 3 or 4 years (WTI in the $80-100/bo range). Unfortunately I have been saying $80/bo is around the corner since 2015, and I have been consistently wrong. Hopefully this will not continue for the next 5 years, as peak oil approaches in 2025 or 2026 it would make sense that oil prices would increase (or it makes sense to me.)
This price dip can make it happen.
With prices constant at 60-70$, oil production expension plans in US shale and world wide offshore can be realized.
With this disruption, many project will be shelved. And when the dust settles and the planes fly again, this capacity loss will be felt.
As I said last year in a discussion with HHH, 20$ oil (his forecast) will trigger 100$ oil due to oil infrastructure damage.
When shale oil goes to shrinking, it’ll take some time to turn it around again. Especially when sweet spots in several fields are more exhausted than 2016 it will be difficult to turn around to new hights everything but Permian.
And big oil is making big promises now to not cut spending – they want to prevent their stock collapsing even more. They will have to do this more secret. Perhaps by selling projects.
May the f*cker shale crash hard, at any price. The craven shale bankruptcies will be widely welcome, especially if C-suite arrests are involved.
Mike Sutherland; yesterday was a bitch for all of us actually IN the oil and gas industry with skin and our own money. Like you, it seems, I feel shot at and missed, shit on and hit.
Personally I don’t blame a virus, nor OPEC, nor Russia; I blame a fiscally irresponsible unconventional US shale industry that keeps putting more product on the market at woefully unprofitable levels. The US shale industry has the market awareness of a bunch of grade schoolers.
I suspect thousands of good men and women went home last evening out of a job, never to come back. Most Americans are too stupid to care and even more are simply relishing in the idea that gasoline will now be below $2. Next week is as far as they can think.
Don’t expect any empathy here on POB; it’s basically a very anti-oil crowd and even those that promote shale oil economic viability, with misinformation, do so in hopes of getting shed of oil, and onto renewables, as fast as possible.
Keep your head up the best you can, pardnor. If you are not a Texan get down here as fast as you can and I’ll help you get elected to the Texas RR Commission. We can fix this mess, very painfully, but quickly, and ensure our country has crude oil and natural gas to use for decades to come.
“We can fix this mess, very painfully, but quickly, and ensure our country has crude oil and natural gas to use for decades to come.”
Very curious what steps someone with your experience would enact if they were in a policy making position? Restricting new shale drilling and completions?
Thanks.
Mr Shellman,
Can you point out the specific misinformation you are talking about?
I think oil will peak in the 2025/2026 time frame, at some point the world needs to gradually transition to other forms of energy or find a way to use less, probably both.
I wish you and Shallow sand and everyone that produces oil and natural gas to be successful.
Have you ever read a comment of mine where I hoped oil prices would crash so oil producers would do poorly?
A crash in prices and general volatility in the oil market is only good for those who trade oil futures, that is not me.
I buy and hold etfs for US total stock market, my hope is that th US economy and that of the World does well, it does not happen without an adequate energy supply either today nor in the future in my humble opinion.
Your opinions are always welcome, but if you are going to accuse someone of misinformation, then back it up.
You are not a fan of the US exporting oil.
Do a simple thought experiment where all nations follow that policy.
The US would be in a World of hurt if all nations followed you preferred policy on crude oil exports.
Hi Mike
I thank you for your kind words Mike, and yes I would be extremely happy to join you in Texas and lobby the RR commission to get this Shale overproduction problem addressed.
As I explained to Denis upthread, the shale companies have absolutely blown my business up (and a huge number of other businesses in Alberta) through not a competitive business model (which I can accept), but rather through brazenly telling investors tall tales about how ‘production efficiencies have allowed the realization of costs as low as $50…..$40…..$30…..$20!!!!! Yes $20!!! It was all just a huge scam. They couldn’t do it for those prices, it was just the C-suiters telling huge lies and filling their pockets likewise.
They bankrupted western Canada….they lied to their investors who never received a dime….they went massively into un-repayable debt and left a wake of economic dislocation, divorces, housing losses, broken families as a routine course of daily business.
I have so much more to say, but I just now deleted about 5 paragraphs because the whole thing really just reads as a cantankerous screech on a situation that has finally gone from bad to worse. Unthinkably worse.
I guess my final thought on this is…how long can the US print dollars to support the banks and the financial system? How long can it print dollars to support a shale industry? Is there no limit? Is there no overseers to any of this? I can hardly believe that this is happening in a country that I have such high regard for. I am strongly PRO USA and have been for decades…but the ’08 financial debacle (no one went to jail), the 2014 shale crash (no one went to jail), and now this…my faith in the USA is becoming sorely tested, almost to the point of ‘no confidence’.
Crude Oil and Natural Gas
This price is because of the coronavirus. No more serious than the flu? Well, the flu don’t cause shit like this.
Ron,
This is surprising too.
“Natural gas prices at the Waha hub in the Permian basin in West Texas fell into negative territory, forcing some producers to pay other parties to take their gas.”
“Analysts expect gas prices in 2020 to fall to their lowest since 1999.”
https://www.reuters.com/article/usa-texas-permian-prices/update-1-us-natgas-glut-swells-prices-turn-negative-at-texas-waha-hub-idUSL1N2AW0SU
OPEC’s crude production in February tumbled to 27.99 million b/d, its lowest level since March 2009, according to the latest S&P Global Platts survey.
https://www.spglobal.com/platts/en/market-insights/latest-news/oil/030520-opecs-feb-crude-output-at-close-to-11-year-low-deeper-cuts-loom?utm_source=hootsuite&utm_medium=twitter&utm_term=plattsoil&utm_content=003d6ef4-9e79-476b-838a-576f104e911e&utm_campaign=hootsuitepost
The Lybians are cheating! The production decrease in Lybia is caused by the blocking of oil production sites by supporters of general Haftar.
Well no, Libya’s export terminals have been blocked not production sites. Their storage tanks filled up in just a few days and so they had to shut down all their production sites.
But I don’t understand why you think this means they are cheating? Libya, along with Iran and Venezuela, are exempt from OPEC quotas.
Question: Will the price of oil have any effect on Permian output? It once did, just a few years ago. Why would it be different this time?
Ron. Look at shaleprofile. Permian production kept growing in 2015-16.
It really took off in 2017.
Shallow sand,
Correct. Most of the fall in tight oil output starting in 2015 was due to decreases in output from the Bakken and Eagle Ford over that period from 2015 to 2016.
If oil prices fall as much as they did in 2014-2016 (from $100/b to $30/b is about a 70% drop so from the recent peak of around $70/b in 2018 an equivalent drop would be a drop in the oil price to $21/b. Anything is possible, but I think the odds are less than 1 in 10 we will see the monthly average price for WTI reach $21/bo in the next 5 years.
I do expect the drop in price will affect Permian output, it grew by 815 kb/d over the past 12 months, I expect the rate of growth will be reduced in the next 12 months by a factor of 2 to 4 over the next 12 months, depending on the future price of oil. If the price of WTI remains at $43/bo or less, there may be no growth in Permian output over the next 12 months and perhaps a decline in output, dependent on the price.
The shale oil producers have 200 bn dollars to repay to their investors until 2024. That explains the fact they have less money for their drilling activity. In the same time, they need to drill more wells to maintain their oil production and then the cashflow they are using to repay their investors. Problem. Already, I don’t know, by supposing a stable oil price, how this can end. If, in addition, the oil price is dropping, that’s going to bring further complications to repay the investors and will raise the probability of bankruptcies among shale oil corporations. Therefore the probability to see a rise of shale oil production in the near futur seems lower.
One emergency solution is possible: The FED changes it’s internal rules so it can buy junk bonds direct from the market.
So they buy all oil bonds – and the oil companies can just roll the bonds into new. Problem solved, ahm, papered over. And the pumping can go on, no profit required.
The Fed governors have talked about an expansion of toolbox, but they have referred to purchase of ETFs, not below investment grade bonds. (Though there are ETFs devoted to junk, and that would be extremely amusing)
The BOJ buys ETFs. They presently own a pretty big % of total shares in Japan. SNB ditto. They are a big holder of Apple. And the ECB also buys ETFs. All this is done quietly. It gets reported and then gets off the headlines as fast as possible. If the Fed toolbox is to be expanded for oil support, it might be to buy oil sector ETFs with foreign precedent as justification. Drive those prices up and the companies can do secondaries to raise internal cash.
There have been, discussed here, somewhat recent suggestions of Fed intervention for oil. There were stories out that the Fed had influenced local Texas banks to modify covenants and postpone deadlines so shale oil companies could continue to produce. These stories got off the radar screen quickly, but my recall is there was confirmation in a Fed governor speech, but it got no follow up.
Oil price hit lows of $33, $26, $43, $47 in 2015, 2016, 2017 and 2018. No virus in any of those years. There was NYMEX whimsy in those years, though. Pretty much all that matters. Fed intervention in whimsy would be pretty cool.
A better overall response would be to restrict new drilling and well completion until the supply/demand ( and thus price) scenario improves.
In this headline from CNBC- it looks like many in the USA just expect OPEC , and Russia, to be the entities that respond to market forces.
‘Oil prices plunge 8% after OPEC+ fails to agree on a massive production cut’
Having the Fed intervene to bailout the oil patch, as some here suggested, is just piling on dysfunctional process on top of dysfunctional process (overproduction into a state of market abundance). Not a healthy recipe in any playbook.
Hickory,
In the absence of action by state agencies such as the RRC and other state agencies, letting the market determine winners and losers is the best we can do. The smart companies would respond by cutting back on their completion rate at the current oil price level. Time will tell which of the tight oil producers are smart. If history is any guide, not many.
Yeh, thats how I see it as well. I do feel sorry for those producers that are at the whim of a such a dysfunctional market however.
Yet, to expect opec and russia to fix the situation by cutting production is wishful thinking, and ignoring the lack of reciprocal action by the usa.
Agree 100% Hickory.
Hickory. I agree. Shale companies have no one to blame but themselves. They have drilled what are effectively millions of wells (if we call every frack stage an individual well, which in fact each kind of are) during a time of oversupply (that they caused).
We drilled our last well Q3 2014, and wouldn’t have drilled it had we known what was coming (we planned it at a time when WTI was $100, earlier in 2014). Our production has slowly but surely declined since, and will continue to do so until we see it makes economic sense to drill.
In our field there have been very few wells drilled since late 2014. Wells drilled in our field aren’t drilled with OPM.
Our wells on average cost $70,000 to drill, complete and equip. Total recovery of oil varies quite a bit, we hope over 30 years to produce 14,000 BO. There are examples of much better, and much worse.
If we say each frac stage is one well, and an example shale well has 100 stages and costs $10 million, we can say each stage or “well” cost $100,000. It looks like we can expect each well to produce 300-400 BO. So each stage on average we can expect to account for 3,000-4,000 BO.
The wells make absolutely no sense to drill, and haven’t since the price of oil effectively halved.
Unfortunately, XOM is a prime example of shale not working. XOM has a market cap that is much lower than when the Exxon Mobil merger closed 12/1/1999. 12/31/1999 the market cap was $280 billion. Today it is $202 billion. XOM’s US upstream results have nosedived since it ramped up shale well drilling.
I don’t see how XOM’s CEO can get away with saying its Permian wells are economic at under $40 WTI.
Assuming WTI stays low for awhile, I think we see US production fall. There will be a lag time, similar to 2015-16.
Shallow sand,
A difference perhaps is the high flow of the tight oil wells.
Consider the following thought experiment. Imagine your $70k well produced all of its EUR in 12 months rather than over a 30 or 50 year period.
I imagine the investment decision would be different.
The tight oil wells perform more like my hypothetical well than a conventional well so the economics may work a bit differently.
I agree none of the tight oil basins will be profitable at under $50/b with the possible exception of Chevron whose high NRI wells might get by at 45 dollars per barrel of oil.
I also agree at current oil prices oil output is likely to decrease in the US.
Decline In U.S. Shale Production Is Closer Than You Think
Summary
Shale production is transitioning from growth to consolidation, albeit at an uneven pace.
In this article we will discuss what we think the market is missing.
We think the turn will come (may have come already) by year’s end at the latest.
The market perception will then swing from surplus to scarcity.
Very Big SNIP
I don’t expect much help from OPEC as they are linked to the Russians now, and Russia seems happy with current prices. I haven’t had a chance to do any further investigation on this topic, but if it turns out to be actually the case that the Saudis are left to twist in the breeze, something we haven’t seen since 2014 could happen. In that scenario, I think they may go the other way and make a run for lost market share as they did in 2014. As I said in an earlier article, Putin is ready to give his buddy MbS (Mohammad Bin Salman Al Saud) some tough love. Will they come around eventually, I think so, but MbS is going to have to give something in return other than a bear hug.
When will I call a bottom?
You should be able to guess here. The bottom will be firmly set in when production from shale plays actually turns south. That will put the final nail in the coffin for the notion of ever increasing light oil from U.S. shale. When the market takes this into account WTI and Brent should head higher.
This is a very long article with lots of charts and graphs. Very well worth the read.
And on the demand side:
Lufthansa has cut it’s capacity by 50% now for the next weeks. Other will follow.
Brent is now -9%, one of the biggest drops I’ve ever seen in oil.
How do the Canadian companies handle this? They still have these huge pipeline issues resulting in much lower prices?
For other oil states it can get hard, too. Iraqu doesn’t have big reserves and needs lots of money to hold together.
Both brent and WTI are getting hammered. I think there is more potential for downside, but this is a good opportunity to buy(invest) for people who think oil will go much higher in the future.
This pandemic is the worst possible situation. It is a huge hit to demand that won’t respond to normal stimulus measures. People are frightened and governments will have to do extreme economy shutdowns. Other fundamentals don’t matter. That longer term the production is needed doesn’t matter.
https://www.bloomberg.com/energy
Seems WTI might fall below 40 usd.
Many Companies are burning cash at this level, not much left for dividend. Exxon might need to borrow more or sell assets to pay Permian bills…
https://oilprice.com/Energy/Energy-General/Oil-Tanks-As-Russia-Rejects-Deeper-OPEC-Cuts.html
https://www.cnbc.com/2020/03/06/oil-sinks-5percent-to-multi-year-low-on-uncertain-opec-deal.html
WTI currently at $42.18/bo, this seems like the fall of 2015 when many expected an OPEC cut which did not occur. That led eventually to an oil price of $30.62/bo for the month of Feb 2016 from a price of $105/bo in June 2014 (about a 70% drop in the price of WTI). A similar drop from the recent high of $71/bo in Oct 2018 might lead to a price of $21/bo. If OPEC decides to battle Russia and other non-OPEC members of OPEC+ for market share we might see this occur. Hopefully not.
It will sure be interesting. Perhaps we will now find out how much of OPEC´s cut is voluntarily. I doubt most of it is.
Jeff,
Excellent point. It is possible that OPEC and Russia will not be able to raise output significantly as they did in 2015/2016, if that is in fact the case, oil prices might not drop as badly, though in this case we may have a significant drop in demand so we may still see a big drop in oil prices. Difficult to predict what will happen.
KSA crude inventory is at a paltry 155 MM barrels. The effect of Abqaiq attack is still unknown. Unrest in KSA is growing as shown by the arrests today. There is no way KSA can live with such low oil price.
I see Ron Patterson graph for OPEC and it does not look good.
I firmly believe KSA production will not exceed 10 MM barrels/day.
And Trump has no handle on coronavirus and that may take him down more than the Chinese.
Layoffs imminent in energy sector and Texas will go democrat if job loss happens in this sector. And a person in onshore posted this on energy investing board after a meeting.
Hold on tight because we are hitting the breaks so hard on all capital (projects) that some of us are going to get splattered on the windshield.
They don’t need to raise output, demand is falling of a cliff worldwide hit by Corona and inflicting economy crisis, just maintaining the acctual level will already oversupply the market by a huge margin.
Russia hit – already weak – US shale hard – most probably from their point of view the price crash/demand crunch would come anyway, why further encourage and support the already knocked on main competition ?
Shock them!
This time the weakest marginal producer has to react, which IS US Shale.
– and the resulting harvest of this cleanup will be even larger for the big player when the storm is over.
Crude will dive under 40$ – and today, no one can predict when this crisis will end – The smart US players probably will quickly go into full entrenchment mode, like in the past storm.
Decline will maybe pick up even faster then 2016, simply because of the higher share of quick depleeting US Shale production.
And it looks like most US Shale fields like EF and Bakken will never come back to new highs after the comming decline not only because of lack of capital but also because lack of Tier1, which was not an issue few years ago.
So with this friday results it really loooks like 2019 could indeed be US Peak and maybe World Peak.
Envision,
I disagree that 2018 or 2019 will be the peak. I maintain my guess of 2025 or 2026. It is possible the lower output due to the demand crash might even delay the peak to 2027/2028. The oil is there if it is not produced in 2020 or 2021 due to low oil prices, then it will be there to produce in the future.
The road looks very rocky for oil.
https://www.haaretz.com/middle-east-news/saudi-arabia-detains-two-senior-royals-over-suspected-coup-plot-sources-say-1.8636407
Lightsout,
Near term, yes. Medium term oil prices rise and oil production will be profitable.
Shallow sand,
I think 30 to 50 stages may be typical.
In 2017 in the Permian the average was 42 stages per well.
Does not change your math though. The fast decline may make the economics different from a conventional well. A very profitable well would produce all of its oil in 12 months rather than over a 50 year period.
Why do I feel like KSA and Russia played the “good cop bad cop” act to crush shale? Aramco announced
7 $/barrel price drop. We are look at WTI opening another $6-7/barrel more. Lot of layoffs and bankruptcies looming. KSA and Russia will also take out a lot of OPEC players as well.
Thanks
This:
https://www.bloomberg.com/news/articles/2020-03-07/saudi-aramco-slashes-crude-prices-kicking-off-price-war
Dennis, please check your email as I have an important message. Delete this post after you read it.
Ron
Pardon if this news has already been posted.
Saudis Plan Big Oil Output Hike, Beginning All-Out Price War- March 7, 2020, 2:55 PM PST
https://www.bloomberg.com/news/articles/2020-03-07/saudis-plan-big-oil-output-hike-beginning-all-out-price-war
“Saudi Arabia plans to increase oil output next month, going well above 10 million barrels a day, as the kingdom responds aggressively to the collapse of its OPEC+ alliance with Russia.
The world’s largest oil exporter started a price war on Saturday by slashing the prices it sells crude into foreign markets by the most in at least 20 years, offering unprecedented discounts in Europe, the Far East and the U.S. to entice refiners to purchase Saudi crude at the expense of other suppliers.”
Hickory. I read several Bloomberg articles, including one where a Russian official was quoted that US shale needs to bear these cuts.
Looks like 2016 lows will be tested, maybe broken through.
CLR forecast to hold oil flat and grow gas 4-6% with $55 WTI and $2.50 HH. Said this would generate $350-400 million of free cash flow, with a $5 change in oil price changing that by $300 million.
$30 WTI for 2020 would mean negative free cash flow of $1.5 billion. CLR said if prices dropped they would cut CAPEX, and would do everything possible to be cash flow positive.
CLR couldn’t be cash flow positive at $30 WTI for 2020, CAPEX would be cut to nearly $0 and production would drop so fast, they’d still be in the hole.
Will any shale rigs be running after a few months of $30 WTI (or lower)?
We will be in survival mode at those prices. I can assure you US conventional will also drop a considerable amount.
Dennis, where do you see US oil production ending 2020 if WTI averages $30 the remainder of 2020? 10 million BOPD?
Curious as to why they think that this is just a Saudi vs Russia battle, and not involving everyone with oil?
“Saudis Instigate Oil-Price Clash With Russia”
https://www.wsj.com/articles/saudi-aramco-shares-fall-below-ipo-price-for-first-time-11583663747
Shallow sand,
See chart below for a scenario with WTI price under $40/b until 2022 and gradually rising to no higher than $50/bo by 2028. Completion rate for tight oil wells falls to half current level by late 2021 and then gradually recovers to about 75% of current completion rate bu 2024 and then remain at that level until 2027 and gradually decreases beyond 2027.
As always this is a WAG because I cannot foresee future oil prices, completion rates or any other events of the future.
At least 20 princes detained in mass purge by Saudi crown prince
https://www.middleeasteye.net/news/exclusive-least-20-princes-detained-mass-purge-saudi-crown-prince
Another shakedown perhaps secondary to shrinking pie and inter elite rivalry.
https://www.forbes.com/sites/davidblackmon/2020/03/07/russia-yanks-a-leg-from-us-shales-three-legged-stool/#320cb2e1720a
https://finance.yahoo.com/news/putin-dumps-mbs-start-war-172746296.html
I think maybe there’s some more details and background info in this article that’s not in the others already posted.
The Great Saudi Shale Swindle
Saudi Arabia’s oil and gas giant, Aramco, has been given the go-ahead to launch the Jafurah shale gas field project, which will be the biggest shale gas development outside the U.S. The official reason is that the project will boost domestic gas supply and end the burning of oil at its power generation plants. The first reason is true by dint of the fact that it is a simple truism whilst the second is only partly true. It is extraordinarily unlikely to end Saudi Arabia’s oil burning at its power generation plants – given Saudi Arabia’s history of lying in this regard – but it may possibly reduce it. The core element that Saudi did not mention in its official comments on this issue is that the Kingdom will desperately need another primary energy source in the relatively near future because it has nowhere near the amount of oil remaining that it has stated since the early 1970s.
OPEC deal collapse sparks price war: ‘$20 oil in 2020 is coming
″$20 oil in 2020 is coming,” Ali Khedery, formerly Exxon’s senior Middle East advisor and now CEO of Dubai-based strategy firm Dragoman Ventures, wrote on Twitter on Sunday. “Huge geopolitical implications. Timely stimulus for net consumers. Catastrophic for failed/failing petro-kleptocracies Iraq, Iran, etc – may prove existential 1-2 punch when paired with COVID19.”
I doubt that we’ll see $20 oil. Everybody including the Saudis would be losing money at this price. It ain’t gonna happen.
We might see $20s WTI tomorrow. I hope not but if I had to bet, this is how I’d bet.
Keep in mind most US producers are getting $30s at the well, some are already getting $20s at the well.
I assume shale rigs will stack similar to, or worse than 2015-16. The shale companies are in worse shape financially now than in 2015-16.
The wildcard will be the hedges. And here is where counter party risk could rear its ugly head. I don’t know the financial strength of the shale companies’ hedging counter parties. I have seen rumors that one energy trading firm blew up Friday.
Really hard times ahead. Ugh.
Hi SS,
It will probably gap much lower at tomorrows open. Not sure about $20 tomorrow, but maybe a week or so it might test the 2016 lows.
I think if this leads to a liquidity crisis, which is possible, the corporate debt levels are ridiculous, oil might test the 2000 lows, Brent ~ $20. The central banks would be probably using helicopter money to avert this crisis if it was to play out.
Hard to predict as usual how it might play out.
New Electric Power Monthly and Open Petroleum Threads have been posted.
A new OPEC post is up.