A post by Ovi at peakoilbarrel
All of the oil (C + C) production data for the US state charts comes from the EIAʼs Petroleum Supply monthly PSM. After the production charts, an analysis of three EIA monthly reports that project future US production is provided. The charts below are updated to December 2020 for the 10 largest US oil producing states.
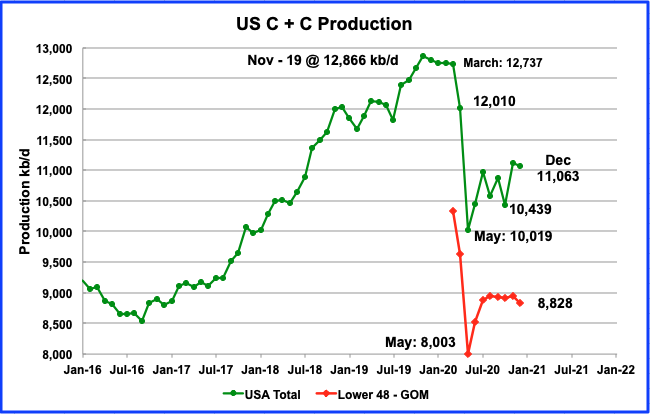
Decemberʼs U.S. production decreased by 58 kb/d to 11,063 kb/d from Novemberʼs output of 11,121 kb/d. December’s decrease was largely due to the top three producing states, Texas, ND and NM all having lower output.
The effect of the output decrease from these three states can be seen in the December onshore L48 production graph which shows a total drop of 127 kb/d to 8,828 kb/d. Of the 127 kb/d decrease, the three states contributed 114 kb/d, or 89.7%. The only significant increase came from the GOM which added 70 kb/d to December’s output.
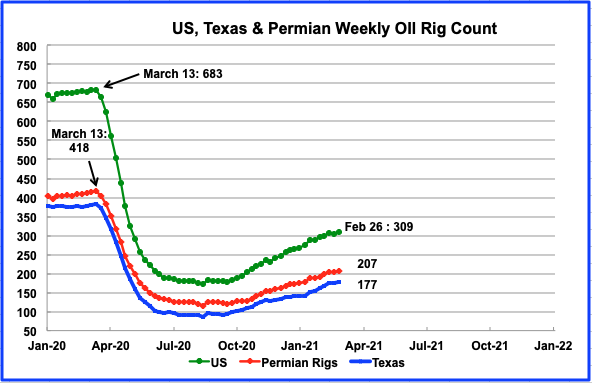
There has been essentially no increase in oil production in the onshore L48 from August to November and then a large decrease in December. During August there were close to 180 rigs operating in the US. By December the US rig count had increased to close to 260. The increase in rigs was not sufficient to offset the continuing output decline from LTO wells that were online. At the end of February 309 rigs are operating.
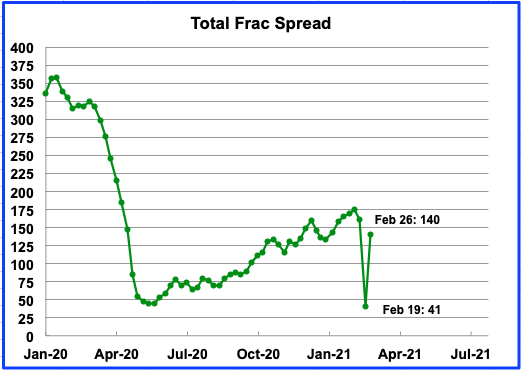
Frac spreads had an unusual occurrence due to the winter storm in the US in late February. There was a big drop in frac spreads to 41 in the week of February 19 and then a rebound to 140 in the week of February 26. It is not clear to me on how to explain this big change. Was this simply a question of the frac crews leaving their job site and going home to fix things?
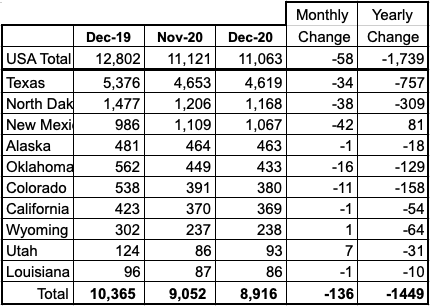
Listed above are the 10 states with the largest US production. These 10 accounted for (80.6%) of US production out of a total production of 11,063 kb/d in December 2020.
Note that of all these 10 states, only two had small increases on a MoM basis. On a YoY basis, New Mexico was the only state that recorded an increase.
Production by State
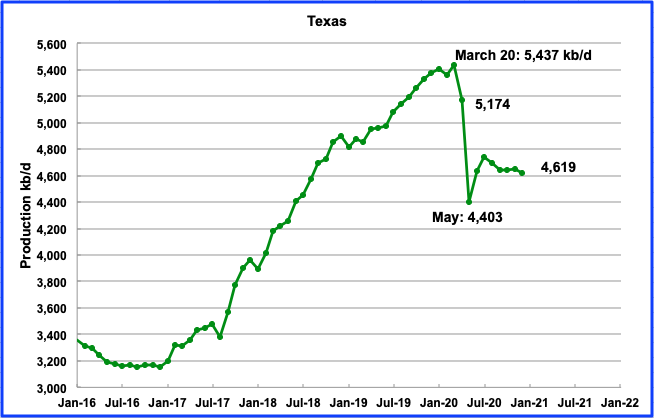
Texas production decreased by 34 kb/d in December to 4,619 kb/d. During December, approximately 139 rigs were operating in Texas, up from a low of 90 in July and August. Since July, production has fallen by 122 kb/d even though the rig count continued to increase. In the week of February 26, 177 rigs were operating. Will the increasing number of rigs be sufficient to increase production or reverse the decline?
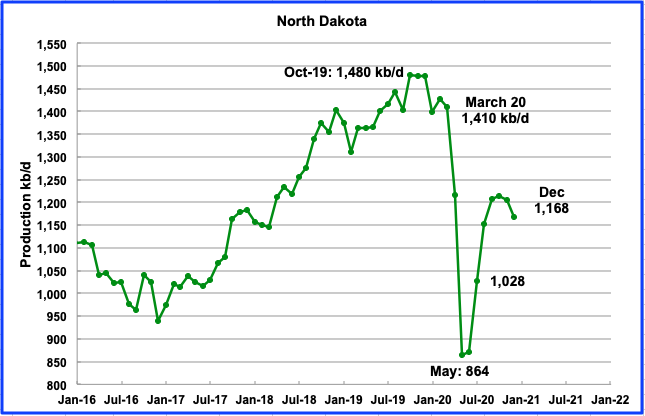
Decemberʼs output was 1,168 kb/d day, a decrease of 38 kb/d from November. During November and December 11 oil rigs were operational. By the last week in February, the rig count had increased to 14.
According to this source: “A total of 74 well completions occurred in the state in November, but by December that had dropped to 44 due to harsher winter weather conditions. Helms noted North Dakota needs 60-70 completed new wells coming on each month to maintain production of 1.2 million b/d.”
The number of wells operating in the Bakken in December decreased by 21 from 2,637 to 2,616, according to this source .
North Dakota’s rig count started to increase in mid January and had increased from 11 to 14 by the end of February.
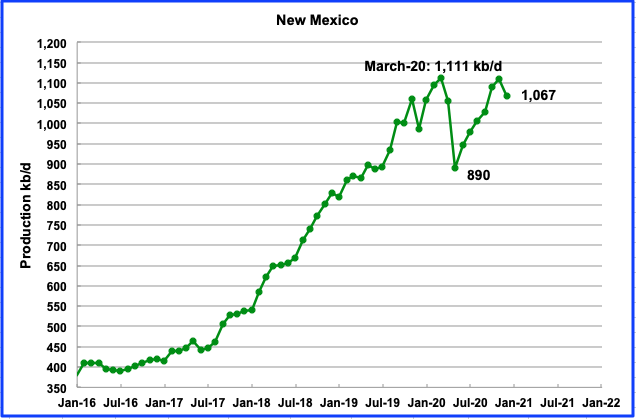
Decemberʼs New Mexico production decreased by 42 kb/d to 1,067 kb/d.
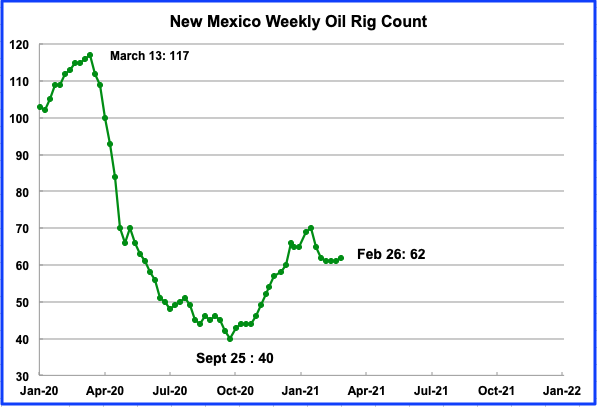
New Mexico has been adding rigs since late September which accounts for the increase in production up to November. The December decrease may be related to covid according to this source.
“An economic downturn struck southeast New Mexico in late 2020 as the COVID-19 pandemic and business restrictions aimed at stemming the spread of the virus created a slump in fuel demand and reduction in fossil fuel development.
Eddy and Lea counties situated in the southeast corner of the state amid the Permian Basin – the state’s most active oil play – both saw declines in operations and state revenue suffered as New Mexico’s budget was heavily reliant on revenue from oil and gas.”
Operators in NM started to decommission rigs in mid January, possibly due to the continuing influence of covid.
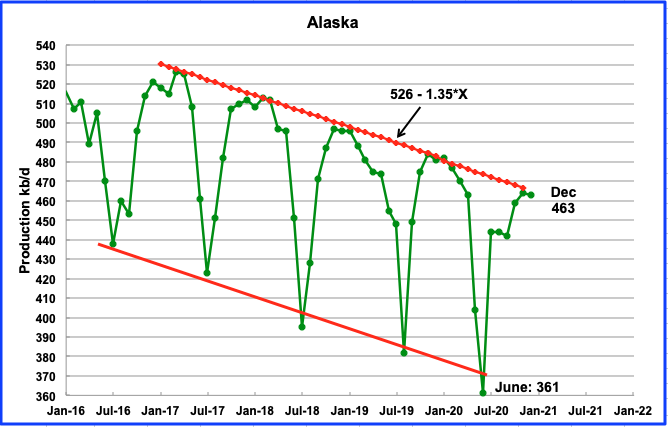
Alaskaʼs December’s output decreased by 1 kb/d to 463 kb/d.
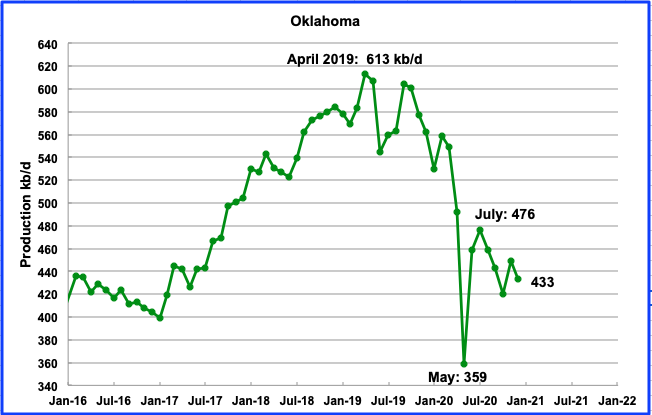
Oklahomaʼs December’s output decreased by 16 kb/d to 433 kb/d. During December, 14 rigs were operating and the number has gradually increased to average 17 during January and February.
During December, Oklahoma averaged 3,000 CV cases. This could have further affected the oil output during December.
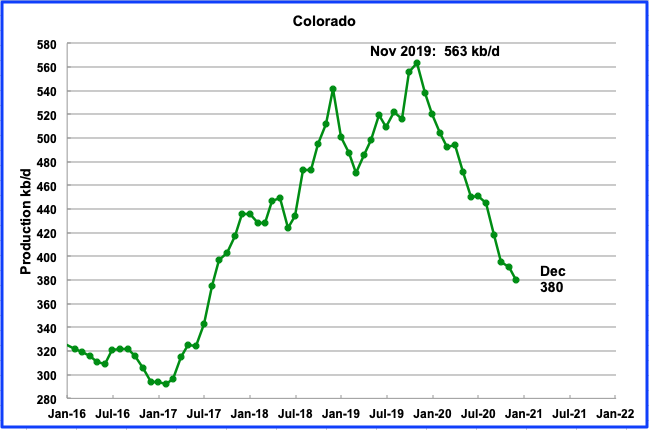
Coloradoʼs December output decreased by 11 kb/d to 380 kb/d. Colorado had 6 rigs operating in December. Declining production continues to be associated with the pandemic and new environmental regulations, according to this source.
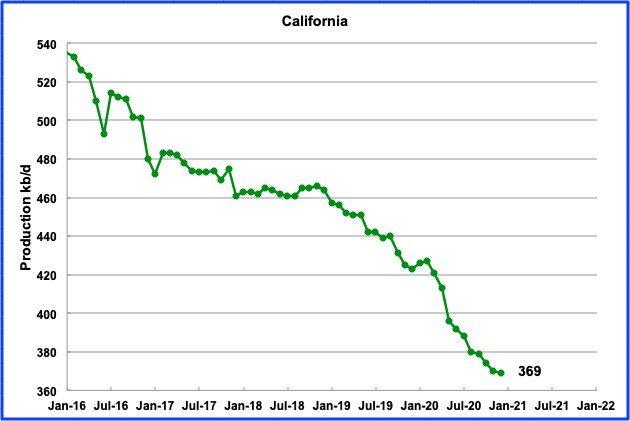
Californiaʼs slow output decline continued in December. Its production dropped by 1 kb/d to 369 kb/d.

Wyomingʼs production in December increased by 1 kb/d to 238 kb/d. Wyoming had a total 3 oil rigs operating in December and they increased to 4 in 2021. Wyoming’s oil production appears to be stabilizing around 240 kb/d. According to this source, Wyoming oil sells at a discount of $4 to $6 to WTI.
“Wyoming’s crude oil prices, which typically track $4–6 less than national benchmark WTI prices, averaged less than $11 per barrel in April—a monthly average that had not been seen since the 1980s.”
“That led to a halting of new drilling and the WSGS said that many existing wells either temporarily stopped producing or were shut in.”
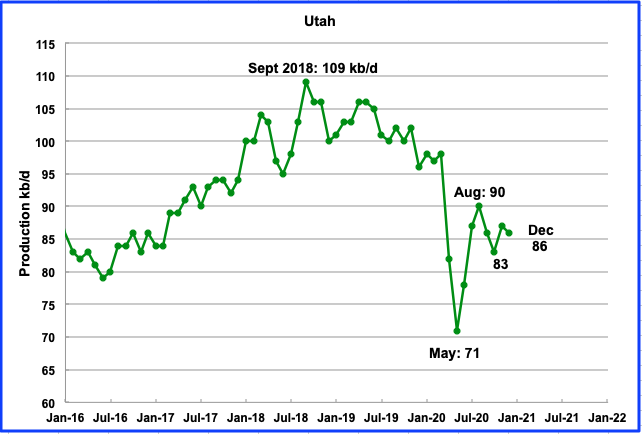
December production decreased by 1 kb/d to 86 kb/d. Three oil rigs were in operation from November to January. According to this article, Utah’s waxy crude requires insulated trucks for transportation. It also notes that covid has been affecting oil production.
“Pandemic impacts were keenly felt in Utah because the waxy crude produced in the Beehive State requires insulated trucking to transport and is more expensive to refine, according to the report. That factor already puts Utah at an economic disadvantage, the report notes, because refineries can demand a lower price per barrel.
“At the onset of the pandemic, layoffs in the natural resource sector drove double-digit unemployment rates in the oil and gas producing region of Duchesne and Uintah counties, and while those rates have recovered somewhat, they remain higher than the rest of the state.”
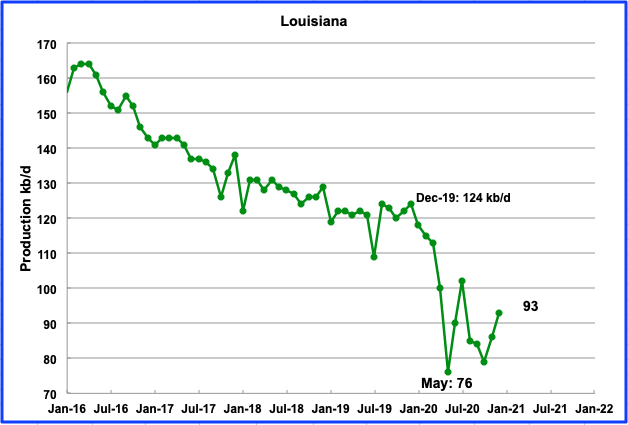
Louisianaʼs output increased by 7 kb/d in December to 93 kb/d. In December, Louisiana had 14 rigs operating. They have been slowly adding rigs and now have 16 rigs operating in February.
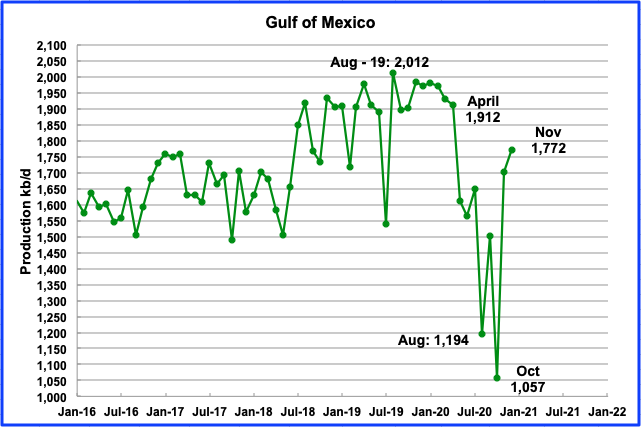
Production from the GOM continued to rebound in December to 1,772 kb/d, an increase of 70 kb/d. If the GOM were a state, its production would rank second behind Texas.
UPDATING EIA’S THREE OIL GROWTH PROJECTIONS
1) SHORT TERM ENERGY OUTLOOK (STEO)
The STEO provides projections for the next 13 – 24 months for US C + C and NGPLs production. The February 2021 report presents EIAʼs updated oil output and price projections out to December 2022.
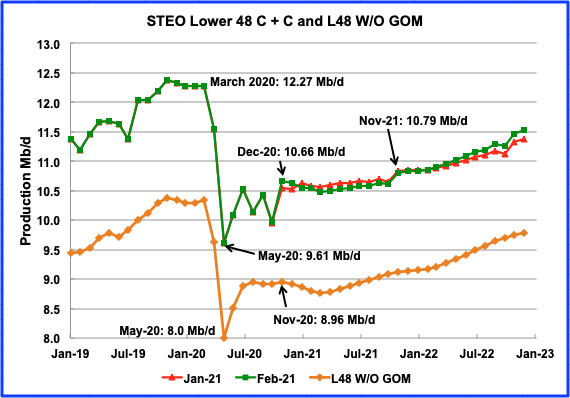
The February STEO output projection for the L48 states is very similar to the one that was provided in the January. The EIA is projecting very little change in production from December 2020 to October 2021. Not till November 2021 does output exceed the projected December 2020 output of 10.66 Mb/d.
In the onshore L48, L48 W/O GOM, production is projected to reach its low point in March 2021 at 8.76 Mb/d.
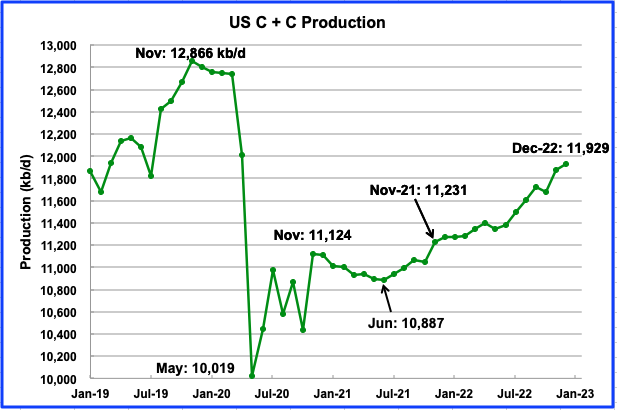
According to the STEO, US output is projected to drop to a low of 10,887 kb/d in June before resuming its climb. The average projected rate of increase from June 2021 to December 2022 is 57.9 kb/d/mth. Will the output drop from November to June result in more US imports and help reduce world inventories?
The STEO’s December projection of 11,109 kb/d compares well with the actual production which was reported as 11,063 kb/d in the first chart above.
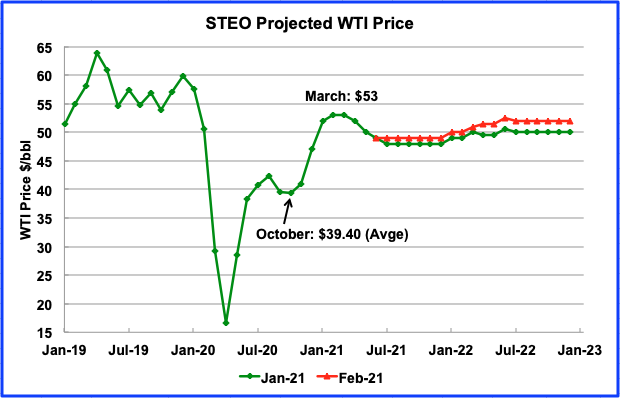
The February 2021 STEO is projecting a WTI price of $53/bbl in March 2021 before beginning to decline back to $49/b in July, a $1 increase over the previous January report. The April WTI contract settled at $61.50/bbl on February 26, $5 higher than the EIA projection, which was released on Feb 9, when WTI was trading in the $58 range.
2) DRILLING PRODUCTIVITY REPORT
The Drilling Productivity Report (DPR) uses recent data on the total number of drilling rigs in operation along with estimates of drilling productivity and estimated changes in production from existing oil wells to provide estimated changes in oil production for the principal tight oil regions. The following charts are updated to March 2021.
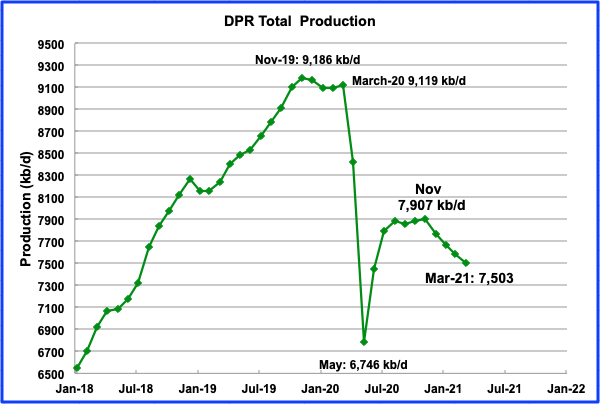
Above is the total oil production from the 7 basins that the DPR tracks. Note that the DPR production includes both LTO oil and oil from conventional fields.
According to the February report, the DPR basins oil output bottomed in May 2020 at 6,746 kb/d and recently peaked in November at 7,907 kb/d. The DPR is projecting output for March 2021 to be 7,503 kb/d, down 78 kb/d from February and 404 kb/d from November. Since November, the average decline rate has been close to 101 kb/d/mth. According to ShaleProfile, the current number of horizontal rigs, 312, is not sufficient to increase LTO production in the US.
The contribution from three of the DPR/LTO basins is shown in the charts below.
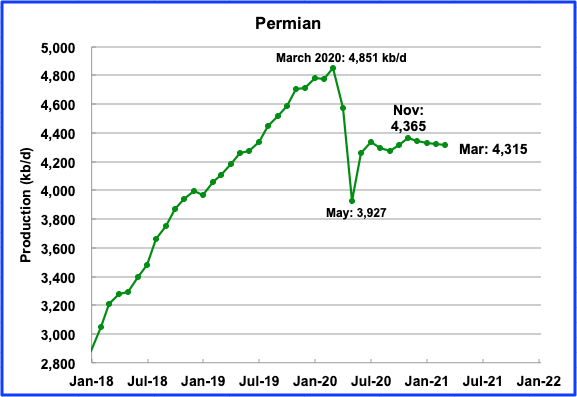
Permian output in March 2021 is projected to be 4,315 kb/d, down by 5 kb/d from February. Output began to decrease after the recent November high of 4,365 kb/d. In the week of February 12, 142 rigs were operating in the Permian, up from 100 in November. Even though 42 rigs were added from November to February, output did not increase but the projected decline rate is slowing.
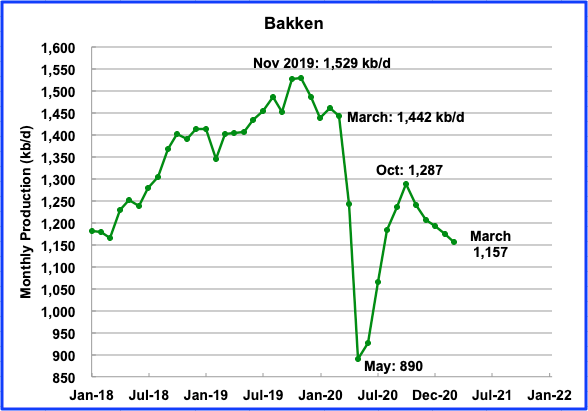
Bakken output in March is projected to be 1,157 kb/d a decrease of 18 kb/d from February
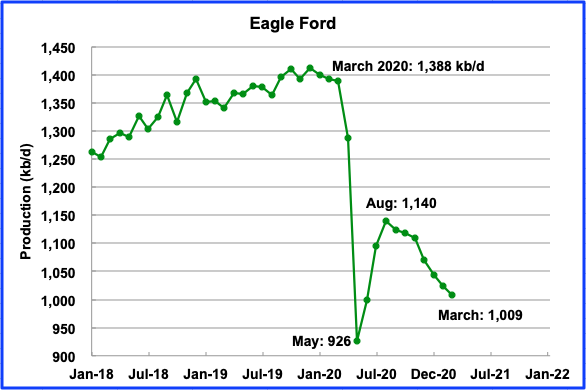
After bottoming in May, Eagle Fordʼs output reached a recent peak in August and then began to roll over. In March, Eagle Ford output is projected to drop by 16 kb/d to 1009 kb/d. The average monthly decline rate since August has been 18.7 kb/d/mth. Note that February’s output in the February DPR was revised up 27 kb/d to 1,025 kb/d while August was revised up by 19 kb/d.
3) LIGHT TIGHT OIL (LTO) REPORT
The LTO database provides information on LTO production from seven tight oil basins and a few smaller ones. The February report projects the tight oil production to January 2021.
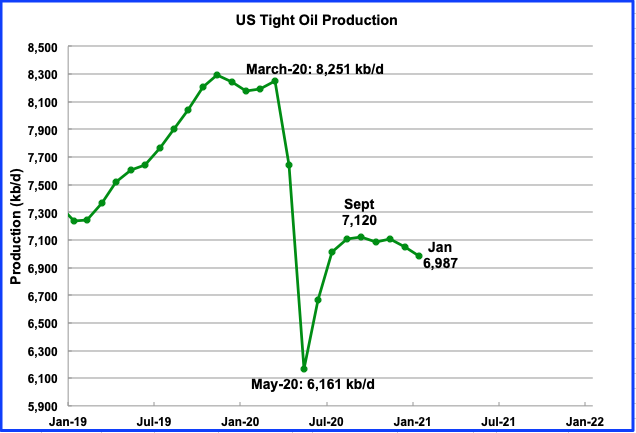
Januaryʼs LTO output is expected to decrease by 59 kb/d to 6,987 kb/d from Decemberʼs 7,046 kb/d. US December production was 11,063 kb/d. LTO output represents 63.2% of US production.
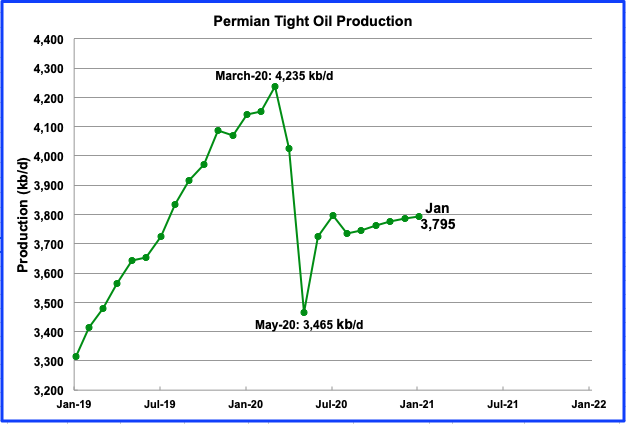
Permian LTO output in January is projected to be 3,795 kb/d, an increase of 9 kb/d from December. There were 170 oil rigs operating in the Permian in December and 175 in February. This number of rigs is barely keeping up with the decline.
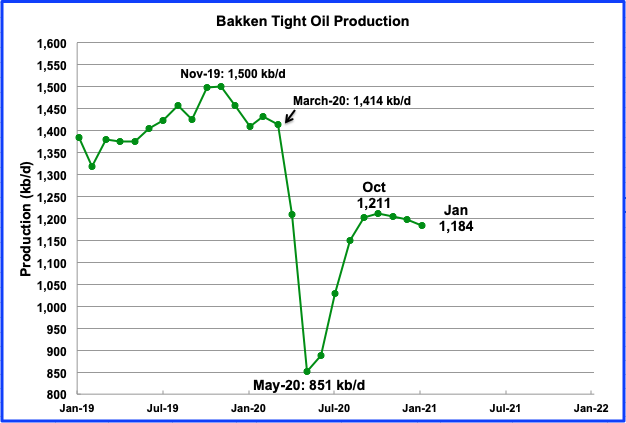
The Bakkenʼs January output has continued the decline after the recent peak was reached in October. In November and December, 11 rigs were operational and they increase to 14 in February.
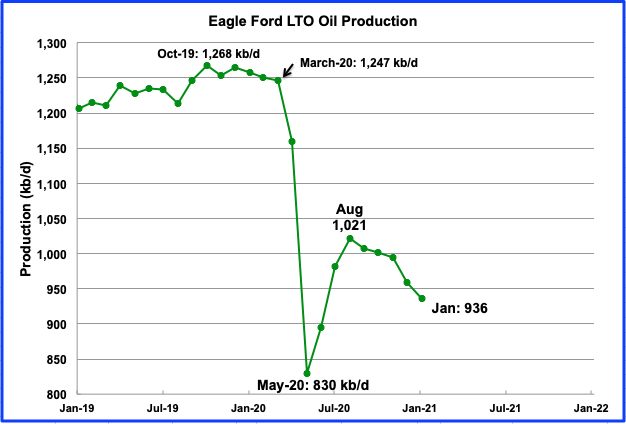
The Eagle Ford basin is expected to produce 936 kb/d in January, a decrease of 85 kb/d from August. The number of rigs operating in January was 27, up 6 from December. In February 28 were operational.
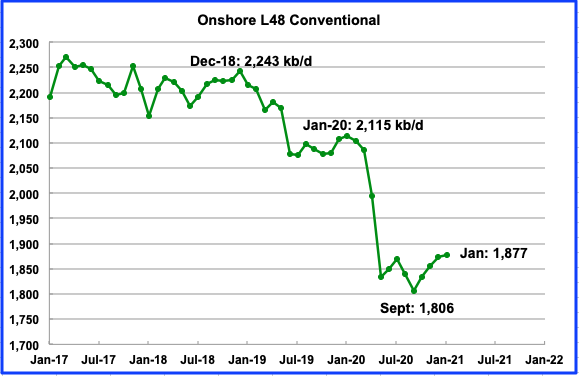
Conventional oil output in the On-shore L-48 is expected to reach 1,877 kb/d in January 2021. This estimate is based on a combination of the February LTO report and the STEO February report that projects US on shore L48 to January.
World Oil Production W/O US
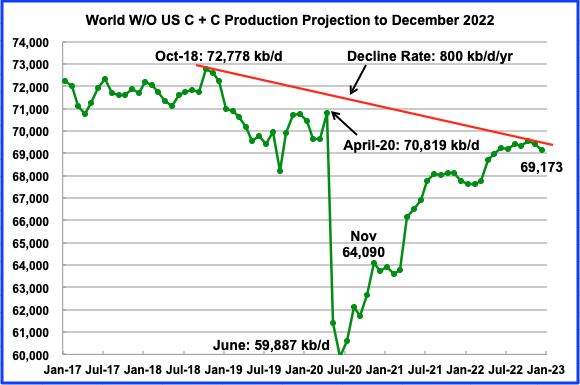
World oil production W/O U.S. reached its lowest level in June 2020 at 59,887 kb/d. According to the EIA, world oil production W/O U.S. in November recovered to 64,090 kb/d.
This chart also projects world oil production out to December 2022. It uses the February STEO report along with the International Energy Statistics to make the projection. It projects that world C + C production will increase to 69,173 kb/d in December 2022. The October 2022 high of 69, 544 kb/d is a drop of close to 3,200 kb/d from the October 2018 high of 72,778 kb/d or a decline rate of 800 kb/d/yr. Will the world W/O US exceed the October 2022 output of 69,544 kb/d beyond 2022 if demand exceeds that level.
137 responses to “US December Oil Production Drops”
Ovi,
The explanation for frac spread count is that the figure is active frac fleets. When temperatures in Texas go to subzero ( which occurs about once every 30 years or so) the oil service companies were not prepared for the Arctic weather and were unable to operate the frac fleets in those conditions. Operations were shut down for a week, then they resumed as weather improved. In a few more weeks as repairs on ruptured water lines, etc are completed, the frac spread count is likely to return to 160.
For World C plus C W/O US the 12 month centered average was about 65000 kbo/d for the most recent 12 months, the peak was mid 2018 at about 72000 kbo/d, US output was about 11 kbo/d for the centered 12 month average in mid-2018, similar to the latest monthly output level which can be maintained relatively easily (no need for substantial increases in well completion rates). My guess is that OPEC, Russia, Brazil, Norway and Canada can offset declines in other nations as well as increase output by 7 Mbo/d so that the 2018 peak can be reached again and likely (greater than 65% probability) surpassed in my opinion.
Dennis, I must disagree with your assessment. OPEC peaked in 2016. Yes, Iran can come back and increase production by about 1.5 million barrels per day. But that still will not make up for the decline in the rest of OPEC. No need to mention Venezuela, they may come back around 2030 or so, long after the peak has passed.
Russia said they had peaked in early 2020. I see no reason to think they were lying.
That leaves Brazil, Norway, and Canada. They all three may increase production but nothing spectacular. Not nearly enough to make up for the rest of the world in decline.
I’m inclined to agree with Ron. So much investment deferred because of 2014 and 2020 price crashes. LTO can come back quickly if the price stays consistently high (a big if) but it won’t be enough to save the day. Investors are expecting cash from LTO these days, not production increases. I imagine most other countries are just coasting after the turmoil of the last year. Also still plenty of wildcards in the collapse department over the next 5-10 years: Iraq, Nigeria, Libya, etc.
Stephen,
Higher oil prices are likely if supply of oil is short and that makes it less likely that oil exporting nations will collapse. The likelihood that many will collapse and none will recover (Nigeria already has seen decreasing production and Iraq and Iran are more likely to increase output, Libya might fall apart, but they may be war weary and keep things together for a few more years, I doubt we will see Venezuela get back on track (but I also thought a year ago that Libya would not settle political difficulties over the ensuing 5 years).
Ron,
There will be a peak, the timing is uncertain in my opinion, you believe it is in the past, I do not think we will know until the World economy has recovered from the pandemic.
The 2016 OPEC peak would have coincided with US output of 8.8 to 8.9 Mb/d (12 month centered average US C plus C output). My guess is that OPEC can reach their more recent 2018 peak 12 month centered average output (before they cut output to support oil prices), Iran an come back and the declining OPEC producers (with the exception of Venezuela) are a relatively small overall decline in C plus C output in absolute terms.
In any case we will see what happens when the Brent spot price reaches $75/bo in 2020$ over a 12 month period (monthly average 12 month oil price). My guess is that the 12 month centered average for World C plus C output (83031 kb/d, December 2018) is likely to be surpassed, probably between 2026 and 2030, with a likely peak of 84000 to 86000 kbo/d (best guess 85000 kbo/d).
Well Coyne, you’re opinion is just really wrong.
We will see, in the past my opinion has been wrong as well. I expected a peak in World C plus C output around 2020 at 80 Mbopd. The peak was close to 83 Mbopd in 2018, so I was low by 3 Mbopd. The problem with my estimate was a low URR of 2500 to 2800 Gb.
My current best guess for World C plus C URR is 3400 Gb +/- 200 Gb for the 68% confidence interval.
Dennis/Ron/Stephen
Here is some info I have collected on some of the countries listed above.
Norway
-The Johan Sverdrup field in the Norwegian North Sea is expected to increase its production capacity to 535,000 b/d of oil by mid-2021, according to operator Equinor.
– Phase 2 will be for a fifth Platform P2 capable of processing 220,000 barrels per day.
– 720,000 barrels/day is the maximum estimated daily production after Phase 2 comes on line after 2022.
– 500,000 barrels/day have already been brought on line.
– 220 kb/d to go by 2022/3
Guyana
– “The US major (XOM) is projecting output from Stabroek to reach 750,000 b/d by 2026, a year later than originally planned following a protracted political impasse in Guyana and pandemic restrictions.
– Yearly increase, roughly 150 kb/d.
Russia
– 130 kb/d
– Since 2010, Russia has added on average 130 kb/d/yr up to January 2020. However Russian spokespersons have said that Russia is near their production limit.
Canada (kb/d) Projection by CAPP
2020 2025 2030 2035
Total Oil 4,940 5,486 5,664 5,855
Oil Sands 3,332 3,732 4,028 4,399
100 kb/d/yr up to 2025 and then a lower rate.
Brazil
– 100 kb/d/yr up to close to 2030 according to Platts. This projection May be optimistic since Brazil’s planned lease sales have not gone well and getting oil out of the pre-salt fields is proving to be difficult.
https://www.spglobal.com/platts/en/market-insights/latest-news/electric-power/123120-commodities-2021-brazil-eyes-more-oil-industry-reforms-to-lure-investors
Adding this all up to 2025 gives the following:
kb/d/yr
Norway: 100 up to 2022
Guyana: 150 up to 2026
Russia: 130
Canada: 100 up to 2025
Brazil: 100
Total: 580 kb/d/yr
Let’s round it up and say 600 kb/d/yr max. Note that Norway’s contribution stops in 2023 and Russia may be questionable after 2022 based on some of their comments.
This will barley offset the yearly decline of roughly 800 kb/d/yr. Throw in increasing demand and we may be putting stress on OPEC in a few years if demand returns to close to pre pandemic levels.
I am not aware of any other major fields coming online. Guyana is a possibility.
Ovi,
There are likely developments by National Oil companies that we are not aware of, but also note that the STEO projection may be wrong. I doubt the 800 kbo/d decrease due to OPEC cutting output to solve oversupply problem will continue. Below I show the EIA’s International Energy Outlook 2019 reference case for World minus US C plus C output to 2035. After 2023 they project increasing output.
How the EIA’s administrators can predict economic growth at such long term? They are still in the world of those who are thinking that positive economic growth has to be infinite in secula seculorum? In France, that’s called ”croissance structurelle de long terme” and it is implied that it has to be positive. But how a long-term structural growth can be positive with future shortages of mineral resources (such as oil, copper, iron, phosphate…)? That’s just nonsensical.
Thanks Dennis, that’s a good one! How are you reconciling this nonsense from the EIA with the excellent breakdown by country from Ovi above? Abiotic Oil?!
Stephen,
Ovi covers a couple of nations. He leaves out OPEC. I include EIA estimates because Ovi uses some of them, such as STEO and DPR,
The long term international outlook is include for reference only. I agree that it is probably wrong, as is the case for every long term scenario.
Dennis
The 5,000 kb/d supply increase from November 2020 to October 2020 is comprised of roughly 3,200 kb/d (Opec), 900 kb/d US and 1,000 Russia. The OPEC drop between Jan 2020 and Feb 2021 is close to 4,000 kb/d. So how much sustained capacity does OPEC have beyond the January 2020s, 29,500 kb/d. Beyond 2022, they might get back to 30,500 kb/d, which is 5,000 kb/d higher than November 2020 or 1,800 kb/d more than the 3,200 kb/d that they bring back online by late 2022. That could be used up by increasing demand after a year or two.
The thing to watch in the US is what happens to the rig count. My sense looking at the latest rig chart above is that the rate of rig additions is starting to slow and may plateau around 350. Clearly the price of WTI will have a lot to do with what happens in the LTO basins along with the getting more vaccines in people’s arms.
Once the US and European economies start to come back, demand will begin to rise. I think by July we will have a better idea on how effective the vaccine has been in restarting the economy and what is happening with oil demand.
Ovi ,agree with you 100 % . I might add that what matters is not rig count but completions . There are DUC’s waiting to be completed . However I have already opinionated that the DUC’s are nothing but financial red herrings . Most of the DUC’s are not worth completion .
HH
Agreed, yes completions.
Unfortunately I can’t get those for every week.
Correction, first sentence:
….supply increase from November 2020 to October 2021 ……
Ovi,
OPEC output for OPEC minus Venezuela and Iran will return to roughly the peak level, if a deal is reached with Iran, they will return to their level of output prior to the Trump sanctions. Russia will also return to their output level of 2018 (12 month average). On top of that we will have the increases from Norway, Brazil, and Canada that you already outlined and if oil supply is short and oil prices rise above $75/bo then US C plus C output will surpass its previous 12 month average.
In addition Iraq might be able to increase output if needed and perhaps a few other Gulf states (such as Saudi Arabia, UAE, and perhaps Kuwait.)
Output will plateau from 2028 to 2033 and then will fall as demand starts to wane as the World starts to transition away from petroleum fuel. I agree with Ron that peak supply will happen before peak demand, but I think it will only be 5 years or so where supply is constrained and perhaps oil prices will spike, the high oil prices( if they occur) will accelerate the transition to electric land transport. I doubt oil prices rise much above $100/bo in 2020 US$.
Dennis
The decline of 800 kb/d will offset the increases that you mention. I think that the 800 kb/d is pretty reasonable since it is slightly more than 1% of the annual Non-OPEC production. I even think thst 1% may be too low.
As for SA and Ghawar, I think it is in trouble. See stuff I posted lower down.
People have been claiming KSA is near peak since 2005, eventually it will be correct, probably in 2035 or so for 12 month average output of C plus C.
A question. How is calculated the oil output in the future by the EIA? It comes from modelisations taking into account the future estimated price of oil barrel, the future estimated economic growth… ? Does it take into account the forecast development and output of oil projects such as those you did mention?
JFF
I do not have direct knowledge of of how the EIA forecast is put together. However I think your suggestion that oil price, economic growth and production knowledge of company and government plans over the short term are all significant factors that they may use.
I am not sure how the EIA assesses OPEC production. It could be just a matter of subtracting Non-OPEC supply from world demand..
Below is a link to the latest Short Term Energy Outlook (STEO) which may provide further insight.
https://www.eia.gov/outlooks/steo/pdf/steo_full.pdf
Factions in the administration are on record as wanting sharply higher oil prices. Seems difficult to see how this would get through the Senate, but it is a green priority.
I had no idea that the Senate controlled oil prices.
Does Occidental know what they are talking about? They are saying that the investors are just not there for a massive increase in production. And they are one of the two largest producers in the Permian Basin.
U.S. Oil Production Has Already Passed Its Peak, Occidental Says Bold Mine
By Kevin Crowley
October 14, 2020, 1:49 PM CDT
America’s oil production will never again reach the record 13 million barrels a day set earlier this year, just before the pandemic devastated global demand, according to Occidental Petroleum Corp.
“It’s just going to be too difficult to replace the 2 million barrels a day of production that we’ve lost, and then to further grow beyond that,” Chief Executive Officer Vicki Hollub said Wednesday at the Energy Intelligence Forum. “Over the next three to four years there’s going to be moderate restoration of production, but not at high growth.”
Occidental is one of the biggest producers in the U.S. shale industry, which added wells at such a rate prior to the spread of Covid-19 that the country became the world’s top crude producer, overtaking Saudi Arabia and Russia, ushering in an era that President Donald Trump called “American energy dominance.”
U.S. oil production is stuck below it’s pre-pandemic high
Shale’s debt-fueled expansion came to a juddering halt due to lower gasoline demand and oil prices, but also because of Wall Street’s increasing reluctance to fund growth at any cost. Shale operators are increasingly prioritizing cash flow and returns to investors over production growth.
Occidental, which vies with Chevron Corp. to be the biggest producer in the Permian Basin, has been forced to throttle back capital spending, lower growth targets and cut its dividend in a bid to save cash during the downturn. Its finances were already severely challenged by the debt taken on through its $37 billion purchase of rival Anadarko Petroleum Corp. last year.
Hollub said global consumption stands at about 94 billion barrels a day, and it will take a Covid-19 vaccine before it returns to 100 million barrels. Due to cutbacks around the world, supply and demand for oil will likely balance again by the end of 2021, she said.
Unlike some of her European peers, Hollub sees strong long-term demand for oil. “I expect we’ll get to peak supply before we get to peak demand,” she said.
“Unlike some of her European peers, Hollub sees strong long-term demand for oil. “I expect we’ll get to peak supply before we get to peak demand,” she said.”
Thanks Ron.
I wonder if she is referring to the balance in the USA, or the world.
It will be a horse-race finish for the whole decade- “and here comes Demand up the backstretch…”
As a European, she was obviously speaking of the World peak. I think peak supply will come long before peak demand in both the USA and the World.
“Unlike some of her European peers”
Oh yeh, now I get it. Not so sharp this morning.
It probably already has—–
Hi Ron, (Nice to hear from you!),
Supply and demand go hand in hand coupled by the price only. Peak supply and peak demand will therefore coincide. Due to the lack of above ground oil storage capacity the price must at all times balance supply and demand, whatever it takes (e. g. negative prices).
Global above ground storage capacity only allows a delay of a couple of months. So I don’t understand your “long before” statement above.
Best regards!
Not a real poser Verwimp. Yes, peak supply and peak demand will both arrive at the peak, at the same time. However, there is still a tremendous difference between the two. If the peak is driven by peak demand, then the price will plummet. More supply than demand. However, if peak supply arrives first, then the price will spike. More supply than demand.
Peak supply arrived in 2018. Supply will never be higher. However, demand dropped also so it was not apparent that we had truly arrived at peak oil. The spike in price will come, but long after peak supply. In a couple of years, or perhaps longer, it will become obvious that we are post-peak. At that point prices will spike. Though both demand and supply will have peaked in 2018, it will be obvious that the peak was supply-driven, not demand-driven.
I hope that clears it up. Though they both literally come at the same time, the apparent peak demand will come long after the literal peak supply.
Better terminology would help us here.
Production and consumption always have to balance (with, as you point out, relatively small differences due to storage).
Supply and demand are different. If fields are depleted, then the amount of oil that can be supplied falls, and “supply” declines. If EVs replace ICEs, the amount of oil that people want (for the same amount of driving, passengers, etc) will decline. Then “demand” declines.
Verwimp,
One can tell peak supply from peak demand by looking at oil prices. Obviously supply will always equal demand, but in a supply constrained scenario we will see high and rising real oil prices, if demand has peaked (and supply has not) we would see low and falling oil prices.
So oil price and the trend in oil prices will tell the story. In late 2018, clearly we were not at peak supply as oil prices were falling due to oversupply of oil output.
Ron
There is some consistency between Pioneer and Occidental CEO’s regarding cash flow and returns to investors. However at $100/b oil, they might be able to do both.
“Pioneer will limit production growth to 5% a year over the long term and plans to pay back three-quarters of its free cash flow to shareholders rather than spending on new drilling, Sheffield said.”
https://www.rigzone.com/news/wire/is_us_shale_no_longer_a_threat_to_opec-24-feb-2021-164722-article/
Ovi,
If all the tight oil producers increase output at 5% per year, it will not be long before the US reaches a new peak basically about 2026 to 2027 from the low in 2021 at about 6.5 Mb/d for tight oil output.
Figure this one out. The EIA’s AEO2021 In the past they have always given scenarios based on “Low Price” and “High Price”. But now it is “Low Supply” and “High Supply”.
They are not making a prediction, they are just saying: “Here is what low supply looks like”, and “Here is what high supply looks like”. Hell, we already knew that.
Anyway, it is all about tight oil. Everything depends on tight oil. Occidental says tight oil has peaked. But the EIA is taking no chances. They are saying in effect: “Here is what it looks like if tight oil has peaked and here is what it looks like if it has not.”
Hi Ron,
There is also a low price and high price case, where a best guess estimate for oil and natural gas resources is used. The high supply case assumes reference oil price case but an upper bound estimate for oil and NG resources (95% probability actual resources will be less), low resource case likewise uses reference oil price case, but there is a 95% probability that resources will be more than this low resource case.
All of these scenarios have long fat juicy tails of production.
Plenty of time to adapt, assuming the human beings were awake and paying attention to the issues at hand.
We’ll be real lucky if indeed the production holds up that well.
Hickory,
When I look at the EIA AEO 2021 for tight oil, there resource estimates for the reference and high resource cases are unreasonably large, their low resource case is more in line with my estimates which Start with the USGS mean estimates and then use shale profile data and reasonable economic assumptions for well cost, OPEX, transport cost, taxes, royalties, interest rates, and discount rates to arrive at economically recoverable resources. My guess is that their reference case estimates through about 2035 are reasonable, but then output declines sharply after 2040. Their high resource estimate is just silly and should be ignored, same for their high price case.
Male testosterone is over 50% lower now than it was a generation ago. The farmboys that made those rigs work back then aren’t the same bunch that are available now. Assuming that those available even want to show up at 5AM and work hard labor till midnight, which they don’t – the new generation was tried and found wanting nonetheless. I know people that have had to replace three or more drilling crews on one job, the work ethic was so bad. And yet Coyne asserts that the 2018 peak is going to be surpassed. Well, the geology doesn’t agree, and with what rig crews? The 50% ‘T’ guys? Robots? It just so happens that there is a fully automated robot rig – supposedly absolutely state of the art that can be run by one 50% ‘T’ guy – a scant couple of miles from here. The developers – who’d spent over $54 million of other people’s money – have since declared bankruptcy and the thing was supposed to have been suctioned (auctioned) off at a sheriff’s sale 6 months ago. Well the s(a)uction didn’t take by the bankruptcy receiver who would have had to accept less than 10 cents on the dollar (but nobody really knows, there seems to be some lingering questions). And guess what? The indicated are going to offer a new s(a)uction – to those interested at some later date – possibly by middle summer this year. Who might those interested buyers be? I just wonder, Coyne, who’s going to bite on this new ultramodern robot rig that would reportedly replace a 50% ‘T’ crew? (To say nothing of a 100% ‘T’ crew). Who exactly? Do tell us, I’d love to hear the Coynocopian spin on this. And BTW, 2018 was peak.
Mike + Sutherland , I agree with you on the quality of manpower and so does Stephen Hiren . Here is his post earlier .
STEPHEN HREN
IGNORED
02/16/2021 at 4:33 pm
No. I work in construction biz. 90% of twenty somethings can’t work five minutes without looking at their phones. They are useless. All my buddies have the same complaint.
The testosterone decline seems to be a worldwide phenomena. Interesting points Mike.
Mike Sutherland is right.
When oil went negative, almost all of the wells in our field were shut down. The largest company made the mistake of laying off several of their workers. Now they are struggling to reactivate their wells, can’t find help.
We used to own four service rigs. We sold three of them because we couldn’t keep them staffed. The fourth we keep just as an insurance policy, if all else fails. We contract all well service work now, we are worried that is dwindling too.
Drug issues have always been in the oilfield. They are big time now. Hard to find a service rig hand that doesn’t have a meth problem.
Everyone says oil’s days are numbered. So why would there be a bunch of people waiting to work in the next drilling boom?
SS
Not knowing much about rigs, could you please explain the difference between a service rig and a drilling rig? Are they smaller and not as powerful?
Ovi. In general terms, a service rig is used to repair down hole failures. They tend to be smaller and more portable.
For example, if a well stops pumping fluid due to a tubing hole, the service rig is rigged up on the well. The rods are pulled. The down hole pump is removed and examined. Many times it is in need of repair. We keep spare down hole pumps on hand, the pump that has been down hole goes to the repair shop. Next the tubing is pulled. The tubing is tested with hydraulic pressure. Joints that blow are scrapped and replaced. The tubing is then ran back down the hole, followed by the pump and rods.
This is the most common well service work we have performed.
There are other types of down hole service work, of course.
Thanks SS.
Short and Sweet. ?
Hi Shallow,
I’m far a away from oil technic – didn’t know that the tubing can be pulled again. I’ve helped with geologic probes with a hammering rig. With these, you already need lot’s of force to pull out a 3-4 meter probe head – and sometimes a link breaks. Then the probe is in the hole permanent.
I thought without the casing an oil hole will collapse and has to be redrilled – if it even can be pulled and isn’t stuck.
We call what you are referring to the casing. It is cemented in.
The tubing goes inside the casing.
On our very old wells (100+ years old) 6 1/4” casing was used. On the rest, the casing diameter is 4 1/2”. Most of our tubing is 2 3/8” in diameter. On the wells that produce a lot of fluid (water) we use 2 7/8” diameter tubing.
Also, on a lot of our century old wells, we have ran 4 1/2” casing inside the 6 1/4” casing due to casing holes.
Shallow sand,
I imagine good workers can still be found, as oil prices go up, so will wages and those willing to work.
There is a simple solution to the cellphone problem, require employees to hand over their cellphone at the start of the day, they can have it during breaks and lunch only, simply make it a condition of employment.
The good workers won’t have a problem with it, the slackers won’t agree and can find other employment.
Dennis.
All of our pumpers work alone without supervision. They stay in contact with us, fellow pumpers, and all service contractors, with cell phones.
Pumpers check each well daily. Ours check plants twice per day. Ours chemically treat wells weekly or bi-weekly, depending on the well. Chemical treatment requires three trips to the well. Many pumpers will not chemical as instructed. Nobody is there to check if they are. The dumb ones get caught when it is noticed chemical isn’t being ordered on schedule. The sneaky ones dump chemical all down one well, and only get caught six months or so later when the multiple down hole failures commence.
We presently have seven pumpers. Six are over 50 years old, two of those being over 60. So we should have ten more years.
Pumpers work every day, regardless of weather. They were all out in the -10 F weather recently.
I just don’t see skilled young people going into upstream oil and gas. That leaves unskilled, which isn’t a good thing.
There are people that can be trained to do the work. Some peopl are smart enough to protect their reputation and people will be willing to pay more for a trustworthy contractor. If you know one pumper can be trusted and another cannot, which do you hire? In a small town setting everyone knows the good from the bad apples.
Dennis.
I wish it were that easy. But it just isn’t.
We could put an add in the paper tomorrow for a pumper, and the chances of a skilled one responding would be low. And if one did, he would be over 50. And he would be leaving a full time pumping job somewhere or another.
Hate to rip on younger men, but really more younger women should look into becoming pumpers. We have one woman who pumps wells for us, and she does a heck of a job.
So much of being a good pumper is attention to detail and repetition.
As for work ethic, among whites anyway, women have a better work ethic than men, on the whole. Less drug problems and the associated crime, also among women.
I bet if someone did a study, they would find it is wives, girlfriends, moms and grandmas posting bail for arrested men far more often than the reverse.
You want to avoid hiring guys with low testosterone? Its pretty easy- low testosterone levels are strongly linked with obesity. International trend.
But that won’t help with all the guys who aren’t obese but were raised with modern conveniences- like cars, TV, cellphones, video games, sports watching and such. The working class who can’t afford those things, but can afford enough food, are the strong ones. A good portion of the ones I would hire are indeed from Latin America, as Shallow Sand indicated. And I think he is spot on about meth too.
Mike,
Yes 2018 was the most recent peak, there have been lots of these over the years and they have always been surpassed. The 2018 peak will be surpassed by 2026.
Does this projection of new peak production in mid-decade include an assumption of return of an unsanctioned Iran to the table?
Hickory,
No specific assumptions are made about individual nations, I assume a 3200 Gb URR for conventional oil (excludes tight oil and extra heavy oil from Canada and Venezuela), I take the historical oil production rates and the extraction rates that might coincide with that historical production. I assume future extraction rates and rates of development of oil resources continue at similar rates to the past at least through 2040.
So basically the answer is no, I do not assume Iran does get sanction relief.
The peak of the scenario is 3 Mb/d above the 2018 peak, 1 Mb/d could come from the US, 1 Mb/d from OPEC , and 1 Mb/d from Canada, Norway, and Brazil, but there is no specific bottom up projection except I consider tight oil and extra heavy oil separately from conventional C plus C.
Chart below shows extraction rates for conventional oil and note that the rates from 2015 to 2019 were quite low. Every year prior to 1989 extraction rate for World conventional C plus C was 9% or higher and they didn’t fall below 5% until 2013 at 4.86%.
Thanks Dennis.
Given all the variables, and uncertainties about each one, you are a brave man to to make such projections.
Very few are willing to put it on the line as you do, with strong rationale as well.
The decline in global extraction rates I assume means that on average the available crude is much harder to collect, requiring increasingly costly enhanced recovery methods and such?
Why do you assume that the extraction rate will stabilize, even improve over the next couple decades?
I probably don’t understand what what ‘extraction rate’ means.
Hickory,
The extraction rate for conventional oil resources is the annual production of crude in barrels divided by the proved developed producing reserves at the start of the year. It is actually the opposite of what you assume, the extraction rate was lower simply because there was more of an increase in proved developed producing reserves relative to the increase in the demand for conventional oil over the period from 1973 to 2018 where extraction rates for conventional oil producing reserves fell from 16% to 4.6%. The fall in extraction rates in 2019 and 2020 was due first to oversupply from unconventional oil in 2019 and then oversupply due to the oil demand crash due to the pandemic.
The scenario I outline simply has extraction rates slowly returning to 4.4% which is actually less than the extraction rate in 2018. The scenario is quite conservative in this respect and is based on the assumption that demand growth for oil will be relatively subdued due to the transition to electric transport and less land transport demand due to more online shopping, more telecommuting, etc.
Thank you very much for the explanation Dennis.
OPEC oil output falls in February on Saudi additional cut – survey
The 13-member Organization of the Petroleum Exporting Countries pumped 24.89 million barrels per day (bpd) in February, the survey found, down 870,000 bpd from January.
Riyadh achieved about 850,000 bpd of that reduction in February, the Reuters survey found.
Compliance with pledged cuts in February was 121%, the survey found, up from 103% in January.
Russia’s oil output falls in Feb, below OPEC+ quota increase – Bloomberg
Russia’s crude oil production dropped in February, below its OPEC and allies (OPEC+) oil-output target for the first time since the historic curbs began last May, Bloomberg reports, citing preliminary data from the Energy Ministry’s CDU-TEK unit.
According to this source, production from Saudi Arabia fell by 970,000 barrels a day.
Illustrating that sense of vigilance, the kingdom cut output by 970,000 barrels a day in February to 8.15 million a day, according to the survey.
…and production from Angola fell to 1.1 mb/d:
At the other end of the spectrum is Angola, which has lowered production far more than required by OPEC. Its output dwindled again last month, by 80,000 barrels a day to 1.1 million — the lowest in Bloomberg data going back to 2007.
Bloomberg has them down by 920,000 barrels per day. OPEC+ had everyone’s quota up in February but production was down. Russia was down by 64,000 barrels per day. Russia blamed it on bad weather but Saudi blamed their cut on getting rid of the glut. I am a bit skeptical about that excuse. Obviously, Angola is in decline. No doubt Saudi could produce more but I believe they are in decline. They seem just too willing to cut production rather drastically.
OPEC Production Plunges as Saudis Deliver Extra Oil Cutbacks
(Bloomberg) — OPEC’s crude production plunged last month as Saudi Arabia delivered extra cutbacks intended to clear the remnants of a global supply glut.
Output from the group fell by 920,000 barrels a day — the biggest drop in eight months — to 24.87 million a day, according to a Bloomberg survey. As promised, the kingdom slashed its production by almost 1 million barrels a day, or about 11%.
I too am skeptical about their excuse . They are in decline and are just covering up .
We will know when oil prices rise to 75 per barrel.
At current oil price level we can simply speculate.
If I was in charge of Saudi oil production, I would cut their current production in half. This would maybe double World oil prices while keeping their revenue the same and halving their depletion. A win-win proposition.
Ron
Could SA be giving some of the fields that are under water flood a rest. I assume that the water/oil interface must get pretty uneven/ragged after being under constant high pressure and could have broken through in some areas. Would shutting a field down for two months restore a more uniform water/oil interface and yield a better oil/water ratio on restart.
Even if this assumption is correct, it is not a good sign that they have to shut a field down to maintain steady output rate and is a sign the field is getting depleted.
Ovi, all Saudi fields are under waterflood. Yes, a well will have a water cone as the water rises in the reservoir. But all Saudi vertical wells have been replaced by horizontal wells, all at the top of the reservoir. I guess there could be a linear or horizontal cone but shutting them down for a couple of months would make little difference. Shutting them down for several years might help a bit however. But I don’t think they are doing that.
Ron
I recall reading in Matt Simmons book that he mentioned water shut off valves being part of the lateral branches. So that implied to me that you could have vertical cones heading for parts of the laterals. So my thinking is that if that happens more and more often, shutting the field would let these water cones drop down and be replaced with oil. I have no idea whether this would happen in two months or two years or ever.
Ron
Thought I should check with Dr Google. I found this interesting tid bit in an article describing water shut off techniques.
This sentence in the second paragraph is interesting. “The water entry zone was detected at bottom interval. The well was de-signed to treat water production zone using cement plugs and organic crosslinked polymer.”
This well was drilled in an area that was expected to produce 60% water. Sounds like Ghawar is getting watered out.
Dashash et al.[18] reported a successful water shutoff job in a horizontal producer in the south Ghawar area completed as an openhole[19]. A PLT run indicated that all water was pro-duced from the toe of the well. They designed using inflatable packer to isolate the water production zone. The inflatable packer was capped with a 61-m cement plug in the annular to enhance the sealing strength. 91.4-m high viscosity gel was injected in to annular after cement plugs to avoid cement slumping problems. After the treatment, the water cut was decreased by 50%, and the well productivity was enhanced by 159 m3/day of oil.
In the same field, another well was treated with water shut-off chemical but the result was not satisfied. Sharma et al.[20] reported the well was completed as a single lateral openhole with 360.3 m of reservoir contact. Before the treatment, the well produced wellbore fluid with 60% water cut. The water entry zone was detected at bottom interval. The well was de-signed to treat water production zone using cement plugs and organic crosslinked polymer. One inflatable cement ring (ICR) was set at 2 636.5 m, and squeezed 23.85 m3 of OCP below ICR. The second one was set at 2 617.9 m and a cement plug was injected between the two ICRs. The production data showed that after water shutoff treatment, the water cut was almost the same as before. Water shutoff chemical might partly enter the producing interval and almost completely plugged the wellbore.
https://www.researchgate.net/publication/321583912_Comprehensive_review_of_water_shutoff_methods_for_horizontal_wells.
Ovi, from your link, bold mine:
RESEARCH PAPER PETROLEUM EXPLORATION AND DEVELOPMENT Volume 44, Issue 6, December 2017 Online English edition of the Chinese language journal Cite this article as: PETROL. EXPLOR. DEVELOP., 2017, 44(6): 1022–1029. Received date: 06 May 2017; Revised date: 15 Sep. 2017. * Corresponding author. E-mail:
Okay, Ghawar had a 60% water cut four years ago. It has to be worse today. Saudi has become like a secret society, hardly any information gets out. But they are getting heavily into alternate energy. I wonder why? 🙂
Seriously, Ghawar as well as most of the Saudi fields are way, way past their peak. Yet this simple fact is ignored by most oil analysts. But I think it obvious that the three largest producers in the world have peaked, Saudi Arabia, Russia, and the USA.
Nuff said.
Anectdotally I can tell you the same de skilling is going on in medicine. If what I see is also true in oil, we are in trouble.
Those of you 50 and above have no idea. You grew up in a world of confidence, manliness, science, and the availability of resources and money to those willing to use their brain and muscle power. That world is gone, it doesn’t exist anymore.
Millenials are an interesting bunch. Some are intelligent, some are not, but almost all are incompetent. They grew up in a magical world of mass media, images, and entertainment. To them, the screen showing them ships hurling across the galaxy in a Star Wars movie is real. Athletes and rappers getting millions of dollars is real. But farming and mining and building and repairing things is not. Fewer and fewer of them are intimately involved in those areas. Even those who might have been technical managers have long ago migrated to software technology and finance. Again, wishy washy stuff that somehow gets them employed and even rich.
I’m not sure if this is true around the world, but it’s true in America. And the difference will be felt at the margins. Things won’t collapse immediately…they’ll just get worse and worse. Believe in whatever capitalist or marxist ideology you want, but it’s real human labor that runs things, and builds and maintains the machines. If the labor declines in quality, so must the civilization.
Trying to stick with oil issues here, but this might go a little too far afield.
A big problem in the oilfield in particular is drug use. It has always been there, but it has gotten worse IMO.
First, among young people, the media has glorified pot so much that a decent percentage use it daily. We have one kid who just graduated from college and another there now. Both say it is very prevalent, and not just in the evenings/ on weekends.
What I call “wake and bake” pot smokers cannot work in the oilfield. For these folks, however, working from home on a laptop will work.
Worse, in the small towns, meth use continues to increase. It all comes from Mexican labs now, and is many times more potent than the stuff given to soldiers in WW2. I work with this demographic in my real job, and it is a horrific drug that the political types almost completely ignore. It is destroying the blue collar community in towns all across rural America.
Since I work with meth dependent people, hopefully posters take it from me when I post it is a very serious problem in rural areas and in the oilfield. If not, just google meth and “Eastern Oklahoma” or meth and “Kansas” or meth and “Southern Illinois” or meth and “Texas” or something like that.
Burglary and theft is rampant through the oilfield and is primarily committed by those dependent upon meth. Rig hands on meth figure out what stuff is valuable and then steal it. We have been properly crime victims many times, and when caught, always a meth addict who had worked in the oilfield.
In the small towns, meth tends to creep into many workplaces. McDonalds has a real problem with it at times. So do the auto parts manufacturers.
The minimum wage debate is interesting to me. We haven’t paid less than $20 an hour to anyone besides summer help for awhile. And we still can’t find young people to work.
Meth possession is a felony. I live in a county with less than 20,000 people. About 1,500 are K-12. A decent percentage are retired. Every year there are 200-300 felony cases filed in our small county, 90 % are people dependent upon meth.
I looked at our jail roster yesterday. Of the 34 people in jail, I know that 29 have a meth problem. The other five I am not sure.
Meth addicts pretty much cannot work. Meth is a blue collar drug. So where are we going to get workers in the oilfield? Maybe Hispanic immigrants? If it weren’t for Hispanic immigrants, our country would be starving. If you don’t believe that, visit the meat packing plants, cattle farms and hog farms in Western NE, KS, OK and TX panhandles. Or visit the melon farms in SE IL and SW IN.
Sorry for the long winded post. I just think educated people aren’t aware of this problem. Educated people work white collar jobs and live in suburbs. I have many relatives who do this. They just don’t have contact with people from other demographics.
Here in Germany we have known Meth as Pervitin in the old time. Till the 60s it was legal, and till the 80s you could get it from a Doctor when you was “tired”.
I think the old stuff here was very hard in the past, too.
In the war time, want to march 24 hours and after this, guard a hill for 24 hours? Throw some Pervitin or get a bar of “Panzerschokolade”.
After the war, during rebuild? Tired from long work, throw a Pervitin, work on.
Now it is meth, much of it coming from the Meth kitchens in East Europe. Most time really dirty stuff, Pervitin was clean.
Here it’s take from everyone – a student learning for an exam all night long? Take some Meth.
It’s all under the carpet, since distributing this stuff is often done by POC – and it’s racism to speak about this.
Only with the upper class only some really stupid meth addicted. They have enough money for cocain… in some interviews on TV you can really see they have taken a line before it.
And sorry, no oil reference here – oil Industry in Germany is tiny. I think all production here in our federal land is less than the amount of your personal company :).
Thanks for the insight SS. Your oil field experience is no doubt a Phd in Human Nature.
Recent CDC data showing decline in life expectancy. Been going on for years. Not a covid thing.
Huge contribution to the number are drug ODs. They occur at a young age and that translates to many years lost. That’s why it is such a drag on the life expectancy number.
No idea why it’s happening. It was happening long before covid so lockdown and depression . . . nope.
https://oilprice.com/Energy/Crude-Oil/Coke-Meth-And-Booze-The-Flip-Side-Of-The-Permian-Oil-Boom.html
From 2018
Two small producers:
Vietnam may heavily rely on West African crude as domestic output falters
State-run oil firm PetroVietnam produced 11.47 million mt of crude oil in 2020, down 12.4% from 2019 and marking the fifth consecutive yearly decline.
Reflecting Vietnam’s faltering upstream output and its growing dependence imports for refinery feedstock requirements, the country imported 11.74 million mt of crude oil in 2020, up 51% from 2019.
Oil, gas production continues to fall
Pakistan’s oil and gas production has continued to drop due to depletion of existing reserves while exploration firms have frequently failed to find large hydrocarbon deposits to bridge the deficit for over a decade.
Topline Research recently reported that Pakistan’s oil production fell 6% year-on-year to 76,331 bpd in the second quarter (Oct-Dec) of FY21 due to a decline in production at Mardankhel and Makori Deep fields of Tal block by 27% and 31% respectively.
Can Peru’s Oil Industry Recover From A Disastrous 2020?
In fact, 2020 crude oil production averaged 39,738 barrels daily, a 25% decrease compared to a year earlier and a multi-decade low. Annual natural gas liquids and natural gas output also fell sharply declining by 7% and 20% year over year respectively.
The Russian C+C data is out for February. They were down 75,000 barrels per day from January to 10,095,000 barrels per day. That is using 7.33 barrels per ton. However, I don’t think that is the multiplier the EIA uses as they always come up with a lower figure.
The data below is through February 2021.
Outside the cuts of oil production as part of OPEP oil production cuts, Russian production has apparently difficulties to restart. Must we understand that the oil reservoirs of the aging oil fields didn’t appreciate the production’s shutdowns due to the oil consumption drop associated with covid crisis?
I wanted to say OPEC +, oups!
Ron
Russia reports all liquids. The EIA subtracts 404 kb/d each month from the Russian numbers. See attached chart. I am surprised it is a constant as opposed to a percentage.
I don’t think that is the case, that is they report all liquids. They say it includes gas condensate, that it C+C. The gif below is taken directly from their site.
Ron
I wonder if it is a translation issue. Note it says gas condensate which could mean NGPLs as opposed to crude condensate. I use 7.33 and then subtract out the EIA C plus C number and I keep getting the difference of 404 kb/d.
No, I don’t think so Ovi. Condensate is the same throughout the oil world. Russia doesn’t have a different definition for condensate. They would never refer to NGLs as condensate. Condensate comes up as a gas then condenses to a liquid at room temperature. It’s a liquid, not a gas. That’s why they call it condensate.
Ron,
A portion of NGPL is condensate, some nations include this part of NGL (so called C5) as a part of C plus C output (Canada for example), perhaps Russia does as well. The US does not which is strange because C5 at the lease is no different from C5 that comes from the NGL processing plant, but the US does not include this in the C plus C output, only “lease” condensate is counted.
In short, I think Ovi might be right, though as I suggested the amount is small and not worth arguing over imo.
In this case I agree with Ron that it is not all liquids, it is crude plus condensate (but some of the condensate might be the C5 produced at the NGL plant).
Dennis/Ron
I will try again. I think that Russia translates NGPLs into “gas condensate”. Translation is not perfect some times.
I am sorry Ovi but that is not correct. Russia knows full well what condensate consists of. Though condensate, pentane with (5) carbon atoms, is, technically, a natural gas plant liquid, it is the only one that is a liquid at room temperature. Therefore it is in a separate category from NGPLs. The others are Ethane (2) Propane (3) and butane (4) carbon atoms. All petroleum polymers with less than 5 carbon atoms is a gas at room temperatures and pressures.
Russia’s February Oil Output Fell Despite OPEC+ Higher Quota
Output of condensate — a light oil extracted from natural gas — is excluded from the OPEC+ deal. As the CDU-TEK doesn’t provide a breakdown between crude and condensate, it’s difficult to assess the nation’s compliance, but if February’s condensate production was in line with January’s, then daily crude output would be around 9.155 million barrels, some 30,000 barrels lower than its OPEC+ quota.
In the grand scheme of World oil output, 404 kbo/d out of 80,000 kbo/d of C plus C produced is of little importance, it is 0.5% of total World C+C output, for consistency we could just take the Russian numbers and subtract 404 kbo/d, the trend for the past 7 months has been a gradual increase in Russian output, I imagine this will continue for the next 6 to 7 months as well. Clearly the drop in output after April was to meet the OPEC+ agreement, a price war with OPEC does not serve the Russian oil industry well.
Exxon Vows to Lift Returns, Grow Dividend on Permian, Guyana
Interesting Headline from XOM this morning.
Reiterated 700,000 barrels-a-day forecast for Permian Basin by 2025
Pre-Covid-19, the plan was to reach 1 million barrels a day by 2024
7-10 rigs will be active on Exxon’s Permian wells this year, down from 10-12 at year-end 2020
Permian production to be about 400,000 barrels a day in 2021, slightly down from 4Q 2020
$3.5 billion of cash flow from Guyana and $4 billion from the Permian basin, assuming $50 crude
$15 billion-a-year dividend can be maintained at $35 oil and “average” refining, chemical margins
https://www.bloombergquint.com/business/exxon-outlines-plan-to-boost-returns-and-grow-its-dividend
That’s a public announcement for the shareholders and maintain the price of Exxon’s shares.
Ovi,
Thanks for a great post as usual.
All
When I look at the graphs, it strikes me that the past few months’ increase in production is because shut-down oil wells have been reopened. And that this month’s decline shows that pretty much all closed down wells have reopened and that Aunt Legacy Decline is currently running faster than Uncle New Wells. Maybe there is a seasonal effect as well.
What do you clever folks think about the future light oil production in the US?
Suggestions:
1. No chance in h*ll that it will come to the levels of earlier ATH.
2. With high oil prices over a long time, the production levels will have the same magnitude as ATH in the past.
3. Eventually LT oil production will become higher than before.
To have your answer(s), you should look at the discussion between Ron Patterson and Dennis Coyne above and choose what is appropriate for your current mood. Actually, you have the choice between three different kind of hangman’s rope.
Tom
For me the more critical question is what is the expected yearly rate of increase in US oil production. A few years ago the US was adding over 1 Mb/d to the market and OPEC had to cut back to make room for US oil. Going forward, If the US can only add 0.5 Mb/d and demand is closer to 0.9 Mb/d, then OPEC and Russia are back in control of the oil market and price will stabilize for a while in the $75 area until demand begins to put stress on OPEC supply.
Ovi,
I agree with your assessment above. Another wildcard I would add is changes in World demand trajectory in response to future increases in World real GDP. Changes in business behavior and consumer behavior due to the pandemic and the increased use of video conferencing allowing more telemedicine, telecommuting, etc as well as transition to electric transport might lead to lower increases in liquid fuel demand in the future. So peak demand for liquid fuel may quickly follow peak supply (which I expect in 2032+/-2) perhaps only 3 to 5 years later. At that point the World may have chronic oversupply of liquid fuel with falling crude oil prices and falling crude supply chasing falling demand for crude. OPEC is likely to fall apart has middle east producers compete for customers with price cuts and all out production.
New tight oil development, oil sands development, deepwater offshore development, and Arctic oil development of any new fields is likely to cease under such a scenario and most World oil production will come from existing developed fields and the cheapest onshore resources available (most of this in volume terms will be from the middle east).
Tom , I will go for number 1 . The shale party is over .
I expect LTO output will surpass previous peak by 2025, with peak around 2028, probably in the range of 9000 to 9500 kbopd for peak US LTO.
Yemen’s Houthis say they fired missile at Saudi Aramco site
Houthi rebels said they fired a missile at an oil facility owned by Saudi Aramco in the Red Sea city of Jeddah – the latest in a series of cross-border missile and drone strikes the Yemeni group has claimed against the kingdom.
An insight about GOM future production this year. As we are going to be still under La Nina/neutral ENSO conditions till the next fall, windshear in GOM, South West Atlantic and tropical Atlantic is going to be low. Added to the fact that sea surface temperatures are already above average East of USA and in GOM and will continue to be so, these conditions are conducive for high rate of tropical phenomenons formation. There could be formation of tropical phenomenons in the GOM early as May. Of course, it is early forecast, so nothing is certain. But the conjonction of low windshear and above average sea surface temperatures are not going to be good for the calmness of the weather in the Gulf of Mexico. So you see, oil production is not only the result of oil price barrel, work force availability or availability of capitals. https://www.youtube.com/watch?v=necVwMmLDts
JFF,
GOM production averaged about 1.66 mmbopd in 2020, down from a record high 2019 of about 1.9. The decrease can be attributed to both Covid (both shut-in production in the April-June time frame, and fewer development wells being drilled) and a record hurricane year.
The EIA’s latest prediction for 2021 is 1.66 mmbopd, and 1.67 for 2022. The EIA estimates have come down quite a bit from predictions they were making in years past. Their previous predictions would have 2021 and 2022 production in the 2+ mmbopd range.
I predict slightly higher production in 2021 – 1.70 mmbopd. I do include 1 month of hurricane impact. We’ve never had back to back years of strong hurricane impact in the GOM. 2005 and 2008 both saw measurable hurricane impact from more than 1 storm – 2005 was Katrina and Rita, 2008 was Gustav and Ike. In both cases, the following years had more typical hurricane impact.
As your comments above suggest, perhaps we will see another strong hurricane year in 2021, with similar impacts as we had in 2020. If so, I could see production getting as low as perhaps 1.6 mmbopd.
OPEC agrees to keep oil output unchanged in April report
https://www.forexlive.com/news/!/opec-agrees-to-keep-oil-output-unchanged-in-april-report-20210304
WTI up big time:
64.77
+3.49(+5.70%)
The squeaky wheels were allowed an increase again.
The group approved the continuation of current production levels for April, except that Russia and Kazakhstan will be allowed to increase production by 130,000 and 20,000 barrels per day, respectively.
Of course, if the current state of their wells and reservoirs allow it.
Jean-Francois,
Why would they have asked to be allowed to increase production if it were not possible to do so?
I think if they believed it were not possible they would not have asked for an increased quota as not meeting that announces to the World they cannot increase output and perhaps hastens the transition away from oil.
My guess is that they can easily increase output by the 130 kb/d for Russia and 20 kbo/d for Kazakhstan.
“My guess is that they can easily increase output by the 130 kb/d for Russia…”
Dennis, we will see but Rosneft will probably not be able to increase output by much:
Rosneft oil production to decline as it parts with legacy assets
Russia’s Rosneft is braced for a decline in oil production this year despite a gradual removal of output restrictions that have been imposed on the company by the Kremlin under its commitments to members of the Opec alliance.
Speaking on a conference call on Friday, Rosneft first vice president Eric Liron said the oil giant expects annual output of oil and condensate to fall by 5% in 2021.
Other oil companies in Russia may be able to increase output Rosneft is the largest oil company, but there are several others.
See https://en.wikipedia.org/wiki/Petroleum_industry_in_Russia
Also from
https://tass.com/economy/1205421#:~:text=Production%20of%20oil%20and%20gas,2022%20and%202023%20presented%20by
In 2019, Russia’s oil production stayed at a record level of 560.8 mln tonnes, the ministry said. However, Russia’s production will remain under the OPEC+ limitations through 2023. Its recovery to the previous maximum (560 mln tonnes) is probable in 2023, according to the ministry.
”Its recovery to the previous maximum (560 mln tonnes) is probable in 2023, according to the ministry.” How a country which is in production decline can reach again the previous record? Anyway, the decline has been already forecast by others and the production peak announced officially by Russian government. Examples : https://www.rystadenergy.com/newsevents/news/newsletters/EandP/lack-of-field-sanctioning-drives-long-term-oil-production-decline-in-russia/ ; https://www.oxfordenergy.org/wpcms/wp-content/uploads/2019/09/The-Future-of-Russian-Oil-Production-in-the-Short-Medium-and-Long-Term-Insight-57.pdf ; https://atalayar.com/en/content/decline-russias-oil-industry ; https://hal.archives-ouvertes.fr/hal-02288160/document. Here is what I did find in a paper of April 2019 : “In August 2018, Nikolai Patrushev, the Secretary of the Security Council of Russia, stated that the Russian oil sector was plunging into a deep crisis. One year later, the Minister of Energy Alexander Novak informed Prime Minister Dmitry Medvedev that Russia would soon experience a sharp decline in oil production.” and “In 2018, Russian oil companies extracted 553 million tons of crude oil (11.2 million barrels per day, which exceeds the record-high levels achieved in 1987), and in 2021 oil production will peak at 570 million tons. However, production will begin to decline in 2022 (…)” The record of 2019 is not so far from the forecast record in 2019. https://www.obserwatorfinansowy.pl/in-english/business/poor-outlook-for-the-russian-oil-industry/ The statement of the ministry is ratherly fanciful.
Rosneft’s oil production will decline by at least 5% per year because the vast majority of Russian oil comes from the brownfields in Western Siberia. They are in steep decline. However, almost every other oil company in Russia gets the majority of their oil from those same old Western Siberian oil fields. Therefore almost every other oil company in Russia will be in decline also.
The Worrying Truth About Russia’s Oil Industry
Although Russia ranks 8th in terms of proven oil reserves, it is the second-largest producer with 11.2 million barrels per day (mb/d). Only the U.S. produces more with on average 12 mb/d in 2019. While Russia’s proven reserves are almost 70 percent less than Saudi Arabia’s, it is on par when it comes to production. However, a majority of the country’s oil originates from brownfields in Western Siberia that have been in operation for decades. Therefore, Russian energy companies are applying new technologies to reduce decline rates.
Production from Canada will probably be down in q2:
Oil Sands Give OPEC a Boost With Half-Million-Barrel Output Cut
Major oil sands producers in Western Canada will idle about half a million barrels a day of production next month, helping tighten global supplies as oil prices surge.
Production from UK will probably also be down in q2:
UK DATA: Oil output slumps 15% in Sep-Nov as more shutdowns loom in 2021
Disruption ahead
Industry sources have indicated significant disruption in the months to come, centered on, but not confined to, a major shutdown of the Forties pipeline, the UK’s largest crude artery, for refurbishment work starting May 27.
Some possible Canadian output scenarios based on the CAPP 2019 output scenario and recent Canadian output data (through November 2020). CAPP did not do an output forecast in 2020 and the CAPP 2019 forecast was published in June 2019 (pre-pandemic).
I expect output is likely to be somewhere between DC 2 and CAPP 2019 in chart below with DC 1 as my best guess.
As one would have assumed, FAO food price index goes up: http://www.fao.org/worldfoodsituation/foodpricesindex/en/
It has not been this high since 2014. It is closing in on the level reached during the food price crises.
In 2008 and 2011 the food price index hit about 200 and 220. 2011 food price spike saw food riots in a lot of countries that then went on to experience the Arab Spring movements and the war in Syria.
Survivalist, the highest recent value was 132 in year 2011. Nowhere near 220…
–
Oil Soars to $65 With Saudi Supply Gamble Buoying Market Bulls
Saudi Arabia’s bold and unexpected gamble to restrain production is founded upon its view that, this time around, higher prices will not lead to a big increase in output by American shale drillers. Saudi Energy Minister Prince Abdulaziz bin Salman told Bloomberg News in an interview after the OPEC+ meeting that shale companies are now more focused on dividends.
Recent 3 months Brent, and WTI prices.
As I write this the Brent quote is $68.59/bo.
We are witnessing again why predictions about oil are mostly a futile exercise.
The price volatility.
We sold April, 2020 oil in May for $15.
Average price we received in 2020 was $36.
It wasn’t long ago nobody thought WTI would hit $65 in this decade and were taken seriously.
Shallow sand,
Clearly we are in unusual times with the current pandemic, so price volatility would be the expectation for any rational person under current circumstances. I have been suggesting that oil prices would rise as the World economy recovers, but must admit my scenarios were based on oil prices rising much more slowly than they have recently. I expected OPEC and Russia would not maintain discipline as well as they have and also expected tight oil producers to start ramping up oil completions quickly as has been the case historically, they have also been unusually disciplined so far.
At some point OPEC will increase output, and tight oil producers will increase their completion rates, especially if oil prices remain at current levels (which is unlikely as volatility in price is the rule rather than the exception). I think a price band of 60 to 70 per barrel for Brent might be maintained until Dec 2021 if we see slow and steady increases in economic activity and oil output levels (that scenario probably has less than a 30 % probability of being correct).
Dennis.
My view is the unusual times in oil started about 2004 with the Iraq War, followed in 2005 by the plateau of conventional oil production.
Can you point me to a period of “average stable” oil prices since then?
17 years of unusual makes it now the norm. Volatility is the norm, and will only increase as the ratio of paper (electronic) barrels to physical barrels continues to increase.
I continue to be vindicated among my right wing peers in the oil patch, who all thought Trump’s loss would be the end of times.
Like oil prices, political volatility has increased greatly, at least in the USA. Hard core conspiracy on the right, hard core theoretical over practical on the left. The sane middle without a home. Biden appears to be among the last of the sane middle, and even he will be pulled left by his own party.
All it took was a change in the White House to completely change the strategy in the boardrooms of the public upstream companies in the USA. ExxonMobil plans on holding production flat through 2025. Appointing ESG investing pros to their board. Doesn’t sound like a Lee Raymond move to me.
I know, if prices get high enough, the strategy will change. But I think the trip wire on prices for strategy change just went up $25 per BO.
SS
It will be interesting to see what the B administration does with its fracking ban on Federal land after the 100 days are finished. I see that T is already blaming the administration for the jump in gasoline prices. High gasoline prices at election time is not favorable to the incumbents. Also higher oil prices make green projects more competitive.
The administration will to balance all of these factors and it will be interesting to see where they land, in the middle or on the left.
Shallow sand,
Oil prices have not really been stable since 1973, so a rational person would expect nothing less than oil price volatility.
As to unusual times, can you point me to other periods where the price of oil was negative, besides 2020, I may have not been paying attention. 🙂
So we may not be agreed that 2020 was more unusual than usual, but I stand by my observation that a drop in World crude plus condensate output by 13,238 kbo/d over a 6 month period (Dec 2019 to June 2020) due to a lack of oil demand is highly unusual. Note that the biggest 6 month drop in World C plus C output from July 1973 to December 2019 was 4619 kbo/d (nearly 3 times smaller than the output drop over the first 6 months of 2020). Seems unusual to me, more so than 2005 to 2019.
Things did start to become volatile in 1973. Prior, prices barely moved.
After oil crashed in 1986, prices WTI were relatively stable:
1987 $18.4
1988 $15
1989 $18.2
1990 $23.8 (Gulf War)
1991 $20.1
1992 $19.4
1993 $17.1
1994 $16
1995 $17.2
1996 $20.8
1997 $19.1.
Of course, small dollar changes meant more than they do now.
Keep in mind who could actually trade the market during the time period above, as well as the media coverage and ability of people to communicate in general.
How would all (or any of us) have met to discuss oil from 1987-1997?
Shallow sand, see my comment down thread (for annual real oil prices from BP Stats) and also this chart. Brent prices in real terms were fairly stable from 1988 to 1996, but this period was the exception over the 1970 to 2020 period. Prices rose as supply became constrained relative to demand over the 2000 to 2015 period (with the exception of the GFC, which was the worst economic downturn since the Great Depression, until the pandemic occurred). Then the gluts due to US tight oil in 2015 and 2018 drove oil prices down, and of course the pandemic crashed oil demand and oil prices.
All of this leads to volatility along with the lag in the oil industry between investment decisions and changes in output. Chart is small sorry, clicking on it will pull up larger chart.
Goldman Sachs and UBS have both just upped their Brent forecast to $75 for 2H 2021 (price currently trading near $68) and that highlights how much room the rally could still run on stock drawdowns and tighter supply conditions that may come about.
https://www.forexlive.com/technical-analysis/!/opec-keeps-the-oil-party-going-20210305
Ovi,
The STEO coming out on March 9 will be interesting, they will have completed their forecast by March 4, so the surging oil price of late maty affect their upcoming price forecast and lead to an increased output forecast as well.
The $75/bo forecast is looking pretty reasonable today, but a new COVID surge and many other potential pitfalls might lead to falling oil prices. I think $44 to $74 is a reasonable range for potential 12 month trailing average Brent oil prices over the next 12 months. This would assume Brent nominal price rises to $75/d by Aug 2021 (monthly average price for Aug 2021) and remains at that level until March 2022. The average Brent price over the 24 period from April 2020 to March 2022 for this scenario is $58.87/bo with a range from $18/bo to $75/bo and the range in 12 month trailing average Brent price from March 2021 to March 2022 is $44/bo at start and $74/bo 13 months later. The scenario will be wrong, oil prices will be volatile and not easily predicted, as has been the case since 1973.
Dennis
I think it will all depend on how effective and fast the CV vaccine is rolled out. As of today, about 25% of the US has been vaccinated. At 2,000,000 a day, that is slightly less than 20% per month. By mid April, the US should be close to 50% vaccinated. I think after that CV will be heading down, even with the US reopening. I just hope that purple keep wearing their masks. It is a temporary INCONVENIENCE, not a threat to their freedom.
By the end of April, there will be a lot of money to spend from the CV bill and people will start driving as May and June roll in. This will be the reaction to all of the restrictions. US gasoline demand will rise and that will support WTI in the $65 to $75 range. What happens in Europe will be critical. Not quite sure if Europe will come roaring back but their oil demand should be increasing by summer as their vaccination program spreads.
Ovi,
It is certainly difficult to predict what will happen, but the scenario you outline sounds reasonable to me.
Note that much depends on the speed with which the output of vaccine can be ramped up, as well as supply of syringes and any other needed supplies for the vaccination program.
The clinic I worked at this week did roughly 5200 vaccinations over a three day period from Tuesday to Thursday for people over 59 years of age, we are limited by vaccine supply, whatever we are allocated is used as quickly as logistics allow. With greater supply we could do 4000 vaccines per day and if the clinic was 6 days per week, about 24000 per week in our small metro area with perhaps 200,000 residents within about 50 miles. Once US ramps up supply and gets population vaccinated, the supply will be available for Europe, Canada, Mexico, and elsewhere. Hopefully we can reach herd immunity by September for the World, the pandemic only ends when all of the World is vaccinated at 60 to 70%, though higher would be better.
You are ahead of schedule with the vaccination drive Ovi
As of March 4-
United States 16.3% one shot 8.4% two shots
according to CDC
Nonetheless, by late spring the gains should be huge.
Hickory
I guess I should not have added those two numbers together. That is how I got close to 25%.
Historical Real Oil Prices from 1900 to 2020, annual data. Oil price has been much more volatile for the past 51 years (1970-2020) compared to the previous 70 years (1900 to 1969).
Chart uses a log scale on the vertical axis to reflect the percentage change in price (so that any change in price by a factor of 10 will appear as a similar magnitude on the vertical scale of the chart.)
Dennis
I forgot to mention that the drop in their February STEO price projection probably was due to their expectation that OPEC would be adding barrels to the market in April. Now that OPEC didn’t add much in April and SA has signalled that they will not add in their unexpected 1 Mb/d reduction in one shot, that should change their price projection.
It will also be interesting to see their February output projection. I have estimated it will be close to 10.3 Mb/d
This is how higher oil prices will return capital to investors and encourage more drilling.
As the industry cuts spending to pay shareholders fatter dividends, there’s not much left to finance increased production. Even Big Oil is scaling its ambitions in shale. Exxon Mobil Corp. had been running 55 oil rigs in the Permian basin that straddles West Texas and south-east New Mexico, part of an effort to boost output to 1 million barrels a day by 2025. After tightening its belt, the U.S. oil giant is running just ten rigs, and has cut its 2025 output target by nearly a third to 700,000 barrels a day.
Yet, there are also signs that higher oil prices may ultimately re-activate the U.S. shale industry. With benchmark West Texas Intermediate now changing hands above US$60 a barrel, some companies believe they may be able to both growth and keep shareholders happy. EOG Resources Inc., the largest producer in the Permian, has announced a big spending increase for next year. And others are following suit.
https://www.bnnbloomberg.ca/saudis-bet-drill-baby-drill-is-over-in-push-for-pricier-oil-1.1572548
This came out in December 2019, one month after US production peaked. They expected US production to grow by 440,000 in 2020 then flatten in 2021. Of course, it did not grow at all but shrank in 2020 because of the pandemic. But the flattening they expected this year will likely come next year… at some point below the 2019 peak.
Permian Drillers Are Struggling To Keep Output Flat
Newer wells in the Permian see their oil and gas production declining much faster than older wells, and operators will need to drill a large number of wells just to keep current production levels, an IHS Markit analysis showed on Thursday.
IHS Markit has analyzed what it calls the “base decline” rate, calculating the actual or expected production of all the operating wells at the start of the year and tracking their cumulative decline by the end of the year. Over the past decade, the base decline rate of the more than 150,000 producing oil and gas wells in the Permian has “increased dramatically,” according to the analysis.
“Because of the large increases of recent years, the base decline production rate for the Permian Basin has increased dramatically, and we expect those declines to continue to accelerate. As a result, it is going to be challenging, especially for some companies with cash constraints, just to keep production flat,” Raoul LeBlanc, vice president of Unconventional Oil and Gas at IHS Markit, said in a statement.
“Now that capital markets have closed for many companies and investors are requiring returns, a critical objective for these companies is to slow production growth, significantly moderating their base declines,” LeBlanc said.
Last month, IHS Markit said it expects U.S. production growth to be 440,000 bpd in 2020, “before essentially flattening out in 2021.”
Death counts are in decline. It appears to be entirely seasonal, because nowhere near enough time has passed for vaccines to have any effect, assuming they’ll ever have any effect on the mutant variants that will be entirely dominant somewhat soon.
As best I can tell, the slope of the decline looks very much as it looked about 10 months ago as the initial surge out of New York was doing its exponential decay. Nationwide the asymptote was about 600 dead per day in June, a number large enough to have widespread recommendations of strict restrictions. That 600 number was down from about 2000 dead per day at the peak.
The peak for this post winter decline was over 4000 dead per day.
The math would appear to be clear. There will be a celebrated sharp decline in deaths into the summer and the magnitude of that decline will be much talked of. Perhaps a decline of 2000, perhaps even 3000 fewer dead per day.
But if that 3000 occurs, the dead/day number will still be nearly double the low of last summer, during which restrictions were in place. The results of those restrictions was the winter explosion of deaths. Of course the restrictions did not cause them, probably, but they didn’t stop them at all. So this year there will be an overwhelming push to undo restrictions and have people walk around normally and spread the virus variant du jour and kill even more people this upcoming winter. It will become overwhelming because so very many trillions are required to replace the money capitalism was generating.
My eyeball observation says traffic on a Friday afternoon at quitting time is about 33% of pre virus traffic. The price of oil has increased because it’s entirely random and we can expect it to be negative again within our lifetimes.
Which may not be all that long as the variants continue to generate.
“Nowhere near enough time has pasted for the vacinne to have any effect”
Wrong, the elderly living in assisted homes who are the most vulnerable with the largest losses are now close to 100% protected by the vacinne.
“The price has increased because it’s entirely random”
Wrong again, if you haven’t learned over the last year that oil prices are a function of inventory and availability, you haven’t learned the obvious.