A Guest Post by George Kaplan
2017 trends for UK offshore production were disrupted by the stoppage in the Forties pipeline in December, which took several hundred thousand barrels of oil equivalent per day off line. Overall average oil production for the year dropped 61 kbpd (6.4%) and natural gas (including NGPLs) barely changed with an 800 boed drop. With the Forties issue exit rates don’t mean anything, but the running average oil production was on an upward trend in the second half of the year, which will continue through 2018, barring further major outages, while natural gas was noticeably declining and might struggle to maintain 2017s rate this year.
2016 reserve numbers fell for both oil and gas with few discoveries and some negative adjustments. Oil and gas production will decline from 2018, with accelerated falls from sometime in the mid-2020s without major new discoveries (which may include onshore shale gas, but that is not covered here).
UK C&C
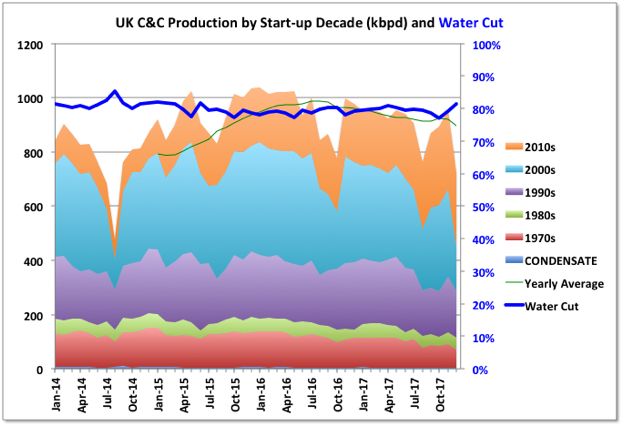
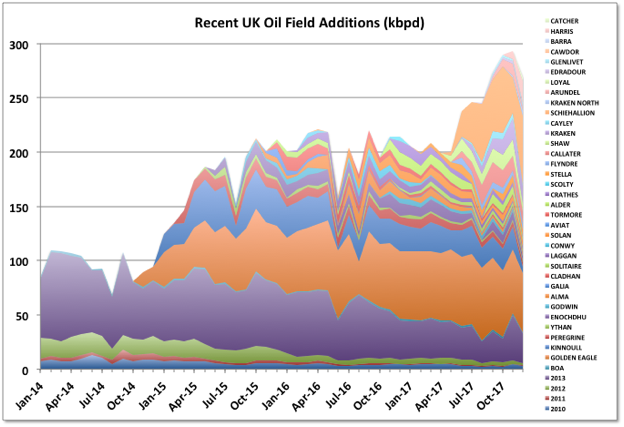
Through 2015 and 2016 a lot of smaller, short cycle developments came on line as a result of the boom from the high price years from 2011. Now larger projects started in those years are ramping up. The largest is the Glen Lyon FPSO, which is part of a revamp of two mature fields: Scheihallion and Loyal. Additionally at the end of 2017 Kraken, Catcher (including Burgman and Varadero fields) and WIDP (for fields Harris and Barra) were started and will continue to ramp up through early 2018. Clair Ridge was commissioned in late 2017, it has dry trees and a single platform drilling rig; production will ramp up as the wells are completed (they may need to complete production/injection pairs before being able to produce from each block, which may slow things down a bit). Statoil’s heavy oil field, Mariner with nameplate 55 kbpd, will also start up in 2018, after some delays. The Captain field has started trials of polymer injection, which is intended to ramp up through 2021, and, if successful, will maintain current production rates at around 25 to 30 kbpd.
The availability from some of the larger, mature producers seems to be increasingly impacted by unplanned outages, possibly just due to chance or their age, but maybe also impacted by cost cutting in response to the price drop in 2015. Apart from the Forties pipeline issue, in January the Chevron-operated Erskine field was taken offline by a wax pipeline blockage while pigging, there have been a couple of instances of fields being partially evacuated because of water quality issues, and the Ninian platform was evacuated ahead of a major storm because of doubts over its structural integrity.
Mature Field Decline
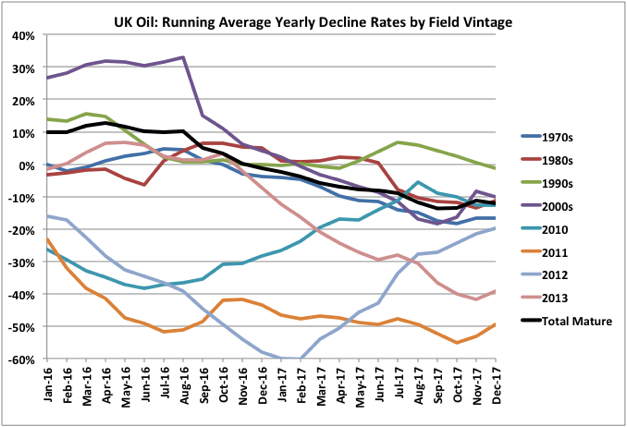
Mature field production rates of change have moved from positive (i.e. increasing production) in 2016 to negative 10% in 2017. The increase in production in older fields was due to in-fill drilling and brownfield developments, especially on the larger, mature projects many of which had been sold off by IOCs to smaller independents. The excellent performance of Buzzard, which has stayed on plateau several years longer than expected, should also be highlighted. However, while in-fill drilling can lead to increased recovery, although the recent negative overall growth numbers would suggest there hasn’t been much of that, it always leads to increases in later decline rates.
I have not included Scheihallion and Loyal as mature fields as they are being redeveloped through the multi-billion dollar Quad 204 project, with the Glen Lyon FPSO, and their production increase doesn’t represent normal field behavior (and it could be argued this need represents some poor decisions by BP when the fields were first developed, rather than improving recent performance). With them, however, the overall 2017 rate would have still been slightly increasing.
UK Natural Gas
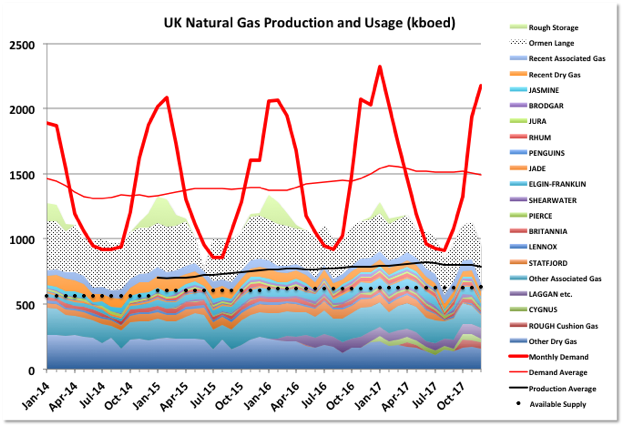
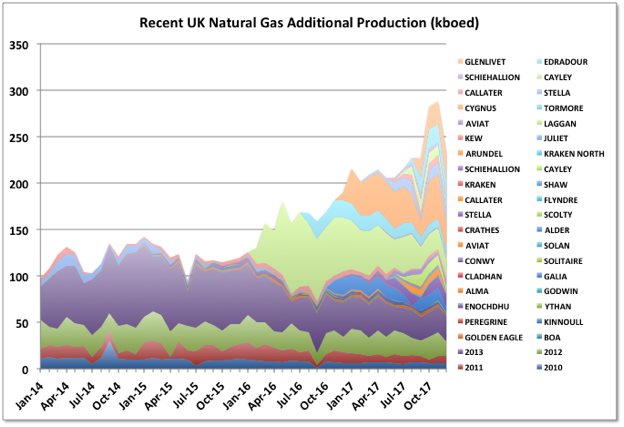
Produced natural gas is in long-term decline. Most gas now is associated with oil or condensate fields (UKOGA does not differentiate these in their data, but the ratio is about 15% from oil the rest from condensate fields). Ormen Lange is a Norwegian field, but exclusively and continuously, supplies UK so I’ve included it here. Demand is highly seasonal, supply less so but still usually shows a dip in summer when some fields are taken offline for major turnarounds. In previous years Rough long-term storage was used to store excess production in the summer and release it in winter, but that was stopped this year (note that in the chart the total production for sale is not net as the gas used to fill the store is not removed from production in previous months).
The supply figures show reported production from fields. Actual gas available for sale is less than that reported per field because shrinkage from use as fuel gas, flaring, and NGPL extraction need to be removed. Unfortunately there isn’t enough data to be able to correct accurately for these numbers against individual fields so I’ve left things as they are and shown the UK governments reported yearly natural gas sales. I don’t know why the gap between reported production and sales has widened, but it could be to do with richer gas fields coming on line.
Recent Start-ups
The chart above shows the larger recent gas additions from dry gas, gas-condensate and oil fields in more detail. The largest dry gas field is Cygnus. It flowed about 50 kboed from Cygnus Alpha, started in December 2016, but is designed to handle up to 90 with ramp-up following Cygnus Bravo start-up in August 2017. Based on the original 2P reserves (636 bcf or 110 mmboe) the field will die in the early 2020s, but there may be additional contingent resources of up to 2 Tcf total.
Rough Long-term Storage
Overall there has not been enough local supply to meet minimum demand, so to fill the Rough long term storage has required other import from Europe (which mostly ultimately comes from Norway, particularly Troll). Hence the abandonment of this facility for storage is probably reasonable, at least on straight economic arguments. It is an old field and, although the platforms are in good shape, there have been well integrity issues and it would need extensive workovers to keep functioning, Whether the gas is stored in European or local storage, to some extent, doesn’t matter, as 1) more storage is now available through LNG, and 2) there is not enough pipeline supply to fully fill all long term storage in Europe. However repeated cold snaps like the recent one in March, when supplies were stretched and a lot of coal fired generation was restarted, may alter perceptions.
Although Rough storage is shut down the field is a large, but rapidly declining, supply contributor from October as the cushion gas is blowndown before abandonment and decommissioning (reserves are estimated at 320 bcf or about 60 mmboe).
Here are two papers with more details on the Rough storage shut down, written before the final abandonment decision was made: Oxford Institute for Energy Studies and Competitions and Market Authority. The second one also contains details on the future issues with UK natural gas supply, which aren’t particularly comforting for a UK resident.
Future Production
Culzean, a largish HPHT, gas-condensate discovery in the Southern North Sea with reserves of 275 mmbbls, is expected on stream in 2019, with rates of 60 to 90 kbeod, which would see it through to around 2030. Overall though, without several large, and improbable, new discoveries and developments, the UK will be highly dependent on imports of natural gas from the mid 2020s, and at a time when supplies from Norway and the Netherlands will be in decline and global LNG demand likely to be growing significantly. See below for a projection scenario for UK natural gas supply.
(Demand and net supply data is from DUKES -Digest of UK Energy Statistics).
Shetland Gas Plant
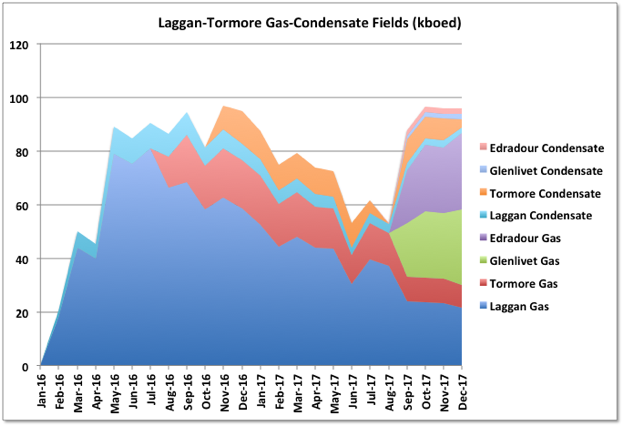
The Shetland Gas Plant (SGP) in Sullom Voe is a Total operated facility receiving production from gas-condensate fields West of Shetland. The largest of these are Laggan and Tormore. Combined they had original reserves estimate of over 230 mmbbls (1 tcf), but they certainly don’t seem to have been operated like that. I don’t know if the Laggan-Tormore project has been having problems but production seems to have declined rather quickly since these fields started up in early 2016. Combined the fields only reached the design capacity of 90 kboed for a couple of months and have been declining at about 50% year-on-year through 2017. In December they were down to 35 kboed.
Edradur-Glenlivet are smaller gas-condensate fields in the same area and have been started this year feeding into the same pipelines and processing facility. It looks like they are being ramped up as the other two fields decline to maintain the gas plant at capacity; if so both the new fields are likely to run out of well capacity pretty soon. It’s possible that Laggan-Tormore drilling has been delayed to allow for early production of the other fields, but that would not normally be an optimum development choice; it should become obvious either way fairly early this year. An early decline in production will leave quite a hole in UKs expected production.
UK Reserves
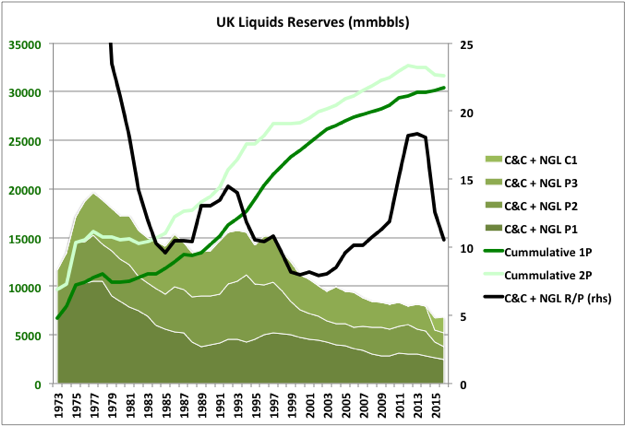
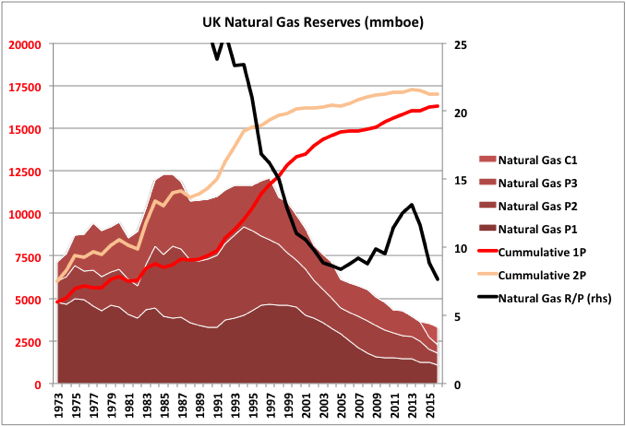
The, now defunct, UK DECC ministry used to issue a downloadable reserve history, updated each year, but the UKOGA has stopped that and only issues the current year’s numbers with a historical chart in a pdf file. Therefore I’ve used the previous numbers up to 2015 and added the 2016 numbers from UKOGA. Note that the numbers here include a small onshore component.
Both oil and gas remaining reserves are in decline, gas in particular quite steeply, and even overall negative revisions have slightly exceeded discoveries recently. The figures are for the end of 2016 so another year’s production for 2017, and with no much addition from new discoveries or newly approved projects, would take the R/P number for gas down to around 5.5 for this year.
The move of possible reserves (less than 50% chance or recovery) to contingent resources (less than 10%) was made last year. I’ve only shown 1C numbers but there are also 2C and 3C values reported, which is where a lot of the potentially large extra recoveries mentioned in some recent studies, and linked elsewhere here, are held.
The UKOGA also recently published an updated estimate for expected total recovery and production projections. They indicate 11.7 Gboe (combined oil and gas) to be produced from 2016 to 2050, which would include all the 3P reserves given above plus another 3 Gboe from new discoveries or development of existing contingent resources (many of these are in small discoveries below 10 mmboe, and/or in rescinded leases). I think that might be a challenge, and as a minimum would require sustained oil (and equivalent gas) prices well above current numbers, plus the longer it takes to developed these projects the fewer available tie-back hubs there will be, and none of these small pools can be developed in isolation. However a report from the Aberdeen University Institute for Energy indicated $60 oil would still allow development of the smaller fields (as $60 oil is behind us that theory might never be tested now).
UK 2018 Plans
Drilling
2017 had the lowest number of wells drilled since 1973, with 14 exploration, 9 appraisal and 71 development. Baker-Hughes numbers give UK offshore rigs for February at five for oil and one gas. The numbers have been generally trending down since the late nineties, with a few boom and bust related peaks and troughs. The 2015 price crash didn’t register particularly in the trend though.
In the last lease round there were only three bids, all from a Statoil/BP venture, with committed wells, the others were for seismic evaluation with a contingent well or drill-or-drop arrangement. All other wells to be drilled would be dependent on economic evaluations for appraisals or development, maybe with some in-fill drilling though a lot of the opportunities for that might have been used up though the 2011 to 2014 boom years.
Recent announced discoveries have been small: Vebier (Statoil, 25 to 60 mmboe), Capercaille (BP, light oil and gas-condensate), Achmelvich (BP, oil) and Garten (Apache, 10 mmbbls). They are likely all to be tie-backs or outreach wells if developed. So far this year six wells have been reported dry or with non-commercial show, three appraisal wells have been discoveries and four wells are held tight, with two looking promising and two maybe not so much (data from Discovery Digest).
Overall there isn’t any indication that drilling activity is likely to pick up much, but the next (30th) lease round, due this year, will make things clearer.
Development
Rystad recently indicated a probable number between 12 and 16 for new oil and gas projects to be approved this year, targeting about 450 mmboe. Most of these will be small tie-backs. The largest project is likely to be the Rosebank FPSO for Chevron, which has been around for some years and appears to be quite a difficult, multi-layered reservoir and would produce 100 kbpd from 300 mmboe reserves. Penguins is a second FPSO, and has been approved by Shell. It is a small new-build, cylindrical FPSO and will complete the exploitation of the two Penguins gas-condensate fields. It is required as these are currently tied into Brent Charlie, which is being shutdown. After these two there isn’t much of the 450 reserve base left for the other 10 to 14 projects so they will all be developments few wells, and mostly rapidly declining.
The Hurricane Lancashire basement oil development is being progressed and will use a leased, repurposed FPSO for an early production system to check for expected recovery. One of the successful appraisal wells this year was associated with this field.
Decommissioning
Decommissioning is the big growth area in the UK oil sector with 148 fields due to stop production between 2018 and 2022, and 84 between 2023 and 2028. That latter figure is likely to grow as most new projects in the next couple of years will be short-cycle developments with ends of life in that period.
UK 2018 Production Projections
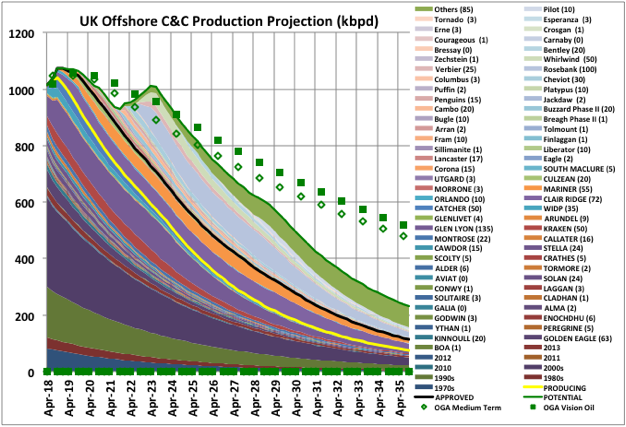
This oil projection includes all currently producing fields, those in development (in upper case) and those named, and on E&P companies’ books. The numbers shown in parentheses are for expected nameplate capacities. Start-up dates are taken from company releases, ramp-up times and plateaus are based on type of development and decline rates are tuned to match total reported reserves. For the producing fields decline rates are matched to recent numbers and tuned overall so total production to run out equals the 2016 2P reserves (but I left the NGPL numbers in, so there is really a bit of growth). The potential developments and “others” are mostly guesses and decline rates are tuned overall to give a total of around the current 3P resource number. The secondary peak in 2024 is mostly from Rosebank and some heavy oil or base sediment possibilities – it may be smoother than that, or might have much lower overall production. Overall, by this scenario, 2018 has slightly higher production than 2019, but a bit less than 2016.
The IEA numbers have an average of 1100 kbpd for 2018/2019 dropping to 900 kbpd by 2023. I think they generate their numbers top down from general economic analyses rather than by individual fields. Oil and Gas UK is the UK sector trade body and issues it’s own business outlook each year, which is a pretty good summary of the previous year, but usually a pretty optimistic look ahead. There was another recent report indicating similar high side potential and aspirations from Aberdeen University Institute for Energy.
Modelling scenarios for gas production decline is more difficult than for oil when there aren’t detailed field by field data available. Gas can be associated with oil or come from condensate or dry gas fields. For high-pressure gas fields production can be kept on plateau for a long time and then rapidly collapse. On the other hand low pressure fields or those with high water or condensate production can lead to more exponential decline. Associated gas tends to follow the oil production curves for oil fields with water injection for voidage replacement (as most of the UK fields are), but there can be a short burst at end of life if a gas cap is present. The UK Oil and Gas Authority treat gas from gas condensate fields as associated gas which makes it hard work to separate out the different field behaviours, and they do not provide individual field reserve numbers, unlike BOEM and NPD.
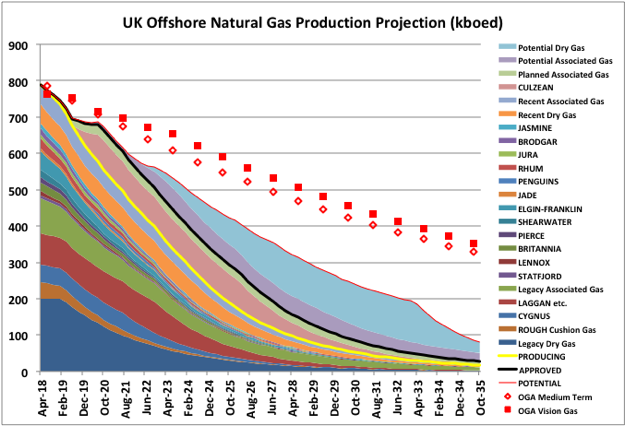
For Rough, Cyprus, Culzean and Laggen et. al. reserve numbers are available. For other mainly gas fields I approximately prorated reserves using recent production numbers and fitted typical decline rates to match. For associated gas I applied a fixed GOR based on recent numbers to the projected oil production numbers given above. The OGA projections shown have been scaled to account for shrinkage between platform production and final sales (see below). The confirmed project production curve, beneath the black line, matches the 2P reserve number for fields currently in production or development (less last year’s production but with an additional allowance for NGLs). The potential field total production is the P3 number plus 250 Gb to allow for the gas discoveries last year.
The production starts to drop quite quickly in the early 2020s and this will coincide with Ormen Lange starting its final decline, as well as continued decline in Groningen as it’s production is intended to be reduced to zero by 2030. If the Laggan-Tormore fields don’t perform as planned the decline could be faster.
The UKOGA February 2018 (stretch target) “vision” projection for future production appears to be a top-down estimate and shows significant growth in 2019 (for oil and gas combined) and then a 4% decline, increasing to 5% yearly in 2023. I’d say that is highly unlikely on all counts. Their medium term projections are shown above, but also look like they are based on overall decline rates rather than bottom up field studies, so are a bit low near term, but then too high overall. Note also, just to make things more difficult, they include NGPLs in their numbers, as well as condensate, but on the other hand the pipeline oil, after metering at the platforms, loses some gas when it is treated on shore and the two numbers seem to just about cancel out.
I think the OGA aspirations are less likely here than for oil. To develop the really small gas discoveries requires a high gas price, which in the UK is not fully tied to oil (unlike, say, Japan where natural gas pricing is linked to oil). Ramping up drilling from only one rig would take some time, and rapid new gas development would almost certainly be competing with oil E&Ps for resources. On the other hand it may be looking that the West of Shetland area is more gas prone so there may be some more significant discoveries to come, and possibly onshore shale gas will prove a success.
Economic Consequences
Sometime in 2018 UK oil production will peak, probably for the last time, and then begin terminal decline. Gas production will show accelerating decline, becoming noticeably steep in the early 2020s unless there are some significant new discoveries and fast tracked projects. UK productivity is heavily influenced by oil and gas production and will likely decline accordingly. As an indication of what the consequences of continuous decline in oil and gas production might be, this is from an article in the Times in early February:
Forties pipeline closure sends [UK] industrial output tumbling
Industrial output fell by 1.3 per cent between November and December, according to the Office for National Statistics. This was the biggest monthly drop since September 2012 and came after a 0.3 per cent rise in November. The fall was large enough to cause quarterly industrial production to be revised down from 0.6 per cent to 0.5 per cent.
Off Topic Finish
And, apropos of nothing else, here are two great songs by one of the great singer-songwriters. One is about lust and longing and the other a true-life story about a destitute songwriter shot dead in a drunken argument: Right in Time & Drunken Angel
151 responses to “UK Offshore Production, 2017 Summary and Projections”
Thanks!
A novice like me always learns from your knowledge.
OT: I’m a huge Lucinda Williams fan.
Lucinda!
I figured she might go down well here.
George,
It looks like about 28 Gb have been produced and about another 15 Gb are left to be produced (if the UK authority’s projection for resources and discoveries proves correct.) So a total C+C+NGL URR of about 43 Gb?
This might be in the text somewhere, but I couldn’t find it. I estimated the 28 Gb from your cumulative 2P oil reserve chart.
Also you mention that an Aberdeen U study is optimistic, but it seems they expect cumulative oil output of 4.7 to 6.2 Gb from 2017 to 2050, the 3P reserves and 1C resources are about 7 Gb, so yes a bit optimistic, but less so than UKOGA with URR of about 34 Gb vs 43 Gb for UKOGA.
Is the URR for your projection about 37 Gb, a bit higher than the Aberdeen study?
The Aberdeen study is the second link in your post
https://www.abdn.ac.uk/research/acreef/documents/nsp-138.pdf
I’m not sure where you are getting 15 Gb from but the midterm estimate is 11.7 from 2016, I think I said that somewhere, and the vision estimate added 3 or so, so 15 sounds about right (for from 2016, so maybe closer to 14 now). 2P was around 8 for the end of 2016, but there’s been a year’s production since then. The cumulative reserves (ultimate production) are shown as the red/green lines, so less the remaining 2P would give production, I guess that’s how you got your number. I resd the numbers in the Aberdeen Institute as mainly for additional unexploited development with continued low oil prices (which already isn’t the case), so 6Gb would be high, if that is what you are referring to.
The URR figures aren’t “mine” they are would would happen if there are enough discoveries (either new or backdated as things get approved for development) to produce the equivalent of the current 3P numbers. I’d only put any certainty on the current 2P numbers (i.e. the thick black lines).
Hi George,
No I was not looking at “unexploited” resource from the Aberdeen study I was looking at oil production potential at the high hurdle rate (0.5) from 2017-2050 which is about 6 Gb. Unexploited potential is only given for all oil and natural gas.
The projection is “yours”, so the question is what is the cumulative output of all UK offshore output if your projection is followed, generally projections which assume no future discoveries or reserve growth (URR= cumulative output to date plus 2P reserves) tend to underestimate future output. That is why some authors (including me) need to continually revise their projections higher over time.
In my opinion your 3P projection might be a bit low, and I believe the Aberdeen University Energy Institute oil forecast at $60/b and 50p/therm (about 34 Gb URR and similar to your 3P projection) might also be a little low (2P is about 32 Gb). Higher future oil prices (probably more like $80 to $100/b), might allow some production of the “unexploited” resource in the Aberdeen study (about 11 Gboe of oil and natural gas). Unfortunately the study does not break this “unexploited resource estimate” into oil and natural gas.
If we assume the unexploited proportion of oil to natural gas is the same as the “exploited” fraction, the unexploited oil would be about 6 Gb.
I also noticed that two hurdle rates are used 0.3 and 0.5, for the lower hurdle rate and medium ($60/b) oil price the oil scenario increases by about 1 Gb to 7 Gb, so a URR of about 35 Gb. An assumption that half of the “unexploited” oil might be produced at a higher oil price level ($100/b) bumps the URR to 38 Gb.
In any case, at $60/b long term 34-35Gb URR seems plausible, higher future oil prices (which seems likely to me) might result in a higher URR between 35 and 41 Gb.
The 38 Gb guess just splits that high low range.
OK. My main aim was to show how high the UKOGA numbers were compared to current 2P and 3P estimates. As I said the 3P is a straight guess. I think the 3P projection shown is around 50 to 51 Gb (total – I can’t get to 34 or 38 for any combination – is that oil only, that would mean 3 to 7 Gb extra discoveries?). But proven is 90% chance and probable is 50%, so it needs about 1 Gb or more from the possible and contingent anyway before there’s any increase in overall recovery, so even the 2P might be a stretch as it’s been flat or slightly declining recently. I referenced the Aberdeen article only to show there might be a high side, but you’d have to extrapolate it’s findings to higher priced scenarios to guess what the result might be.
6Gb extra oil would be 2.2 above the 2P I think, and around the 3P to 3P plus C1, I don’t think that is particularly likely, but OK for a high case.
From memory Westwood indicated around 430 undeveloped oil and gas discoveries with almost all below 10Mb and only 13 currently economic whenever they did the analysis (I think that would be the low side). If all are produced that’s probably the 2.2 for oil, but there’s no way all, or even most, of those are going to be developed.
I guess I shouldn’t have mentioned anything about using a possible reserve number with 100% probability as a yardstick for the high side. The 2P number assumes the possibles will compensate for the probables. Anything above that is contingent or new discoveries. To do the things properly would need a Monte Carlo analysis using a probability distribution for each field and for new discoveries, I don’t have the data for anything like that.
The actual way I came to the numbers for the new oil fields was to take the nameplate, which is usually published more often than reserves or easier to guess, and used N = 150R^0.85 (N nameplate, R reserves), and then fitted a plateau and decline to match the R number. The total just happened to come out somewhere around the P3 level. That probably overestimates R for small tie backs as the flow is set by standard well tubing and flowline sizes, and the operator will probably want to get things out quickly as the hub is due for decommissioning.
Thanks.
Mostly just trying to understand your charts.
My estimates were for oil only, though they have been revised based on a more careful read of the UKOGA report for 2016 year end resources.
2P cumulative to 2016 is about 32 Gb on your chart(I was assuming that included both produced oil plus reserves, maybe that is incorrect.)
If we add possible (end of 2016) reserves to that 2P cumulative we get about 34 or 35 Gb (again reading off the chart I get about 2 or 3 Gb of possible reserves).
Chart below is from UKOGA report, it seems to show 2P=30 Gb, 3P at 32 Gb, and 3P plus 1C at about 34 Gb at the end of 2016 (see slide 11).
I thought those were the basis for your projection, but again might not have understood clearly. The UK projection would seem to be based on about 39 Gb (central estimate for contingent resource is 5 Gb add that to 30 Gb of cumulative production plus 2P reserves, plus 4 Gb prospective resources). See slide 12 of report linked below. It is not clear how much of “prospective resources” is oil. I would estimate it at about 4 Gb for central estimate which would put URR at about 39 Gb for a central estimate. For the high oil estimate it would be about 7 Gb higher so perhaps 46 Gb, the low estimate would be about 8 Gb less than the central estimate or about 31 Gb. Probably about 39+/-7 Gb is a good ballpark for UK C+C+NGL URR. To estimate prospective oil resources I assumed the ratio of oil contingent resources to total oil and gas contingent resources would also apply to prospective resources. The ratio is roughly 60% of total oil and gas contingent resources are oil contingent resources.
https://www.ogauthority.co.uk/media/4425/uk-reserves-and-resources-v1.pdf
Forgot chart for oil
dark blue is produced oil, then proved and probable(blue green), then possible (orange), then 1 C contingent (light blue at upper right.)
But you can’t add possible like that, it has less than 50% chance of production – a I said it just about compensates for the probable, which has 50 to 90% chance. The 2P number is the right figure, anything above that is new discoveries. 7Gb of new discoveries would require 700 projects given the current average size, that is not going to happen. My projection was not based on an assumed final URR, and definitely not 39Gb, I don’t know where that comes from, but on what projects there are to be developed. I think the high side is probably around what I showed as a projection, your numbers are higher than even the UKOGA vision numbers I think. I don’t agree and don’t see any basis for them, so I’m not going to put them in my post.
Hi George,
I would think it would not be difficult to sum up the data in your chart to show what the projected cumulative output is, in the post you said it was based on 2P and 3P reserves, now you are saying that is not the case.
I just read the reports you referenced from Aberdeen University and UKOGA, for Aberdeen the estimate was about 35 Gb for cumulative output of C+C+NGL through 2050 assuming $60/b and 50 p per therm. UKOGA has a central estimate of 39 Gb, including 2P reserves, and the central estimate for contingent resources and prospective resources. If we assume there are zero prospective resources, the estimate would fall to 35 Gb, similar to the Aberdeen U estimate.
They also give a low and high estimate, I just added up the columns. Note the proved plus probable plus cumulative output is about 32 Gb which I believe your projection may have been slightly lower than that.
UK projection at
https://www.ogauthority.co.uk/data-centre/data-downloads-and-publications/production-projections/
Has cumulative output of about 32 Gb through 2035, though the decline rate of about 5% looks too low relative to the 8.5 % decline rate from 1998 to 2014 (based on UK data) for C+C+NGL.
I said in the post I had tuned the total recovered to the 3P number. That wasn’t a good way of putting it as I didn’t pick the 3P number as a target, it was just what it came out to be from the estimated reserves of the fields used. I said it was a guess, putting exact numbers on a guess seems a bit contradictory. An approximate can be read off the reserve chart I gave, but if you want a number 5.2Gb more from the 2016 estimates (2P was 3.8 more).
All your other numbers seem to have something to do with the articles I linked. These all seem top down high side estimates to me, and I showed them for comparison and to indicate that there needs to be a lot of new discoveries or new FIDs on existing, small pools to get up to their numbers. I cannot comment much more than that because I don’t know how they got the values. The links allow people to make their own minds up.
In ten years 200 currently operating fields will be shut. I don’t think there will be enough hubs to do the tie-backs required to develop much of the small pool inventory within about 5 years. Higher prices may delay some shutdowns but not many, once plans are in place and lift vessels booked things have to proceed on schedule. As I said, newer discoveries may come, but interest in the 30th lease round will be important – I think that is mostly what UKOGA is relying on
Thanks George.
Looking at UK data about 27 Gb of C+C+NGL had been produced by the end of 2016, so cumulative 2P would be 31 Gb and adding possible reserves brings it to 32 Gb.
My main point was that the Aberdeen U paper (with 6 Gb more production at the lower 0.3 hurdle rate from 2017-2050) is pretty close to the 32 Gb projection you presented, basically it’s a difference of 1 Gb.
The OGA of the UK adds in contingent and prospective resources which I agree looks quite optimistic.
The additions to cumulative discovery (cumulative production plus 2P reserves) from 2010 to 2015 were only about 54 Mb per year on average relative to 424 Mb per year from 2005-2009 and 388 Mb/year from 1999-2009. A scenario where it is assumed discoveries continue to decrease as 2P reserves decrease and extraction rates from 2P reserves are around 12% per year results in a URR close to your scenario with a URR of about 32 Gb.
In short, your scenario looks very reasonable, while the OGA’s scenario looks too optimistic, by a couple Gb, probably 32 to 35 Gb is a reasonable range for an 80% confidence interval.
Great post, George.
Venezuelan output fell another 100k barrels in March. Now at 1.51. Going down as fast as the US is rising, maybe faster. Kashagan field was down by 120k, so we may be at negative world growth with an extra 1.5 to 1.9 of demand. Holy smokes! But never fear, the big banks say oil is going to $51 soon. Isn’t that the economic law of supply and demand? Supply goes down, demand goes up, so prices fall??
https://www.bloomberg.com/news/articles/2018-04-03/opec-output-falls-to-lowest-in-a-year-as-venezuela-s-woes-deepen
“Isn’t that the economic law of supply and demand? Supply goes down, demand goes up, so prices fall?”
You have something wrong
Nice post George, and thanks for the Lucinda Williams, used to see her from time to time in Austin.
What do you think about Bahrain’s tight oil discovery?
https://www.rigzone.com/news/wire/bahrain_says_new_discovery_contains_estimated_80b_barrels_of_tight_oil-04-apr-2018-154118-article/
There was some discussion under EnergyNews’s post yesterday. 80 odd Gb of maximum resource but an unknown recovery factor. They said it was their biggest discovery since the1930s, but I think that field was only about 125 mmbbls – they’ve never been a big player. And it’s offshore, so likely more expensive than Texas – I guess there would have to be wellhead platforms spaced like the onshore well pads and probably going up one a month for the life of the field (wonder how they’ll price decommissioning costs). Also there’d have to development of some sort of barge based fracking units and they’s need a good few of them. I also think all the arguments about sweet spots, gas and water handling, ultimate recovery, etc. that are seen for US LTO will be there but more so.
Forget the 125, that is how much they’ve got left at the moment – my mistake. It looks like Awali was the big field and it’s produced around 40 to 50 kbpd average for 80 years, so that would put an upper limit of about 1.5 Gb (assuming all the 125 is left in that field)
Typical recovery factors for US LTO are about 3% (North Dakota Bakken/Three Forks), so let’s make it 2% because offshore would be more difficult, so perhaps 1.6 Gb (and that is likely optimistic).
So not really a big deal, probably 1.2 Gb is a better guess.
Thanks.
I found a map of the Khaleej Al Bahrain Basin here in a survey company’s news:
https://www.cgg.com/en/Media-and-Events/Media-Releases/2017/02/Industry-First-FalconPlus-Survey-for-Bahrain-Petroleum-Company
2000 km^2 (772 mi^2) in shallow waters, maybe they can do landfill like part of Manifah off Saudi Arabia. I note the Saudi-Bahrain causeway crosses the basin.
This article’s map shows the Northern part is shallow (4 meters),
but Southern part is 20 meters or so, probably platform time there.
http://www.mdpi.com/2072-4292/9/4/385
Your idea of frack barges makes sense, tie the pumps all together and leave it.
Can they use salt-water for fracking, or is it only fresh-ish water?
Islands might work, in the GoM close in at shore I think they used jack up barges. It all sounds rather costly if they need as any wells as a typical US LTO. I don’t know about the water, or ifthere is a general rule. I know for water injection low salt is better because of the wetting properties, but usually whatever is available is used.
Seldom anything but fresh. Chemical systems in the proppant transport water doesn’t like salinity. But if you have nothing but seawater available, you can endure the lower proppant performance because it’s cheaper than freshwater transport.
Really shallow water developments use submersible barges, the hull has a flat bottom and in some cases can be lowered into the bottom if it’s soft mud. If the have coral and shallow carbonates just below a thin sand and silt layer things can get complicated, because those carbonates were exposed during the ice ages and may be karsted. This means a jack up can punch a leg through and tip over, or a structure can collapse.
We get around it taking lots of borings and using shallow water seismic which can be very expensive. I think they’ll just build small sand islands. Quality sand can be a problem in the gulf, because it’s very fine grained, more like silt. In deeper waters they can build mini platforms and use barges, or jack ups if the sea floor has the strength and they don’t risk punching a leg. The frack spread fits on a barge and gets connected to the well using large diameter coflex.
Fernando,
Any WAG at marginal cost per barrel, $50/b maybe?
I wonder what the probability is that the 40s pipeline develops another crack is?
It was considered something of a freak accident because the pipeline had ended up resting on a rocky outcrop. But there’s plenty of other possibilities for failures in old equipment, some has been around since the 70s.
Anyone have any details of the Bahrain find? Is it really as big as is claimed or is the recoverable likely to be much less? How big in world standing is it/years of consumption?
NAOM
Well if you assume they could extract all of it 80 Billion bbls would equate to . Given its shale the ultimate recoverable is probably only 5% giving you 4 Billion bbls or 40 days of global consumption.
Thanks for that. Under 6 weeks of fuel but maybe a boost for Bahrain.
NAOM
https://www.forbes.com/sites/dominicdudley/2018/04/04/why-bahrains-huge-oil-discovery-might-not-provide-the-windfall-it-is-hoping-for/#702503e8128f
From the article:
“However, the crude may still prove costly to extract. Yahya Al Ansari, chief exploration geologist at the Bahrain Petroleum Company (Bapco), described the find as “a layer with moderate conventional reservoir properties on top of an organic-rich source rock.”
This potentially tricky geology could see the field classified as being on the borderline between conventional and unconventional. That in turn has led some analysts to warn of the complexities involved in trying to extract the crude.”
Very tricky to have an informed opinion on recoverable resources (especially economically recoverable resources); a 4 billion (5%) wild guess is as good as anything else.
Bakken/Three Forks OOIP=300 Gb, likely recovery about 10 Gb so about a 3% recovery factor. A 5% recovery factor is quite optimistic for LTO, especially offshore which has never been done for LTO, probably a 1.5% recovery factor would be a better guess, so about 1.2 Gb. Say its recovered over 10 years so 0.12 Gb/year or about 330 kb/d.
In the grand scheme, less than a third of peak ND Bakken output (through 2017).
Recovery for tight ranges from 5-10%.
Timthetiny,
OOIP for Bakken is about 400 Gb +/-100 Gb (estimate by Price).
USGS mean estimate for recovery is about 13 Gb for Bakken/Three Forks.
13/400=3.25%.
Not able to find OOIP estimate for Wolfcamp shale or Spraberry Play, mean estimate for these by USGS is about 25 Gb. If recovery factor was 3.25%, this would imply an OOIP of about 800 Gb. For Wolf camp alone the OOIP implied by 3% recovery would be about 700 Gb or 110 billion cubic meters, average thickness of Wolfcamp shale is about 500 meters thick, leaving an average area of 220 million square meters or 220 square kilometers. Since the midland basin is probably at least 65,000 square kilometers (25,000 sq mi), the recovery factor may be far less than 3% for Midland Wolfcamp shale.
Link below has Midland basin average Wolfcamp thickness estimate of 1663 feet=506 meters
http://www.searchanddiscovery.com/documents/2016/10890blomquist/ndx_blomquist.pdf
With 13 Gb recovery from the Bakken, at 1 million barrels a day that is 35 years. With a descending rate that could be as much as 50 to 75 years of oil production.
It depends on how one defines oil in place. Many years ago I was in a technical committee where different companies made proposals for defining what was oil in place. One topic we figured out was that when preparing a reservoir model, the OOIP for depletion drive may not be the same as OOIP for a sweep recovery mechanism.
Fernando,
In the case of the Bakken supposedly it is 300 to 500 Gb OOIP, no doubt when making a press release the larger number is chosen if there is a range of estimates, so for the recent middle east offshore shale discovery OOIP may be 50-80 Gb.
Hi George.
Excellent analysis as ever.
The only things I know about that you did not specifically mention but are probably aware of is the Liberator field development pending funding. The Colter appraisal drill near to Wytch farm and the Wick prospect exploration drill.
Thanks – I specifically didn’t cover onshore, probably should. Actually Wytch farm was one of the first oil projects I ever worked on, it’s amazing it’s still producing.
Colter is actually offshore although not by much. The plan is to drill it with a jack up and if successful it will be developed with a long reach well drilled from a Wytch farm pad. Likewise the Wick prospect as it is adjacent to the Lybster field although could be much larger.
On a side note the Broadford bridge well to test the Weald shale play has been a failure so it’s not looking good for the other “players” in the basin.
What about shale gas – is that going anywhere? ps I did include Liberator in the projection, I can’t remember where I got the data though, with start-up in 2019 with 10 kbpd nameplate; maybe too soon and too low?
Liberator
https://i3.energy/wp-content/uploads/2017/03/20171108-i3-Corporate-Presentation.pdf
Latest on shale gas
https://cuadrillaresources.com/media-resources/press-releases/cuadrilla-completes-uks-first-shale-gas-horizontal-well/
Peak Oil Deja Vu?
Peak Oil was on my mind during the first decade of this 21st century, then I lost interest in it as shale field supply became readily available, especially in the United States. The idea around peak oil is that new discoveries are rare while the older and larger fields are being depleted from constant withdrawal of finite supply. Now it is all back in my thoughts.
Papa says: “Peak Oil.”
Yes, Mark Papa, one of the most important and respected pioneers and innovators in the critical U.S. shale oil revolution, recently went on record as saying that drillers have permanently burned through the bulk of their best shale field assets and that forecasts for future U.S. production growth are “overly optimistic.” He further feels that actual oil resource exhaustion (past peak) is beginning to take place. There are only three shale fields in the United States of any consequence, so drillers will now have to go after lower quality acreage and at a much greater expense. Stock shareholders do not want this because it will eat through corporate capital. They may punish these shale companies by selling off their stock and lowering the equity valuation of these companies.
MarketCycle feels that we are in the second half of the late-stage of the current market cycle. This is the period when inflation naturally increases; inflation causes the price of commodities to rise even without any additional scarcity. Near term, oil prices likely head higher. This will cause the production of lower quality fields to ramp up despite shareholder’s concerns, and it may also mean that during the next economic recession, the stocks of oil and shale producers may get hit hard.
Ron,
Good to see you around. Hope you are doing okay. I agree with everything that Mark Papa states, but not the forecast for higher prices by MarketCycle. Investors need to realize we are at the TOP of the markets right now. Economic Indicators are peaking and some have already rolled over.
While supply and demand are factors in determining the price of oil, what happens when demand falls faster than supply as the U.S. and Global Economy ROLLS OVER? For some odd reason, the market analysts believe demand will outstrip supply. Unfortunately, demand can fall quite quickly, as it has in the past when the highly inflated Stock & Real Estate markets implode.
Lastly, here is the current COT REPORT for WTIC crude oil. There are a near record high 738,000 Commercial Net Short Contracts in the oil market. When the price of oil was trading at a low of $30 at the beginning of 2016, the Commercial Net Short Contracts were 180,000.
So… as we can see… there’s plenty of room for the oil price to fall alongside the imploding Stock and Real Estate Markets over the next 1-2 years.
Steve,
If there is a major recession, then oil prices will fall. Let’s just say I am skeptical that anyone knows when the next recession will occur. My guess is about 5 years after peak oil is reached (centered 12 month average World C+C output).
Perhaps 2017 will be the peak, but the monthly data (12 month average) has been on a plateau at about 81 Mb/d for the past year, tight oil market will lead to higher oil prices and a gradual increase in output for the next 5 to 7 years, unless the financial market implosion you predict occurs before 2025.
Dennis- why the recession linkage in time with Peak Oil? Might not recession come about earlier from other causes, such as mismanagement (ex Trade War)?
Hi Hickory,
There are many things which might cause a financial crisis most of which are difficult to predict in advance. My guess is that peak oil will arrive in 2025+/-2. I also expect that the World will find the adjustment to declining oil output difficult, oil prices will rise, possibly to over $200/b (in 2017 US$) by 2030. I expect the World economy may be able to muddle through for 5 years or so, but the adjustment will prove too much and a Global financial crisis will eventually result.
If Trump is re-elected in 2020, with silly policies such as trying to “win” trade wars, then my story will prove false and GFC 2 could hit much sooner.
There are an infinite number of possible scenarios so the odds are pretty low, that my story will prove correct. I will leave it to you to calculate those odds 🙂
I think it’s about zero.
Hi Steve,
I have a hard time coming up with reasons why demand will not continue to grow. If you are contemplating a full blown recession/depression then yes we could see demand destruction but I think the worst case scenario would be it doesn’t grow as much.
Oil Consumption increases per year after the financial crisis:
2008 -500,000 bpd (2008 and 2009 were the first years since the start of the Iraq war where we had declining consumption because of a price spike or recession)
2009 -1,500,000 bpd
2010 2,100,000 bpd
2011 2,600,000 bpd
2012 800,000 bpd
2013 2,000,000 bpd
2014 800,000 bpd
2015 2,100,000 bpd
2016 1,800,000 bpd
2017 1,600,000 bpd
2018 1,700,000-1,800,000 bpd(expected this year)
We talk a lot about supply because it is a little easier to quantify but we have had run away demand the last few years. The global auto fleet stands at about 1.3 billion(cars and light trucks). We are adding about 80 million(a little less with scraping) cars to the fleet every year with about 1-2% being electric. It is hard to come up with scenarios where consumption won’t continue to rise for many years at a minimum of 1.0 million bpd even with increased penetration of electric cars.
You combine the growth in demand with net decline rate of 2-3%…..shale alone won’t be enough.
Thanks,
Don
Don.
Good post.
I would add that even if road transport demand softens due to transformation of the fleet to EV (which thus far appears to be at a slow pace) it appears that all other oil uses will continue to increase.
Last statistic I saw was just over half of worldwide C + C is used for road transport.
So it would seem road transport demand would need to fall a considerable percentage in order for total worldwide demand for oil to drop.
I do agree another Great Depression would be a major wildcard. Absent that, not seeing demand dropping over the next 20 years, in aggregate.
Shallow sand,
If oil output peaks and declines as I expect by 2025, maybe 2030 at the latest (probably less than a 5% chance this will be the case) and is followed by a decline in output, then demand will be forced to fall. This will be due to very high oil prices forcing demand destruction. At that point it becomes more likely that a severe recession may hit (likely within 5 years of the peak), that would also reduce demand due to lower economic activity. A period of high oil prices ($150/b or higher probably from 2025 to 2030) will accelerate the transition to EVs as well as hybrids and plugin hybrids. Battery costs will fall and the costs of EVs will also fall to parity with ICE vehicles, probably by 2025. The sales of EVs will quickly rise to 95% of all light duty vehicle sales.
From 2014 to 2017 the worldwide average rate of growth of plug in vehicles (EVs and plugin hybrids) was 44% per year. That rate of growth is unlikely to continue, but note that Ford Motor Company increased output at a 50% per year average from 1903 to 1916. If the 44% annual rate of growth of plugin vehicle sales continued until 2027 (13 years), plugin sales would be about 44 million in 2027. If we then assume the rate of growth slows to 15% until 2035, then plugin sales reach 100 million per year by 2033 and the total plugin fleet reaches 2 billion by 2048.
I agree there will probably still be demand for oil from farm equipment, heavy machinery, air travel, and ships, if oil prices eventually drop due to insufficient demand (maybe after 2050) relative to oil supply, then some oil that is expensive to produce (oil sands, deep water, LTO, and Arctic oil) may be left in the ground.
Yeah, and that small demand for jet fuel is likely to hang around for awhile.
Synthetic jet fuel is doable today, it’s just not competitive (maybe $2 per liter, with no taxes). It’s price depends primarily on the price of power. If wind & solar are overbuilt, then the price of surplus power will be very low for the majority of the time.
If oil prices are high, and surplus power prices are low, synthetic jet fuel could replace oil-based jet fuel.
Good trade off. Either oil based, or mixture of coal based or gas based product.
Well, there’s gas-based fuel (GTL), coal based fuel (CTL) and then there’s synthetic fuel (basically produced from electricity, H2 and carbon).
Both GTL and CTL are price competitive now, or very close. But, the projects tend to be very large and expensive, and so the investors are very sensitive to political risk. Given that both coal and gas generate CO2, investors have not been enthusiastic – especially for CTL.
Fully synthetic fuel would be CO2 neutral, but rather more expensive, at least until surplus power prices plunge. Cheap (or even negatively priced) surplus power is starting to appear for a small percentage of the time, but that won’t be big for quite a while.
There’s much uncertainty, but a great deal of potential for very, very profitable arbitrage.
Don & Shallow,
Let me put my DEMAND DESTRUCTION analysis another way. The Central Banks did not fix the systemic problems that led to the U.S. Investment Banking and Housing Industry collapse in 2008-2009. Rather, we have propped up the market with QE printing, debt escalation and $30+ trillion in currency swaps.
I can assure you that global oil demand will fall considerably within the next 2-5 years. The Dow Jones Index at 24,500 is still up 270% from its lows in 2009 at 6,600 points. While we could see the Dow Jones Index move back toward the 26,600 level, it’s highly unlikely that it will surpass that level.
Furthermore, the NYSE MARGIN debt (no longer being published… LOL) is now being published by FINRA, which includes other exchanges besides the NYSE. You will notice that the FINRA margin debt of $660 billion is much higher than the previous peak in 2007 at $500 billion and the $450 billion in 1999.
It doesn’t take much of a BRAIN SURGEON to realize the peaking of MARGIN DEBT equals the peaking of the markets. The amount of debt, leverage and PE Ratios in the market are off the charts.
So, anyone who believes a STOCK MARKET rally and expanding U.S. and global economy will continue for the next 5-10 years, you better wake up and smell the shale oil fumes.
The Commercial Traders holding the 738,000 Net Short Contracts have NEVER BEEN WRONG on the future oil price trend.
Do we really believe THIS TIME IS DIFFERENT in the markets and oil?????
steve
In most ways, things are worse than in 2007.
It may possibly be a slower crash though– and this will cause confusion and stories to continue.
ONE LAST TIDBIT,
Here is a typical example of highly-inflated REAL ESTATE VALUES. At the peak of the market in 2007, the median home price in San Francisco was $925,000. When the market bottomed in 2012 (not 2009), it fell to $625,000… or 33% in just four years.
Today, the current median home price in San Fran is a staggering $1,600,000 or 80% above its previous peak in 2007.
So, if anyone in here doesn’t see a MASSIVE BUBBLE in Real Estate, then maybe it’s time to check oneself into the hospital and get a much-needed BRAIN CATSCAN.
steve
Hi Steve,
Indicates a possible bubble in San Francisco, that’s one city.
From Jan 1987 to Dec 2017 the National Case Schiller Index grew at an average rate of 3.6% (linear trend line fit to natural log of the data to find average growth rate over the period.)
Over the same period US GDP grew at an average annual rate of 4.6% per year.
National income is roughly equal to GDP, so house prices actually became cheaper relative to income at the national level over the 1987 to 2017 period.
See link below for housing index
https://fred.stlouisfed.org/series/CSUSHPINSA
Data from link above used for chart below.
GDP at
https://fred.stlouisfed.org/series/GDPA#0
Well, nothing like that here in Texas. You sure that San Francisco is reflective with the rest of the country?
Guym,
No it is not reflective of the nation as a whole.
Steve always thinks the crash will be tomorrow, eventually he will be correct. 🙂
His point on margin debt has historically had a basis. Gets that high and margin calls are highly destructive. Mostly to the morons that do it, though it invariably leaks into Main Street.
Guym,
The important statistic is the ratio of S and P 500 to margin debt, that has been pretty stable since 2009, the margin debt goes up and down with the value of stocks, so we would expect a correlation. Looking at Steve’s chart there should have been a problem in 2012 to 2015 when there was more margin debt relative to stock values, today that ratio is lower.
So I do not agree that Steve’s point about margin debt is valid.
Stock market is worth about 30 trillion (value of Russell 3000 covering about 98% of stocks traded), typically about 50% of the value of stocks can be traded on margin, so that would be about 15 trillion. Steve’s chart has margin debt at about 650 billion or about 4% of available credit, seems pretty safe to me.
Housing prices are rising in places other than just in California.
https://www.inc.com/minda-zetlin/real-estate-prices-are-rising-fastest-in-these-10-states-analysis-shows.html
Boomer II,
Yes they are, but the national average is rising at a reasonable rate over the 1987 to 2017 period, about 3.6 % per year vs national income rising by about 4.6% over the same period. Not really a problem for the nation as a whole.
Rising housing prices signal to a local market that more homes need to be built as demand for housing has outrun the supply.
It does matter, though, if the growth areas also have rapidly rising housing prices, have because the cost of housing negates some of the value of those jobs.
It doesn’t matter if housing isn’t rising in areas where people don’t want to live. So national averages don’t tell us much.
Hi Boomer II,
I haven’t looked at the statistics closely, but I think there are people that live outside the high price areas in that piece. Businesses and people can choose to relocate to areas where costs are cheaper.
This is a standard feature of capitalism. Clearly incomes are higher in these high housing cost areas, but in Palo Alto I know a two lawyer family that is having difficulty finding a house they can afford, so I agree with Steve that the Bay Area seems to be in a bubble.
Probably smarter not to buy and wait for the crash.
Here’s how it happened in Colorado.
http://money.cnn.com/2017/11/01/news/economy/colorado-housing-prices/index.html
http://www.bellpolicy.org/2018/01/12/unaffordable-housing-in-colorado/
People will pay a lot to live in pleasant places with well paying jobs, whether it is boulder, boston, seattle, or cupertino. Did I mention that people also tend to value places with a culture of environmental protection, cultural tolerance and diversity, and strong education systems/universities.
If you look further afield, housing sure isn’t cheap in Vancouver, Sydney, or Copenhagen either.
Hi Hickory,
I agree, but housing prices can get out of reach. It is a choice people make.
The SF Bay area is quite a bit more than the Boston metro area, I think.
I am in a rural area that’s cheap by comparison.
I live in the heart of the bay area, and the biggest problem with housing is affordability for average workers. It seems as if there is so many buyers with enough capital to keep escalating the prices, particularly in the more desirable areas. I’m told its been like this for a long time, but unlike the 50’s-70’s, there is very little room for any expansion of capacity within a decent commute zone. Expect big infill over the next decades.
I suspect this is a similar story to that found in other such areas.
btw- I was astounded how much money was showing up to bid on houses that we looked at last year. Location.
I’m a former Marin/Sonoma resident, with a history of longer residency down on the Peninsula.
It is hard for someone who hasn’t experienced this to grasp.
(I have also lived in LA and New York)
A beautiful place to visit. I just could not afford to buy a home there, it’s nice, just not 10 times nicer than where I live (in my opinion), basically my home would be at least 10 times more expensive it were placed in a nice neighborhood in Palo Alto.
I have family near Boston, New York City, and San Francisco, definitely more expensive near the big cities, but Silicon Valley is really out there.
Median home price in Palo Alto is over 3 million (so actually over 10 times more expensive than my current home.) A town where a friend lives near Boston as a Median price of 800k, and friends in New Jersey (about 45 minutes from NYC) have a median price of 400k.
Sonoma County is a little more reasonable at 600k, and San Jose at 1000k is still pretty pricey.
An important aspect of housing pricing is financing. Requirements to get a loan are so tight compared to pre-crash days that lending is actually quite responsible. Gone are the days of ninja loans and 125% cashout loans. LTVs are reasonable and FICO requirements are pretty high.
It certainly is possible that housing will crash at some point but it’s important to not fight the last war.
Rgds WP
Hi Weekend peak,
If your assessment is correct (and I believe it is), that makes a housing crash (like 2008/2009) less likely.
Dennis & et al,
Yes, San Fran is not indicative of the entire country. However, the next chart does provide the MEDIAN HOME PRICE for the country. As we can see, the current FRED data showing Q4 2017 median home price of $328,000 is 32% higher than the peak in 2007 at $257,000.
However, the current median home price is 58% above the low of $208,000 in 2009.
Steve
You could just about show a straight line to current from 1970. More indicative of labor and material increase than a bubble. The bubble part of the last fiasco was mainly created by easy loans. I just gave up my mortgage license because getting a loan is so much of a pain, now. It is not easy. No liar loans. My last post on this issue, as it has nothing to do with oil.
Hi Steve,
Income increase will drive up house prices and we need to look at average income rather than median because a lot of the homes purchased are by wealthier individuals. National income has increased, but I realized I should look at GDP per capita from 1987 to 2017, that increased by about 3.6% per year over that period. If we assume houses built increases proportionally to population then this should be a better measure than GDP alone. For new home mean sales price from 1987 to 2017 the average rate of increase was 3.7%. This figure does not account for homes becoming larger on average over that period. Average home size increased from 1900 square feet in 1987 to 2500 square feet in 2015. Average house size in square feet has increased at an average rate of 1% per year from 1987 to 2015, so the price per square foot relative to income fell over the 1987 to 2015 period.
http://www.aei.org/publication/new-us-homes-today-are-1000-square-feet-larger-than-in-1973-and-living-space-per-person-has-nearly-doubled/
An oil crisis may be brewing — and it’s not because of decreasing demand
Some think the oil market is approaching peak demand as electric vehicles become more popular.
But others think the oil industry will struggle with a supply crisis first.
The last time this happened, oil prices rose to $100 a barrel.
One school of thought is that future oil demand is set to decline because consumers will have better options. Many in this “peak demand” camp believe that the growth of electric vehicles will soon make oil obsolete.
That’s a relatively painless view of the future and is consistent with much of our past experience. Old technologies are frequently replaced by newer, better, and cheaper technologies.
I have written previously on why I don’t believe this version of future oil demand will unfold anytime soon. In a nutshell, if you “do the math,” it becomes clear that it will be years before EVs can take a meaningful bite out of oil demand.
Meanwhile, some organizations are sounding the alarm that rather than a peak demand scenario, we may soon face a peak supply scenario. Or at the least, the loss of global excess spare capacity. The last time this happened, oil prices rose above $100 a barrel.
Words of Warning
In January 2017, Saudi Arabia’s energy minister Khalid A. Al-Falih warned CNBC that he foresaw a risk of oil shortages by 2020:
“I believe if the investment flows that we have seen the last two or three years continue in the next two or three years, we will have a shortage of oil supply by 2020. We know, from what we have seen in the last couple of years, that prices around the current level and below are not attracting enough investment. We know the level of natural decline that existing production is undergoing, and we know that demand is picking up at 1.2 to 1.5 million barrels a year. So between increase in demand and natural decline, we need millions of barrels every year to be brought to the market, which requires massive investment.”
In March 2017, the International Energy Agency published its market analysis and forecast report, Oil 2017. In the report, the IEA warned that the global investment slump of 2015 and 2016 already poses a risk to future oil supplies and that 2017 global spending didn’t look encouraging. Oil supplies are growing in the U.S., Canada, and a few other places around the world, but the IEA report concluded that this growth could stall by 2020 if spending doesn’t pick up.
The report projects that if current trends continue, spare production capacity in 2022 will fall to the lowest level since 2008 (when oil prices nearly reached $150/BBL). On the topic of EVs, the IEA estimated they will only displace small amounts of transportation fuel by 2022. Further, the IEA said that it doesn’t foresee peak oil demand anytime soon.
Halliburton, the world’s largest hydraulic fracturing service provider, reiterated the IEA’s forecast last summer at the World Petroleum Congress in Istanbul. Mark Richard, a Senior Vice President with the company, said that the $2 trillion in spending cuts in the global oil industry over the past few years would impact the price of oil around 2020. Richard added, “Sooner or later, the market is going to catch up. You’ll see some kind of spike in the price of oil. Maybe somewhere around 2020-2021, but it’s got to catch up sooner or later.”
The British multinational bank HSBC gave similar warnings in its Peak Oil Report 2017. The report noted that the oil market is currently adequately supplied, but spare production capacity could soon shrink to just 1 percent of global supply, bringing the risk of disruption and the subsequent volatility back to the oil markets. HSBC noted that oil demand continues to grow at more than one million BPD every year, and they didn’t see a peak demand scenario before 2040.
The HSBC report further noted that global oil discoveries have been declining and that 81 percent of the world liquid production is already in decline.
Shale Oil and OPEC May Not Be Enough
There is more to this article but you will have to go to the link to read it. But the point is these “Peak Oil Supply” articles are becoming more and more frequent. So look for a lot more of them in the future.
Yeah, more so, because that 2020 timeline is rapidly moving toward 2019.
another balanced article by Rapier. many of points he makes, I made here 2 years ago. long story short DEMAND continues to grow. future supply at risk because of low price and insufficient CAP EX. big surprise, this cycle is NO different than the ones before. thanks for the link
Thats the scenario I see. Bumpy plateau in supply, exceeded by demand growth.
Thanks Ron,
That’s why I suggest oil prices are likely to increase, unless there is a global recession which curbs demand for oil. While that cannot be ruled out, I think it more likely that oil prices will rise first and then after a few years of high prices and eventually a peak in oil output that the global economy may succumb to an economic crisis.
There might be a bit of acceleration in the move to electric transportation, but it is likely not to be enough to avert a global economic crisis in my view.
What was that Export Land Model, where growing internal use of oil caused exports to mostly cease in the future? Any updates on that?
The Electric Vehicle Disruption – End Of Oil by 2030
https://www.youtube.com/watch?v=E7Jg1IJ68_g
Gone fishing,
An older piece by Euan Mearns (from March 2017) at link below
http://euanmearns.com/peak-oil-exports/
So you think Brazilians, Pakistanis and Russians will be zipping along on electric vehicles by 2030?
Fernando,
At some point C+C output (and other fossil fuels as well) will peak.
My guess is that total fossil fuel output (EJ of coal, oil, and natural gas) will beak before 2030, (about 2025 for C+C).
Prices for liquid fuel will increase sharply while costs for EVs and plugin hybrids will continue to fall.
By 2035 it is possible that 95% of new car sales will be plugin vehicles, the rest of the fleet will turn over to electric over the next 10 or 15 years.
ICE vehicles will be as common as horses are today for transport by 2050.
on that point
https://oilprice.com/Energy/Crude-Oil/Oil-Prices-Poised-To-Rise-As-Cycle-Comes-To-An-End.html
thanks Texas Tea, good piece.
https://mobile.reuters.com/article/amp/idUSL3N1R95VC
Permian discounts keep rising. Takeaway on oil at the top now. Genscape gives their view on pipeline capacity (2.725), and total rail plus local refining is 3.175. Genscape makes its living with these estimations, so I’ll go with their numbers. EIA says it is at 3.08, but pipelines going to Corpus are at 96%. Next increase is 200k towards the end of this year, and another increase in an existing pipeline of 120k later this year. Beyond that, it is in the later part of 2019, when it increases to 1.5 million. Time to invest in those rowboats, Dennis. The E&Ps have painted themselves into a corner, with no door close. Combined with having to give away gas, if they can, they are firmly against the wall on oil takeaway, only an idiot would keep on wildly completing wells.
Permits show no increase yet in the Eagle Ford. Brent/WTI spread increasing. Now, at 4.8, earlier it was over 5. More out the front door, demand picks up, Permian growth slows. Could see some big drops in inventory in the US, and, for sure, the rest of the world will drop. Venezuela drop will overtake US production for awhile. Trump will sanction Iran, possibly causing a drop which would offset any excess OPEC production. Demand will keep on trucking. And the EIA and IEA will keep propagating voluminous amounts of platitudes to ease the public. And that dearth of oil that OPEC predicts by 2020, will happen by the end of 2018.
It is all about the Permian for the current game.
The Bakken is still at peak production, but oil per well is falling (it is just a matter of time).
We shall see—–
Guym,
I am starting to come around to your point of view. Without an increase of at least 400 kb/d in the Permian by the end of 2018, my guess of a 1000 kb/d increase does not happen, and perhaps even your estimate of 600-800 kb/d might be too high if Permian output can only increase by say 300 kb/d due to pipeline constraints.
Are you thinking that perhaps 600+/-100 kb/d might be a better estimate?
About 60% of the 1200 kb/d increase in US output in 2017 was from Permian output (720 kb/d roughly). Cut that to 320 kb/d and assume the rest of the US matches the 2017 level of increase and we are down to 800 kb/d, and even the 320 kb/d is looking optimistic due to a lack of pipeline capacity.
I really don’t know how some of the smaller companies will roll with the constraints. However, one could only assume most will simply cut back, eventually. It may climb back up towards the end of the year if 320k comes available. Okla just added five more rigs. Eagle Ford is status quo. Bakken may rise up 100k, maybe. I think 600k plus or minus 100k is as good as any. All of that will change the first of 2019 as there will be more activity in the Eagle Ford and Bakken to pick up more oil at a much higher price, but overall shale will not perform as expected for 2018 and 2019. Rigs may not change much in the Permian, immediately, due to DUCs. At some point the capex will weigh, though.
Here is the real oddity, there is no slow down in permitting in the Permian. Completions are about the same or a little less for March, but permits are up.
http://www.rrc.state.tx.us/media/44839/ogdc0318.pdf
No increase in the Eagle Ford.
Another victim of really shoddy reporting. This is from the horse’s mouth.
https://www.genscape.com/blog/growth-permian-production-stress-outbound-infrastructure-late-2017
Note the 3.175 includes only pipeline and local refinery. It does not include rail, as indicated by the dotted line. Discounts are probably more reflective of rail transportation costs. However, those rail costs will, no doubt, increase. However, I am still sticking to 700k, as I really don’t see the rest of the shale areas increasing that much on the short time frame to year end, and as I get from George, GOM may decrease 50k. Oil price is at $62 now for WTI, so it’s not supporting a near term spike in other areas.At any rate, it will be far less than EIA or IEA are projecting. And this reflects oil takeaway, gas is already there.
Ok, now Platts has a completely different pipeline number than Genscape. They have it at 3.4 with 439k of local refining capacity. Of course, if that were true, why would there be an $8 discount on Permian? So, it may not be that E&Ps are not so stupid, they may be getting bum info. What is the good info, and what is bum info?
So, looking at Texas RRC completions per the quiery to reported completions, it appears what is reported as completions is close to matching approved completions. There are about 1200 more completions reported this year that have not been approved. No doubt they are producing oil, and the activity is probably much higher than indicated, just looking at basic RRC stats.
It reminds me of the story of three blind men asked to describe an elephant by just touching it at one time. Three different areas, three completely different descriptions. Permian is much bigger than an elephant.
https://www.platts.com/latest-news/oil/washington/delek-looks-to-run-more-permian-crude-hoping-21453817
My projection has been changed to basic confusion. That world inventories will drop dangerously is a probability. That the concentration will remain on what is, or what is not going to be produced out of the Permian is a higher probability than seeing the deficit. Prices will not rise much until confusion goes away. Good luck with that.
And the error about the rail is repeated here. Don’t journalist try to fact check any more? Still, the story is trying to get out.
https://oilprice.com/Energy/Crude-Oil/Permian-Bottleneck-Could-Impact-Global-Oil-Markets.html
The problem with rail transport is: There are not many extra rail cars waiting for usage.
Cars suitable for oil transport have a life time of 30 years – and they have to earn money in this time. Nobody buys new ones, when there is a pipeline next year, for only 1 year of earning money.
And I think every rail car for oil available on the american continent is in use in Kanada at the moment, earning big money there.
So when pipelines are full, there isn’t much spare capacity left for raw oil – or if they transport raw oil, no diesel or gas will be transported anymore.
Actually, the US has been moving more railcar loads of petroleum and petroleum products than Canada so far this year and for a number of years before.
This moving would come on top of existing movements – cars that transport oil productions from the raffinery to for example Idaho can’t be used for transporting Texas crude to the coast. The question is how many spare capacity is there – and if this spare capacity is not already in Kanada with it’s high profit for oil transporting – and if rail capacity is not already filled with transporting fracking sand.
How many new capacity will come online next year? And how few months it will take to fill it up again?
Guym,
That’s an old piece from a year ago (March 2017). In Feb 2018, Permian output was over 3 Mb/d according to Drilling Productivity report (includes both tight and conventional output from Texas and New Mexico Permian Basin).
Yes, I know, but $8 discount and 96% transmission capacity (regardless of whose right) are brand new pieces of info from them. And you notice I am no longer estimating Permian production for 2018, I am simply predicting confusion. Whatever it is, it will be short of expectations, or needs. Even more so for 2019. Oil inventories will be in free fall for awhile.
Guym,
I agree, there seem to be conflicting reports about how much Permian output is viable with existing pipeline, refinery, and rail capacity. The answer to refinery and takeaway capacity and oil prices will determine output levels. Somewhere around 800+/-200 kb/d may be a reasonable guess with lower output for less capacity and/or lower oil prices and higher output for the reverse.
We are in agreement that the EIA/IEA estimate for a 1300 kb/d increase in US C+C output in 2018 is not likely to be realized.
But what about NG handling and NGL handling? The weakest link in the chain will be the rate controlling step.
Natural Gas will be flared if there is inadequate pipeline capacity so might not be a constraint. Possibly the flaring rules will be enforced more tightly in the future, if so that will limit production. Not sure about NGL capacity.
Have not been following that close, but I do remember reading they just opened a new NGL pipeline, which I think alleviates stress there.
Amusing. Scotland based their independence movement on recovering oil production.
Baker Hughes Monthly International Rig Count for March
Total 972, down -7
Oil 753, up +2 month/month
Gas 186, down -10 m/m
Misc 33, up +1 m/m
.
Offshore 185, down -9 m/m
Land 787, up +2 m/m
Baker Hughes Weekly US Rig Count
Oil 808, up +11 week/week
Gas 194, no change
.
New Mexico +3
Oklahoma +5
Texas +2
2018-04-07 (Arab News) Saudi Aramco’s billion-dollar shale gas gamble
A rough estimate for the shale gas in Jafurah could be at least 600 trillion cubic feet because the layer Aramco is targeting there is the source rock for Al-Ghawar, the world’s largest oil field. Aramco has already started its quest in Jafurah. The company has drilled hundreds of wells there and at least 10 drilling rigs
.
Saudi Aramco already produces huge amount of desalinated water, which is injected into oil fields to maintain the pressure of the reservoirs. Each day, the company injects around 15 million barrels of water to produce 10 million barrels of crude.
http://www.arabnews.com/node/1280736
A good summary for Bahrain is that they still don’t know how much recoverable oil is there, could be anywhere from 1 to 7 billion barrels?
2018-04-04 (Platts) “Don’t get over-excited,” warned Tom Quinn, Wood Mac’s senior research analyst. “The 80 billion barrels and 20 Tcf are resources — what is in place. Reserves are what can be recovered – as the reservoir is tight this could be single digit recovery factor.”
“So reserves could be in 1-7 billion barrel range,” Quinn added.
https://www.platts.com/latest-news/oil/dubai/bahrains-new-discovery-could-hold-more-than-80-26929507
The connection between crude and food prices has been discussed here at POB before. Last couple of years has seen record harvest and grain stocks have increased. Demand is catching up and supply-demand is expected to be more balanced this year and next – perhaps result in stock drawdowns. FAO food price index is up. A new food crisis will happen but the timing will depend on several factors including the level of physical stocks (currently stable, expected to decline) and oil prices (currently trending upward).
http://www.fao.org/worldfoodsituation/foodpricesindex/en/
There was snow on the ground today in most of the corn belt.
Usually planting starts 4/1-4/20.
Supposed to warm up midweek and then turn cold again. Soil temps are too cold to plant in most places.
Big time drought in Western KS, OK panhandle and TX panhandle, which also are areas that grow significant corn.
World inventories, based on weekly data for US, EU, Singapore and floating storage…
2018-04-09 (SEB) Global crude and product stocks now in decline – down 18 m bl last week
Global inventories declined 18 m bl last week with declines across the board (US, EU, Sing, floating). Inventories have been rising during the first part of this year as is normal seasonally and as has been the case over the past three weeks as well. Though gains this year has been much smaller than in previous years. Last year inventories rose 112 m bl from the start of the year to mid-March. This year they only increased 43 m bl to mid-March and are now clearly in decline. As long as OPEC+ sticks to its cuts we expect inventories to decline here onwards thus leading to a renewed tightening of the crude oil spot market.
– Very strong oil demand growth
SEB Bank http://ravarumarknaden.se/oil-hurt-by-trade-war-concerns-but-fundamentals-are-bullish/
Ch1: Weekly oil inventories (US, EU, Singapore, floating)
So inventory peak last year was in late March and it bottomed in December, difference is about 220 mbl. A deficit of >800kb/day. Interesting.
Reserve capacity of the Opec is round about 1 mb/day – and the US boom is getting at obstacles. Sound like an interesting time, when the demand forecast is right and Venezuela keeps collapsing absorbing the whole US growth.
“Growth is a bit weaker, inflation is a bit higher, financial markets are definitely more volatile, and economic imbalances (especially in government finance) are starting to become more visible.”
Yes and also if it wasn’t for the USA ramping up production and exports (in theory at least) then rather than the seasonal builds that we’ve seen for the last couple months, there would already be a supply shortage in 2018
April 6 (Reuters) U.S. midstream oil firm Buckeye Partners and commodities trader Trafigura said on Thursday that modifications to their terminal in Texas Corpus (Christi) to accommodate large tankers were completed and the first shipment of crude on a Suezmax tanker took place
The Suezmax Mt Astra loaded 1 million barrels at the terminal on March 31
https://www.reuters.com/article/buckeye-partners-oil-trafigura-beheer/buckeye-trafigura-load-suezmax-oil-tanker-at-u-s-port-after-upgrade-idUSFWN1RJ0A1
That’s scheduled to be just one a month.
II have my doubts about builds in rest of the world when US inventory drew by 40 MM barrels in first quarter.
https://www.bloomberg.com/amp/news/articles/2018-04-09/exxon-sparks-imf-concern-with-weighty-returns-in-tiny-guyana
How did we miss this?
2018-04-10 ABU DHABI (Reuters) – Abu Dhabi National Oil Company (ADNOC) said on Tuesday it was launching a competitive exploration and production licensing round for six oil and gas blocs, its first ever.
Two of the six blocks are offshore and four are onshore and estimates suggest they contain “substantial amounts of oil and gas”, ADNOC said in a statement.
https://www.reuters.com/article/us-emirates-adnoc/uaes-adnoc-launches-oil-and-gas-exploration-round-idUSKBN1HH0JM
Map = blocks in orange https://pbs.twimg.com/media/DaZslcvXUAEJ3Xb.jpg
It sounds like Saudi Arabia would like a minimum of $70 (Brent) barrel. Whereas others were saying that above $70 would increase supply.
2018-04-10 Saudi Arabia is said to signal ambition for USD 80/bbl oil price
FT comment = Given that excess oil revenues (above breakeven of $70ish) will be funneled into sovereign wealth fund this makes sense.
And also Saudi Aramco IPO
They are likely to get their wish ($80/b Brent) by Dec 2018 in my opinion. I think the monthly average price of Brent will hit $80/b some time before Jan 2019. Though oil price volatility will continue.
SA is still writing red ink – they need almost 100$ until the fund can be refilled. The restructuring will take lots of money, too.
Bombing children in Jemen is expensive, too.
WTI crude prices are up overnight, extending post-XI-sprech gains following headlines that Saudi Arabia wants to get oil prices near $80 a barrel to pay for the government’s crowded policy agenda (and costly war with Yemen) and support the valuation of state energy giant Aramco before an IPO.
Bloomberg reports that in conversations with OPEC delegates and oil market participants, Saudi officials had been careful to avoid pinpointing an exact price target. Yet people who have spoken to them said the inescapable conclusion from the conversations was that Riyadh is aiming for $80.
The private discussions, relayed by several people who met the Saudis over the last month and asked not to be named to protect their relationship with the kingdom, chimes with the hawkish tone in public from Saudi officials.
Of course, none of this is new, and is all dependent on Russia playing along (less likely as they are affected by western sanctions) and Shale supply stalling (unlikely if prices rise)…
This echoes MbS’ recent comments in a Time Magazine interview last week…
“We believe oil prices will get higher in this year and also get higher in 2019, so we are trying to pick the right time,” he told the magazine in reference to the IPO. Riyadh, which initially targeted the second half of 2018 for the listing, is now aiming for next year.
We assume ‘hope’ is now a strategy for Saudis too. Simply put, it seems like desperate jawboning from the Saudis as everything else has failed, and as Bloomberg notes, there’s little indication the Saudis are prepared to deepen their oil cuts to achieve $80, at the very least the aspiration suggests they’ll keep with the current measures until the price goal is closer. Riyadh is counting on declining Venezuelan oil production, the likely imposition of new U.S. sanctions on Iran, and continued demand growth to absorb U.S. shale production.
https://www.zerohedge.com/news/2018-04-10/crude-jumps-saudis-signal-ambition-80-oil-price
2018-04-10 (Platts Twitter) Saudi Aramco to keep May crude oil exports below < 7 million b/day for 12th straight month, “despite nominations coming in higher than the previous month, as demand picks up seasonally," SaudiArabia also reports that its March production was 9.91 mil b/d. That is lowest self-reported level since November 2017. Saudi Arabia energy ministry says in statement
Chart production: https://pbs.twimg.com/media/Dab7yRSWAAErrjo.jpg
EIA STEO – Crude oil production in the Permian region of Texas and New Mexico could be facing pipeline constraints, which is reflected in a widening discount of WTI Midland crude oil prices to Magellan East Houston crude oil prices. The WTI Midland price discount settled at -$8.70/b on April 5, the largest discount since price postings for Magellan East Houston began in 2016 (Figure 2).
The latest pipeline out of the region to begin service is the 0.4 million b/d Midland-to-Sealy pipeline, which began service in the fourth quarter of 2017 and is starting full operations this month. However, the widening price spreads suggest that takeaway constraints could already be affecting oil producers. New pipelines and pipeline expansions are not expected to be completed until the middle of 2019
https://www.eia.gov/outlooks/steo/marketreview/crude.php
Yeah, the STO has some reality disconnects. They are still projecting a 10,7 AVERAGE for 2018, and a completely irrational average of 11.4 next year. With no additional pipeline capacity until the second half of 2019. Ok, get them rowboats ready! Barges down the Rio Grande??? May have to wait for a good sized rain. They’d only lose about half to the cartels. Aframax loading in Port Brownsville?
And Canada is forecast to grow too, +0.29 million b/d average year/year, but no mention of their pipeline or rail capacity? They don’t forecast much growth from anywhere else (this chart includes NGLs)
Total U.S. crude oil production averaged 9.3 million b/d in 2017.
EIA projects that U.S. crude oil production will average 10.7 million b/d in 2018
So Canada and the US are going to pull out 2.2 million in 2018? 1.3 million in 2019? And both Canada and the US have no extra pipeline capability til the second half of 2019. Good luck with that.
How much pipeline capacity is planned for late 2019?
Can be a bad deal, anyhow, when after a few years the production falls again because of depletion of core areas and pumping the more difficult tier 2 areas on a slower pace. How much years does it take until a pipeline pays down and earns real money?
2018-04-11 (Reuters) Cushing’s oil market clout wanes amid U.S. export boom
Permian Basin prices have declined because pipelines can’t be built fast enough to get crude to the Gulf, even as pipeline firms have added about 600,000 bpd in capacity since late last year, according to data compiled by Reuters.
Projects in the works could boost outgoing pipeline capacity from the Permian from 2.7 million bpd in March to more than 4.5 million bpd by the end of 2019, according to energy industry information provider Genscape.
https://www.reuters.com/article/us-usa-oil-record-cushing-analysis/cushings-oil-market-clout-wanes-amid-u-s-export-boom-idUSKBN1HI0GE
Chart page http://fingfx.thomsonreuters.com/gfx/rngs/USA-OIL-RECORD-CUSHING/010061LL3EP/index.html
Note that very little of that capacity comes online in 2018, all of the capacity in the chart is in 2019 and 2020.
If that’s correct, there is little likelihood that Permian output can increase beyond current levels, unless there is local refinery capacity (or expansions) or perhaps rail capacity to move the oil.
This is the reason the EIA’s STEO forecast of a 1.4 Mb/d increase in US C+C average output in 2018 is likely to be at least 400 kb/d too high, perhaps other US LTO plays, conventional output or GOM increases will take up the slack, but I doubt it.
The pipeline capacity restraints ensures a price spike near or after year end 2018, which has been my thesis all along (the price spike, not the capacity restraints..did not know). So with oil induced and maybe a more general commodity based rising inflation (with a lag) interest rates must rise at some point, or else nobody wants to lend out anymore. And with rising interest rates a collapse must happen given the level of debt everywhere. The options of government deficit spending or printing money are going to hurt the currency big time and should not be preferred (hyperinflation on its way if that is the case). But the timing of rising interest rates is uncertain, I will give a fee to whoever knows the answer to when it will all unfold 🙂
Dennis: Lol, yeah a little over 400k barrels. Jan was down in Texas. Talking heads saying it is close to 600k. Means a 650 spike in two months. Slightly unbelievable, based on historical increases, and other constraints. Half of that with a lot of optimism.
Guym et al.,
Has anyone noticed that the Premier of Alberta said that if Kinder Morgan decides to pull the plug on doubling the TransMountain pipeline because of endless opposition, well then, Alberta would buy the thing and push it through?
I hope he did NOT tweet that. Even if they do, it won’t be finished anytime real soon. The Terminator is going to sue big oil for murder. Trump tweets the entire US is fired. Putin rips off his shirt to go all Tarzan. The world does not want leadership, they want theater.
Guym,
The Premier is a she not a he, and it wasn’t a tweet. Alberta and British Columbia are at daggers drawn and both Ottawa and Alberta have issued the permissions for the doubling, while legal advice says that BC doesn’t have the legal ability to stop the project, which BC’s Premier swears he’s going to do.
This matters: the reason Canada’s oil-sands production is at such a discount to WTI is the lack of pipeline to get Canadian production out of the country to markets other than the US.
WTI now about $66. Most likely a short term spike on a steadily rising trend, owing to Syria tensions.
Brent futures currently at about $71 per barrel (June 2018), which better reflects the World price of oil. WTI typically trades at a discount to Brent (currently WTI futures are at $67/b for May 2018, June 2018 about the same price).
Natural gas outflows from the Permian reaching pipeline capacity
2018-04-08 (RBN Energy) Permian Basin natural gas production is growing at a torrid pace. After starting 2017 just below 6 Bcf/d, production is set to breach the 8-Bcf/d mark soon on its way to 10 Bcf/d by the end of 2019. Pipelines flowing out of the basin are coming under increasing strain, and just about every single gas pipeline leaving the Waha hub in West Texas is now being utilized at levels not witnessed in years — if ever.
https://rbnenergy.com/omaha-permian-natural-gas-is-increasingly-headed-to-somewhere-in-middle-america
I guess that we won’t know how much natural gas Mexico will take until their own pipelines are completed within Mexico later this year
Kinder Morgan’s Gulf Coast Express comes online in late 2019.
EIA – This week’s domestic crude oil production estimate incorporates a re-benchmarking that raised estimated volumes by 100,000 barrels per day.
https://www.eia.gov/petroleum/supply/weekly/
US ending stocks April 6th
Crude oil up approx +3.3 million barrels week/week
Oil products down -0.3
Overall total, up +3
Natural Gas: Propane & NGPLs up +4.1 (not included in chart)
Monthlies they have down to a fine art. Weeklies are just noise. Full of sound and fury, and signifying nothing. Sorry, William.
And that 3.3 increase is with over a 700k increase per day in imports. Exports down for the week. That’s temporary with over $5 WTI/Brent spread.
Anybody got a map of Syrian oil and quantities?
https://www.eia.gov/todayinenergy/detail.php?id=35732
EIA have their latest predictions for GoM out. They indicate about 450 kbpd oil coming on line in 2018 and 2019, from the fields below. Most of this is wrong. Amethyst, Otis and Tomcat are gas fields with little condensate, and they have all been started already. Amethyst was a mess and the licence has been rescinded. The Phobos licence, too, has been rescinded and will not be developed by Anadarko – though EIA show it against LLOG so maybe they picked it up, but the only tie-back option in the area is Lucius, which is Anadarko operated and with some other brownfield work already scheduled this year. Rydberg can only be developed after Appomatox has production capacity probably in the early 2020s (it’s not yet commissioned even). Gotcha is operating as part of Great White. I’ve heard nothing on Bushwood, but its lease number has been produced since 2014 as part of the Geauxpher field (the BOEM name, it is pretty much dry gas and in decline). Stampede is really a single field. It has started and Kaikias will start (but I think in 2019), together they’ll add about 70 to 80 kbpd yearly average (probably less in their first years).
On the other hand EIA have missed Constellation, Hadrian North, Big Foot, Red Zinger, Crown & Anchor, Blue Wing Olive and Claiborne. Except for Big Foot these are small tie-backs. They don’t total more than another 80 kbpd, but more than that they can’t add to total production because they are going to existing platforms that have to decline first to make production room (Kaikias may be in the same category). Big Foot will add 75 kbpd through 2019, but it might be 2020 before it’s at full capacity. Buckskin is a bigger tieback, also missed (maybe this is what Phobos was supposed to be as it is LLOG operated), due in 2019 which might have a net increase on Lucius.
EIA also seem to have very little decline in any of the existing mature fields through 2018 and 2019.
https://www.zerohedge.com/news/2018-04-12/opec-oil-production-slides-venezuela-output-tumbles
Pre upheaval, Syria flowed about 400K bpd. Falling slowly.
Here’s a map of where the oil is.
https://ig.ft.com/sites/2015/isis-oil/
And this shows where the forces are positioned. http://omranstudies.org/images/Published%20Maps/International%20Main%20Military%20Bases%20and%20Airports%20-%20April%202018.pdf
The Syrian government’s forces and allies lined up facing the Kurds. The oil is right at the separation of forces. What a coincidence.
The Kurds appear to be the best fighters in the region.
I guess being the largest cultural group without a country hones your skills.
The US occasionally uses these forces– I would do so with caution.
Of course, what do I know?