North Dakota has published January production data for the Bakken and for all North Dakota.
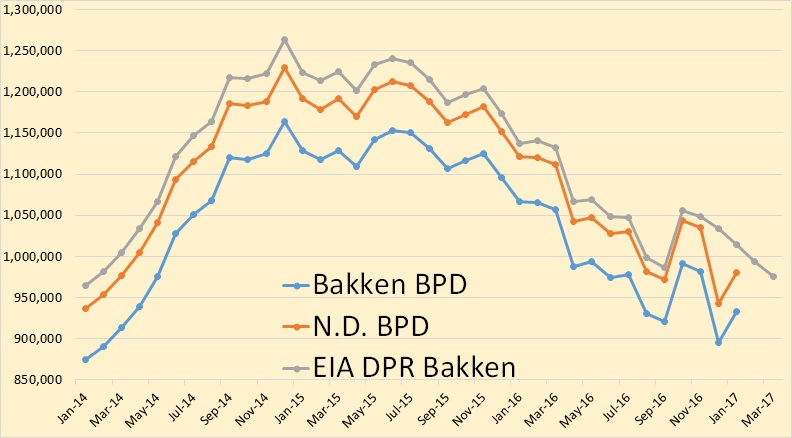
Bakken production was up 37,617 bpd to 932,817 bpd while all North Dakota’s production was up 37,972 to 980,294 bpd.
North Dakota has published January production data for the Bakken and for all North Dakota.
Bakken production was up 37,617 bpd to 932,817 bpd while all North Dakota’s production was up 37,972 to 980,294 bpd.
The labels in the chart above are for the “corrected (3 month)” estimate. This estimate (now preferred by Dean Fantazzini) is 35 kb/d lower than the EIA estimate for Sept 2016 (which is the most recent EIA estimate). Texas C+C output has fallen by about 500 kb/d from the April 2015 peak. Read More
Edit 12/2/2016, 8:30 AM EST. A corrected chart for correction factors below and a new chart added.
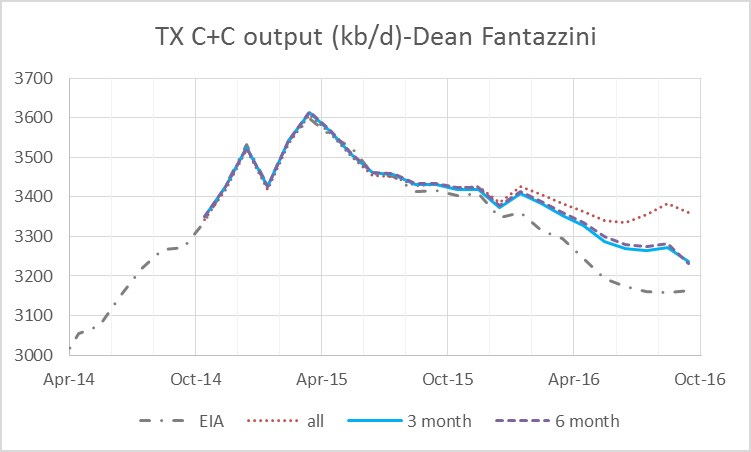
The railroad commission of Texas released September output data a few weeks ago and Dean Fantazzini made an estimate of the “corrected” data for crude plus condensate (C+C) and natural gas. Last month he found there had been a structural change in the data in March and provided a new estimate using only the most recent 3 months of data, I chose to use the most recent 6 months of data instead.
This month I will present the old estimate (labelled “all”) using all vintage data (dating back to April 2014) as well as the 6 month and 3 month estimate, which use the most recent 6 months and 3 months of data respectively. Read More

Dean has provided his monthly update for Texas Oil and Natural Gas. The most recent month’s estimate is often volatile and may be ignored, the June and May estimates are likely pretty good (within 1% and 2%), the April 2016 estimate is likely to be robust(within 1% of the final value). The June EIA estimate is 240 kb/d lower than Dean’s estimate (about 7% too low). Read More
The EIA’s Petroleum Supply Monthly is just out with production numbers, through August, for each state and offshore territories. The EIA’s Monthly Energy Review is also out. This publication has US production data through September but not for individual states.
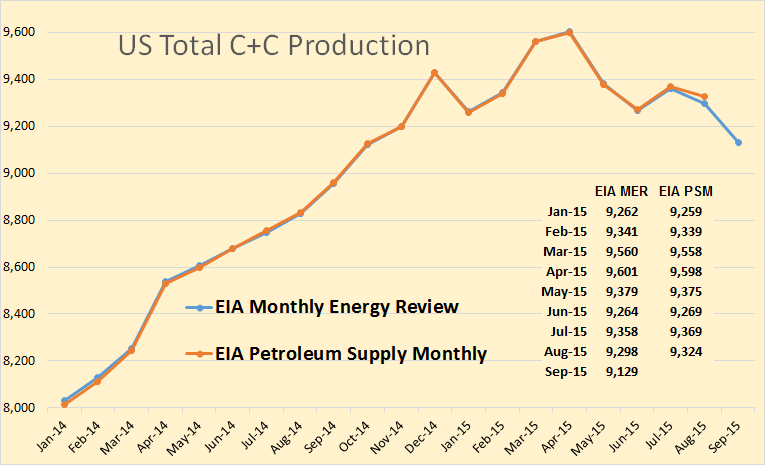
The Petroleum Supply Monthly June 15 production numbers were revised down considerably this month. And you can see they had a drop of 169,000 bpd in September. I think there will likely be an even larger drop in October. At any rate US production is finally starting to drop significantly.