US Tight Oil Scenario based on BNP Paribas Study

An interesting analysis was recently published by BNP Paribas (one of the top 10 banks in the World by assets) entitled Wells, Wires, and Wheels… . In that analysis they argue that long term oil prices will fall to $20/b or less in order for oil used for personal land transport to compete with EVs powered by wind and solar at current cost levels.
I reworked my oil price assumptions, first with a simple scenario that follows the EIA’s AEO 2018 reference oil price scenario up to $70/b in 2017$ and then remains at that level long term. Second I noticed that a scenario with such an oil price assumption sees tight oil output fall in 2022 so the scenario was revised with oil prices rising from 70 to 80 per barrel from 2022 to 2024 and then remaining at that level until 2028. The BNP Paribus analysis suggests that EVs will have cut significantly into oil demand by 2022 to 2025 so I assume oil prices fall to $20/b over the next 10 years.
Scenarios below.

chart/ Read More

EIA’s Electric Power Monthly – July 2019 Edition with data for May

A Guest Post by Islandboy

chart/

chart/

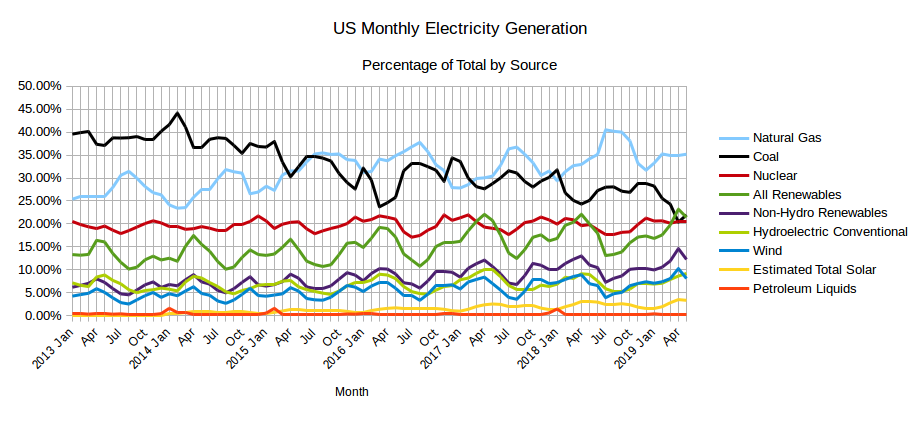
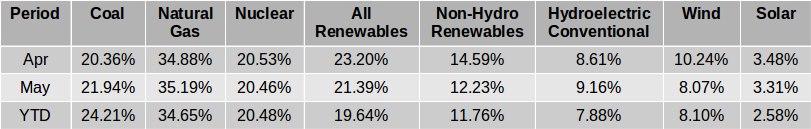
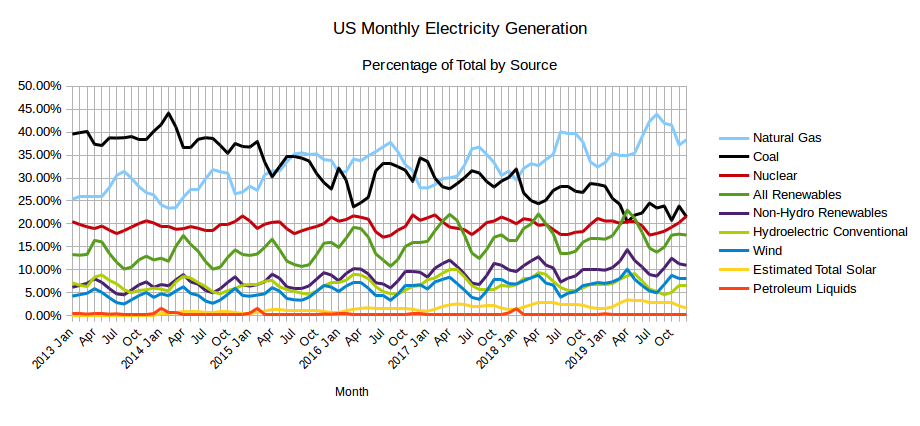
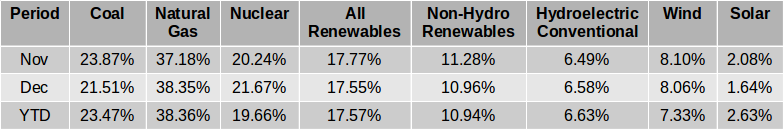
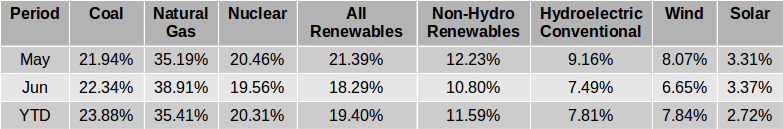
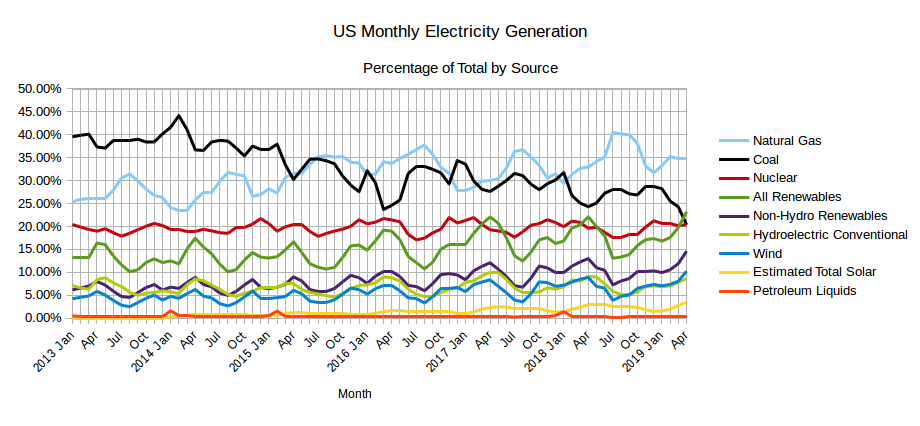
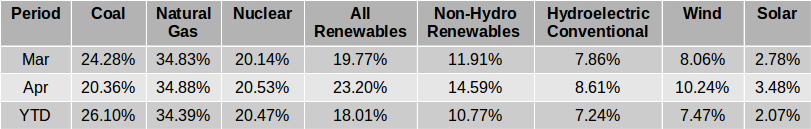
The EIA released the latest edition of their Electric Power Monthly on July 24th, with data for May 2019. The table above shows the percentage contribution of the main fuel sources to two decimal places for the last two months and the year 2019 to date. In April, the EIA in their Short-Term Energy Outlook projected that the contribution from All Renewables would exceed that from Coal for the first time ever in April and possibly in May. While that turned out to be the case in April, in May electricity generation from coal was slightly greater than the amount generated by All Renewables and the EIA expects Coal to generate more than All Renewables each month through to April 2019. Read More

EIA’s Electric Power Monthly – June 2019 Edition with data for April

A Guest Post by Islandboy

chart/

chart/

The EIA released the latest edition of their Electric Power Monthly on June 25th, with data for April 2019. The table above shows the percentage contribution of the main fuel sources to two decimal places for the last two months and the year 2019 to date. As was projected by the EIA in their Short-Term Energy Outlook in April (reported here), the contribution from All Renewables exceeded that from Coal for the first time ever. The EIA featured this news on their Today in Energy page on June 26th, the day after the data was published. Read More