Gulf of Mexico update

Through 2021 the federal waters of the northern Gulf of Mexico (OCS) have cumulative production of 23.4 Bbo and 193 Tcf.  The deepwater (water depths > 1000’ as defined by BOEM) has produced 10.2 Bbo and 23.5 Tcf while the shelf has produced 13.2 Bbo and 169.5 Tcf.  From a BOE standpoint, the GOM has primarily been a gas province, and the bulk of that production has come from shelf fields.  While the shelf has produced more cumulative oil than deepwater, over 90% of current oil production comes from deepwater fields. 

First production from the OCS occurred in 1947.  First deepwater production was in 1979 from Shell’s Cognac field in 1022’ of water.  GOM oil production in December 2021 was 1.69 mmbopd as per BSEE.  As Ovi says in his monthly updates, if GOM were a state, it would be the 2nd leading oil producing state in the US, only behind Texas.

Brief history of GOM gas production

GOM gas production peaked in 1997 at 14.4 bcf/day and has been declining ever since.  Current gas production is about 2 bcf/day. 

Figure 1 – GOM gas production, with shelf and deepwater broken out.  Data from BOEM.

Read More
GoM Summary Part V: Possible Futures

A Guest Post by George Kaplan

This analysis concerns C&C only. Natural gas production is low and steadily declining with few deep gas-condensate discoveries and the shallow dry gas fields at end of life. I don’t know if lack of gas may affect oil production – e.g. insufficient: flow to allow stable pipeline operation; income to be economic to warrant continuing maintenance; or fuel gas or lift gas supply to surface facilities. Any such issues could influence shutdown timing and hence the possible stranding of assets.  

Top Down Production Projections

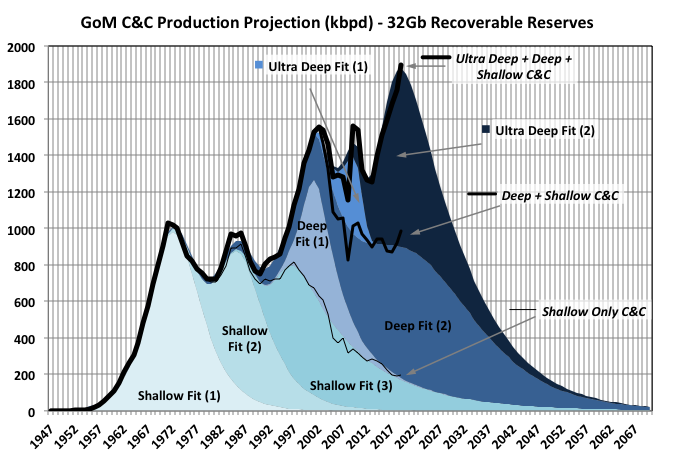
The chart above shows a Verhulst fit to GoM C&C production using seven curves, three describing shallow production and two each for deep and ultra-deep. A symmetric logistic curve is convenient for manual curve fitting as it allows a linear extrapolation to give the ultimate recovery, but most production curves are not symmetrical – usually the decline is less concave with a thicker tail, especially as the production volume and number of independent producing entities are reduced. With Excel, using least-squares optimisation fitting to any curve(s) is simple and has the benefit of allowing additional constraints to be imposed for sensitivity checks (e.g. total area, equivalent to the ultimate recovery, and position or height of peak), so more general Verhulst curves allow closer fitting.

Read More

GoM Summary Part IV: Company Details

A Guest Post by George Kaplan

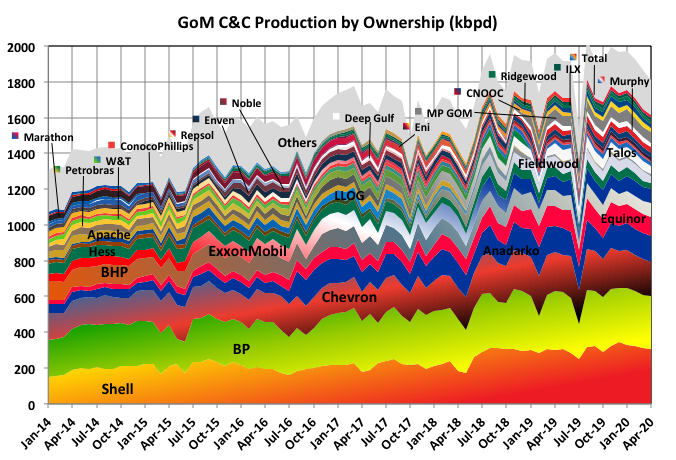
Production is dominated by major international companies particularly, and maybe surprisingly, European ones. Principally Shell and BP, but with Equinor, Eni, Total and Repsol also active and many are (or were) seemingly wanting to expand in the area. Maybe this is an example of reciprocal technology transfer: the North Sea was initially developed with a lot of American offshore know how and there it may now be the reverse is happening as deeper water fields using floating and subsea systems are developed.

Read More

US GoM 2019 Summary: Part II – Reserves

A Guest Post by George Kaplan

Introduction

BOEM produces an estimate of GoM reserves every year. This year’s covers estimates for then end of 2017. Nominally The figures given are 2P estimates but previous analysis has shown them to be extremely conservative, and they strictly follows SEC rules concerning reserves being bookable only if clear development plans are in place.

Backdated Reserves

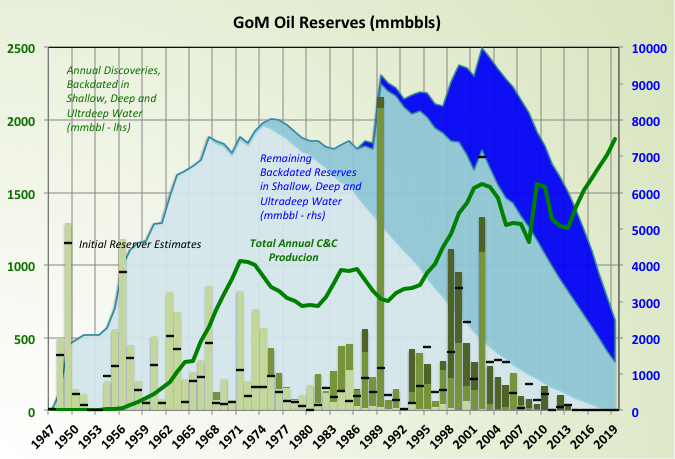
These charts show reserve additions from discoveries by depth (all backdated to the original discovery year so that all adjustments due to improved extraction methods and better understanding of the reservoir etc. are included in the shoen reserve estimate), production and remaining reserves also by water depth.

The black dashes against each discovery show the original estimates of reserves. The shallow water estimates were very low and had significant upgrades, deep water not so much, and ultra-deep hardly at all. The reason for this is mainly the date of the discoveries: nominally it should be easier to apply seismic and drilling analysis from shallow water but the ultra-deep finds were made later and therefore have had better technology and seismic available when the original estimates were made; more on this later.

That said I do not know what method BOEM uses to make the estimates, it cannot be the ultra high fidelity models that the E&P companies use as they do not have the computer power, human resources or time to cover every field in the GoM.

Read More

Is November 2019 the New US Peak Oil Date?

A post by Ovi at peakoilbarrel.

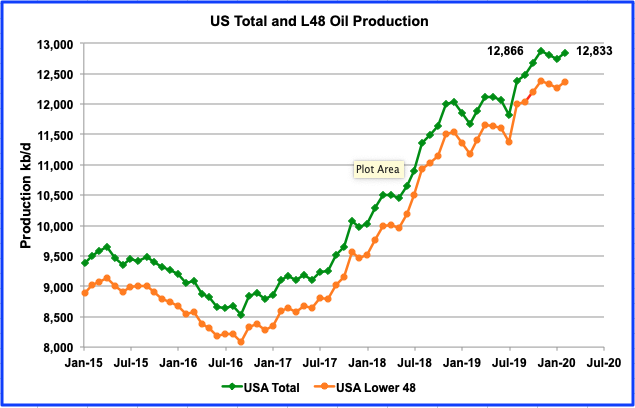
Here I am again reporting on out of date US February oil production from the EIA April report after the world oil environment has been turned on its head. Fortunately the EIA also has some forward looking reports that make use of more current data to provide projections for a few months out. Also the EIA has a guesstimate for weekly oil output which certainly provides an indication of the direction of production over the next month. Also there are reports on rig counts that indicate activity in oil basins and provide clues on where oil output is going. Down, Down, Down.

Read More