World Crude plus Condensate Decline Rate

There is concern that World C+C may decline steeply after the peak, I believe those concerns are over blown. There is always the possibility that there could be a severe recession due to high debt levels, high oil prices or potentially due to both problems in combination. War and environmental damage due to overpopulation are also potential problems which may lead to a crisis.

If none of these problems arises in the near term (say for the next ten years), and demand for oil is high enough to keep annual average oil prices above $75/b from 2018 to 2025, then the average annual decline rate of oil (C+C) output will remain under 2%.

For simplicity in the analysis that follows, I assume the peak in C+C output is 2015 and that output will decline at a relatively steady rate from 2015 to 2025. This in unlikely to be the case in practice and the actual path of future world output is unknown, the intention is to determine a likely trend line for World C+C output.  Using quarterly C+C output data from the EIA, I constructed the charts that follow.

Data is from the International Energy Statistics page at the EIA website.

The “Big 14” oil producers from 2002 to 2015 are (in order from largest to smallest): Russia, Saudi Arabia, United States, China, Iran, Mexico, Canada, UAE, Venezuela, Kuwait, Iraq, Nigeria, Norway, and Brazil. The Rest of the World (ROW) is all other oil producers besides the “Big 14”.
All charts below (except the natural log charts) are in kb/d.

declinepost/

Read More

Reverse Engineering the North Dakota Bakken Data

Notice: The data I thought would be out today: EIA Crude Oil Production by State will not be out until Thursday, Feb. 27th. However I will have another post coming out later today anyway.

This is a guest post by Ovi Colavincenzo

There is considerable discussion on this site regarding when the North Dakota portion of the Bakken will peak.  Having looked at the monthly Bakken data that the State publishes, it raised the question of whether it was possible to do a reverse analysis of the data and then use it to develop a model that would replicate the ND Bakken production, exactly.   The objective being to provide further insight on what is happening in the ND Bakken.

In order to do this, the following conditions and information were required:

  • A monotonically increasing number of new producing wells
  • A typical/average decline curve for the ND Bakken field
  • Not too many wells being shut/reworked each month

The last bullet is a preferred condition because if a number of low producing wells are shut and replaced by newer high producing wells, then the estimated flow rate of the new wells will be on the high side.

From 1999 to mid 2005, approximately 200 wells were in production in every month.  The addition of an increasing number of new wells began to occur in mid-2005, so start date for the analysis was set at the beginning of 2008 to address the first bullet point above.

AAA Ovi1

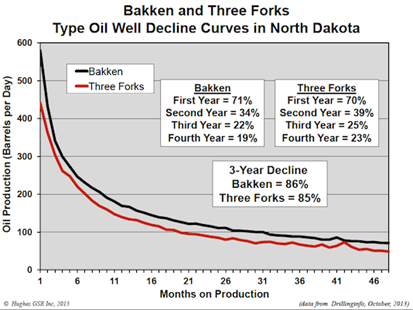
Figure 1: Source:  The Shale Revolution” by J.D. Hughes

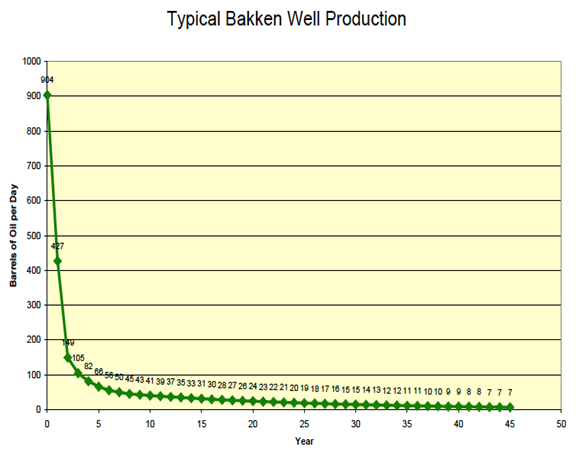
For the decline curves, two were used and are shown in Figures 1 and 2.  One came from “The Shale Revolution” by J.D. Hughes, November 19, 2013 shown in Figure 1.  The other came from North Dakota’s Directors cut, “Tribal Leader Summit” 09 05 12 (PDF), Figure 2.

AAA Ovi1

Figure 2: Source: North Dakota Director’s Cut “Tribal Leader Summit”

Read More