This is a guest post by Ciaran Nolan
Disclaimer
The opinions and views expressed in this presentation are solely those of the author and not necessarily those of any organisation.
Introduction
This presentation builds upon earlier work carried out by the author in May 2015 on the North Dakota (ND) Bakken / Three Forks Light Tight Oil (LTO) Play – ‘Bakken – the bubble has burst’*.
North Dakota Industrial Commission (NDIC) production data (up to November 2015) kindly supplied by Enno Peters. Data analysed in Excel and IHS Kingdom.
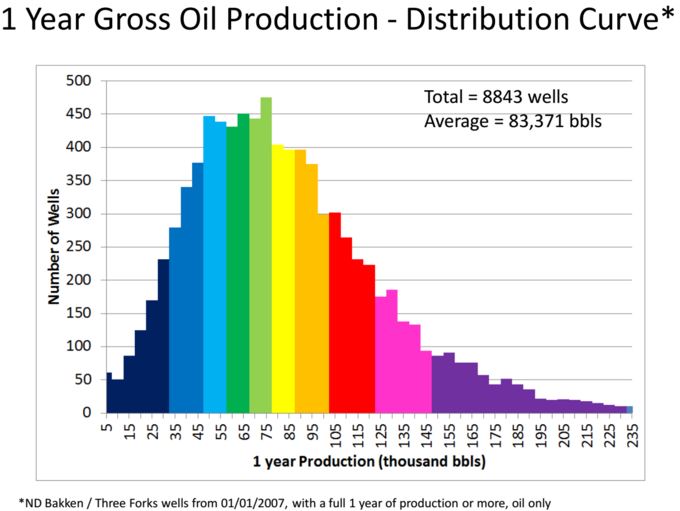
Production decline curves generated for P10 – P90 type wells, based on8843 wells with 1 year full production (January 2007 – October 2014).
Discounted cash flow (DCF) models were generated by the author for single wells in the ND Bakken / Three Forks Play.
Break even oil prices for Net Present Values with a 10% discount rate (NPV10) determined for P10 – P90 type wells. NPV10 break even oil price map generated. Historical NPV10 generated for average wells for 2008 – 2015. NPV10 breakeven oil price determined for top ten Bakken Producers in 2014, for 2014 wells.