Not much new data to report this past week but I did try to hammer out a few things of interest. The EIA released their Crude Oil Production report for the US and individual states with data through February 2014. I combined Montana and North Dakota to show their production.
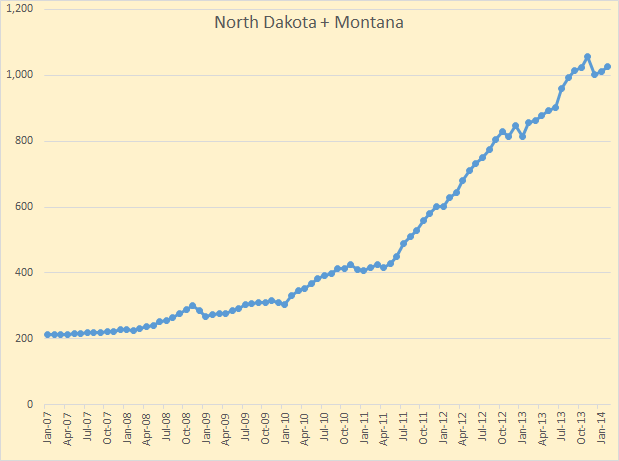 Their combined production was 1,027 kb/d. This is still below their production of 1,055 kb/d in November. This is more than just the Bakken as both Montana and North Dakota have production outside the Bakken.
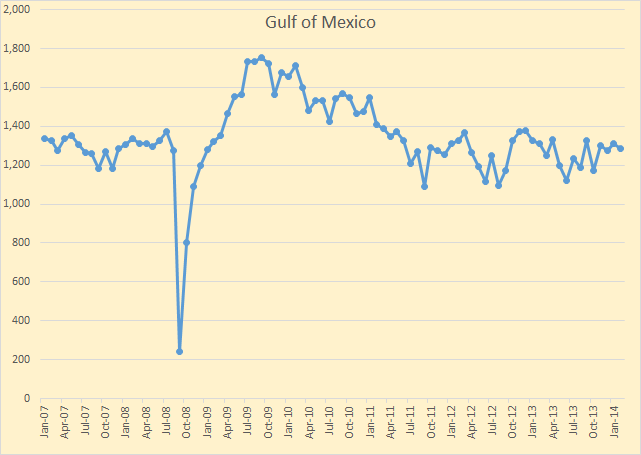 Part of the EIA’s plan for 9.6 mb/d of C+C by 2016 has The Gulf of Mexico going to 2 million bp/d by 2016. The GOM does not appear go be going anywhere however. There are new fields coming on line but they are just barely keeping up with those very high decline rates of the deep water fields. The Gulf of Mexico has her very own Red Queen.
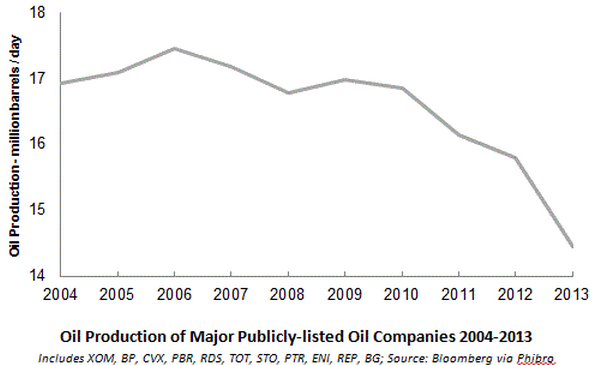
There is some news of late. Quarterly reports for the IOCs are beginning to trickle in, and they are dismal. For the world’s three largest IOCs profits were down primarily because production was down.
Exxon earnings slip on lower production, refining
Exxon’s oil production fell 2 percent to 2.1 million barrels per day from 2.2 million barrels per day. Natural gas production fell 9.1 percent.
Someone needs to check their math. A drop from 2.2 to 2.1 is a drop of 4.5%, not 2%.
BP 1QFY14 Profits Drop On Lower Production
The decline in revenues is largely attributable to an 8.5% YoY decline in production to 2.13 million barrels of oil equivalent a day (BOE/D), excluding production from Russia’s Rosneft.
Shell Profit Falls 45 Percent as Oil Production Drops
Oil production in the quarter fell 9 percent compared with last year’s first quarter, equivalent to an average of 3.24 million barrels a day.
IOC’s oil production from “The Barrel” guest post by Steve Kopits, link below.
Okay, now I want to talk a minute about two things that go together, so called “Proven Reserves” and “Reserves to Production Ratio”. R/P Ratio is basically how many years of reserves a country or oil company would have if they kept producing at the current level until, suddenly, they had no oil left. Of course it would not work that way as production would continue to decline along with reserves while R/P Ratio would remain relatively constant. Anyway BP has this chart:
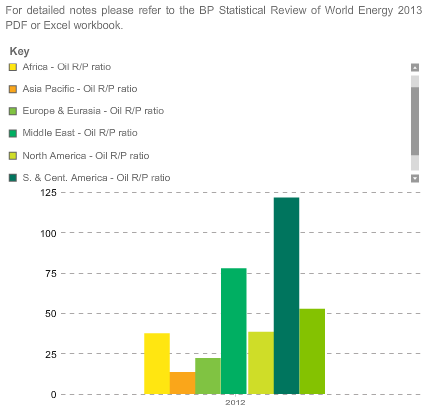
The last green column on the right is “World”, not in the legend but stands at 52.93. The other six are Africa – 37.7, Asia Pacific – 13.64, Europe & Eurasia – 22.36, Middle East – 78.06, North America – 38.68 and South & Central America – 121.91.
The S & C America R/P Ratio is so high because of Venezuela which claims 297.7 billion barrels of reserves. I did the math and this gives them a R/P Ratio of 248. That is, at current production they have 248 years of proven reserves left. Saudi Arabia, by comparison, only has 75 years of oil, at current production, left.
But just as the Orinoco bitumen distorts the S & C America R/P Ratio the Canadian Tar Sands distorts the North America R/P Ratio. The US on on January 1st 2013, increased her proven oil reserves by 4.5 billion barrels giving us a total of 33.4 billion barrels. So at 8 million barrels per day that gives the us a R/P Ratio of 11.4. That is if we could continue to produce at 8 million barrels per day we could continue production for 11.4 years.
But back to OPEC and their claimed proven reserves:
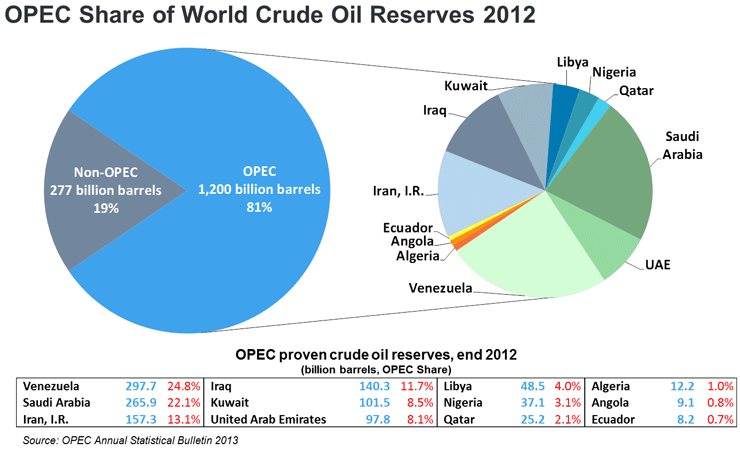 Now if you believe Non-OPEC nations are producing 59% of the world’s crude oil from 19% of the world’s proven reserves, then you should be working for either BP or the EIA. I don’t believe that and I dearly hope no one reading this blog is dumb enough to believe that.
The point I wish to make is the oil a country produces is directly related to the oil they have to produce. There has been, historically, one exception to this rule, Saudi Arabia. Saudi Arabia has, for many years, held old fields in mothballs. That is they were kept off line because of production problems. Manifa was extremely heavy and contaminated with vanadium and Khurais was remote in the desert with no reservoir pressure. But higher oil prices have made it economical to bring these old reservoirs on line. Now Saudi no longer has any mothballed giants.
Bottom line, the term “proven reserves” is political and totally meaningless. The amount of oil reserves any nation has depends on the price of oil. That is if the price is high enough a country, like the USA, can produce oil from areas that were originally though to expensive and too difficult to produce. If Oil were $25 a barrel the US would be producing about 4 million barrels per day. Every country is producing every barrel they possibly can produce at the current price of oil.
But the production vs. price incline is non linear. If the price of oil were to go to $150 a barrel then production would increase slightly. But if the price dropped to $60 a barrel then production would drop dramatically. And it is getting worse. One year ago Bernstein Research pegged the marginal Non-OPEC barrel of oil at $104.50, up 13% from 2012. Now you know why those IOCs listed up top are losing money. Steve Kopits addresses this point in a guest post on “The Barrel”, don’t miss it:
More Debate on the Future of International Oil Companies
One more bit of news. I believe Russia has peaked and will likely be down about 3% this year from their December 2013 peak.
Russian Oil Output Down for Fourth Month in a Row
Russian oil output, the world’s largest, slipped by 0.2 percent to 10.54 million barrels per day in April, declining for the fourth month in a row as production from new fields failed to offset a slowdown from mature deposits….
Oil output has declined every month this year, after touching a post-Soviet monthly high of 10.63 million bpd in December.
149 responses to “Proven Reserves, IOCs and Other News”
Ron, thanks for useful links. The decline of IOCs continues. European refining is in a particularly bad place. I’m surprised there’s not been more take over activity. Russia will be one to watch.
My recent offerings – a bit of a mixed bag.
Portugal – renewables to the rescue?
Coal and the IPCC
The Arguments For and Against Wind Power
Clive Best: Live UK grid monitor
This link is off topic to Ron’s post today but still relevant to the big picture this blog is all about.
http://www.leg.state.nv.us/Session/77th2013/Exhibits/Assembly/CL/ACL1265H.pdf
According to the author natural gas fired electricity will cost about double what it does now in Nevada in a couple of decades in constant money just because of projected increases in the price of gas.The projected price is that of the EIA.
I am a layman but I have been following this general subject religiously for a few years now and all old hands here will remember the prices that agencies such as the EIA were projecting for this decade turned out to be comically on the low side.
I think people who are focused on the cost of backup power capacity needed to make deep renewables penetration work are barking up the wrong tree in understanding the cost problem. Backup capacity in my opinion is going to be a lot cheaper than simply burning coal and gas continuously.
Society is going to find itself in the same boat as local farmers who used to just drive their eight mpg (older full sized 4×4 pickups on mountain roads) exclusively with maybe a big old Buick reserved exclusively for Sunday.
The cost of gasoline and diesel has forced them to invest in owning an additional vehicle such as a compact pickup truck or car just on the basis of fuel costs alone.
A wind and solar power industry is going to be an extra capital and maintenance expense and but in the end it absolutely will not require building more conventional capacity than would have been needed in the absence of such an industry.With no wind or solar the industry would still have to be able to meet peak demand. That necessarily means fossil fuel capacity enough to do so .
Why should anyone believe that doing so would require even more capacity than if there were no wind or solar power on the grid at all at any time?
In actual reality wind and solar production will never go all the way to zero if the grid is inter tied across a fairly large area north and south and east and west. There will always be a little wind and or solar production in than case.
Mac,
“The cost of gasoline and diesel has forced them to invest in owning an additional vehicle such as a compact pickup truck or car just on the basis of fuel costs alone.”
Happening Big Time in (Rural) area where I live. I have an old pickup truck that’s only used when a truck is needed and is only licensed six months per year. It also provides an emergency wheels. Wife keeps saying we should buy a compact for local trips which is a dumb idea: existing midsize car already fits the bill. Wife says she’s not dumb but I have the trump card on that one: why did you marry me then? But then I have to listen to: well yes but I thought you had money and you looked like you might make good breeding stock and I was a little drunk at the time and, and…… I think we’ll just get a compact for local trips.
Doug
Wise decision!
Yes…. It always pays to remember that Mother Nature designed us males to take care of the girls in exchange for breeding opportunities.
I have often heard male acquaintances remark that breeding opportunities are very closely correlated with their females getting what they want- which may range from a bouquet to a Mcmansion on any given day.
I forgot the smiley face on my 4/3/2:15 pm.
Mac,
Not necessary. Funny though, I did overhear my wife once saying that men are really only good for one thing. She denied it but then typically refused to elaborate: It’s kind of hard to argue with some people.
Doug
There are quite a few people who are dumb enough to believe that non-OPEC nations are producing 59% of the world’s crude oil with just 19% of the world’s proven reserves. The logic goes something like this: OPEC nations are deliberately holding back production or they are extraordinarily incompetent at extracting oil or wars/sanctions are holding back production. Only the last of these claims has any validity.
Out of the three, only the third explanation has some truth. Iran is held back by sanctions, Iraq is held back by war & Nigeria is held back by internal unrest. There are a couple of other explanations, however.
1. As Colin Campbell established some years ago, OPEC reserve figures are fiction. The price of oil tanked in the early 1980s and, in order to impose some discipline in the oil market, OPEC introduced production quotas. If you set up quotas, however, you have to decide on what basis the quota is being allocated. OPEC decided to allocate quotas on the basis of each member’s reserves – or, more precisely, each members’ reserves as a proportion to total OPEC reserves.
The next year, Kuwait massively re-estimated its reserves upwards. This gave it a higher quota. It should be noted that there was no discovery or extensive drilling program in Kuwait – just a higher reserve figure reported.
The year after that, most Gulf countries re-estimated their reserves upwards. This gave them higher quotas – and cut into Kuwait’s, since there not change to the global cap on OPEC production. The following year, the rest of OPEC followed suit. Colin Campbell believes that the figures each country used were the total amount of oil ever discovered in the country, but the key point here is that OPEC rendered its reserve figures useless when it gave its members an incentive to falsify them.
2. Venezuela has massive reserves of extra-heavy oil, but there is no way that they will ever be produced at a high rate. They’ll be the last substantial reserves of oil on Earth when OPEC is just a footnote in history books.
Re: Russian Net Oil Exports
Russia’s ECI Ratio (Ratio of production to consumption*) has been signaling problems ahead. Their ECI ratio fell from 3.66 in 2007 to 3.25 in 2012.
Based on the five year rate of decline in the ECI Ratio, their estimated post-2007 CNE (Cumulative Net Exports) would be:
2.6 Gb/year X 54 years (estimated number of years to zero net exports) X 0.5 (area under a triangle), less 2.6 Gb (net exports in 2007) = 68 Gb. They shipped about 13 Gb from 2008 to 2012 inclusive, suggesting that they shipped about one-fifth of estimated post-2007 CNE in only five years.
Note that when production shows sustained year over year declines in production, the decline in the ECI ratio will accelerate, unless they aggressively cut consumption.
For example, if Russian production fell at 2%/year from 2012 to 2022, and if their consumption increased at the same rate as 2007 to 2012, their production in 2022 would be down to 8. 5 mbpd (versus 10.4 in 2012) and consumption would be up to 4.5 mbpd (versus 3.2 in 2012), causing net exports to fall to 4.0 mbpd in 2022 (versus 7.2 in 2012). Their ECI ratio would be down to 1.88 in 2022, implying that estimated post-2007 CNE would be down to about 36 Gb.
*Production = total petroleum liquids + other liquids, consumption = total liquids, EIA
Jeff,
Obviously you know this but some of Ron’s readers won’t.
The super-giant Russian Samotlor field is being kept alive through massive spending. The field is 80% depleted with water-cut exceeding 90%: peak production was seven Mbbl/d. By the end of 1990s, the production rate dropped to 300,000 barrels per day but an aggressive program brought it up to 750,000 barrels per day: at huge cost (about US$1 billion per year being spent by BP). So, it is now expensive oil and depletion rates for remaining reserves are VERY high. “Creaming” in high gear! And, yet another super-giant on life support.
Doug
Not a big problem for Russia. Fewer people. No big Chinese-style ramp in consumption.
They can pass every barrel of reduction onto their enemies, at higher price to maintain revenue neutrality.
Certainly not the Chinese rate increase in consumption, but from 2007 to 2012 Russian consumption increased from 2.7 mbpd to 3.2 mbpd, a 3.4%/year rate of increase in consumption. Basically, rising Russian consumption has kept net exports flat to down since 2007.
And as I have occasionally observed, given an (inevitable) ongoing production decline, unless they cut their consumption at the same rate as the rate of decline in production, or at a faster rate, the resulting net export decline rate will exceed the production decline rate, and the net export decline rate will accelerate with time.
As noted above, if we assume a 2%/year rate of decline in production from 2012 to 2022 and a continued 3.4%/year rate of increase in consumption, their ECI ratio would be down to 1.88 in 2022, versus 3.66 in 2007. The revised estimate for post-2005 CNE would be as follows:
2.6 Gb/year X 30 years (estimated number of years to zero net exports) X 0.5, less 2.6 Gb = 36 Gb.
A rough, but consistent, rule of thumb suggests that they would have shipped half of the 36 Gb by the end of 2017.
Should read: “The revised estimate for post-2007 CNE would be as follows”
There’s a perspective issue. The phrasing
“unless they cut their consumption at the same rate as the rate of decline in production, or at a faster rate, the resulting net export decline rate will exceed the production decline rate”
These guys are playing for keeps. They want to win. They are motivated by self interest, as is everyone, though our media will pretend otherwise — where the other guy is always seeking something unfair. These guys may be pleased with a reduction in exports.
Russia has no reason to want to maintain export total, if they can get a price rise. In fact, if they decide money isn’t very valuable to them, and seek instead food or free labor, they won’t even care about price.
They are playing for keeps. They want to influence the policies of their enemies errr customers. They can insist on defense spending cuts or cuts in alternative energy research or they will reduce exports further.
There is no reason for them to cooperate in a system that leaves them subordinate.
Given declining net oil exports, the problem that arises is when generally rising oil price no longer offset the decline in net exports.
This is an interesting presentation on Russia, dated September 2013
http://www.platts.com/IM.Platts.Content/ProductsServices/ConferenceandEvents/2013/pc001/presentations/Johannes_Benigni.pdf
If the oildrum had continued this would have been picked up earlier
Thanks for the link Matt, I had not seen this earlier. They show Russian production basically flat to 2020. With their old giants, which have previously supplied over 60% of their production, in steep decline I don’t really see how that is possible.
From Forbes about a year and one half ago:
Is Russia Ready For Life After Oil?
A significant fall of Russian oil production is inevitable. The degree of the decline will depend on the actions the government takes in its fiscal policy and the investment climate in general.
I know I saw quotes from Putin within the last year or two where he asserted (what his staff no doubt told him) that Russian output can be flat at 10+ mbpd for 6 years to 2020 PROVIDED there was about $25 billion in investment.
Simply that. The in-field wells have to be drilled. If they are at a $25B rate, they will hold output north of 10.
That’s a very strong geopolitical reality. By 2020 a lot of things should be enroute to destruction. A lot of desperation will exist, willing to agree to their terms.
Went thru that in pretty careful detail.
One always wants to think that those in govt are well informed and making wise decisions, but I have pretty high confidence those in gov’t (including the Fed) go out and get briefings from the top consultants in the subject matter — who became top consultants by telling people what they want to hear.
So I would bet the administration is oblivious to the reality of those graphs showing how much Russian oil is destined for China and the fact that this leaves less and less for Europe. It has not dawned on them that there may not be alternate supply. It also hasn’t dawned on them that Russia doesn’t absolutely have to care about dollars.
I’d bet they think in terms of the Russian billionaires not permitting Putin to render their wealth unimportant. I’d also bet that they understand Russian billionaires much less deeply than does Putin. He’ll kill anyone dangerous. And he should. He’s a patriot.
Hi Doug,
It is true that it is on life support, but most of the decline/depletion has occurred already(that is when it dropped from 7000 kb/d to 300 kb/d), it certainly was a supergiant field which had been mostly depleted by the end of the 90s. This may also be true of many of the OPEC giants (though we don’t have very good data on those), and is certainly true of most of the large US Oil fields.
I checked “Twilight in the Desert” (p. 375) and the 116 largest fields produced 32.4 MMb/d in 2000 which was 47% of total C+C output that year. If these fields have declined by 4% per year on average since 2000 the output would be 19 MMb/d in 2013. They are still very important but today their contribution may be about 25% of total C+C.
sevenMbbl/d ?
I’m familiar with M as 1000 and MM as 1 000 000, but I’m not sure what the above is. Help?
Synapsid, MM in this case stands for 1,000,000 so MMb/d would be “million barrels per day”. I know it is confusing. I often use k for kilo or 1000 instead of M, the Roman numeral for 1000. Others don’t. But the same folks that use M for 1000 use G for giga meaning one billion. So….. there is no constancy there. They use Roman numerals for thousand but abandon it when the numbers get higher than the Romans could count.
But to the Romans MM meant two thousand, not one thousand thousand. I think we should all go on the Metric system:
K for Kilo or one thousand
M for Mega or one million
G for Giga or one billion
T for Tera or one trillion
Now wouldn’t that be a lot simpler than trying to mix Roman numerals with Metric symbols, and using Roman numerals in a totally different way than the Romans used them?
Synapsid,
Oil companies that are listed on American stock exchanges typically report production in terms of volume and use the units of bbl, Mbbl (one thousand barrels), or MMbbl (one million barrels): Confusing since an oil barrel (bbl) is a unit of volume whose definition has not been standardized. In the US and Canada, an oil barrel is defined as 42 US gallons, which is about 159 liters or 35 imperial gallons. It can also be defined in those units, depending on the context. Good eye, sorry for my typo — 7 MMbbl/d is correct
Doug
Synapsid,
Samotlor field, at its peak in 1980, was actually producing 7.4 million barrels of oil a day (7.4 MMbbl/d). And, 1980 was when the Soviet Union was producing about 12.5 MMbbl/d, so 7.4 million of that 12 million were coming from this one field. Pretty amazing, eh. Truly a dying giant!
Doug
Doug, Ron,
Thanks; got it. Well, for the next few minutes at least. “I’m not losing my memory; I’m living in the Now.”
Doug,
I thought Ghawar was the largest oil field at 5MMbbl/d. I had no idea Samotlor was that large.
Steve
Steve,
Yes indeed, thousands of derricks as far as the eye can see.
Doug
PS: Maybe you should have a talk with FunnelFan down below. If you don’t I’m sure Patrick will.
Doug,
Don’t them Ruskies got all that “abiotic oil” over there, where we can turn loose some of that FunnelFan capitalism??
Steve
Steve,
No time to chase Abiogenic petroleum; too busy figuring out how to change mercury into gold. I’ve almost got it, been using ripe lemons as a catalyst but think you need em green.
Doug,
Kind of reminds me of what Matt Simmons said about producing tar sands. He ssid they take excellent quality natural gas and make crap oil.
He concluded by saying, “its like turning gold into lead.”
I sure miss Matt.
Steve
Re Kopits article on IOCs
As a result of cost pressures IOCs are closing and/or selling their refineries e.g. in Australia
9/4/2014
Why the closure of BP’s Brisbane Bulwer refinery reduces Australia’s energy security
http://crudeoilpeak.info/why-the-closure-of-bps-brisbane-bulwer-refinery-reduces-australias-energy-security
23/2/2014
Geelong refinery sold as Shell’s oil production continues to decline
http://crudeoilpeak.info/geelong-refinery-sold-as-shells-oil-production-continues-to-decline
28/8/2013
Chevron’s oil production, sales decline by 5%
http://crudeoilpeak.info/chevrons-oil-production-sales-decline-5
However, governments will repeat what the oil industry is saying: that growing demand can be met from fuel imports
Some import issues here:
http://www.bloomberg.com/news/2014-05-02/how-canada-s-flirtation-with-a-china-oil-market-soured.html
Re. Shell, what I understood was that there was a major writedown in refinaries of about 2 billion, but they raised profitibility somewhat. Stocks were actually up a little. But that won’t last ofcourse, I wonder how long they can keep on selling everything and their grandmas.
T Boone Pickens, on a Milken Forum a few days ago, (http://www.milkeninstitute.org/events/gcprogram.taf?function=detail&EvID=4657&eventid=GC14) estimated America’s Natural Gas Resources at 4000 trillion cubic feet of Nat Gas. He additionally states that with additional technology the percentage of recoverable gas will increase. His view is that we have unlimited Natural Gas for the next 100 years. This view seems contradictory to the general view of energy resources on this site. Admittedly he is talking about Nat Gas, and we all drive on oil and not Natural Gas, but from his perspective, we have huge natural resources yet to recover. This view is completely contradictory to the analysis of Arthur Berman: Oil Guru Destroys All Of The Hype About America’s Energy Boom see ( http://www.businessinsider.com/arthur-berman-shale-is-magical-thinking-2013-1?op=1. ) Are we just dealing with the age old problem of two very divergent opinions?
Peak Renewables?
Renewable Energy in Decline, Less than 1% of Global Energy
The global energy outlook has changed radically in just six years. President Obama was elected in 2008 by voters who believed we were running out of oil and gas, that climate change needed to be halted, and that renewables were the energy source of the near future.
But an unexpected transformation of energy markets and politics may instead make 2014 the year of peak renewables.
The word has gone out, the peak oil scare is over so cancel all those calls for renewable energy.
Solar and wind are just not efficient or reliable. They are novel forms of energy whose math is never going to work. Plus they have a lot of technological problems that cannot be overcome. Solar panels and wind blades wear out, murder birds and what if a golf ball size hail stone hits one ? Basically nobody can afford them because they are so expensive, they have advanced in tech about as far as they can go and efforts should be spent on other better ideas.
LOL. My first comment comes after I spew coffee. Thank you funnelfan. I needed that.
FunnelFan,
Did you forget to insert a little round yellow smiling face? If not, perhaps you should read Karen’s contribution below. Were you abused with a windmill as a child, or a solar panel — or both. Give us a break here man.
Doug
Care to enlighten us on those better ideas?
Yesterday in California renewables made up 14% of the electricity supply. Around noon renewables supplied 21% of electricity demand. Renewables made up a larger percentage of California’s electricity supply yesterday than large hydro or nuclear. It was a sunny day, but kind of mediocre wind-wise.
In CA, large hydro (installations >30MW) contribute about 11% of total annual electrical energy generation. For reasons unknown, only “small” hydro counts as “renewable”. If you ignore the arbitrary definitions and add 11% large hydro to the 14% noon nominally-renewable contribution, total renewables can deliver – right now – 25% of CA energy. Tough to say if we’re actually getting all that large hydro right now, though, with the current drought. Stream flows and reservoir levels are near historic seasonal lows.
Yes, due to the drought large hydro is dropping as an electricity source in California, though not as fast as renewables are rising. On a windy day in March, I documented that renewables made up nearly 38% of electricity generation (for ten minutes) and 25% for that entire day.
http://karenlynnallen.blogspot.com/2014/03/california-renewables-377.html
There were a couple windy, sunny days in April where renewables went over 40%. There is more solar PV schedule to go on line in May. If we get a windy day in June, we may see 50% renewables at times.
Hi Karen,
I am extremely interested in learning how the pv and wind power on the California grid impacts the use of natural gas. I am presuming that when the water is available there is a substantial amount of load balancing put on the shoulders of the large hydro operators but with a drought situation that seems unlikely for now.
What I specifically would like to know is this.
Maybe you can tell me!!
IF you get a megawatt hours worth of output from wind and solar how much gas does that save on average? If there was no need to maintain some amount of extra hot spinning reserve the answer would be obvious – California would save enough gas to generate a megawatt hour.
I see people throwing around comments on anti renewable sites that wind and solar don’t save any gas at all which is utterly ridiculous in my opinion.
Some renewables advocates are insisting weather reports are so accurate a few hours ahead and the management of generating plants such a finely tuned art nowadays that the saving is gas is virtually the entire potential amount.
The truth must lie between these extremes of course. My personal guess is that the savings in gas is at least eighty percent on average and better in a place such as California which has more stable weather in terms of sunshine than most localities.I will hazard a guess the wind resource may be more stable than in most other places too because the state is so large and the wind farms thus widely separated.
Any hard data from any body generated from the numbers published by a utility or utility watchdog will be greatly appreciated.
Thanks in advance for all replies as usual.
Hi Old Farmer Mac,
As far as I can tell the California ISO has not officially answered this question in terms of exact percentages. From the info on their website, it looks to me like they are trying to figure this all out on the fly as renewables ramp up. But looking at their graphs (I’ve included one from yesterday, a pretty great–windy–day for renewables–25% more production than May 1st), they very clearly are ramping up and down their thermal electricity production (pretty much entirely natural gas) each day depending on demand and depending on renewable production. They also appear to ramp large hydro up and down, but to a lesser extent. Nuclear stays flat all day, and imports don’t seem to vary much either. (My guess is they have stipulated contracts on imports at present. They may be able to draw on them in a more variable way if they negotiate differently in the future.)
If you go to the California ISO website, you’ll see they have a day ahead demand forecast and an hour ahead demand forecast graphed against actual demand. From my perusal, the day ahead is about 95% accurate; the hour ahead is 98–99%. And then in their explanation of their graphs they directly say that they have many power generators offline that they can call on. Some may need six hours advance warning, some only ten minutes. From their graphs, it looks to me like they try to have at least 10,000 megawatts of energy production greater than their expected demand off-line but able to brought on-line within an hour. (They mention peaker generation, fast start.) Do they probably keep a little excess running to deal with 10 minute ahead variability? Likely yes, (though they don’t say so) but I really think we’re talking just 1 or 2%. There is a steady state of renewable production of about 1700 megawatts from geothermal, small hydro, biogas, and biomass that doesn’t fluctuate much at all.
http://www.caiso.com/Pages/TodaysOutlook.aspx
As kind of a bizarre hobby, I periodically check out electricity production in Denmark and Germany. This site for Denmark is particularly fun with little spinning windmills:
http://energinet.dk/Flash/Forside/UK/index.html
If you watch this over several days, you’ll see that sometimes their windmills are going like bonkers and they are exporting electricity to Norway, Sweden and Germany. Other days they are importing from all three. Some days they are importing from Norway and exporting to Germany, which leads me to believe they are just acting as a conduit for electricity from Norway to Germany.
On the following website there are some nifty graphs that show German electricity production and how on good days, renewables cut substantially into German coal use.
http://www.ise.fraunhofer.de/en/renewable-energy-data/electricity-production-data
(go down about halfway where it says electricity production from solar and wind in Germany and click on the pdf for production for 2014.) They have monthly, weekly and daily data. These graphs even show when they import and export electricity from other countries during the course of a day. Anyway, in Germany, renewables clearly replace coal use, although sometimes they choose to export rather than reduce coal use. They definitely to appear to use imports to help them deal with peak loads. Having Norway as a neighbor with lots of hydroelectricity that can be called on demand is probably a very useful thing.
The word “renewable” always seems silly to me.
Panels have a life expectancy of what? Couple of years before a tree branch slams into one? Gamma particle assymptotic decay of junction total will erode output too. Then you’re paying diesel for a truck to ship a new one. So . . . it’s all just diesel dependent after all.
Ditto hydro plants. How long do bearings that spin 24/7 last before you are paying for diesel to ship in another. And btw, aren’t they lubricated?
The quality of bearings used in electrical generating plants is such that they last more or less indefinitely.And yes they are lubricated but there is no net loss of lubricant because such bearings are generally ”sealed” and maintenance free except for periodic inspections.
You ought to put smiley faces on such comments.
Sarcasm is all to apt to be taken literally.
But you do have a point. It has not yet been definitively established that a true high tech renewables based economy is possible to the best of my knowledge although I do believe such an economy is a possibility.
At any rate we aren’t about to run entirely out of coal or oil or gas anytime soon. There will be more than plenty to meet the needs of the renewables industries for as far out as the eye can see – assuming of course we can divert the use of it away from beer and potato chip delivery trucks and hot rod personal cars and flying road warriors around to more useful purposes.
Mac
Could you run your eye over this presentation I was luck enough to catch last year. It seemed to lay the basis for some thinking.
best
Phil H
Michael Dale
Global Energy Systems 2013
June 28th, 2013, Edinburgh
Dale deals in ‘energy currency’ not in dollars, except that energy systems with lower energy costs will cost less money.
From his presentation: http://globalenergysystemsconference.com/wp-content/uploads/presentations/GES2013_day3_session2_Michael_Dale.pdf
The PV industry is now likely (>50%) to be producing a net energy surplus.
•Currently consumes around 90% of its own output.
•In worst case scenario, the PV industry is in energy deficit until 2015.
•The industry will ‘pay back’ energy debt before 2020.
Different PV technologies have different payback times on energy invested (see presentation for details).
If energy ‘storage’ is charged to PV as an energy cost, it pushes some PV into deficit.
Hi Phil,
I have looked at it and I think it is an honest and reasonably accurate summation of the facts as they stand now.
But it is still not clear to me whether we can have a totally renewable energy system as a practical matter. In theory we can – I agree about that.
But the question as I see it is whether we can get the renewables industries built up to a sufficient size to shoulder the entire energy load before we run out of time or fossil fuels or capital or whatever.
Many sorts of systems can exist in stable configurations once established but reaching such a configuration may turn out to be impossible in the case of renewable energy.
WILL WE have enough solar and wind and geothermal or whatever to maintain an advanced technological civilization IN PLACE at the time we start running really and truly short of fossil fuels?
Will we fry first or die first in wars fought over the dregs of fossil fuels and other minerals and farmland?
I have an uneducated (formally speaking) friend who is a brilliant self taught engineer- this guy has built many machines that work very well without any drawings or even have ever seen an example of what he has built.
I have watched in amazement as he disassembled and overhauled a truck transmission with hundreds of parts all put together like a clock without having a manual or a notebook or any reference materials.
This in my estimation is like playing chess on the grand master level-you must have an incredible memory to hold all that data in your head and execute so many moves without making mistakes.
So we were discussing the subject of oil depletion one day a few years back and he said of course it would eventually get so expensive we couldn’t use it for fuel any more except for critical uses. He is an old farm boy and nobody has to explain to him that things that come out of holes in the ground eventually must run out.
After a minute or two of thinking about wind and solar and other renewables he said something to this effect.
” It’s like going up a long grade in a truck with a load on it in high gear. Once you have it up to speed you can keep on going so long as you don’t have to stop. BUT if you ever have to stop you ain’t got any first second third fourth gear and so you can’t get started again.”
Fossil fuels are our first, second, third, and fourth gears in the truck transmission of the economy. If they last long enough to get renewables up to scale and to up to speed renewables can shoulder the load.
But if the renewables economy ever crashes really really hard it would probably not be possible to ever get her up and running again.
People who have driven stick shift cars with small engines will understand this analogy. Some people who have driven cars with very large engines may believe it is possible to get started in high gear- and sometimes you can in a car with grossly oversized engine. Doing so in a real truck ( a big one ) with a load on it is utterly impossible.
Will we get the renewables industries up to scale ? CAN we get them up to the scale necessary ?
I don’t know.
And I don’t think any one else does either – not for sure anyway.
I think it is possible.Technically at least.
BUT—-Given the way the human race thinks and behaves….. it may well not happen because we probably won’t keep the pedal to the metal and make it happen.
I think lots of us will fry or starve and a good many others will die in resource wars and then we will have an early industrial revolution economy based on water power and coal for a good while— assuming there are enough people left after the wars are over.
After that- who can even guess??
Hi Mac
Much appreciated.
Dale & Co calculate wind to have quicker payback of accumulated embodied energy when looked at as a very rapidly growing industry. PV rapid growth at national/world level is a form of net energy consumption for more years than is wind.
But, some folks in some countries have enough spare cash to put PV on their roofs, given subsidy incentive: a form of consumer-choice? If looked at nationally this is a bit like cloud-funding a start-up. The consumer public still does its gross consuming (including PV), just a little differently, but the nation ends up with a legacy structure and net energy (eventually) for next 30+ years?
Wind has to start as bigger units and cannot count as consumer-led consumption. That is consumers in this case do not spend less on their other choices, as they might if they chose to put PV on the house roof. OK governments might perhaps treat wind like big Hydro or, as in some countries, District Heating for housing, or other subsidised strategic investment?
Personally, at best, I see solar / wind electricity and local solar hot water as a useful legacy structure standing among future economic woes, not a part of a perpetual growth machine.
BTW I like very much your friend’s qualifications! A kind of Mozart of the machine shop?
best
Phil
BTW I just looked up hydroelectric bearing maintenance.
Yup, sealed. The lubricant inside stays inside — more as an antipollution measure for the river than anything else.
But such maintenance companies do exist. Many of them. The bearings do not last indefinitely. There is talk of burnouts and replacement.
All machinery fails eventually of course but within the context of generating plants the bearings usually are built well enough that most of the ones installed in the machinery when the plant is new will still be in service when the plant is decommissioned.
In that context indefinitely is an appropriate term.
You expect the brakes and tire on a car to wear out but not the door locks or door hinges or radiator so we speak of these parts as lasting indefinitely or the life of the car.
But locks and hinges and radiators – and bearings of all sorts do most definitely fail on occasion.
In the case of very expensive heavy machinery it is much cheaper to put in super high quality bearings than to risk the troubles associated with bearing failure which include extensive down time and the need to replace other parts that may cost hundreds or even thousands of of times as much as the bearings themselves.
Bridges are overbuilt for the same reasons. The cost of a failure is many many times the cost of overbuilding in the first place.
I am not an engineer but I have spent many hours in the company of engineers and listened very closely to what they had to say about such matters.
Solar panels are typically guaranteed for 25 years, may last for 40 years. They are designed to take a hit from golf-ball size hail without breaking.
I have 12 KW of solar on my roof, 76 panels, the oldest panels 10 years old and still going strong. I’ve never had one break.
Enough of the untrue right-wing propaganda! Did you notice that that report is from the Heartland Institute, funded by the Koch brothers and Carbon Inc.
Think of it this way: Suppose that I offer you:
* a safe investment
* that pays 8%
* tax-free
* inflation protected
* and hedges your energy cost for the rest of your life.
Wall Street would kill for such an investment; but it is available to you just by putting solar panels on your roof.
I think I vaguely remember reading someplace that large hydro is excluded from the renewable stats in California for political reasons having to do with the renewables mandates.If the large hydro had been counted as renewable it would have required changing all the numbers around back when the goals were being set and that was not considered desirable in terms of getting the legislation passed. This may or may not be true but having observed politics for a long time it would not surprise me at all if it is true.
Does this include small rooftop generation?
No, my understanding is that it does not include behind-the-meter rooftop PV or solar hot water. Those two would generally show up in the data as reduced demand. Before last year, rooftop PV was the lion’s share of PV in California. Last year an absolutely enormous amount of utility scale solar PV (and some solar thermal) was added and that is really showing up now in the ISO grid.
Late to this conversation but the following is worth adding to the discussion…
California Solar Generation Offsets Hydro Shortage
Energy Evidence, Thursday, May 1, 2014
Ron wrote: “But the production vs. price incline is non linear. If the price of oil were to go to $150 a barrel then production would increase slightly. But if the price dropped to $60 a barrel then production would drop dramatically. And it is getting worse.”
That’s why I keep wondering if the next phase of the energy predicament is a recession that reduces oil price, dramatically reducing current and (particularly) future supply. It seems we are not far from a slippery edge, past which things may unravel quickly with few options if any to thereafter kick-start growth. And once past a that threshold, growth will no longer be the mantra, replaced instead by desperate attempts to put the brakes on contraction.
I keep worrying about a possible Black Swan event. Like a Chinese economic collapse. Their economy is being driven by construction of apartments that no one will ever live in, office space that no company will ever occupy, malls with no stores and entire cities where no one lives. And all this is being built with borrowed money. And the Chinese economy can continue to grow as long as they keep building.
What happens when they finally figure out that this kind of thing cannot continue? What will happen then? I haven’t a clue but I know it will not be pretty. But what effect will this have on the rest of the world? Oil demand will drop, oil prices may drop.
And what will happen to WalMart? Will their main manufacturer and supplier keep the cheap good flowing? Or, will the Walton family, with more wealth than the bottom 40% of all Americans combined, have to go on welfare?
Not bad. This is the danger to the scenario of buying stock in Suncor and forgetting about it. A global slam will take Suncor down along with everything else.
The Walmart situation is uglier. Walmart generates revenue from the poor. The poor are getting worse off every day. Walmart revs show it.
Walmart employees make minimum wage, or very near it.
Leaked document shows what Walmart really pays its workers
The document [PDF], first obtained by the Huffington Post, shows that Walmart workers can earn a base pay as low as $8.00, and earn wage increases in increments as low as 20 or 40 cents. ”As a result, a ‘solid performer’ who starts at Walmart as a cart pusher making $8 an hour and receives one promotion, about the average rate, can expect to make $10.60 after working at the company for 6 years.”
Walmart is the largest private employer in the world employing 2.2 million people. What is happening to Walmart employees is happening to all the middle class, they are getting poorer and poorer as inflation grows much faster than their income. The income of the upper 1% just keeps growing and growing and growing and…..
WalMart thrives of Gov’t welfare programs. The Majority of WalMart customers get thier money from the Gov’t (SNAP, Wealthfare, Social Security, Sectiion-8 housing, etc). I believe most of Wal-mart’s workers are relying on gov’t assistance to meet ends so they get (minimum wage + Gov’t wealthfare assistance).
The rising wages of the 1% is also related to the gov’t as the gov’t awards no bid contracts on Gov’t spending (ie JPM and the EBT cards) and gov’t regulation (ie Big Agra Lobby Gov’t for subsidizes and implement regulation to force the smaller farmers out of business). I believe Wal-Mart is the biggest receiver of money from Gov’t wealthfare programs.
Consider that the small business and the poor have a huge economic advantage as they can afford to work for less, have much lower overhead and are much more flexible to adapt to a changing economy. Big business are loaded down with layers of bureaucracy and have a lot of overhead (ie large corporate office, large liabilities, etc). To turn the tables, big Business lobbies the gov’t to implement laws and regulation to make it difficult for small businesses to complete with them.
The other reason withe the top 1% has rising incomes is because of off-shoring as businesses move production to Asia which have lower costs, fewer regulations.
Somewhat true. The bulk of Walmart food sales each month takesplace in the first hour of the month.
There is a line of people at midnight on the last day of the month. Their SNAP card gets recharged and they can buy food.
The non food stamp countries are going to have a LOT of upheaval as oil gets scarce. Optimally, they get scoped rifles and begin to target anyone in a business suit from a mile away.
Constructive nihilism, I guess.
I don’t want to get into a discussion of Walmart pay and benefit policies but I would like to know what is meant by the term ” middle class ” these days.
It seems to me that such terms as middle class, working class, well to do, and rich have no serious definitions any more. They are words now used the way HUMPTY DUMPTY used words. HD didn’t care what words meant to other people. He defined them to suit himself.
It constantly amuses me to see how such terms are used interchangeably depending on the agenda of the speaker. I have recently pointed out that a friend who A is a teacher married to a teacher loves to talk about how the well to do don’t pay their fair share.
According to him teachers are hard up. But he and his wife earn over a hundred grand living in rural central Virginia and they only work 210 days a year.I will go or record that his wife puts in a considerable amount of time outside the 8 am to 3: 20 pm she is supposed to be on campus but he has computerized all his lessons and paperwork and gets it all done with time to spare before leaving at 3:20.
Other people I know consider clerking in a store working class and only professional work such as medicine or engineering middle class. To be rich by their standards you need ten million these days minimum due to inflation. Other people yet consider a person to be middle class if they earn good money – say over sixty thousand which is possible for a plumber or electrician working by the hour.
Now I will say this about Walmart. The company could pay better- much better. BUT if it did it would not exist as the market dominating company it is.
I know many people who work for the company. The ones with brains are not stuck there too awfully long in the majority of cases.
The ones who are permanently stuck have in my experience mostly reached what is referred to in a delightful little book ( The Peter Principle ) as their personal level of incompetence.
Basically a person has reached this level when he has been hired to do a job (or promoted) at or about at the limits of his abilities and ambitions. He does it just well enough to keep it- to not get fired or laid off specifically to get rid of him personally- but messes up often enough that there is no hope of promotion.
I have friends who have pensions and stock portfolios and so forth who are very liberal and LOVE to HATE Walmart.
It is not wise to point out to them that in more cases than not they are profiteering on Walmart stock because one or another fund they own has a good sized chunk of -gasp! – Walmart stock.
On a serious note I do not have any real idea what can be done about low wages given current physical and political realities.
A lot of people are being paid way more than they are worth in relation to the job market for the work they are doing.This is why the phrase ”going postal” is well understood.
There are hundreds of time as many people working for Walmart but I have yet to hear about one of them getting so stressed he shot his coworkers although I am sure it happens.
He or she just quits whereas the postal clerk is getting three times what he is worth to his next likely employer and simply will not quit because of the money.
People who get stressed bad enough in the military can’t quit because of going to jail for desertion of course so they occasionally go nuts too due to lack of the option of quitting.
A lot of people are being paid a lot less than they are worth too due to lack of opportunity to move to a better job since good jobs are scarce.
https://www.google.com/search?q=ghost+cities+in+china&tbm=isch&tbo=u&source=univ&sa=X&ei=hUVkU7LCBcyXyATd3YCYBA&sqi=2&ved=0CC8Q7Ak&biw=960&bih=453
That’s a link to Google images of ghost cities in China. The situation in China is difficult to gauge, but it would seem something needs to give and look out when it does.
The Walton’s will be fine until the disenfranchised reach a point of abject desperation and collude via the internet to do whatever people do when they have had enough. Short of upheavel the periphery will continue to be sacrificed to save the core. The core of course being the Walton’s and other wealthy elite, top politicians, corporations.
My personal opinion is that the Chinese econmic collapse is more likely to happen after rather than before peak oil.
For what it’s worth it could be that we’re all just a little too binary about China; no views permissible except:
A They’re taking over the world; we’re doomed!
B They’re doomed; will drag us down!
I am old enough to remember the panic about the rise of Japan and Germany late last century; it seems us anglophones are more than a little prone to panicky responses to the economic successes of other cultures.
Given that 80% of China’s primary energy is used to generate electricity and their adjustment to the driving dependant societal model is recent and not nearly as deep set it strikes me that perhaps China is in fact better placed to deal with a world of scarcer and therefore more expensive oil than the west. Add that they have an electric rail based internal travel network [brand new high speed] and many also modern and efficient intra city Transit networks. And seem to be ending or at least slowing down their massive [and therefore energy intensive] infrastructure buildout phase, I expect they may just get back on their bikes and get off the high sugar rush of selling junk to us.
They have to address their massive pollution problem, and I suspect there is a good chance that they will do this just as successfully as they built the world’s biggest Metro system from nothing in just 15 years. In fact this could be their next big growth industry. Can’t imagine it? Never mind few in the west could imagine China’s recent successes either till they happened. We’re not a very imaginative lot.
Patrick,
Though I generally agree with virtually NOTHING you say (not true, that’s a joke) your China comments are spot on. In total, I’ve spent approximately seven years of my life in mainland China, over two decades, and I’ve been to every province, bar one. Moreover, I have had experience with many highly educated and intelligent Chinese scientists, engineers and decision makers. There are far too many ill informed comments about this huge and complex country; but isn’t that true of everything? I’m pretty good at making them myself and do so all the time: Abundant proof on Ron’s Blog! Anyway, thanks for the well written (and accurate) comment(s).
Doug
Patrick,
Maybe I should add: It seems to me, the biggest problem in China (and a lot of other countries) is bribery and corruption. This is a tough one: like cancer it’s hard to diagnose and then comes the really hard part: figuring out how to treat it.
Doug
True, but we have or own versions of this; how else could you possibly describe the sordid corporate purchase of government in the US?
Ron,
There seems to be a BIG PHAT BLACK SWAN right here in the lil of US of A. Take a look at the Treasury Tic Data and see who has been buying up U.S. Treasuries by the boatload ever since the Fed announced the TAPER of QE back in Dec 2013.
If you focus on that little country called Belgium, they increased their U.S. Treasury holdings from $200 Billion in Nov 2013, to $341 Billion in Feb. It will be interesting to see what their holdings will be for March.
Amazing how a small country like Belgium with a current GDP of $483 Billion now holds $341 billion in U.S. Treasuries. Oh, by the way… ain’t that IRONIC that the headquarters of the European Union is located in Brussels, Belgium?
Just another KNEE-SLAPPER if you ask me.
The Fed may have announced a PUBLIC TAPER to all the simpletons in the US of A, but in reality… they just found another POOR SLOB to purchase their GARBAGE PAPER. This kind of childish crap will come back to haunt us sooner rather than later.
steve
Steve, there is a huge misconception as to foreign ownership of US treasuries. Most people think this debt is owned by the actual government of foreign countries. “Foreign governments” does not mean the actual governing body of the country but the central bank or banks of that country. The bonds are bought with depositors money and are used as the reserves banks are, in most countries, required to hold. They hold US treasuries because they feel it is the safest place to put their money, money they must put somewhere.
National debt of the United States, foreign holdings Wiki
As of January 2011, foreigners owned $4.45 trillion of U.S. debt, or approximately 47% of the debt held by the public of $9.49 trillion and 32% of the total debt of $14.1 trillion. The largest holders were the central banks of China, Japan, Brazil, Taiwan, United Kingdom, Switzerland and Russia. The share held by foreign governments has grown over time, rising from 13% of the public debt in 1988 to 25% in 2007.
Yes, But something odd is still happening:
1. In the past London was the hub for foriegners purchasing US treasuries in Europe. London is the European Banking center, not Belgium.
2. There has been a dramatic rise, as Belgium has nearly doubled its withholding in a year which is unheard of.
3. With the exception of Japan, The Top Central banks are either selling or not increasing there US treasury holdings.
4. This data raises an eyebrow:
http://www.newyorkfed.org/markets/fxswap/fxswap.cfm
The only large currency swap we have is with the EU central bank.
Ya ZH has been on this for over a month.
The ECB has offices in both Frankfurt and Brussels. It’s probably that.
Steve,
The increase in foreign holdings could be part of a program to weaken the Euro or could be US dollars lended to EU central banks on swap lines coming back to the US. The ability of the developed world to buy each others debt is one of the privileges that the developing world, except maybe China, has gotten tired of supporting.
Woody,
The Fed-US Treasury did TENS of $Trillions in currency swaps from 2008-2013 that are not shown via Treasury purchases. I can’t give you reference on this, however it does come from some very highly credible sources.
Either way, it still doesn’t change the fact that someone in BELGIUM is loading up on a lot of U.S. Treasury Garbage… coincidently after the FED started to wind down its QE purchases in DEC 2013.
Ron… thanks for the RECAP on Foreign held U.S. Treasuries. So, the BELGIUM Central Bank took $140 Billion of its citizens fiat currency and bought more U.S. Treasuries than anyone else on the PLANET in a 3 month time period???
I mean…. JUST LOOK AT THE REST OF THE COUNTRIES. Do you see anymore than a few $Billion to the most $15 Billion bought or sold during the same time period by the other countries.
Are you telling me that BELGIUM buying nearly TEN TIMES more than anyone else in U.S. Treasuries is not ODD ONE BIT????
steve
IN ADDITION:
If it is true (as Woody states) as most of us in the precious metal community believe that BELGIUM is indeed buying up U.S Treasuries because NO ONE ELSE IS… we are in a WORLD OF HURT.
Currently the Chinese-Russians-Iranians and etc are doing TRADE negotiations which don’t include that TURD called the U.S. Dollar. There are serious ramifications for the U.S. (and U.S. Dollar) for trying to continue its GUNS & BUTTER Policy in the Ukraine.
As we all know here the PETRO-DOLLAR has allowed us in the states to drive around in SUVs, drinking STARBUCKS and eating at new trendy GASTRO-EATERIES while the rest of the world works for a living.
The day is coming when the world rejects the U.S. Dollar and its lousy sidekick the U.S. Treasury. When Dollars come back in a BIG WAY to the States… we are going to see inflation that will make the 1971-1980 period look like a party.
THAT’S THE BLACK SWAN that I am talking about.
steve
There will be no money black swan. All CBs will cooperate to stop it, with bullets if necessary.
Oil is harder stuff to create.
Watcher,
You forgot to include one small TIDBIT in your forecast. While the Chinese play PIN THE TAIL on the FIAT CURRENCY GAME, they continue to import record amounts of gold.
The Chinese imported a record 2,181 metric tons of gold in 2013… not including the 430 metric tons that they produced domestically that doesn’t leave the boarder of China.
Total Global Gold Mine supply in 2013 was around 2,700 metric tons. If we deduct China’s 430 mt, we end up with 2,270 metric tons remaining. Thus, the Chinese imported nearly 100% of total World gold mine supply in 2013.
Of course this does not include gold scrap and recycle supply as well as it doesn’t include other monetary forms of gold demand that did not make it on the official data.
steve
Don’t see the relevance.
Belgium/ECB will buy bonds and not care about gold. Nor will any other CB.
Watcher,
LOL… that’s a silly response. You have less of an understanding of the function of money than I thought.
Steve
I guess I’m crushed.
Some CBs do care about gold:
http://www.marketoracle.co.uk/Article45026.html
Really, only the US dominated Central Banks are downplaying gold, except for Germany which asked for its gold back a couple years and still hasn’t received it. And Italy may want its gold back soon as its CB also now interested in its gold reserves.
Ron, another very informative post.
EIA’s Texas assumption now has huge impact on the overall US production. Since 2013, EIA has assumed that Texas oil production grows by 48 thousand barrels per day per month (for February 2014, they assumed that Texas grew by 50 thousand barrels per day).
With this assumption, it alone would guarantee that Texas/US oil production would grow by 600,000 barrels per day per year, about 60 percent of EIA’s projected US oil production growth in 2014.
There are 6.3 barrels of oil in a cubic meter. After you do all of the math, one cubic meter of oil is going to weigh 743 kg. A little more math will give us a long ton of oil occupying 1.3 cubic meters.
1000 kg of oil will occupy a volume equaling 1.3 cubic meters. It will be about 8.4 barrels. Check the math and 8.4 barrels is 2187 lbs, 3 gallons short of a long ton.
For every 1.3 cubic meters, it will be 1000 kg of oil or 8.4 barrels.
1.3 billion cubic meters will be 8.4 billion barrels. 1000 m x 1000 m x 1300 m will have 8.4 billion barrels of oil.
One billion tonnes of oil.
One billion tonnes of oil will last about 100 days.
Total known reserves of 3 trillion barrels or 3 trillion/8.4 billion is 357. 357 billion tonnes of oil to burn through in no time at all, really. Think of your own lifetime and it is easy to see that the oil is gone already, nothing anybody can do to stop it, it stops when it is gone.
357 100 day time frames to use the 3 trillion barrels, 357 billion tonnes, of oil.
35,700 days is close to 100 years.
Wind and solar need oil more than they need the wind or the sun, so after the oil is gone, the need to develop new power systems apart from current wind and solar technologies to provide energy will be a necessity. The need for oil is greater than the need for wind and solar, so it is time to develop the new wind power systems now, the kind that will work and not cause the damage they do. Mother Nature will not be kind to the wind towers. They have a lifetime of 30 years, and then it will have to start all over again.
Didn’t a small plane fly into a wind tower and 4 people lost their lives? There was a fog and the plane flew right into the blades of a wind tower on a wind farm in South Dakota.
Hydro has a much better future.
All the good hydro sites have been used, and Dams are ecosystem killers and evaporation tanks.
Hydro is in the rear view mirror, and we should be removing dams faster than we are at the moment.
On another note, even the moderate left is taking note of shale decline rates:
http://www.plosone.org/article/info%3Adoi%2F10.1371%2Fjournal.pone.0095227;jsessionid=092790F0B716CFFA798B91A3DE02B306
OOPS!
Wrong link.
Corrected:
http://www.globalresearch.ca/selling-hydraulic-fracking-the-myth-of-energy-independence-used-to-hoodwink-the-american-people/5379709
Dave,
I agree but not so sure Ronald has an open mind on the matter. In other words, no matter how well informed you are, you may be flogging an old dead horse. Time to move on?
Doug
What I cannot understand about wind power advocates is they do not understand the amount of energy required to produce the components for a giant wind tower, the coal used to provide the heat to generate electricity to power the manufacturing plants, the subsequent pollution of waters nearby the manufacturing plants. Once entered into the equation of total energy expended to achieve a goal of 1 percent of the total, wind power is a negative, not at all a positive.
The mining of the metals, the water used, the mining of the coal, the emissions from the power plants, the mined land to obtain the ores, the smelting process, an unending amount of resources required to build wind towers, when you think of what has to be done to obtain the numbers already in place, you have a disaster.
The amount of energy required in building the power plants and manufacturing plants needs to be added to the equation too.
It behooves the most simple of minds, the one cell I have to provide proof of a brain, to buy into what is purported without further investigation. If you can’t ask questions and question what might be a bad investment, it cannot have much merit.
In other words, wind energy propaganda. No matter how erudite the argument favoring wind development in its current contorted body of knowledge, it is easy to see that the body of knowledge needs to be questioned. That body of knowledge woefully lacks the hindsight of what has really been accomplished versus the total environmental impact and damage caused, all the while ignoring the reality of what has happened, a preponderance of statistics that do not support any kind of wind power and actually provides proof that wind towers are not going to be any kind of an answer to the problem of energy ‘deficits’, it should make you wonder. The snake oil used to sell its non-existent potential is all it has to offer. It is not a win win and it never will be.
A little scrutiny raises many questions, that’s for sure.
If all of those resources are being used, it would be wiser to generate electricity and forget about wind until a better system can be devised.
It ain’t gonna work.
Yeah, that Warren Buffet is an idiot. He’s not only the largest owner of wind towers in the United States, but he’s investing another $1 Billion + in towers in Iowa, as we speak.
Those 30 plus year old towers that are being taken down in California (and, being replaced with much larger, more efficient, bird-friendly towers) are, in general, in excellent working order.
As for Solar Panels, there’s no telling how long they’ll last. They took down some panels last year, in Nevada, I think it was, that after 30 years, were still within factory specs.
El Paso signed a contract a few months ago to buy 150 Megawatts of Solar-generated electricity for 20 years for something like $0.057 / kilowatt hour.
How would you like to sign an agreement to supply nat gas-generated electricity for 20 years for $0.057 / kilowatt hour.
Do I want a world covered in solar panels and wind farms so BAU can continue?
Might be time just to stop for a while.
It probably won’t work anyway (as a bridge).
“World covered in solar panels”?
No. Just cover your roof. Half the roof area of the average will power the house and two electric cars.
I’ve not only done the math; I’ve got the panels, and the cars. Fully instrumented, and it works great.
Where do you live? 75 degs year round?
And don’t cop out with nat gas.
All this worship of this stuff needs to address the 75% of the US with extreme seasons. If you don’t, it’s bogus.
I live in Austin, Texas.
>And don’t cop out with nat gas.
I don’t. Why do you assume that I do? Don’t make stuff up.
Austin does freeze in the winter, and often gets over 100F in the summer.
3 years ago, on this date, California produced, at max., 328 megawatts of solar.
http://content.caiso.com/green/renewrpt/20110502_DailyRenewablesWatch.txt
Yesterday, it was 4,501 Megawatts.
Don’t get caught in 20th Century thinking.
BTW, the “energy payback” on a wind tower is something like 6 months, IIRC.
Of course, when it comes to “Wind,” no one even comes close to Texas.
http://www.awea.org/Resources/state.aspx?ItemNumber=5183
Between its Wind, and Solar, resources, Texas could easily power the United States several times over.
Hi KD,
What is your opinion of public private partnerships such as what is discussed in the link below? I have been suggesting to the administration at my school that they should investigate this as an option–we have enormous surface area on buildings and parking lots that could be covered with PV. But I really don’t know enough about the concept to provide more to my leadership than a vague suggestion.
Thanks for any information you may have.
Best,
Tom
http://www.sierracollege.edu/about-us/admin-services/facilities/solar-array-project.php
It’s hard to see the downside, isn’t it? 🙂
p.s. Just the “pride of ownership” felt by the students, and their parents, would, it seems to me, be worth a lot. (I think that if I were a Science Teacher, I could light some young imaginations on fire with a teaching aid like that.)
If I were the Administrator, I would want my head maintenance person, my Science Teacher, and my best accountant (teacher, not a local CPA) to get together, and look for bids.
This stuff is getting a lot cheaper, but you’ve got to be careful not to overpay for the “soft costs” – installation, permitting, etc. (the best price probably won’t come from the local electrical contractor that just so happens to be on the School Board.)
“Yeah, that Warren Buffet is an idiot. He’s not only the largest owner of wind towers in the United States, but he’s investing another $1 Billion + in towers in Iowa, as we speak.”
Warren Buffet just lost $2B with the TXU bankrupcy. Investment in Wind is happening because of the Gov’t subsidies. Warren is a Crony and a Crook. He gets away with insider trading all the time and never gets proscuted. Warren companies that he not paying enough in taxes, but been in a battle with the IRS over $1 Billion in back-taxes.
http://www.examiner.com/article/buffet-calls-for-taxing-the-rich-while-he-sues-irs-to-avoid-paying-taxes
I think your facts on el-Paso are wrong. its 50 MW if they are really selling it at 5.7 cents per Kwh its either a scam or they will a boatload lose money. The industry standard is 16.3 cents per Khw for Solar PV
http://www.epelectric.com/tx/residential/macho-springs-solar-facility
If I’m not mistaken, there have been Two Solar purchases from El Paso. As for the cost, you are just way, way, way behind the times.
Hi Techguy,
Amongst headlines from The Examiner
http://www.examiner.com/news
“Missing Malaysian Flight hijacked officials confirm”
Do you believe everything you find on the internet?
DC, There are hundreds of articles about Warren Buffet. I googled and picked the first one, which happened to be the Examiner. I’ve see and read enough dirt on Buffet to write multi-volume book on him. He is not the person that his PR campaign makes him out to be. Do your own diligence before you take anyone for face value or their PR Campaign.
Happy, Same article from the Wall street Journal:
http://online.wsj.com/news/articles/SB10001424052970203611404577046374108267952
New York Times:
http://dealbook.nytimes.com/2012/03/26/netjets-case-warren-buffett-and-taxes/?_php=true&_type=blogs&_r=0
Uncle Warren caught with insidering selling:
http://dealbook.nytimes.com/2010/05/11/after-s-e-c-warning-traders-flee-moodys-shares/
(Sold shares before Moody’s Well’s Notice made public, yet never prosecuted.
There are literally hundreds of incidents of fraud by Buffet businesses that were never investigated or prosecuted. Buffet is an crony crook, period. You don’t become one of the richest in the world, pushing trades without widespread fraud.
K. Dollison Wrote:
“As for the cost, you are just way, way, way behind the times.”
I don’t think so. Time tells all lies. My guess is this one will unravel quickly since the cost is 1/3 of the industry standard.
Really? Warren Buffet a crook? You have got to be kidding.
Nope!
Austin just made a large purchase of solar power for less than 5 cents/KWH, less than coal, gas, or nuclear:
http://cleantechnica.com/2014/03/13/solar-sold-less-5%C2%A2kwh-austin-texas/
The Debt Service on our National Debt is approx. 0.025 of GDP.
How would you like it if Your debt service was two and a half percent of your income?
Link for above comment:
http://fms.treas.gov/mts/index.html
26% of Revenues pays just in the interest due and its only because interest rates are at rock bottom rates. Your statistic also does not include none federal debt, State and local gov’t debt, Corporate debt and personal debt.
If the Fed let interest rates rise to normal levels the US would be forced to default. No country in history ever owed so much and every nation in history, that had more that had a 80% debt to GDP ratio has always had hyper-inflation and a default. The US isn’t going to be different.
One more time: It’s 2.5% of GDP.
Two Dollars and Fifty Cents on a Hundred.
If it doubled, we would still only be back to a touch more than it was when Bill Clinton left office.
We have a lot of problems; no use trying to invent more.
Also, to note,
our “debt to GDP ratio” is set to fall this year, as our deficit seems poised to come in at a bit more than 2%, while our nominal GDP grows at approx. 4%.
You are wrong by . . . a lot . . . 50%.
US FY2014 deficit is likely to be 3% GDP. Not 2%.
Hmm that calculation is pre 0.1% quoted Q1. Banks have been quoting expected revisions for that first look as negative. Could go north of 3%.
What about Japan, no hyperinflation there.
Japan already had hyper-inflation in the 1930’s:
http://www.ft.com/intl/cms/s/0/686b6978-b6ad-11df-b3dd-00144feabdc0.html#axzz30lmcryVJ
Japan’s currency will eventually crash, but I don’t have a crystal ball when it will happen. When Japan does implode, it will take the US with it since the BoJ owns $1T in US treasuries. Hard to believe Japan would not sell them when Yen Currency crisis unfolds.
Japan is one of the most expensive places to live:
http://finance.yahoo.com/news/the-world-s-most-expensive-places-to-live-2012.html
At last, sonemoe who knows where to find the beef
Kum,
That’s a nice little FACTOID that the Interest on the Debt is only 0.025 of our total GDP. This figure sounds great for the typical U.S. simpletons and most of the brain-dead Economists who are unable to their own OUT OF THE BOX thinking.
However, the U.S. overstates its GDP by understating INFLATION. Secondly, real U.S. unemployment is in the 28-32% range. Funny how we added 288,000 new jobs in April, but 977,000 fell off the Payroll Radar in the same month. I am actually surprised that anyone believes that 6.3% figure.
Third… The United States doesn’t have a real economy. I call it the LEECH & SPEND ECONOMY that has no future… and as Kunstler says, “The Future is Now Here.” The only way the U.S. Economy works if we export Inflation Via the U.S. Dollar and U.S. Treasuries.
The world has finally woke up to this U.S. Dollar PONZI SCHEME and now has the ability and Balls to work itself out of it. Time is not on our side.
steve
Hi Steve,
The US does not understate inflation, if you are going to throw out the shadowstats stuff
consider the following chart of real oil prices if we use the shadowstats price index compared with the CPI for the real imported crude price (EIA data).
No one gets up to get on the Metro in the morning and go to BLS and Commerce with the intention of lying. They are fairly aggressive self examiners and self doubters and put considerable effort into being accurate.
They fail, of course, and they know they fail. Hedonic this and that is profoundly subjective and they do NOT do surveys for it. They survey extensively for % expenditure for each category and this is their biggest advantage over the shadowstat silliness, but they do not survey hedonics. It leaves them a lot of room for bullshit.
You could get a car with GPS in it in maybe 1997, and pay $30,000 for just the GPS package, and the fact that is now $150 hedonically influences car prices downward — but no one wanted GPS in their car in 1997. No one expected it. No one needed it. You can make a different case with airbags and safety items that were added and got cheaper in volume as regards “need”, because safety is a different animal than . . . luxury. But GPS . . . no way that should be allowed to influence CPI. And it does.
You’ll note that LED light bulbs, hugely more expensive than incandescents, are not applied similarly to the calculation. Even though incandescents are being mandated, the CPI continues to use delta pricing of incandescents.
Do not delude yourself that CPI is accurate. It is systemically orchestrated to not be accurate. No one . . . NO ONE . . . has anything to gain from it being accurate.
It was probably “seasonal workers,” rocco. The survey period was very early in the month this April – from the 6th to the 12th. Don’t be surprised if they reappear in next month’s numbers.
As for the rest: HOLY MOLY!! 🙂
Kum,
Yeah… I have a real way with words. Here is the U.S. Labor Participation Rate. While some of those nearly 1 million that fell off the Payrolls might come back on in the following months.. as you can see from this chart… THE TREND IS HEADING LOWER.
steve
Sorry…here is that chart.
Yep, Median Income, And Labor Participation Rate, both started falling around the years, 2000-2001. I wonder what else happened about that time?
Oh, yeah,
In China’s case, Congress agreed to permanent normal trade relations (PNTR) status in P.L. 106-286, President Clinton signed into law on October 10, 2000.[8] PNTR paved the way for China’s accession to the WTO in December 2000 . .
Interesting. The usual excuse is demographics, but there is rebuttal data for that.
Regardless, the slope downwards definitely steepened when the smash arrived.
Hi Steve,
How is “real unemployment” defined? Do you have a link for those statistics?
Doug,
I can’t find that article that did a great job defining that percentage of unemployment, however Shadowstats puts it at 23%.
However, here is another sign that THINGS ARE NOT GOING WELL in the U.S. Economy as GM shows a new record in the CHANNEL STUFFING of autos-trucks on U.S. car lots.
steve
How does a high GM inventory show economic weakness? Over time it shows inventory has risen and it’s current level is just a tad over the previous point in time.
The correct question is not why does high inventory denote economic weakness. It is why has inventory doubled in 5 years?
You do realize this is analogous to China building empty cities?
P. Earl Wrote:
“How does a high GM inventory show economic weakness? Over time it shows inventory has risen and it’s current level is just a tad over the previous point in time.”
Because consumers aren’t buying new cars. Last time GM Channel Stuffed this high, They went bankrupt. At some point GM dealerships can’t handle any more inventory and GM is going to be forced to Idle plants until the inventory is sold off. Dealerships probably somewhere between 6 to 8 months of inventory. So Its likely that GM plants will need to be shutdown for long period.
Considering the labor force participation rate drop to 36 year lows, its difficult to believe the economy is on track for a recovery.
Steve,
I presume you meant to type Dennis (not Doug). Because I know nothing about economics: zero, zip, slett ikke (Norwegian). It’s true my name appears on a few Feasibility Reports there was always an accountant sitting to my right, another on the left and a big bruiser standing behind with a baseball bat.
Doug
Doug,
Gosh… how did I do that….sorry.
steve
Hi Ron,
I know you are familiar with this, but for others the best work on reserve data is by Jean Laherrere,
at ASPO France short paper from May 2013 link below:
http://aspofrance.viabloga.com/files/JL_veryshort30May2013.pdf
and a longer version at following link
http://aspofrance.viabloga.com/files/JL_2013_30Mai_Clarmix.pdf
and an ASPO France page where many of Mr. Laherrere’s papers can be found link below
http://aspofrance.viabloga.com/texts/documents
Chart below on world reserves excluding extra heavy oil in Canada and Venezuela
Articles like these put the consumer in the driver seat-very imtaoprnt.
Fracking-triggered earthquakes could get stronger, seismologists say
by Renee Lewis, AlJazeera America, May 1, 2014 3:43PM ET
Fracking Growth Outpacing Scientific Knowledge in Canada: Report
Environment Canada-commissioned study urges a ‘go slow’ approach.
By Andrew Nikiforuk, 1 May 2014, TheTyee.ca
I’d dismiss all of those complaints, except that the long term thing is worth a 2nd thought. The stuff is two miles down and the perforations in the pipe are 3D so some of the proppant is going upwards, as is the pressure that cracked the rock upward pre-proppant.
So . . . you are down 2 miles with a frack radius of 1200 feet? Aquifers are almost never deeper than 2000 feet. Shale by its nature is low permeability. That’s why it’s being fracked to begin with. So . . . hmm how is this material going to migrate upwards 1.5 miles?
If the oil field were shallow, maybe 1 mile down, there is something to this. Not otherwise.
There seems to be evidence accumulating to the contrary.
We are all entitled to our own opinions . It won’t be too much longer before there is evidence enough to disprove yours or mine in this case.
Mine for what it is worth is that such upward migration will not happen very often but once is too much if you depend on the local ground water supply.
But if you want to be taken seriously you should think twice before you post such comments as this one upthread.
Somewhat true. ”The bulk of Walmart food sales each month takesplace in the first hour of the month.” My quote marks.
Maybe you meant hours instead of hour but this is not true of even the first whole day or week although the first day is uncommonly busy and often the busiest day.
Any body who shops at a Walmart as I do personally on occasion knows the parking lot is generally well filled with cars every day of the month.
It would be impossible to sell the bulk of the months groceries in an hour.Literally.
The store would have to be just about deserted the rest of the month to sell the bulk of the groceries the first day unless all the supposedly broke food shoppers have money all month for everything else EXCEPT groceries.
Try to find a story someplace that says the same thing about some other store and you won’t because it isn’t true. And it isn’t told about other stores because other stores are not the target of the pile on ” I hate Walmart ” meme.
No store could possibly stay open doing the bulk of its business in one day a month never mind one hour unless it deals in some very odd non perishable merchandise.I have a hard time imagining what that merchandise might be such that the store would even bother to open the rest of the month.
A jewelry store could manage it if lots of people got a ration for diamonds every month and they continued to get the usual markup.
This brings up a thought that is way off topic but interesting in relation to what business people say and what they actually do.
It is generally impossible to sell a thousand dollar diamond bought at retail back to the store that sold it to you for five hundred bucks in my experience and that of a couple of other men I know.This experiment was not intentional on my part or theirs but it has been repeated by investigative reporters with the same results.
Never the less jewelers continuously advertise how trustworthy they are and what great values they have for you.
If you can’t trust the jeweler you go to church with and whose grandchildren play in the same Little League games as yours……………………….
I feel for the people in a bad bind but that is not the point.I live in a very poor area , relatively speaking and mix with such people on a daily basis.
“Half” of them are the victims of circumstances beyond their own control. The other half of them are the victims of something that cannot be fixed- stupidity.
Mac,
“Mine for what it is worth is that such upward migration will not happen very often but once is too much if you depend on the local ground water supply.” Agreed. I can show you tables indicating the permeability of shale is such that flow rates are measurable in inches per century, but, that’s not much help if your well suddenly starts smelling of methane. Air travel may be the safest way to go but when you glance at the wing and spot a trail of smoke, statistics don’t give you a warm fuzzy feeling.
Doug
Methane is odorless.
Sulfides however….
Mike,
“Methane is odorless.” Ah, that’s mean man. True of course, but mean.
Doug
“mm how is this material going to migrate upwards 1.5 miles?”
its not, but the Well bore passes through the ground water. A failure of the well casing can leak containments into the ground water. Also some of the drillers are dumping fracking water on the surface or pumping into the ground (illegally). I think your making the assumption that all of the drillers are following the regulations to the letter and they are not. I have no doubt that drillers cut corners and frequently ignore regulations.
Dumping contaminated fracking water:
http://thinkprogress.org/climate/2013/09/11/2604171/exxon-charged-illegally-dumping-wastewater/
On casing failures:
http://protectingourwaters.wordpress.com/2012/05/02/new-study-frack-fluids-can-migrate-to-aquifers-within-years/
“Dr. Anthony Ingraffea has already established, based on PA DEP data, that Marcellus Shale well casings have failed at a rate of 6.2% in Pennsylvania in 2010 and 2011”
I recall reading an article a few years ago that all well casings eventually fail. So I think the short term frack-drilling will create very long term problems.
I am not an expert, but I think its possible that the Cement well casings are Permeable and can permit leeching into the ground water. I think they use a non-permeable linear but how often is it torn or punctured, or installed improperly.
Even MSM is starting to see the ponzi:
http://www.businessweek.com/news/2014-04-30/shale-drillers-feast-on-junk-debt-to-stay-on-spending-treadmill#p1
May be a way of making use of all that condensate produced from Shale oil wells the break down to large amounts of naphtha
http://www.greencarcongress.com/2014/05/20140502-kalghatgi.html
“A pathway to gasoline compressed ignition using naphtha fuels; higher efficiency, lower cost.”
“A new study by Dr. Gautam Kalghatgi and his colleagues at Saudi Aramco provides further support a pathway for significant improvements in the efficiency of a gasoline engine (i.e., spark ignited, SI) by running it in compression ignition mode with naphtha fuels. (Earlier post.) This latest work, presented at SAE 2014 World Congress, shows that moving to higher compression ratios (CR) and lower fuel cetane numbers (DCN) from an SI base engine offers a better trade-off than increasing DCN with a lower CR. In other words, using only cetane to improve CI fuel consumption is less beneficial than relying on a low cetane fuel and higher compression ratio.”
This sounds as if it might work but it also sounds as expensive as a regular diesel or very close in terms of the cost of building such engines.
There would have to be a regional market developed and then eventually a third grade of gasoline widely distributed.
This could be a big problem since service stations usually don’t have any tanks or tank capacity to spare. A really big station with lots of pumps could put this new grade in a tank presently used to store regular or premium if there are enough cars using it to justify the change.
Too bad the article did not say how these experimental engines run on ordinary gasoline but they probably run ok.
Did anyone see the big decline in U.S. natural gas production in Feb 2014? I know it was cold, but dry natural gas production fell from 2.098 Tcf in January to 1.895 Tcf in Feb. That’s a 10% decline in one month.
Again, I realize it was very cold in Feb which hampered production, but this is a big miss. It will be interesting to see how the rest of the year unfolds.
steve
2.098 Tcf over 31 days = 67.677 per day
1.895 Tcf over 28 days = 67.679 per day
=No decline
Good day! This is my first comment here so I just wanted to give a quick shout
out and tell you I genuinely enjoy reading through
your articles. Can you suggest any other blogs/websites/forums that go over the
same subjects? Appreciate it!