The OPEC data below was taken from the December OPEC Monthly Oil Maret Report. All data is through November 2017 unless otherwise noted.
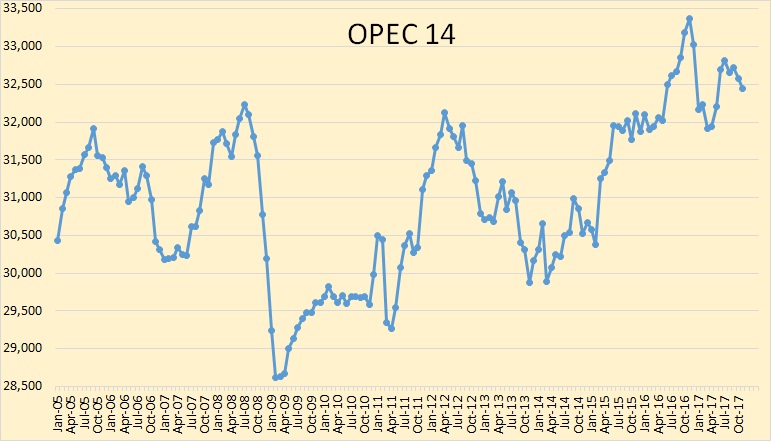
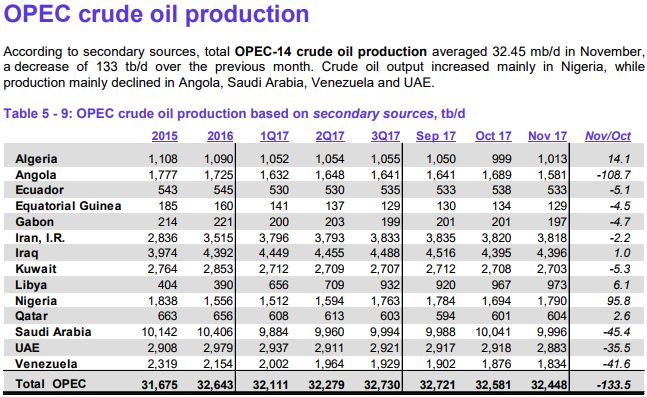
OPEC crude oil production declined by 133,500 barrels per day in November.
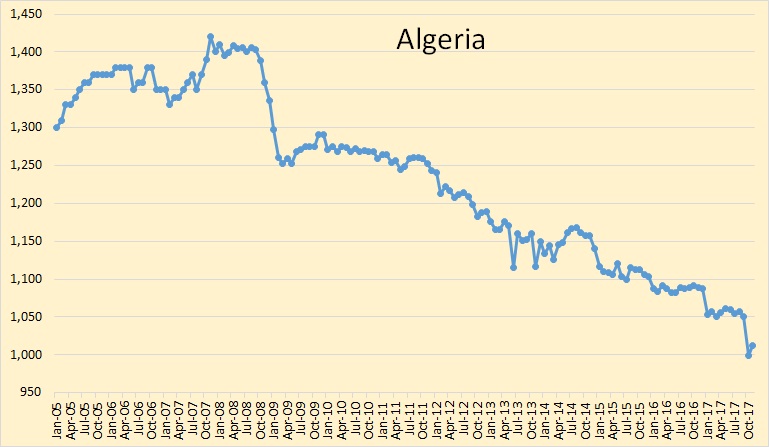
Algeria was up slightly in November after that huge decline in October.
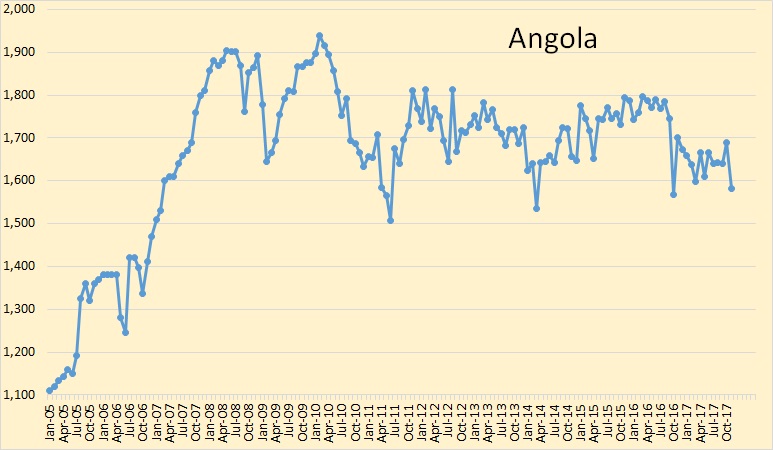
Angola was the biggest loser in November, down 108,700 barrels per day.
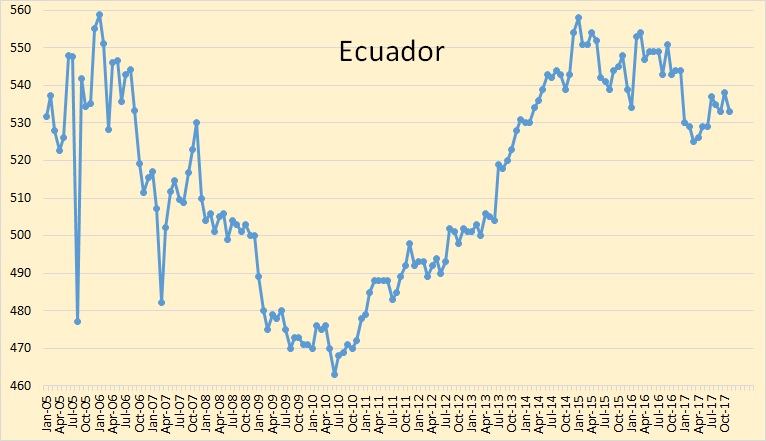
Ecuador, though holding its own for the last year, appears to be in slow decline.
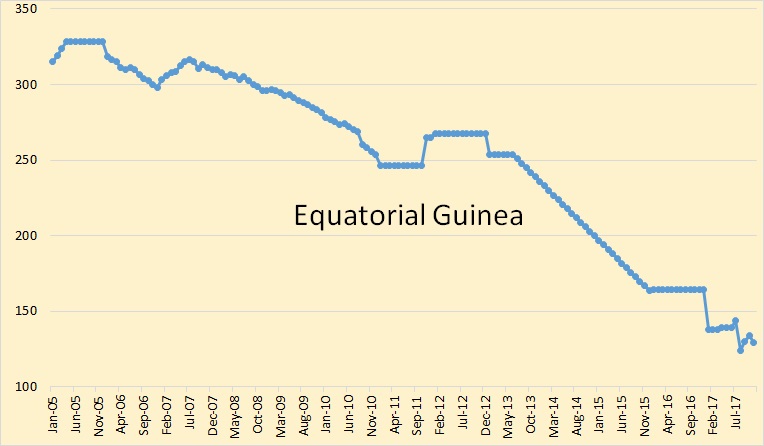
I have managed to cobble together an estimate of Equatorial Guinea’s historical C+C production. I had the EIA’s production numbers through June 2013. I subtracted 10% for “other liquids”, then merged that with the OPEC MOMR data that started in 2016. However, Equatorial Guinea’s production is not enough to make much difference.
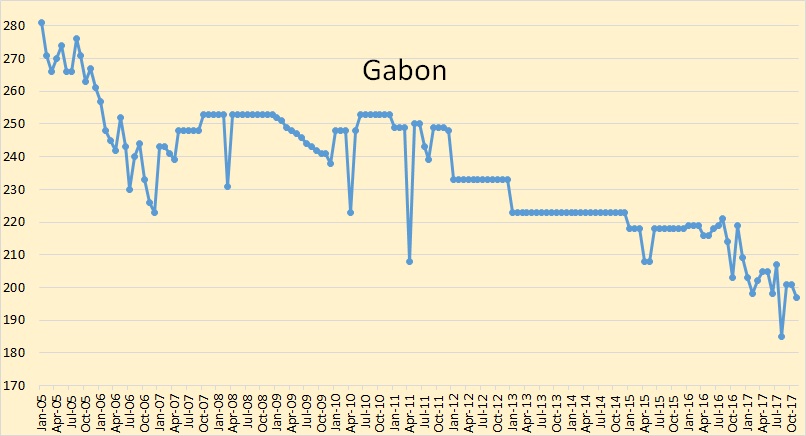
Gabon is also in slow decline. And their production is not enough to make much difference in total OPEC production.
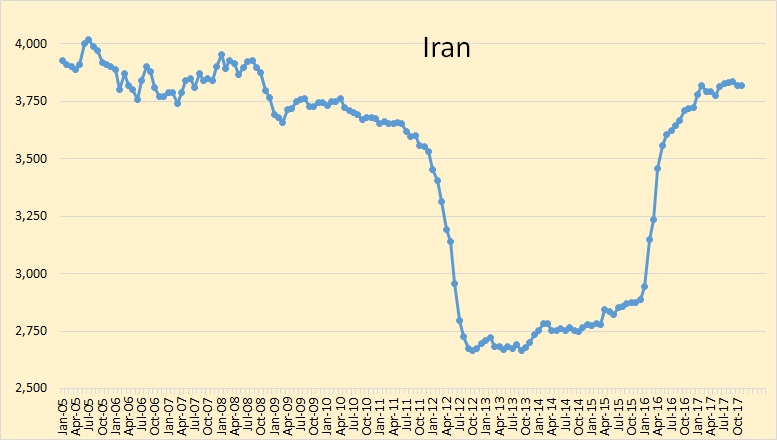
Iran ignores any OPEC request to cut production and continues to produce flat out.
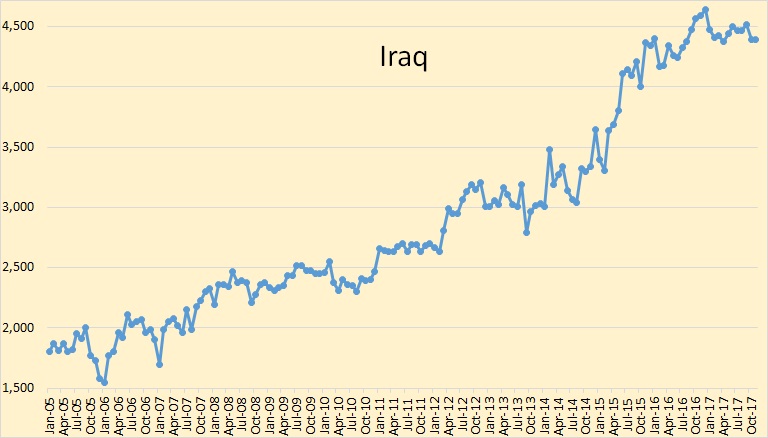
Iraq peaked last December and down only slightly since then.
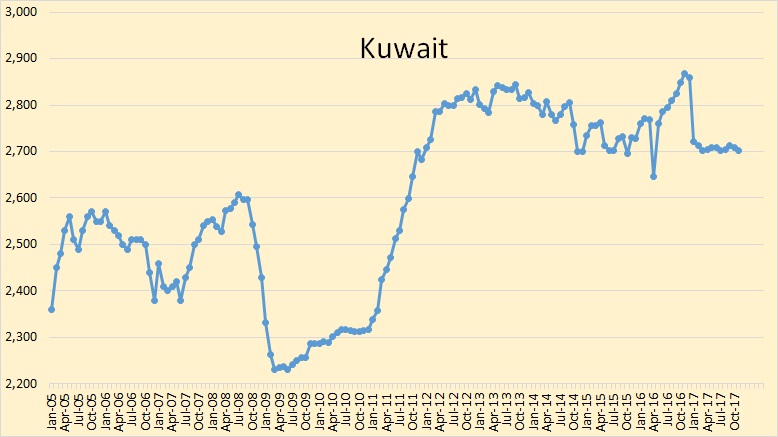
Kuwait peaked last November then dropped sharply in January and has held steady since then.
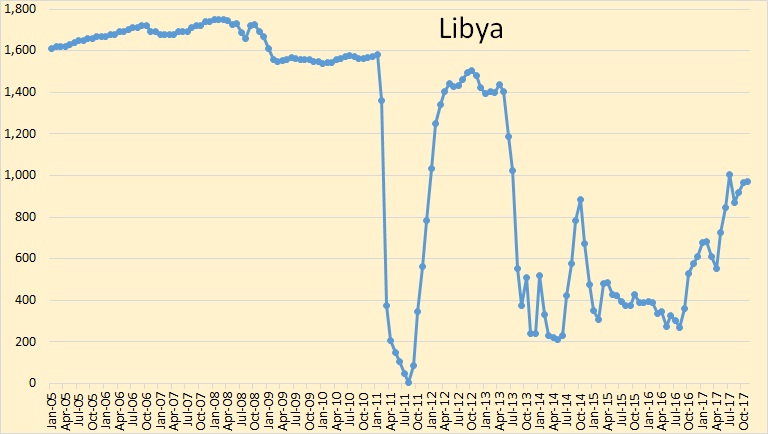
Libya’s political problems have ebbed but their oil production doesn’t seem to be responding very much.
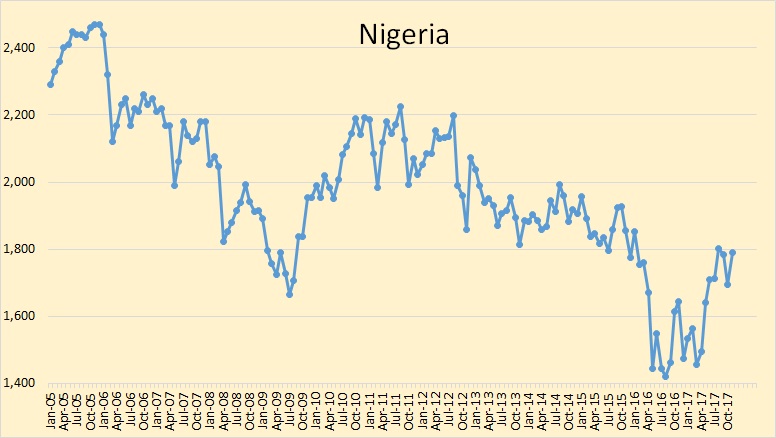
Libya was the largest gainer in November, up 95,800 barrels per day. It looks like Nigeria peaked in 2005 and have been declining since.
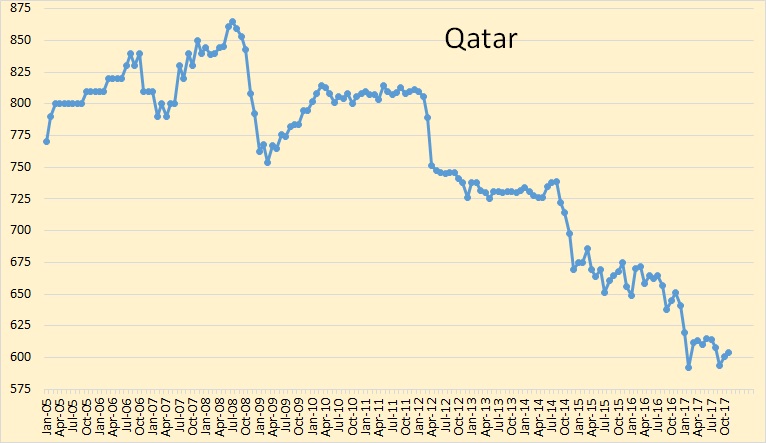
Qatar peaked in 2008. Their big exports are natural gas and natural gas products.
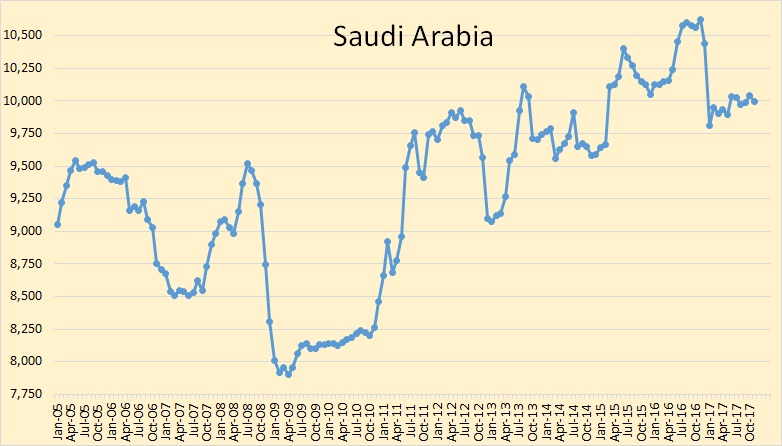
Saudi Arabia is holding steady, down about 600,000 bpd since peaking last year.
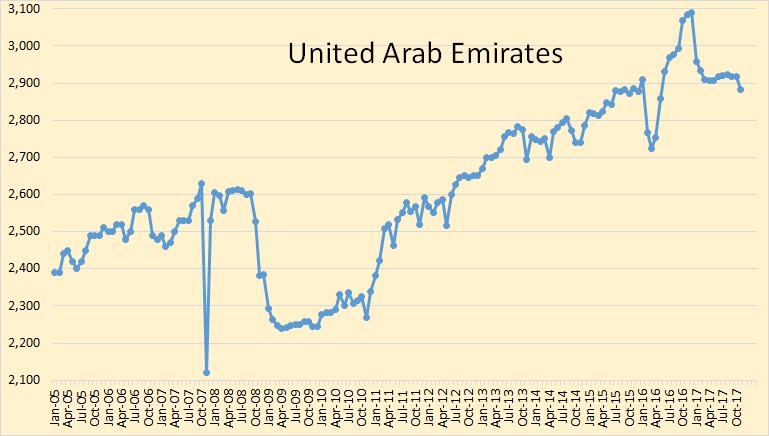
The UAE was down 35,500 bpd in November.
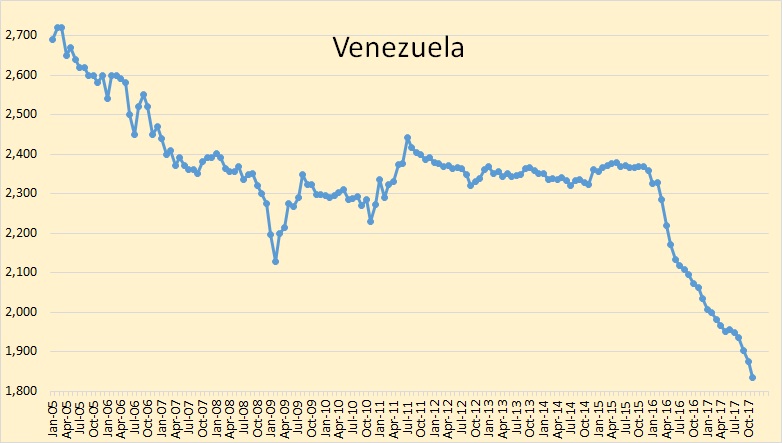
Venezuela’s decline continues. They were down 41,600 bpd in November. Venezuela is on the verge of becoming a failed state. What happens to their oil production in the future is anyone’s guess. But it doesn’t look good.
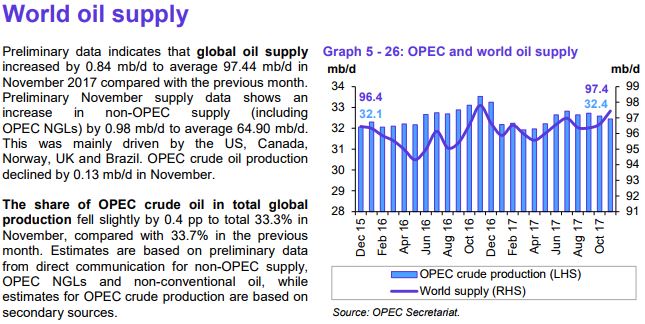
The OPEC MOMR says world oil production was up 840,000 barrels per day in November while OPEC crude production was down 133,500 bpd. That would mean Non-OPEC total liquids + OPEC NGLs would be up 973,500 bpd. I don’t really think so. Russian C+C was up only 7,700 bpd so that means Non-OPEC and OPEC NGLs were up 965,800 bpd. I think that figure will have to be revised downward.
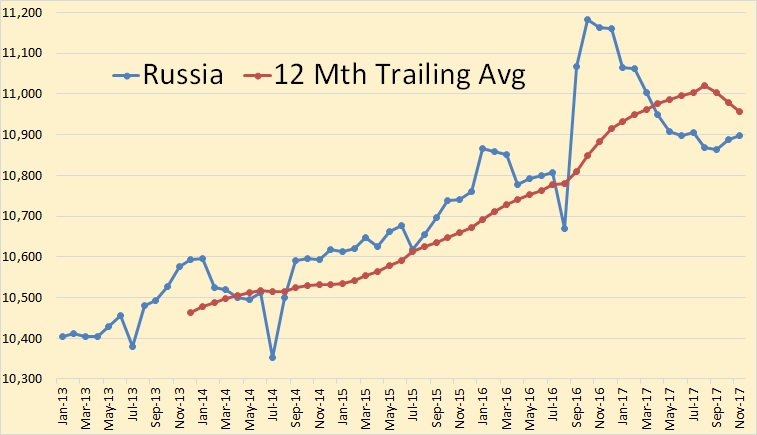
Russia C+C oil production according to the Russian Oil Minister. I am using 7.3 barrels per ton here. The Oil Minister’s production numbers average about 400,000 barrels per day above the EIA’s Russia production numbers. I have no idea why we have this discrepancy. Both are supposed to be crude + condensate.
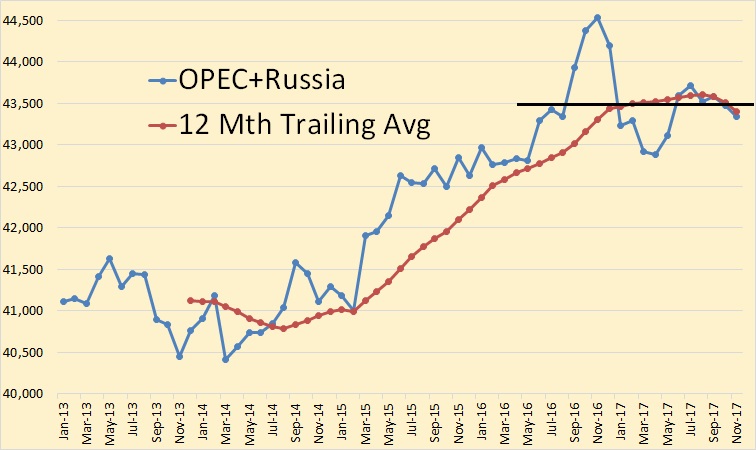
OPEC + Russia is 57% of world oil production. The last four months of 2016 are all above the black line in the chart above. This was all “positioning” for future cuts. This could have been done by draining storage tanks and delaying well maintenance. The sudden decline, January through May, was refilling storage tanks and catching up on well maintenance. The six months since then, June through November, is everyone producing every barrel they possibly can, or near that anyway.
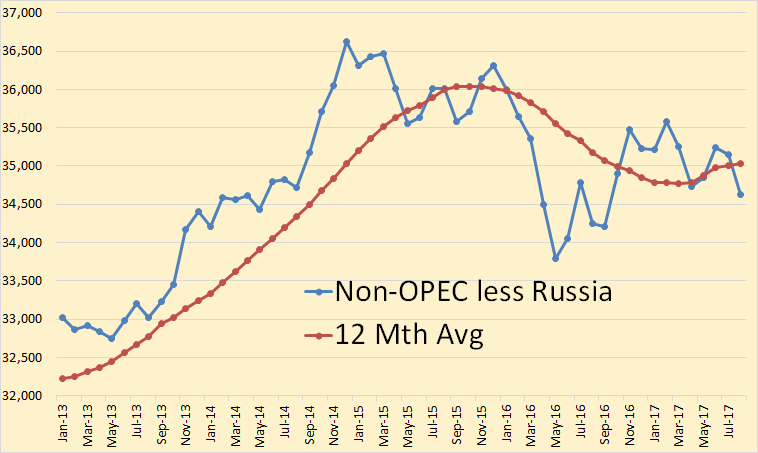
Here is the other 43% of world oil production, Non-OPEC less Russia. This data is only through August 2017, the latest EIA data. Non-OPEC less Russia peaked in December of 2014 and is down 2 million barrels per day since then. The 12 months trailing average peaked 10 months later and is down 1 million barrels per day since, or in August 2017.
Note: For the first chart, OPEC + Russia, I used the Russian Oil Minister’s data. For the Non-OPEC less Russia chart above, I used all EIA data.
181 responses to “OPEC November Oil Production”
The question is: Which of these countries are producing flat out, and which really cut back.
I’ll say all these in decline are producing what they can, they don’t need to choke.
SA, United Emirates and Kuwait look like they have reserve capacity – their curves are too smooth to be producing what they can. Irak is holding some kind of discipline, too. I have heard they are the only one who have enough reserves to add another 2-4 mb/d when they would tap all their fields, besides shale oil. At least they would earn money doing this.
Demand is growing round about 1.5 mb/day the last years, so when Venezuela finally fails completely due to a revolution, all reserve capacity will be strained.
Hi all,
Comments related to oil and natural gas should be under the OPEC post by Ron.
Other comments should be under the Electric Power Monthly post by Islandboy.
Thanks.
Hi Dennis.
I am trying to keep the topic of shale oil wells on rod lift operations alive, as it appears from Enno Peters’ shaleprofile.com data that almost all shale oil wells with first production through 2015 are on artificial lift, and the vast majority are likely on rod lift.
From Enno’s shaleprofile.com, these are my calculations for oil wells’ average BOPD in the four major shale basins (Bakken of ND and MT, Eagle Ford of TX, Permian of TX and NM and Niobrara of CO and WY). Unfortunately OK data remains unavailable, but given present EIA production data for OK, it still is not a major shale oil producer, at least in relation to the “big three”.
Year Average BOPD in 8/2017
2004 18.94
2005 17.81
2006 18.23
2007 22.79
2008 40.91
2009 36.90
2010 23.67
2011 23.78
2012 25.13
2013 30.64
2014 42.27
2015 66.35
I contend the above shows that the average shale oil well is a “stripper” well for all practical purposes by year 2 and no later than 3 years after first production.
I do understand “stripper well” is commonly defined for oil as 10 or 15 BOPD. This definition was arrived at when wells were vertical and mostly less than 10,000′ TD.
The shale oil wells are almost all in excess of 15,000′ TD and all horizontal. I think an argument may be made that a 15,000’+ hz well is a low volume, high cost well if it is on artificial lift and making less than 100 BOPD. I think that argument becomes even stronger when we get to 18-42 BOPD.
Years 2008 and 2009 look good due to many of the best Bakken wells having first production in those years. Those wells, I agree, made their operators a lot of money.
For the first time ever, it seems, the MSM has picked up on the fact that the US shale wells, by and large, become marginally economic once they have been producing for 2+ years.
Unfortunately, when I bring this up on POB or Seeking Alpha, all I hear are crickets chirping.
Coffee, Texas Tea, what about this problem?
This problem has been apparent to me since late 2014, when the oil price crashed Back in 2015 and 2016 I ran a lot of simple numbers and found that large percentages of these wells would not payout. There is a wealth of cost data online, and I do not believe I was every successfully challenged on my assertion, just basically ignored.
There is a tremendous amount of publicly traded debt related to these wells, as well as a very large amount of publicly traded equity market cap related to these wells. Most of this debt and equity is parked in US 401(k) and other retirement plans.
Seems to me these wells should only be worth investing in during a time of high oil prices, which the futures show will not be the case for quite awhile.
However, it appears that even the majors (see Exxon and Chevron) are curtailing most other upstream CAPEX and will focus on these shale basins. So, even Exxon and Chevron are resigned to their future outlook being that of the stripper oil well operator onshore USA.
I await some commentary about the issues involving operation of 2+ year old shale wells that are on artificial lift, as well as the ramifications when, in just a few short years, the remaining shale oil locations are drilled and completed.
Hi shallow sand,
If we consider only the 33,419 wells completed from 2010 to 2014, there are 10,928 of these wells that have been producing for 60 months and their average output at 60 months is 28.8 b/d (data from shaleprofile.com, all US LTO.) Average cumulative output is 144,850 b at 60 months for the average US LTO well that started producing between 2010 and 2014 (in reality this would be wells completed between Jan 2010 and Sept 2011).
I agree for wells which started producing in 2014 and later, many will never pay out. Higher oil prices above $85/b will be needed for profitable wells when all costs are considered (full cycle profitability, the only thing worth talking about). When paying off the debt load is considered, it may be that $90 or $95/b is needed to payoff debt and get these companies in the black.
The sooner that banks and investors realize this the sooner drilling and completion will be scaled back to levels that will allow oil prices to rise.
Probably this is far too optimistic a scenario, it seems investors are not very smart.
I think in many cases when people agree with you they don’t say anything.
I mostly comment when I disagree or have something that I think adds to the conversation.
I have mostly agreed with you, when I said nothing, others might do the same.
Dennis.
Maybe you are correct.
Maybe the shale proponents just agree with me, that these wells are generally marginal after about 2 years.
Seems my cliff thesis may be correct. Just not sure when it hits and how long before some other Energy source takes the place of oil.
I guess it also depends where the pump is set? Pumping a well with a pump set below the kick off point is a huge hassle. On the other hand, if the kick off is fairly deep, it’s not so bad to set a tubing anchor just above kick off, run a stinger below it, and put a pump just above it. These wells have very high GOR, and that’s going to be another enormous hassle. I can see pumping them with a high fluid level because they aren’t that productive.
When I think of it, they may not be worth pumping at all. Just put them on a clock.
Hi shallow sand,
If there is a cliff in output oil prices will increase and the futures market is wrong on the future oil price.
Do you think output will stay low when oil prices increase?
My suspicion is that output will stay low when oil prices increase.
That is why I think LTO may be the “anti-swing” producers: output surprisingly high when prices are low and output surprisingly low when prices are high.
Hi Schinzy,
I believe you assume high prices will lead to a recession, is that correct? Why will that be the case now when it did not prove to be the case (except in Europe where poor fiscal policy and lack of the ability for nations to control monetary policy slowed any recovery) from 2011 to 2014 when oil prices were mostly above $100/b in 2017$?
Eventually I believe high oil prices will lead to a recession (after 2025 and probably around 2030), but in the interim output will increase until about 2025, and oil prices will be high in order for supply to match demand, oil prices will likely increase at an average rate of $2/b each month over the next 70 months, by that time an equilibrium might be reached where demand and supply are roughly matched at $200/b with slowly declining demand and supply until a recession occurs after 5 years of slow or no economic growth (0 to 1% growth in real GWP per capita).
Not exactly.
I think production levels remained high when prices were low because investor money continued to flow into the industry. There were bankruptcies, but the bankruptcies caused more money to flow into the sector.
My conjecture is that money will cease to flow into the sector when the price rises. I believe this will happen because of the buy low, sell high psychology of investors.
With less capital, production will be lower.
Hi Schinzy,
Higher prices will allow LTO companies to self finance in my opinion. If the oil price rises to $85/b in 2017$ or higher, most LTO companies will be profitable.
Hi Dennis,
If LTO companies start self financing, management style will change. Current LTO management is terrific at marketing and obtaining financing. They are big risk takers. It is easy to take risks with OPM. When management self finances. the management style is closer to the prudent style of Shallow Sand and Mike. I think they will pay down debt before drilling a lot of new wells. This means prices will have to remain high for 2 or 3 years before extraction rates rise.
Hi schinzy,
We are almost on the same page.
Scarcity will lead to increases in oil prices to $85/b to $100/b. This price level will enable LTO producers to self finance and pay down debt and will lead to a gradual increase in output from 2017 to 2025.
At that point the tier 1 areas will be fully drilled and as production moves to less productive areas output will peak and decline. Oil prices may continue to rise due to scarcity until a recession hits in 2030 due to difficulty dealing with the energy transition. Then oil prices might start to fall due to reduced demand.
That’s how I see it playing out.
Hi shallow sand,
Can you remind us what your “cliff thesis” is exactly. I assumed it meant a rapid decline in World output (or perhaps just LTO output), but my guesses are often incorrect.
Earlier I was trying to agree with, just presenting the data in a different way.
I agree LTO producers should not be drilling so many wells, there seems to be a problem with the way the CEOs of these companies are rewarded.
If I were a shareholder, I would vote for CEO compensation to be based on the bottom line. Negative earnings should mean negative bonuses.
Dennis. Cliff theory is probably not a good name.
I think there are two presumptions which may be faulty. First is that US will grow production for at least a decadeand meet the needs of worldwide increased demand in the near term (10 years or so).
The second is that within that time, electric vehicles will cause peak demand for oil.
My theory is that both presumptions are too optimistic, and that there could be a major supply crunch in between the “peak” of shale and “peak demand.”
I think maybe you are the one calling for production falling off a “cliff”? My theory is for sure not an original thought.
Hi shallow sand,
No I expect World output will decline gradually (1% to 2% per year), perhaps US LTO output will fall off a cliff, but oil sands, deepwater offshore, and OPEC will likely respond to high oil prices with an increase in output which will make the decline in world output less steep than the decline in US output after LTO peaks (in 2023+/-1 year).
Others believe this gradual decline scenario is far too optimistic, Ron and George believe (I think) that World oil output is likely to fall quite rapidly (maybe 5%/year) so more like a cliff than my scenarios.
Clearly if they are correct this is more likely to lead to severe economic disruption. I think the only way we see such a rapid drop is a major war between Iran/Iraq (on the Shia side) and Saudi Arabia, Kuwait, and UAE (on the Sunni side) which might take as much as 23 Mb/d of C+C output off the World market (assuming output falls to zero in these 5 nations).
This scenario seems far fetched, until it happens.
We would see a major economic crisis as a result of such a scenario, we would probably need to ration oil under such a scenario and $300 or $400/b would not be out of the question, at least until the conflict is resolved.
Dennis. The cliff is not mine originally for sure. Maybe not even a good name.
I think what I am trying to say is I think there could be a gap between peak supply and peak demand that will cause a lot of economic problems.
Hi shallow sand,
I agree.
Typically there is no gap between supply and demand as long as there are not price controls put in place (Nixon’s mistake in 1973-4).
If we want to wait in line for fuel, then price controls are a good idea, but mostly this justs makes the shortage worse (as cars waste fuel idling while waiting in line.)
Let us assume no price controls because someone in the government has studied Econ 101, in that case there is no gap between peak supply and peak demand, the market price will make them equal.
The very high oil price that may be needed to make this so (possibly as high as $200/b, maybe higher) will certainly lead to economic disruption, but if it happens gradually over several years (say an average rise of $2/b each month over 6 years) so oil prices gradually climb to $202/b (2017$) by December 2023, perhaps the economy can adjust.
We would gradually see more hybrids, plugin hybrids, and EVs being sold as oil prices rise, by the time oil prices reach $200/b perhaps 80% of new cars sold will be plugin hybrids and EVs. More long haul shipping would be by rail, short haul transport may start to switch to EVs. I doubt any of this will be smooth and a severe world recession within 5 years of peak oil output (which I believe will be 2025) seems highly likely in my opinion.
In the mean time oil producers can make some money (when oil prices are at $100/b or higher) and save for retirement, or that is my hope.
Hi Shallow.
I seem to recall agreeing with you and Mike on this last year. It is probably the most notable thing I have gotten out of Peak Oil Barrel since I started reading. The problem is, I have nothing to add besides an “atta boy!”. I don’t have any pull on anyone who can change things; yours is an idea that needs a champion, someone who can influence those who make investment decisions. There seems to have been some movement on the investor side, like the WSJ article Ron posted last week, but I doubt they will have any long term effect before the shale sweet spots are all drilled out at low prices and massive losses for investors. The only thing I can think of that might change things is if an actual indictable offense, say, some kind of fraud, could be proven….hard enough to do in normal times, let alone with the current administration.
-Lloyd
Thanks, Lloyd.
Jeffrey Brown and I made a bet 4-5 years ago regarding the percentage of unconventional shale oil wells in America that would actually reach payout based on a weighted net back oil price and realized production data. My bet was less than 40% and I am sticking by that bet. Please remember that most well costs touted in investor presentations conveniently leave out lots of inconveniently costs and I think most wells being drilled in both the Midland and Delaware Basins, for instance, are going to require 350K BO, not BOE, or more just to reach payout. Well productivity is up for sure, but so are costs and the interest on debt per incremental BO keeps whirling like the electric meter on Christmas Vacation when Clark Griswold finally gets his lights working. I B guessing the FOMC probably gave the shale industry a little more heartburn today.
Dennis, we’re on the same page, I think. Shit, that’s scary: https://www.oilystuffblog.com/single-post/2017/12/13/Hydrocarbon-Independence
Hi Mike,
Yes it is. If you agree with me, you must have been drinking too much. 🙂
Happy holidays, I hope oil prices rise sooner rather than later.
Hi Mike,
For the Permian basin at shale profile (link below)
https://shaleprofile.com/index.php/2017/11/27/permian-update-through-september-2017/
For 2016 wells (using year of first flow) it looks like the output vs cumulative chart trends towards about 425 kbo for an average EUR for the average 2016 Permian horizontal well (first flow 2016).
So if your guess of 35o kbo is correct, maybe these wells will pay out (for the average well). I am assuming production problems at the end of life may reduce EUR from 425 kb0 to 350 kbo, it may well be worse than this, clearly you would know better than me.
Lets assume $50 oil based on a hedge and what appears to be growing deduct to WTI because of bottlenecks. Less 7.5% severance and property tax ($3.50), less 25% RI ($12.50), less ($3.00) per incremental BO G&A, less ($2.5o) per incremental BO interest expense, less ($8.00) per incremental BO lift costs = $21.00 per incremental BO take home pay.
I don’t buy the well costs those yahoos tout; the AFE’s I’ve seen for the laterals, frac’s, 600K BW at $1.50 per BW, acreage costs, etc. they have in the Permian are $9M, with no problems and there are always problems…Pioneer in the Midland has now had to add a 3rd string of casing to a lot of their wells.
$9M divided by $21 net back is actually 428,600 BO to payout. Even if we use 400K BO to reach payout, and add the increasing gas component in the revenue stream, and declining WH price per mmbtu, if it is not flared because of its own bottlenecks…its not good. The economics of all shale oil wells suck at $50. Their “breakeven” price calculations are lies.
Then we’re back to what is profitable enough? Fernando can answer this question: is 1.35: 1 ROI on a $9M expenditure sufficient return on investment to be able to pay down $2, 4, 5, 6 or 8 billion of debt? Is that sufficient return to self fund reserve replacement? My answer is NO!
By the time your predicted oil prices come to fruition, Dennis, if they ever do, the shale oil industry will have drilled all of its Tier 1 reserves and be grinding away on flank stuff that is more expensive, less profitable and less productive. If there is actually anything left of the shale oil industry by then. Its private enterprise running America’s oil industry and it must make money to succeed and be sustainable. Unless, of course, one thinks Central Banks (government) should keep giving these guys money they don’t have to pay back.
Hi Mike,
I agree, I just took your initial number (350 kb0) and compared it to the data from Enno’s website. Note that this average includes all wells both bad and good. Some of the companies have cheaper land costs due to legacy wells (maybe Pioneer) and may have tier one leases that have higher output than average.
I am not meaning to suggest this seems like a good business plan, I am simply trying to understand why these wells continue to be drilled and completed as your arguments for why it does not make sense is compelling.
My first assumption is that oil men are not stupid, your opinion seems to be that these LTO guys are not very smart (or something to that effect).
Hey if I guess that oil prices will increase consistently, I am bound to be right eventually. Even a broken (analog) clock is correct twice each day. 🙂
Even if US LTO output increases it is likely to be a 400-500 kb/d annual rate of increase, this is not enough to meet rising World demand for oil which is likely to increase at a 1200 kb/d annual rate for at least the next 7 or 8 years at current oil price levels.
My knowledge of economics suggests the scarcity of oil will lead to higher oil prices (rate of increase unknown).
On central banks giving people money, I am pretty sure these companies get their money from private citizens, either through bank loans, bonds, or sales of stocks.
It’s a free country, people can invest their money where they choose. I would not (and do not) invest in oil companies, but you know what PT Barnum (supposedly) said… every minute.
Oasis Petroleum paid $946 million for 20,300 net acres in the Delaware Basin, with 601 gross locations having a 76% GWI (so 457 net locations).
This comes to $2.07 million per location!
Assume $8 million per well cost, including gathering and other infrastructure (I am likely being generous to Oasis) development of the net locations will cost Oasis $3.656 billion to their interest.
So, to fully develop the acreage, looking at spending CAPEX + land of $4.6 billion.
I will be generous again and assume OAS netback of $25 per BO. OAS will need to produce 184 million BO to payout this project, or 402,837 gross BO per well (to 100% GWI).
Of course, no time value of money calculations are being made here.
I see 3,167 horizontal wells with first production in Reeves, Loving, Ward and Winkler counties since 1/1/2010. Some could be San Andres. Still, only 32 hz wells with first production since 1/1/2010 have cumulative oil in excess of 400,000 BO.
Seems like they will need much higher oil prices to make this work?
SS, let’s agree sometime people and yes companies are people too, do stupid things. But here is the thing, ask your self who are these people, what is the totality of educational, practical experience and previous success in business. And then ask yourself why would they make stupid decision or perhaps they have information that you as a laymen do not. I still recall you our “disagreement” on oil production in Oklahoma, you refused to believe me, which is fine…now 3 years later of course you missed the boat. My point is, even if I give you credit for trying to learn, you come with a preconceived bias that keeps you from seeing the facts. Now without speaking to the exact location of the purchase, I do know that in many areas there are as many as 10-15 different horizon. So if they are developed with 4-5 wells per horizon, that could mean 40 to 60 well per section. Now how do those numbers look?
IN our area in OKLA, we have gone from 6 wells 4 years ago to over 15 wells per section Proved Un-Develped. That is more likely to increase than decrease given the information currently at hand. Good god man, if someone is not paying you by the world you write, I am at a loss why you spend so much time doing what you do.
Hi Texas Tea,
Shallow sand is an oil producer, far from a layperson.
Dennis.
When it comes to shale I might be considered a layperson because I do not understand why so much money has been thrown away.
My assumption is that shale management are more akin to oil well promoters than those of us who actually make money or lose money on the oil.
I think Abraxas is the only shale company whose management took a pay cut during the price collapse.
Imagine if management owned the company privately. They would likely not drill as many wells.
As for OK, I am still not sold on it being a major shale oil producer like the Permian, EFS or Bakken. There is a lot of gas and liquids there, but prices for those commodities are still terrible.
Hi shallow sand,
Fair enough, you do not produce LTO, but you do know the oil business.
I have no clue about Oklahoma.
Output from 2005 in chart below (trailing 12 month average). If all of the increase since 2005 has been LTO, it would be about a 275 kb/d maximum LTO output so far.
Shallow, my dad always use to say to be offended by someone’s insult you must first value their opinion. I am privileged to know your background and you are hardly a “layperson.” That was a stupid remark made by someone who struggles to even spell and construct sentences properly. Consider the source and move on.
If one wants to know the economics of oil and gas extraction, if an oil well, covey of wells, field or resource play is going to be profitable, enough, and be sustainable in the long term… ask a stripper well operator. We deal in facts, down to the pennies. We can’t lie to ourselves, or to others, or we do not eat and we cannot keep ourselves, or are families, warm in the winter.
The American shale oil industry is failing. Yes, it is providing jobs, and cheap gasoline to consumers, but from a business standpoint it is failing, miserably. Debt and oil do not mix. Set aside the lies, the funky arithmetic, a few monster wells here and there, the “hope” for higher oil prices and OPEC cooperation, anybody with a square centimeter of cranial capacity can see the LTO industry is hanging on by a thread and all but four or five of the largest shale producers would not exist but for low interest credit.
Your latest and best example, which I still find remarkable: Continental Resources, the poster child for the shale “revolution,” is over $6.6 billion dollars in debt and only has enough cash on hand to drill one stinkin’ Bakken well.
THAT, sir, is beyond stupid. How’d you like to have that company operating for you? Worse, who would buy a share of that outfit?
Dennis if you need to be RIGHT about oil prices, and all of your growth and recovery models ultimately be correct, then hang in there and continue the best you can to ignore reality. Eventually you might be right.
Smart people do stupid things with other peoples money. Like you, it seems, they make decisions based on hope, not the reality of the presence. Like you, it seems, they don’t seem to think debt is a bad thing. Debt IS a bad thing but I think one has to have been in business for oneself, particularly the oil and natural gas business, to fully understand that. And I would suggest you review where the money has come from to fund this shale phenomena, you might start here, https://twitter.com/aeberman12.
Hi Mike,
There are different points of view on debt.
As long as one has adequate cash flow to pay principle plus interest, debt is fine.
You seem to think I am trying to defend the LTO producers, when I agree with you.
I guess I cannot communicate this clearly.
You seem to assume oil prices will never increase.
To me such an assumption requires either
A. The World economy will not grow in the future or
B. Oil supply will continue to increase as fast as oil demand in the future or
both A and B are true.
I believe both A and B are likely to be poor assumptions.
That’s probably the main source of where we disagree.
The source of my assumptions are
A. World real economic growth has been positive all years since 1960 with the exception of 2008. So I expect most future years until 2030, this will also be the case.
B. Fossil fuel resources are not unlimited and even an optimistic estimate for resources (say a C+C URR of 4400 Gb, or 1000 Gb more than my best guess).
It is of course possible that I am wrong.
If the debt from the LTO companies is not paid back, life will go on, and maybe investors will be more careful with their money in the future.
I think we now have a better understanding of each other’s “opinions” about the role that shale oil will play in America’s energy future. You are not adverse to debt, I am. I am able to see how severe the financial situation is for the American shale oil industry, your not.
https://www.peakprosperity.com/blog/113557/great-oil-swindle. The American shale oil industry is two hundred billion dollars in debt and now forced to manage that debt with wells that produce less than 25 BOPD. And, as Chris implies in his article, not sufficient reserves to cover that debt. That is a disaster in the making. That will not improve with some wishful thinking about $100 oil. “Life may go on.” if the shale oil industry fails, but your predictions won’t. Debt is not “fine, and it is particularly not fine for an industry whose assets decline 45% the first 3 years, then 12-15% per year thereafter.
Hi Mike,
Companies go bankrupt. Other better run companies pick up the pieces and create profitable enterprises.
This has been the case as long as capitalism has existed.
Only “too much debt” is bad. Have you ever borrowed money? I have, to purchase real estate, it has worked out fine. My guess is that John D Rockefeller also borrowed money, but I don’t know this for sure, the Wikepedia piece suggests this was the case early in his career.
I do agree that if the price of oil remains $50/b forever, LTO companies are likely to fail. At $85/b, probably not.
I do not know the future price of oil, nobody does.
Hi Mike,
I was joking about being right, that’s what the smiley face implies (that I was kidding).
I agree that at $50/b not many LTO wells are profitable (probably less than 25%) and the average well loses money.
I also agree this is not a smart way to conduct business. I am at a loss to explain why anyone continues to invest in these companies.
If it’s private equity being funded by institutions heading pensions that are obligated to produce guaranteed rates of return to pay pensions, then as long as the yield is there then they will be funded.
You would think bankruptcy would have taken a toll on those yields, but I suppose bonds are still getting paid? Or by the time the piper needs to be paid the private equity people are hoping to be retired.
Mike: Not to be critical, but did you include land costs in your calculations above?
Oasis just stepped into the Permian with a big acreage buy, to be funded by an equity issuance, and the market reaction yesterday was negative, share price down 17%.
When one throws $30-60K per acre on top of what you lay out above, one needs to produce a heck of a lot more oil to payout.
Of course, they tout a ton of locations. As we know, many of these locations are in zones that, thus far, have proven to be completely uneconomic, even at $90 oil.
I do see on the auction there are two horizontal wells for sale operated by BC Operating, in the New Mexico Permian, which appear to be, dry holes! If you bid $100 you will own them.
I had taken a break from looking this stuff up, but six months later, things have not changed. Still a lot of not so great wells. Still a lot of companies touting high IP’s, with no mention of all the 15,000’+ stripper wells they now operate, that are still $1-5 million from payout.
Shareholders of shale are merely etal’s being promoted, it is no different than it was in the late 1970’s-early 1980’s other than instead of actually owning an interest in wells, one now owns stock. I guess not really much different than the “limited partnerships” that were all the rage 30-40 years ago, which quickly became worthless?
Shallow, ouch those BC Operating wells had to hurt someone. From looking at the record at least one of the wells must have been completed in some manner as they produced 441 bbls of oil in May 2015 and a little gas around that same time. I thought that part of shale’s touted magic was no dry holes except mechanical failure such as a casing collapse.
Did you notice the seller had a 35 percent working interest but only 10 nri, wonder what is up with that, maybe tt has a massive orri.
Yes, what’s up with that?
Rare to see NRI for the working to be that low.
Shallow, though shale oil wells are essentially mass manufactured, they don’t cost the same. My $9M number is indeed conservative, but includes acreage costs, even geophysical costs that are often diluted by multiple wells on a producing unit. Later in these plays acreage costs go sky high, over the $40K an acre number, but including production. If my well costs are low, then UR to reach payout goes up. It is clear to you and I, at least, that not many PB wells are going to get there.
I appreciate your relentless effort at showing people the truth about all this shale stuff. It plum baffles me regarding the exuberance over it all. You must please take note of the fact that none of this exuberance comes from real life experience with the oil or gas business, of having to write checks to get the stuff out of the ground. All of this exuberance is based on internet heresay, and hope.
If I can find the time I am going to write a post this weekend for oilystuff on how the water situation in the arid, dry Permian Basin IS going to affect the rate of growth out there. We have had 3-4 good, wet years in Texas; but that will change and the water situation, already reaching a crisis situation, is going to put the big breaks on Permian operators, who, I might add, have been lying about water and are ill-prepared about not having any to frac with.
my best guess is you are “plum baffled” by the sun coming up each morning, I have never seen so much written by so many people who do not know diddly squat about the subject in which they write. I can assure you, you do not speak for ANY oil men I know. they are still finding grease while you…..are baffled?
Texas, do you work in the patch? And I don’t mean as a service company drone who doesn’t know anything, but on the engineering or g&g side at an operator?
Because I’m going to tell you, as someone who does, you don’t speak for anyone either. You are just as confused as the rest here. You just may be confused in an opposite direction.
Get off your high horse before someone with access to a lot more data than yourself schools you.
Hi Mike,
Chart below adds a trendline in purple for the average 2016 well (eyeball rather than regression). I recognize actual production is likely to be lower than this for many reasons that you and shallow sand have covered.
Good for you, Shellman. Will JJ Brown look like an idjit as he did when he did 2006 ELP thingie? Time will tell.
$200 billion in debt for the US frackers is a bonus for the $1.5 trillion in petroleum savings for US consumers between 2014 and 2020. I may have understated the bonus. Maybe Dennis can do a log chart so that you feel “extra special” compared to the rest us of household peons.
https://fred.stlouisfed.org/series/DGOERC1Q027SBEA
Marmico, its a miracle alrighty, this shale phenomena. Its gives people on the internet something to do with their free time, created opportunities for day traders, incrementally sped up the depletion of America’s last hydrocarbon resources, created jobs for some and took away jobs for others, allowed CEO’s, Wall Street and humble royalty owners like tee tee to make hundreds of billions of dollars, and put the world oil order into a tail spin, including the economies of entire countries. But, its a bonus for the American consumer ! They’ve saved gasoline money so they can go out and buy bigger SUV’s and use more gasoline. Its all been….revolutionary.
And a long way, far more than $200B owed by the upstream shale oil industry, by the way, from being paid for yet. So, get ready. You’ll pay your share of it before its all over; watch.
Hi Mike,
I bounced over to your site again after seeing the link on this post. I love your cover picture, it’s beautiful.
I hadn’t seen that you had put up more content. It’s a great site.
Thank you, Wake. You are very kind and I responded to your comment. Merry Christmas.
shallow, I agree with you. EOG, basically does, too. If the well cant make payback in close to the first year, it shouldn’t be drilled. AT $40 price, you need a 200k barrel first year production, at $100, you could get away with 80k first year production, if prices stayed at over $100, otherwise, you could be screwed. Which means the projections by most pundits, EIA and IEA are really far over estimated. Most of mine will have to stay in the ground until WTI stays above $65 for a while, which is ok by me.
SS, just in from a week of quail hunting and saw your question. I do not spend my time looking at fields I have no economic interest in so I can’t say if your numbers are correct or not. However for the wells I have personal economic interest in my actual results are very different. My oldest Woodford OIL well at month 31 is producing 120BODP and 1200MCFG of very high BTU gas. It has produce 170,000BO and 1.75BCFG. This well is in the middle of the production range of surrounding wells with some doing better and others doing slightly worse, completed within 6 months of each other and using the same completion methods. I think this well will produce ~400,000BO and 4-5BCFG. I will take that all day long. One other note this well was completed BEFORE the latest completion designs which I have noted here routinely increase production 30-50% and sometimes over 100% compared to adjacent wells for the comparisons period. Lastly the operator has recently made a offer to purchase our WI, the offers suggest they are looking at the production numbers we are, otherwise its pretty hard to justify the amounts.
What was the full cost of the well including land and infrastructure?
Was it 9 million?
An upwards angle on US LTO Production Trajectory?
https://seekingalpha.com/article/4130776-shale-oil-myths-u-s-production-struggling-grow
My Take
1. Beware of underestimating US Oil Patch Ability “?Desperation” to surface Oilystuff
2. Results reporting is impacting investing. Destination :: Camp Winner or Camp Looser?
3 . Twilight zone: will ROI/Payout realities be Trumpted by Propaganda storms?
4. WTI Price Rules
Image from Article>
Forties update
2017-12-13 Reuters – Ineos tells customers that the shutdown of Forties Pipeline is likely to last “several weeks” rather than days – source familiar with matter. Ineos is planning to shut down 110,000 bpd crude unit at Grangemouth oil refinery early next week – trading sources
Looks like they have kept the pipe full and slightly pressurised and will be able to fix it with a clamp, which will save a lot of time compared to a full intervention, and unlikely to be similar failures elsewhere.
George, where is your source for this? thanks
Check this one out: The End of the Texas Tea Party This will blow your mind.
“The increase in completed wells and the substantial drop in legacy wells potentially indicates that new well production is increasingly cannibalising legacy production. The level of legacy decline is very significant issue. Permian producers have struggled to stay ahead of the legacy decline of the field.”
The rest of the article and charts will open your eyes. Check it out.
Ron. Thank you for the link.
I think one explanation for the decrease in Permian wells is that, due to the oil price crash, many marginal wells have been shut in. These are mostly older vertical wells.
I might be able to get some data together on how many vertical Spraberry wells have been deactivated since 2014, for example.
We tend to forget Pioneer, etc all are stripper well operators. Most of the areas where Pioneer and other companies are drilling have many, many low volume vertical wells.
Pioneer operates over 6,000 low volume wells in the Permian Basin, for example.
So, in reality, these companies could be canablizimg their own wells by over producing and keeping a lid on WTI.
Here is some data, however, take it with a grain of salt because there could be several injection or salt water disposal wells included that skew the data, as well as many gas wells that could skew the data. There are other reasons why the data may not be the best, that have to do with ownership transfers, etc.
For the following companies: PXD, EOG, XOM, CVX and OXY, I show that, combined, these companies operate 49,383 wells in the Permian Basin.
Of those, 45,355 are vertical wells.
Of those vertical wells, 21,980 are shown as active, meaning that there has been production of oil or gas sold from them in the last year.
Of those active vertical wells, 14,854 produced 450 BO or less in the most recent month reported.
Of those active vertical wells , 78 are shown to have produced in excess of 3,000 BO in the most recent month.
Removing XOM, CVX and OXY cleans up the data quite a bit, as large water floods and CO2 floods are pretty much removed. I do not think EOG or PXD operate secondary or tertiary recovery projects in the Permian Basin.
EOG and PXD are shown to operate 13,674 vertical wells in the Permian Basin.
Of those, 8,147 wells are active.
Of the active verticals, 6,388 produced 450 BO or less in the most recent month.
Of the active verticals, 1 produced over 3,000 BO in the most recent month. That is well #3 on EOG’s Shannon Hospital 1 lease, located in Crockett County, TX.
It appears this well has been a tremendous well, with cumulative production from the Lower Wolfcamp of 1,119,381 BO and 260,645 MCF since August, 2006.
In September, 2017 the well is shown to have produced 4,680 BO, 1,872 MCF and 6,109 BW. The well has a TD of 6,200′, with upper perf at 5,820′ and lower perf at 5,835′. The kind of well us conventional guys dream about.
To narrow down to just PXD, they are shown to have 11,169 operated vertical wells in the PB, with 6,210 active, with 5,681 producing 450 BO or less in 9/2017 and zero producing over 3,000 in said month.
It appears PXD’s best vertical well is well #8 on the Cowden 40-B- lease in Midland County, TX, with cumulative production of 195,888 BO, 2,422,259 MCF and 9/17 production of 2,712 BO, 49,079 MCF and just 52 BW, with all of that production coming since 7/2014. The well has a TD of 11,580′, upper perf of 9,334′ and lower perf of 11,526′ Again, a stellar well.
Again, please do not hold me to complete accuracy on these numbers, but I am confident they give somewhat of a picture into vertical wells in the PB.
Thanks shallow sand,
Also of interest might be the split in number of vertical/horizontal wells for the companies you mention (or just EOG and PXD) as well as the vertical/horizontal output split in the most recent month reported.
The impression I have is that not very many new vertical wells are being drilled in the Permian basin lately (or a lot fewer than in 2014 and earlier), am I correct that most recent development is horizontal wells?
Hi Ron,
I think the piece is wrong on many levels. One basic problem is the EIA’s drilling productivity report is just not very good. Many analysts look at the report and assume they are looking at data rather than a model. The model is flawed and the “legacy decline” is not something that is actually measured in the DPR it is simply a model result which probably does not reflect reality.
I trust the data. See tight oil production estimates at page linked below
https://www.eia.gov/petroleum/data.php#crude
I add up Permian Basin output to create the chart below. Note that I don’t assume anything about the future in this case, trends can change, but if oil prices increase as I expect (to at least $80/b in 2017$ by Dec 2018) the current rate of increase of 360 kb/d each year might be maintained until 2023 (assuming continued price increases to over $120/b in 2017$ by Dec 2023). That would lead to an overall increase in Permian Basin output of about 2 Mb/d to about 4 Mb/d by Oct 2023, if my guess proves accurate (which I believe is a coin flip for whether actual output will be above or below this WAG).
The model is flawed and the “legacy decline” is not something that is actually measured in the DPR it is simply a model result which probably does not reflect reality.
Okay, that statement needs to be explained further. Legacy decline is simply the decline of all wells that did not come online the latest month. It is a simple measurement. It is simply the difference between last months production and production this month less production from new wells.
Legacy decline is simply the decline of all legacy wells. That is the decline of all wells that did not come online this month. If you have a field where no new wells came online this month, then all decline would be legacy decline. Legacy decline would simply be the difference between last month’s production and this month’s production. Of course, if you had wells taken offline for maintenance, then a correction would have to be made for that, as would for wells that came back on line after maintenance. On the other hand, if you had a well taken offline, permanently, because of low production, then that would simply be part of legacy decline.
Basically, legacy decline is just a fancy term for “decline”.
Hi Ron,
Do we have data on this month’s production from new wells?
I am pretty sure this number is based on modelled output rather than actual output. In any case, my main point is that so far Permian LTO output has showed no signs of slowing down based on actual reported data, another problem with the DPR is that it gives us output for “regions” where conventional and LTO are together.
The DPR does a poor job of projecting output in my opinion and the paper you linked mainly uses DPR data.
Perhaps oil prices will drop and fewer wells will be completed in the Permian basin, I doubt this will be the case for another 5 years or so.
Continental Resources has 93 wells for sale in Garfield Co., OK that are producing from either the Mississippian or Woodford formations. They operate most, but do not have 100% GWI in most. Several appear to be shut in. Most data requires a CA, so not a lot of information, but would note that last six month average monthly net for these interest amounts to $56,662 per month.
So not everything in the OK resource plays works out well, it appears.
Sounds like the Bakken is having problems finding new investors, so North Dakota is going to get USGS to calculate a new estimate of how much oil is there.
Bakken to get new estimate of oil resources
By Renée Jean [email protected] 23 hrs ago
http://www.willistonherald.com/news/bakken-to-get-new-estimate-of-oil-resources/article_5c8ff792-dfbb-11e7-af8f-530adb449aae.html
The last study USGS did was in 2013. It found 7.38 billion barrels of technically recoverable oil and gas in the Bakken and Three Forks shale layers. But these days, Bakken oil wells are producing roughly double what a 2011 well did as soon as the seventh month of production. This is a strong indicator that a new estimate will be much higher than the 2013 estimate, state leaders have said.
They and North Dakota’s Congressional delegation have been pressing the USGS to do a new study sooner than the one scheduled for 2020, and on Monday the agency agreed .
Ron Ness, president of the North Dakota Petroleum Association, thanked the delegates for their efforts and said the study is important not just to the oil and gas industry.
“When you look at the development of Williston and other communities, this is something that developers can look at and consider,” he said, “and hopefully it gives them confidence that there is a tremendous future in the Williston Basin. Not only the Bakken, but other targets as well.”
The study will look only at new recoverable resources, Ness said, not any that have already been proven and identified. So the new number could be smaller than the old, but that is on top of what was already here.
“This is important across the board as we look at the infrastructure buildout across North Dakota,” Ness said. “It’s a signal to investors that the Bakken is still a world-class resource.”
The Bakken is a has been, and North Dakota politicians will regret allowing such a fast development pace. This is an excellent example of what some call “the devil’s excrement” problem.
Hi Cats,
Check this post by Enno Peters at shaleprofile.com
https://shaleprofile.com/index.php/2017/11/21/north-dakota-update-through-september-2017/
The chart below is taken from Enno’s blog and I have added trendlines by eye for 2014 to 2016 (first flow) average wells. Wells are grouped by year rather than by quarter to simplify the analysis.
There has been much less improvement in average new well EUR than some seem to believe, perhaps only 10% or so (350 kb to 385 kb). I doubt there will be a significant increase in the TRR estimate from the 2013 estimate, possibly 10% which would take it from about 10 Gb (North Dakota Bakken/Three Forks URR) to 11 Gb. Remember the USGS 2013 report gives undiscovered TRR (UTRR) for all of the Bakken at 7.4 Gb, the North Dakota portion was estimated at 5.8 Gb and there was about 4 Gb of proved reserves plus cumulative output at the end of 2012 which must be added to the UTRR to get the TRR (5.8+4=9.8, which I round to 10 Gb). An extra Gb is not really a big deal.
By 2030’s the Bakken region that increased development due to oil money will be a bunch of zombie towns with abandoned buildings and failed economies as the oil production fails. The legacy of abandoned fracking and wells over the whole countryside will be the final reward to the people there.
I have seen this happen in other areas with extractive economies, some have not recovered 50 years after the failure, in fact lately some seem to be going even further economically downhill.
I don’t know why, but places seem to never be able to revert to their former state, especially rural ones. They just become depressed areas.
Is this one of these windy plains? They could then plant wind engines on all the abandoned drilling towers – wait, oil isn’t like back in the 1900s.
Sure, more wind turbines will be added in North Dakota. It’s a windy state. Not sure how that effects the overall economics and housing demand though in the Bakken region. Once the turbines are up, not many people needed to operate and maintain them. The oil rush allowed lots of building and new business to boom in otherwise small town and rural areas due to the many new people required in the area and the many people trucking in supplies.
Some people will make money on wind towers by leasing out their land, the rest will just keep paying electric bills as always.
World Bank to end financial support for oil and gas exploration
The Bank ceased lending for coal-fired power stations in 2010 but has been under pressure from lobby groups also to halt the $1bn (£750m) a year it has been lending for oil and gas in developing countries.
The Bank said it saw the need to change the way it was operating in a “rapidly changing world”, adding that it was on course to have 28% of its lending going to climate action by 2020. At present, 1-2% of the Bank’s $280bn portfolio is accounted for by oil and gas projects.
It says exploration but I think most of the investment is for development of major projects in Africa and Asia (e.g. base load LNG plants and the like).
https://www.theguardian.com/business/2017/dec/12/uk-banks-join-multinationals-pledge-come-clean-climate-change-risks-mark-carney
Hi George
Looks like the inner moray firth could see some renewed activity in 2018.
http://www.offshore-mag.com/articles/2017/12/farm-in-could-lead-to-well-on-north-sea-wick-prospect.html
IEA december oil market report is out: https://www.iea.org/oilmarketreport/omrpublic/
OECD stocks are down (-40.3 mb), US LTO is assumed to grow more rapidly than previously expected, oil market is assumed to be in surplus in 2018H1 (+200kbd) and deficit in 2018H2 (-200kbd).
“OECD commercial stocks fell 40.3 mb in October to 2 940 mb, their lowest level since July 2015. They are now 111 mb above the five-year average. Chinese crude stocks likely fell in October for the first time in a year. Preliminary global stocks data for November shows a mixed picture.”
“Recently, US drilling activity and well completion rates have picked up again, suggesting higher production to come in a few months. Consequently, we have raised our annual growth forecast for total US crude oil to 390 kb/d this year and 870 kb/d for 2018. Impressive though this seems, according to recent investor updates, the new mantra in the US shale regions is “moderation”, reflecting a desire to greet stronger prices as an opportunity to consolidate rather than to launch yet more headlong expansion. The flexibility and ingenuity of the shale sector raises challenges to forecasters. Even so, when our US outlook is added to expectations for the other producers, output from non-OPEC countries could rise by 1.6 mb/d in 2018, an increase of 0.2 mb/d to our forecast in last month’s Report.”
Looks like Dennis Coyne’s prediction of peak oil around the 2020-2025 time frame is most likely.
Of the 14 OPEC countries only Saudi Arabia, U.A.E, Kuwait, Libya, Iran and Iraq can produce more oil. The rest are now flat or in decline and therefore with increasing domestic consumption their exports will diminish.
The number of non OPEC countries who can increase production is very small, the United States being the country that is single handedly keeping non OPEC production from falling. Once the United States reaches a new high in 4 to 6 years, any increases from Brazil, Canada, Russia? will not make up for falling production in other countries.
If global oil consumption continues to increase at the current rate, then global supply will not meet demand by 2024 and probably earlier.
Hi Peter,
There are many different possible scenarios depending on oil prices and how fast the world transitions to non-ice transport. One possibility is a long undulating plateau as Ron Patterson suggests (80-82 mb/d.) Under this scenario, my guess is that oil prices rise enough to curb World demand and lead to a rapid transition to other forms of transport (EVs, plugin hybrids, electrified rail and light rail) and greater fuel efficiency (smaller hybrid ice vehicles). Where the peak is on such a plateau is the question?
Some will say it is the start of the world C+C plateau (which could be 2015 of we round to the nearest whole digit in Mb/d) some might say it is the end of the plateau (possibly as late as 2030), I would pick the middle (2022/3) which is still 2020 to 2025. My best (current guess) is 2025+/-2 years at a peak output level of 84+/-2 Mb/d, a higher output like 86 Mb/d is more likely to lead to steeper decline after the peak and a lower peak (82 Mb/d) is likely to lead to a more gradual decline for any given URR (best guess about 3400 Gb of C+C including oil sands and World LTO).
Hi Dennis
Where are you getting your C and C figures from?
Also even if diesel doubles in price I would still be able afford the Diesel as it would cost me an extra £4 per day. A new electric car is £25,000 and totally out of my reach.
Thanks
Hi Peter,
From my models and with URR’s based on the work of Mohr and Laherrere.
See
http://peakoilbarrel.com/oil-shock-models-with-different-ultimately-recoverable-resources-of-crude-plus-condensate-3100-gb-to-3700-gb/
Note that this model was my guess based on what I knew 2.5 years ago.
Since that time the extraction rates for the 3400 Gb scenario proved too conservative as current output is above the peak in that scenario.
In the model presented below the extraction rate is for conventional C+C only and does not include oil sands or LTO output. The previous model included LTO and only modelled extra heavy oil separately.
The scenario has 2700 Gb conventional C+C, 500 Gb of extra heavy oil (Canada and Venezuela oil sands), and 100 Gb of LTO (50 Gb US and 50 Gb ROW). Peak is 2026 at 86 Mb/d and I would consider this optimistic as in a low probability (25% or less) that the peak will be higher.
My C+C data is from the EIA from 1960 to 2016 and figuring backward from carbon emissions from liquid fossil fuel prior to that.
On fuel prices and EV cost. The price of EVs will decrease and the price of petrol may rise by a factor of 3 by 2030, each individual will have to decide how best to spend their money.
By 2030 there will be used EVs to purchase. For now a $35,000 dollar car is out of reach for many, prices will fall to $20,000 by 2025 (new car price) and a decent used vehicle maybe 10k.
Hi Dennis
I can only find data for all liquids, do you have a link please.
The model is a useful tool for giving an approximate level of production and when we may expect production to start to decline. However does it not assume that all countries have been producing oil with similar extraction rates?
If a country such as Iraq has large reserves but it’s production has been severely reduced for 30 years. When allowed to produce to it’s full capacity, does that not skew the data?
Hi Peter,
The model assumes there is some average extraction rate from World proved producing reserves.
EIA data from 1973 at
https://www.eia.gov/totalenergy/data/browser/index.php?
tbl=T11.01B#/?f=A&start=1973&end=2016&charted=0-11-12
Earlier data (1960-1972) at document below
http://cdn.ca9.uscourts.gov/datastore/library/2013/02/26/California_crude-oil.pdf
All of this data is World C+C.
Prior to that I use
http://cdiac.ess-dive.lbl.gov/ftp/ndp030/global.1751_2008.ems
and convert from carbon emissions to consumption (on average over this 1751-1959 period I assume production is equal to consumption and that non C+C liquids output is zero.
The model is not perfect (far from it), but it’s the best I can do with very limited data.
Some places have very high extraction rates (US) others have very low extraction rates (Iraq).
The model just finds the World average over history (based on model assumptions about how fast discoveries are produced, time from discovery to production). This might also change over time, the model assumes after 1950 this has remained relatively constant for the World average.
This assumption can be changed and would result in lower extraction rates (if we assume a shorter period between discovery and production.)
There are many assumptions built into this model, any of which could be incorrect.
Think of them as scenarios built on underlying assumptions.
Different assumptions about time from discovery to production, result in different historical extraction rates, also assumptions are made about future cumulative discoveries, which may also prove incorrect.
All of this merely changes the shape of the future production curve.
Another assumption is future URR (I have assumed 3400 Gb),this affects the area under the production curve. Higher URR increases the area, Lower URR decreases it.
For any given URR assumption this area will be fixed and the shape will depend on extraction rate and assumed time from discovery to production as well as the shape of the cumulative discovery curve.
First link didn’t work correctly
See table 11.1b at link below
https://www.eia.gov/totalenergy/data/monthly/index.php#international
this gives World C+C 1973 to 2016.
Hi Dennis
Thank you for the information, very useful.
I think some people have tried to be too precise about dating peak oil.
What I realised some time back is that the difference between educated low and high estimates do not change the date of peak very much.
Given all the uncertainties of data and other variables an estimate of 2020 to 2030 is quite adequate.
Real historical data shows how peak oil has claimed one country after another.
In 1990 only a handful of the top 60 oil producing countries were in decline. By 2010 the majority have gone into decline. Today 40 of the 60 are in decline. That should speak volumes to those who don’t see peak oil coming soon.
Obviously available exports are key and hardly 10 counties can increase exports to supply the world where most countries need to import oil to keep their economies going.
The change in outlook over the last 20 years has been staggering. The next 10 years will leave most people utterly bewildered.
Hi Peter,
I think a focus on output is more important than net exports. The amount of oil that any given nation will export will depend on their internal consumption of oil. As oil prices rise exporting nations may choose to stop subsidizing oil consumption at home (where prices are often far below international average prices for liquid fuel).
If that happens consumption of liquid petroleum in net exporting nations may fall (or at least grow more slowly) and more oil will be available for export.
For this reason I find the Export land model less than satisfying and think a focus on World output of crude plus condensate requires fewer assumptions.
There’s no technical reason whatsoever that we can’t be driving ice powered cars that get very close to a hundred mpg anytime a major car company decides to build one. All that is needed is to switch from the side to side two seat passenger area design to a much narrower two seat fore and aft layout, and to use a lot more aluminum and other light weight materials.
Remember when the minivan sales exploded, when station wagons and ordinary vans just didn’t turn new car buyers on anymore?
I’m guessing at least fifty million households in the USA either own two or more cars, or can easily manage with one two seater.
Such a car could be a plug in hybrid and it could run well over a hundred miles on a very modestly sized battery. With one the size that’s going into the new all electric Chevy Bolt, it would run four hundred plus miles.
AERO drag is the factor that EATS fuel and or kilowatthours.Weight is secondary.
If any major car company sets out to build such a car within the next few years, virtually every component will be as easily sourced as any component of any other car, with the battery being the only likely exception, if the battery companies can’t keep up with demand. The machinery used to make fenders for trucks can be used to make fenders for cars, etc, simply by installing a new set of dies, etc.
I’ve given up on trying to decide how long oil will be plentiful and cheap, having learned my lesson some years ago when I was pretty sure diesel would be ten bucks a gallon by now, lol.
But one things FOR SURE. We know how to build cars TODAY that will run on half as much fuel, or less, as today’s cars, and maybe even as little as a quarter as much.
And if we really feel the need, we can build trucks that run on half as much as well, soon, by running them at lower speeds and thereby making it possible to haul more net cargo in relation to the weight of the truck itself. It won’t hurt the bottom line if an autonomous truck takes an extra hour to get from A to B, by slowing it down ten or fifteen mph saves ten gallons of diesel, or an equivalent amount of battery charge.
And of course pure electric cars aren’t going to use any oil at all, other than a barrel or two per car used indirectly during the manufacturing process and a trivial amount later on for tires.
Plateauing oil production isn’t necessarily going to be the economy killer some people think it will.
OFM
There are 1,300,000,000 cars, vans, trucks and buses on the roads of the world.
In approximate numbers, 50,000,000 are scrapped each year and 100,000,000 new vehicles are sold.
http://www.oica.net/category/vehicles-in-use/
In order for global oil consumption to stay flat, I.E. not drive up prices due to additional demand, all the new vehicles would have to use half the petrol/diesel that scrapped cars used.
At the moment these are the cars sold.
http://focus2move.com/europe-best-selling-cars/
They will all be on the road needing petrol and diesel just as global oil production peaks. If oil production peaked in 2025, in 2026 no more Ford F series could be sold or Dodge Rams. They would have to be taken off the forecourts and crushed.
http://www.wsj.com/mdc/public/page/2_3022-autosales.html
If that were not done, global consumption would still want to increase and the survival of the fittest or rather richest will ensue.
Also many countries cannot produce enough food to feed their populations. The movement of food requires vast amounts of oil and the global population is growing by 80 million each year.
If the global population were static peak oil would still be a difficult problem to deal with. In a world where there will be an additional 1,000,000 people in 13 years will see great hardship for many.
Obviously population will be 1,000,000,000 more in 13 years.
Dennis
Subsidies have led to profligate consumption in some countries, most of these countries are removing these subsidies. However the increase in population will undo any saving in oil consumption.
http://worldpopulationreview.com/countries/saudi-arabia-population/
Saudi Arabia had a population of only 10 million in 1980 now it is over 30 million. In 2030 there will be 40 million Saudi all consuming their share of petrol, diesel, gas, water and imported food.
Hi Peter,
Iran has TFR (total fertility ratio) under 2.1, they did this in about 15 years, Saudi can do the same.
Hi Dennis
The population of Iran is now 80 million and at the lowest estimate to increase to between 90 million by 2030.
The population of the world has grown from 4.4 billion in 1980 to 7.4 billion now.
It will be 9 billion by 2040 and any energy saving policies will be overwhelmed by this shear weight of numbers.
Very interesting talk which explains how even a small percentage increase per year has such a large impact on actual numbers
https://www.youtube.com/watch?v=sI1C9DyIi_8
Hi Peter,
World output of oil per capita decreased from 2004 to 2011 at an average rate of 1% per year. World population grew at 1.2% per year over the same period.
The rise in population will gradually decrease to zero and then decline (peak around 2070). As growth of oil output per capita falls short of growth in oil demand per capita, oil prices will rise to the point that oil demand per capita will fall more rapidly than 1% per year.
Population growth rates in the future, and future changes in oil demand and supply and oil prices are all very difficult to predict precisely.
In general I would say that all of these things will peak and decline with dates and rates unknown.
Hi Dennis
Per capita oil consumption has been decreasing since the early 1980s.
https://ourfiniteworld.com/2012/03/12/world-energy-consumption-since-1820-in-charts/
However as you can see in figure 2. The amount of energy from all sources has gone up mainly due to gas and coal.
This statistics are of interest academically, but utterly irrelevant in understanding what is going on in individual countries and for middle and working classes in those countries.
Syria was able to subsidize fuel to farmers until it’s oil production started to fall. When it made cuts, the farmers could no longer afford to irrigate the land. Less crops impacted the local poor. That is why they started to protest and riot, they were facing hunger.
Peak oil in many countries will not be the nice transition to electric cars as some people think. It will be like Syria.
Libya oil production peaked in 2008, again this led to cuts in welfare payments etc. People are now fighting and dying for a smaller share of the cake.
In the Untied Kingdom, the 1990s were prosperous, oil and gas exports reduced taxes and cheap energy helped businesses. Now many factories have closed due to high energy prices. Despite taxes rising there are cuts to policing, N.H.S. and care. People are getting very angry and politicians have no solutions.
except – the biggest set of profligate consumers – the US – just got its head lopped off on the chopping block. the level of austerity imposed by the new tax bill should put the US quickly on the road to Greece (well, at least those who don’t own a house on the coasts or have a trust fund.) Mass shootings to increase – check. Opioid deaths to increase – check. Suicides and car accidents – check. Fuel consumption? Maybe not.
to ponder – can you really call it (class) warfare if only one side is fighting?
The very wealthy really don’t need most of the world’s people. They probably don’t think to themselves, “These policies will kill off a lot of the unnecessary people,” but they don’t appear to have much concern as to the welfare of the masses.
I keep thinking a global balance recession or depression will put a significant damper on fossil fuel consumption.
OFM Wrote:
“There’s no technical reason whatsoever that we can’t be driving ice powered cars that get very close to a hundred mpg anytime a major car company decides to build one. All that is needed is to switch from the side to side two seat passenger area design to a much narrower two seat fore and aft layout, and to use a lot more aluminum and other light weight materials.”
Try it next to a full loaded semi going 20 miles over speed limit while the operator is on a cell phone. Ditto for the Drunk/texting driver next to you in a SUV.
FWIW: There are already tiny commuter cars like the smart car.
DC wrote:
“world demand and lead to a rapid transition to other forms of transport (EVs, plugin hybrids, electrified rail and light rail) and greater fuel efficiency (smaller hybrid ice vehicles). Where the peak is on such a plateau is the question?”
Unlikely:
1. No sustained transition was made when oil prices began rising in 2000 and peaked at 147 in 2008. Many politicians will defer changes, thinking another tech breakthrough in oil extraction will happen like shale LTO.
2. World debt has doubled in the past 10 years. All those debts depend on abundant low cost energy.
3. Aging demographics in the industrialized world. The Boomer generation is not limited to the USA.
The globe should have entered a global depression from rising energy prices and excessive debt loads. To delay the crisis, Central banks dropped interest rates to near zero, and interest rates have remained low since 2008, which provide the means for debtors to service their debt. However instead of using the lower rates to pay down debt, debtors doubled down increasing there debt, and now they are approaching the same debt loads as they did in 2008. When another recession happens they will again be able to service their debt. But this time lowering rates is probably not an option since rates can’t go below zero. The Industrialized world has painted itself into a smaller corner. Central Banks may not be able to save the day again.
It usually very difficult to replace infrastructure when nations are facing excessively large debts & aging populations (especially when aging populations are promised unfunded/underfunded entitlements & pensions plans)
Hi Tech guy,
The important metric is not total debt it is debt to GDP.
Using data from BIS:
https://www.bis.org/statistics/totcredit.htm?m=6%7C380%7C669
From 4Q2013 to 2Q2017 11 trillion of 13 trillion in increased debt levels (to all non-financial sectors) was in emerging market economies.
This may simply reflect better access to credit in those economies as they develop.
The aging population holds most of the wealth in the World, as they die the assets are transferred to heirs, charities, or collected by the government.
The transition will occur when oil prices become high and stay high and after the peak (around 2025) this will be the case.
A severe recession (2030-2040 is my guess) may result from fossil fuel scarcity, governments might take good policy actions to speed the transition to non-fossil fuel energy in response, thereby reducing the length of the recession.
Or they may choose to reduce government budget deficits in response (the Hoover approach) and thereby lengthen the recession.
The level of spending of WW2 (as a percent of GDP) applied to an energy transition is the proper response to the impending crisis in my opinion.
You are correct that this may not happen and may also be correct that it is unlikely, it’s possible nonetheless.
“The level of spending of WW2 (as a percent of GDP) applied to an energy transition is the proper response to the impending crisis in my opinion.”
You’re forgetting demographics as there was boomer generation that fueled growth, along with growth in resources (energy, food, metals, plastics). Plus the US entered WW2 with virtually no debt. The US had close to a balanced budget. After the War, the US had the only industrial base untouched by war damaged, and supplied the rest of the world manufactured goods. But by the 1970’s Europe and Asia completed rebuilding thier industrial based and no longer were reliant on US manufacturing.
“A severe recession (2030-2040 is my guess) may result from fossil fuel scarcity, governments might take good policy actions to speed the transition to non-fossil fuel energy in response, thereby reducing the length of the recession.”
Most gov’t will be insolvent by then and collapse. My money is on another world war when the reset does come, as gov’t will seek to obtain resources they need from other smaller/weaker nations. Perhaps future historians will predict world war began in 2001 when the US started invading the Middle East. Its a cold/proxy war that will lead to a hot World war once the smaller states are all occupied or stripped of resources.
“From 4Q2013 to 2Q2017 11 trillion of 13 trillion in increased debt levels (to all non-financial sectors) was in emerging market economies.”
Can you honestly believe that the debts owed will every be paid back? The US has over $20T in debt and runs an annual deficit of about $1T USD. Europe and Asia are not in any better shape.
Hi Techguy,
The debt is just rolled over, the economy grows, not as much of a problem as you seem to think.
Also at the World level (I will assume no ETs) every liability is matched by an asset of equal value. Defaults on debt happen all the time, the person holding the liability wins, the person holding the “asset” loses, no more no less.
At the beginning of WW2 (Dec 1941) for the US Debt to GDP was 44.5%, currently it is 104% and could be raised to Japanese levels of 239% of GDP, if necessary.
The 20T in debt is about 102% of GDP.
I do agree while the economy is currently doing well it would be better to raise taxes and reduce the deficit or cut spending, but deficit reduction at present in the US surely would be wise.
We might agree on that point (about reducing the deficit), it does not matter to me if taxes go up spending goes down or both occur(a potential compromise between conservatives and liberals).
https://fred.stlouisfed.org/series/GFDGDPA188S
https://fred.stlouisfed.org/series/GGGDTPJPA188N
This article got me thinking that as the US government pulls money out of health care, and if fewer people contribute to health insurance, it could be the health care industry is the trigger for the next recession.
https://www.nytimes.com/2017/12/18/health/hospitals-mergers-patients.html
And this article from April says as much.
https://nypost.com/2017/04/30/the-health-care-industry-is-bound-to-collapse-soon-experts-say/
While governments might be willing to print money to keep the oil flowing, if they aren’t willing to fund health care, and health care is a major part of the economy, it could get bad in a hurry.
Hi Boomer,
Premiums simply go up for those with insurance to cover all the unpaid bills from those with no insurance. Possibly some hospitals shut down, especially in rural areas where hospitals are less profitable.
Hey if we are going to have a third world health insurance system, we will get third world health care outcomes. That’s the choice that the minority of voters that elected the president and that hold the majority in the legislature (with a minority of total votes) have made.
Unfortunately in the US it is not majority rule.
I’ve expected premiums to go up for years and they have. People drop out of the system, and those that are left pick up the tab.
What I didn’t factor in until the latest budget proposal are these issues:
1. The government may start pulling money from healthcare, claiming it must do it to balance the budget.
2. A number of hospitals are running into problems, and will lay off people, shut down, or get bought out (which may not turn out to be profitable for the buyer).
3. With problems in the system already and the government pulling money, jobs in healthcare shrink, then the value of the companies goes down, communities with healthcare companies and hospitals are affected, etc., it spreads throughout our economy. Healthcare contributes close to 20% of the US GDP, so when money starts to disappear from that sector, there will be disruptions.
Here’s an article about bankruptcies in the healthcare industry. This might be the trigger for the next recession.
https://www.bloomberg.com/news/articles/2017-11-27/next-u-s-restructuring-epidemic-sick-health-care-companies
Hi Boomer,
When people can no longer get adequate access to healthcare and insurance premiums start to rise more quickly, people may look back wistfully at the Affordable Care Act and wonder why everyone thought it was so terrible.
Perhaps a majority of US citizens will be represented by a majority of legislators that will represent them and possibly things will change in 2020.
There are many things that could cause a recession, poor public policy on health care is one of many possible problems, poor energy policy and environmental policy are other possibilities.
Here we focus on the possible disruptions from energy and climate change. And we speculate when those will manifest themselves.
Other than reading the on-going discussions about healthcare insurance, I hadn’t given much thought to what would happen as a result of cuts in government funds to healthcare.
But now with the changes coming with tax reform, and Ryan’s plan to cut Medicare, SS, and Medicare, and the precarious state for many hospitals, I see that an economic crash is likely to come in the healthcare sector before peak oil or climate change disruptions.
Some people believe the government will do whatever it takes to prop up fossil fuels. But it doesn’t look like it would do the same for the healthcare. So this might be economy slayer that sneaks up on us.
While we are monitoring the health of the energy sector, healthcare could collapse.
Study: Proximity to Pa. fracking wells linked to lower birth weight
After combing through a decade’s worth of Pennsylvania birth records, researchers have found that pregnant women living within two-thirds of a mile of a hydraulic fracturing well were 25 percent more likely to give birth to a worryingly small infant than were women who lived at least 10 miles outside that zone during pregnancy.
Over these babies’ lifetimes, their low birth weights raise the likelihood they will suffer poorer health and lower achievement, including reduced earnings and educational attainment.
The authors of the new research estimated that 29,000 of the close to 4 million annual births in the United States – roughly 0.7 percent of babies born each year — were to women who lived within about two-thirds of a mile of a hydraulic fracturing operation during their pregnancies.
The study was published Wednesday in the journal Science Advances.
Pennsylvania is a beautiful state with large preserved forest areas, streams, and mountains. However, Pennsylvania has a long dark history of encouraging polluting and environmentally destructive industries. Steel, coal, oil, natural gas are or were highly encouraged and the environment becomes secondary or even ignored. Coal made it’s mark across the land and still is, but the new fracking for natural gas has spread across the rural regions at a tremendous pace.
Now the Marcellus fracking has moved across the Pennsylvania rural landscape like a plague of locusts. The industrial takeover of states is not a new phenomenon but it goes against the direction that the US was headed toward, a safer and cleaner environment.
https://www.fractracker.org/map/us/pennsylvania/pa-shale-viewer/
Reuters 2017-12-14 – Investors pour cash into U.S. shale despite questions on returns
Hedge funds and private equity firms have given producers a range of new and traditional financial levers they can pull as needed to keep shale rigs drilling, according to interviews with more than a dozen financiers, advisers and executives. The money continues to flow despite rising pressure from some investors for drillers to prioritize better profit margins over expanded production.
Through the third quarter of this year, private equity firms have put $20.26 billion into energy-related deals, 36 percent more than all of last year, according to financial data provider Preqin. Initial stock offerings for U.S.-listed oil and gas firms raised $2.93 billion this year, up from $1.52 billion in 2016, according to Thomson Reuters data.
https://www.reuters.com/article/us-usa-oil-finance/investors-pour-cash-into-u-s-shale-despite-questions-on-returns-idUSKBN1E80JV
FT 2017-12-14 – US exploration and production companies have raised more from bond sales in 2017 than in any year since the slump in oil prices began in 2014, shoring up their finances to support drilling and production growth.
Companies in the sector have raised just under $60bn in bond sales so far this year, already a 28 per cent jump from 2016, according to Dealogic. Over the past three weeks, Whiting Petroleum, Continental Resources and Endeavor Energy Resources have each raised $1bn in debt.
(one article free) https://www.ft.com/content/5469ca98-e065-11e7-8f9f-de1c2175f5ce
Energy News,
What about equity investments? Many shares of Shale companies hover at record lows. I cannot belive that equity investments increased as well from last year.
With equity investments I mean public equity investments. There is currently panic in Shale stocks. Investors stampeding out of these stocks. Just today RRC – one of the largest producers in the Appalachian Basin fell to its all time low – shedding already over 80% from its peak. This is not a sign of strength and confidence. Get out while you can.
RRC’s last earnings report indicated lower well productivity. The Marcellus companies have been drilling the sweet spots out. Their purchase of MRD very similar to OAS recent purchase and SWN purchase of Marcellus acreage. Just an attempt to mask upcoming poor performance at legacy acreage. The NE portion should be turning over very soon. Patzek and guys from the University of Texas looked at the Marcellus at a much more detailed level than EIA. They predict Marcellus topping out 2018-2019.
I keep wondering how much of this new money will be used to refinance (roll over) old debt? I didn’t see any mention of that in the news. We’ll have to wait and see if the E&P companies increase their 2018 Capex guidance.
Mike and shallow
I am trying to find out about the status of Pergerson Energy llc this is the latest information I have been able to find.
http://www.rrc.state.tx.us/media/39709/20-0304703-pergerson-energy.pdf
I know you have access to the most recent information so do you know if the situation has been resolved. I am asking because the company claim to have worked over and restored one of the wells to production.
Thanks.
Follow up: properties are still operated by Pergerson. No production through September.
Go to Texas RRC website, type in Pergerson on search bar right hand corner.
Oil Man (French), translation not perfect.
← The moment of truth (1/2)
January 03, 2017 , by Matthieu Auzanneau
The moment of truth (2/2)
[ first part ]
The combination of Exxon and the Kremlin is a symptom of the physical limits to growth.
According to the International Energy Agency and HSBC, it is necessary that the prices of the barrel go up, and quickly, if not the peak oil is likely to be for immediately.
But can the prices of the barrel go up quickly?
So, Donald Trump claims to be the head of the American diplomacy the boss of the oil giant Exxon, Rex Tillerson. Not sure that the Senate validates this appointment, while the CIA and the NSA say that Vladimir Putin, Exxon’s crucial partner, has managed to influence the US presidential campaign in favor of Trump.
This choice of the new American president, whatever happens, is symptomatic of the question discussed here : are we fighting against physical limits to economic growth?
The Kremlin as well as Exxon are back to the wall in front of this question, and consider each other like emergency exit.
Note that even with Argentina’s decreed oil price, production of oil there has continued to fall.
There is also a new item re Vaca Muerto. Some evidence is appearing that suggests that shale oil is gas.
Also in that paper: Exxon production is slowly decreasing since 10 years.
Aim of Exxon: develop at the cost of hundreds of billion dollars in the next decades two major targets: Russian arctic and shale oil and gas in occidental Siberia.
From HSBC report, 64% of the production is in decline (I guess that want to say fields totalling 64% of the production are in decline).
2017-12-15 U.S. weekly active oil-rig count down -4 at 747: Baker Hughes
And US weekly inventories
North Dakota Director’s Cut
Oil Production: October 1,185,499 barrels/day (preliminary) up +78 kb/day from September
https://pbs.twimg.com/media/DRHG1DjWsAABTfq.jpg
New record for gas.
Odds seem high there is condensate that was flared before and is now C&C counted.
Updated Bakken Scenario based on output to date and using Enno Peter’s data, this may be optimistic, but at least for October the model underestimates actual output.
https://shaleprofile.com/index.php/2017/12/15/north-dakota-update-through-october-2017/
IEA OECD crude oil inventories for September (including NGLs)(metric tons). Split: The USA & the rest of the OECD countries
https://www.reginfo.gov/public/do/DownloadDocument?objectID=49922501
Link to the 914 survey. Clearly stated is that estimates are just fine and dandy. The only penalties associated with it, is if they don’t send in the form. Those are minimal to an oil company. I don’t have much faith in this having any accuracy. This is a primary reason for oil in Texas being reported as almost 3600 barrels for September by the EIA.
Hi Guym,
The 914 survey has matched drilling info data very closely from May 2015 to June 2017. When the 914 survey data is “corrected” by adding 323 kb/d to the 914 survey, we get the following chart.
Texas C+C in Sept 2017 will be 3500+/-50 kb/d
Note that the drilling info data is incomplete by 30 and 260 kb/d for July and August respectively, so I “correct” this data (based on past data) for July and August in the chart below (by 20 and 260 kb/d).
You say 3500, I say 3200. We will get a close idea in three months. That it jumped 200k barrels from Aug is what happens when a hurricane shuts down production for awhile? Really?
If you simply compared the all knowing OZ (EIA) in the first column to the combined RRC initial plus pending leases in the second column, you will get a difference between the two in the third column. The difference is the corrected plus late reported RRC data, which is much smaller than I could tell without the pending lease data. Except for the latest month, which makes absolutely no sense. I agree, up to September, EIA was close enough for horseshoes, but I can’t buy their last month total. Should be closer to 3200, or 3300 max.
3574 3002 572
3381 3172 209
3482 3237 245
3451 3278 173
3434 3178 256
3360 3219 141
3316 3087 229
3321 3103 218
3202 2976 226
3153 2949 204
3171 2972 199
3172 2911 261
3152 2926 226
3170 3003 167
3161 3060 101
3174 2876 298
3193 2821 372
3245 2962 283
3295 3002 293
The difference is also highlighted in their 914 survey data below:
Mar16 2,958
Apr16 2,905
May16 2,864
Jun16 2,846
Jul16 2,837
Aug16 2,824
Sep16 2,805
Oct16 2,830
Nov16 2,826
Dec16 2,812
Jan17 2,844
Feb17 2,943
Mar17 2,940
Apr17 2,968
May17 3,053
Jun17 3,076
Jul17 3,098
Aug17 3,010
Sep17 3,179
Their monthly total, lately, has been the 914 survey divided by close to .89. Which gives the horrible number of 3574 for September. Garbage in. garbage out. Just one large company reporting bad numbers can throw this off.
Hi Guym,
My estimate is 3450 to 3550 kb/d, based on the data I have seen, we will see in a few months if 3200 is correct. For all months from May 2015 to June 2017, the corrected 914 survey result was within 75 kb/d of the drilling info data (which comes from the RRC). So perhaps the Sept 2017 TX RRC data might be 3425 kb/d at minimum, probably less than a 5% chance it will be lower than that in my opinion.
October is out, and initial is back to what it was before Harvey, not higher. Like I said Texas production is likely to be flat to the end of the year. Then kick up about 200k by July 2018. After that, it is dependent on oil price and available services, so Quien sabe? 3480 was normal before Harvey. 3500 would not be unreasonable for normal. It just was not there in Sept. but time will tell.
Hi Guym,
We will see what the drilling info data and 914 survey are at the end of December.
For now based on the pending leas data you shared, Sept 2017 output is about 3355 kb/d, but is likely to be incomplete by about 250 kb/d at least based on past drilling info data, which suggests Sept output of about 3500 kb/d.
I really don’t see where you got 3325 plus 250, because it is nowhere in the data I gave you.
Initial plus pending was 3002. I already estimated another 222 to account for incomplete data. Or, 3224 estimate. Initial plus pending for August was 3172. Adding 222 to that is 3394. August EIA estimate for August was 3381. There was not over a 150k barrel difference all the way through 2016, doing it this way, except for sep 2017.
Hi Guym,
As I have suggested in the past, the initial RRC estimate for the most recent month tells us very little.
The RRC data which just came out has Sept 2017 C+C TX statewide output at 87,243 kb or 2908 kb/d.
The Pending lease output in Sept 2017 was 447 kb/d.
Sept 2017 output = 2908+447=3355 kb/d.
Note that this is the equivalent of drilling info data, which for the most recent month tends to be incomplete by about 260 kb/d.
So final output for Sept 2017 is likely to be 3355+260=3615 kb/d.
This estimate seems too high and may be due to some extra output in the pending lease data that I don’t know how to filter out. From past data from Jan 2017 to July 2017 it seems this RRC total (RRC online plus pending lease) is about 162 kb/d too high.
So subtracting 162 kb from the 3615 kb/d estimate gives us 3453 kb/d. An alternative method (using 914 survey data) gives 3500 kb/d, so potentially 3475+/-25 kb/d is about right.
For a decent October 2017 estimate we will need the 914 survey for Oct 2017 which will be released at the end of the year.
You have the initial Sept. initial incorrect. It was 2553. That is 69,238,482 oil and 7,339,782 condensate divided by 30. If you add 2553 plus 449 (which is what I had for pending) you get 3002. So, all the rest of your gyrations add on bad data, and that’s why it seems too high. Your pulling the September after it has already been increased for October’s posting. It’s updated every month. So, what was once 2553, is now 2908. So, that leaves the late posting to be almost 570k barrels to equal EIA’s estimate. Which I think is unlikely, but a possibility.
Hi Guym,
The Sept 2017 initial does not matter.
As of Nov 14, 2017 the RRC says Sept 2017 TX statewide output is 2980 kb/d, pending lease file through Nov 9, 2017 says output from pending leases is 447 kb/d.
Here’s a question, does the pending lease data plus the RRC online query, initial estimate give the correct result in April 2014?
The pending lease file has 37 kb/d in April 2014, the initial RRC estimate was 2322 kb/d for a total of 2359 kb/d.
Currently the RRC estimates Texas C+C output in April 2014 was 3045 kb/d, so a difference of 686 kb/d.
Ergo, the initial RRC estimate plus pending lease data does not give us a very good estimate of final TX C+C output.
Totally useless conversation, when so many erroneous numbers are used. Condensate before it changed 12/17 was 7,339,782 plus
http://www.rrc.state.tx.us/all-news/120117a/
Equals 2553, or more specifically 2,552,608.8.
And my sum of April pending was not 37, it was 216. The difference was greater than 222, because completions were running at 2,000 a month, not 300.
As for the rest, restating stuff over and over again gets tiresome.
But if we used your stuff with the Real initial we get
3002 plus 260 equals 3260, not far off from my 3224. However, I can’t fathom why after we add, we have to subtract, so I won’t. Still have to come up with some funky calculation to get it up to your 3500, but, who cares?
Yes I agree, I will not comment further.
I explained very clearly where I got the data.
You must be including deleted data in your pending lease estimate.
I explained this in an email, read the documentation on the pending lease file.
You need to sort on the is_deleted_flag and not count output where this has a Y rather than a N.
This is what I get for May 2016 to Sept 2017 for pending lease output, first number is May 2016 the last is Sept 2017:
63.61564516
72.26246667
295.5652258
260.6283548
225.4117
198.5965161
206.0309667
231.1898065
202.8534839
259.5998214
264.3913548
277.5252667
404.945129
456.9401667
515.6141613
482.2056774
447.4336333
Data is in kb/d.
Data for Texas from Jan 2017 to Sept 2017:
Pending, RRC tot, DI, diff RRC-DI
203, 3336, 3196, 140
260, 3483, 3308, 175
264, 3462, 3311, 151
278, 3456, 3324, 132
405, 3586, 3387, 199
457, 3586, 3413, 173
516, 3586, 3415, 171
482, 3370, 3305
447, 3355
Average diff RRC-DI 163, range 132 to 199 kb/d, DI data “corrected” for July and August by 30 kb/d in July and 260 kb/d in August. These amounts are based on saved DI data from May 2016 to Nov 2017 (8 data sets).
Note that RRC total is reported RRC output as of Nov 14, 2017 plus reported pending lease output as of Nov 9, 2017.
All data in kb/d, Jan 2017 is first row of data and Sept 2017 is last row.
For what it is worth this is Dean Fantazzini’s tweet. The numbers are similar to yours.
https://twitter.com/DeanFantazzini/status/942456186741448704
I believe Dean’s estimate will be too low.
We will see in time. Historically the Drilling info estimate has been best except the most recent 2 months (as reported by the EIA), for those months about 260 kb/d and 30 kb/d need to be added to the drilling info data to “correct” for incomplete data.
Actually, mine is closer to EIA’s for every month, except September. I agree with Dennis that EIA was pretty close to right for every month, except September. Going back and comparing EIA to months prior to Feb. they are pretty close to RRC final/Drilling Info.
I actually see most of the reason why Dean’s is too low. The pending file has doubled its normal size the past six months, while the late postings have remained within the 200k or lower range.
On the chart above it was a 160 kb/d increase from August to September, about 60 kb/d was the trend up before the hurricane and 100 kb/d recovery from shut in wells during the hurricane ( or that is my guess).
Eagle Ford wells produce at a rate of 1000 kb/d, so if production was shut in for a week for half of the producing wells (and we assume those wells produce 500kb/d combined) would be 125 kb/d averaged over the entire month of August.
I assume in September those wells were back on line.
Venezuelan production expected to decline half a million barrels in 2018, which would cut their exports nearly in half. Even if the price of oil doubled, at that rate they still wouldn’t have any extra money to pay their bills.
https://www.reuters.com/article/us-venezuela-oil-insight/paralysis-at-pdvsa-venezuelas-oil-purge-cripples-company-idUSKBN1E90EQ
From your link:
The International Energy Agency predicts output will fall at least 500,000 bpd to 1.5 million bpd in 2018. Analysis firm Medley Global Advisors forecasts a decline of as much as 550,000 bpd, citing risks including “PDVSA’s militarization and purge of what remains of its technical capacity.”
To get to 1.5 million bpd Venezuela production only has to fall another 334,000 bpd. Their production currently stands at 1,834,000 bpd, down 534,000 bpd in the last two years.
It is worth noting that Venezuela now admits to their falling production. Their crude oil production based on “direct communication” now has their production at 1,837,000 bpd, just 3,000 bpd above what OPEC’s “secondary sources” say they are producing.
Of course, if banking sanctions forbid you selling it, there’s no reason to produce it. Bitcoin is coming.
Perhaps. In the interim, many of the country”s children are starving to death from malnutrition, while the Maduro dictatorship continues to lie about it. Reality by decree, just like our own crackpot.
https://www.nytimes.com/interactive/2017/12/17/world/americas/venezuela-children-starving.html?_r=0
https://www.nytimes.com/interactive/2017/12/14/opinion/sunday/trump-lies-obama-who-is-worse.html
Texas RRC production numbers are out for October. Below chart confirms the steep production decline (red line crude oil production) of the recent months. Although these data are just first estimates, there is no sign of a trend change towards more production. This trend is confirmed by the massive decrease of well completions, which are nearly tenfold lower than in 2014 and by 50 % lower than last year. Well permits went up considerably instead, which indicates that market participants expect a change in the future.
Furthermore, there are increasingly signs that shale oil becomes lighter over time as the proportion of oil at API > 50 increases rapidly. As some describe it the superlight tight oil, it is dangerously close towards condensate quality (API >55), which is a complete different segment rather competing with NGL and LPG. These grades fetch a much lower price in the market. So, there is a good chance that shale producers may find themselves producing in the condensate segment at much lower prices. The recent huge spike of the Brent – WTI spread is probably already a sign for this trend.
This may be also a reason that the ratio of share prices of shale companies versus crude oil is dramatically falling, which indicates that shale companies cannot make enough cash, despite relative high oil prices. These changes are coming now fast, which will have a strong impact on markets.
http://www.sunocologistics.com/sitedata/docs/reports/daily%20price%20posting/daily%20price%20posting.pdf
The demand for condensate has picked up, see the chart for Eagle Ford condensate price. If it sells, you produce it. By now, it is easy to target. I think you are correct in your assumption that production is flat. A large number of DUCs will be completed in 2018, increasing production, as it did in 2017. After that, it is dependent on oil prices, and available frac crews and other support.
Guym,
Condensate can be used directly in some applications – for instance in the BASF cracker in Texas. However this is worldwide a small market and condensate will experience significant price pressures when there is global oversupply.
If theres lots of it, and the supply promises to hold up for a long time, I think there may again be a will be a market for condensate as ice fuel.
I’m no expert, and have no first hand experience with the sort of antique tractors that were once very popular in the mid west and maybe any place with lots of oil wells.
Unless I’m mistaken, the petroleum fraction we call condensate is easily kept liquefied at ordinary ambient temperatures at fairly low pressures, say in the hundred psi range or so.
That means it’s practical to use it as ice fuel in any machine that’s usually kept near a storage tank. Lots of farmers in the mid west used to use run their tractors and other farm equipment on propane, and at one time, when engines were really primitive, some farmers just put buckets under leaky pipes at oil wells at oil wells on their property……. pipes that were dripping very light oil mixed with gases which soon evaporated out. Really old tractors apparently mostly ran ok on that stuff, considering it was free, lol.
But the old guys who have written about it tell us it was tempermental stuff, and engines back in those days were tempermental enough to begin with. More than a few people got hurt trying to hand crank tractors running on this raw fuel, and some engines failed catastrophically as the result of running them on it.
Once the engines were thoroughly heated up, some of those old tractors would run on condensate pretty close in terms of volatility to kerosene.
And for a long time, you could buy new tractors that were designed to start on gasoline and then , once the engines were hot, switch over to this stuff which we refer to as condensate or very light oil these days. The trick was to run this “almost gasoline ” very light oil thru an engine mounted heater usually wrapped around or very near the exhaust pipes, raising the temperature of it to the point it would readily vaporize when fed thru a carburetor designed to use it.
As Watcher notes down thread, there’s some debate about what is and is not condensate and other people have called the raw ( unrefined) fuel I’m talking about by other names at different times.
OFM,
There is for sure a market for condensate, especially if the price is right. However, middle distillates have a unique position in the transportation fuel segment as middle distillates have high energy density, which means low volume and a high energy content. This is very important for aviation, shipping, trucking and long haul transport. As condensates contain little middle distillate, they cannot be used for production of diesel, aviation and shipping fuel. This is a serious competitive disadvantage and the market reacts by paying much less for condensate. In above Guym’s link, Eagle Ford condensate fetches just USD 51 per barrel. This is a discount of 20% towards Brent. Worldwide the discount is much larger as demand of condensate is high in Texas due to the big chemical crackers there. The point I want to make is that the Shale industry risks becoming a condensate supplier, where the market is small and future supply is high (South Pars in Iran will be supplying billions of barrels of condensate in the future). Eagle Ford ‘oil’ fetches just USD 52 per barrel, which is one dollar above Eagle Ford condensate. So, the market sees Eagle Ford oil production nearly as condensate. I think this trend will become more pronounced in the future.
This is also why the US still has to import crude oil at high middle distillate content at a high price and exports condensate at a relative low price.
There is some debate on condensate threshold. Most say 45, not 55. Regardless, it is arbitrary.
There was incentive to do this when the oil exporting limit existed. Condensate was exportable throughout those decades, not inhibited by the law. Which would mean condensate’s threshold was API 45 for a very long time.
http://petrowiki.org/Gas_condensate_properties
Para 3ish:
Lease condensate, called so because it is produced at the leas level from oil or gas wells, is the most commonly discussed type of gas condensate.[2] This condensate is generally recovered at atmospheric temperatures and pressures from wellhead gas production and can be produced along with large volumes of natural gas.
The API gravity of lease condensate ranges between 45 and 75 degrees, and lease condensates with higher APIs contain more NGIs, which include ethane, propane and butane, but not many heavy hydrocarbons.
There are other links that say this, too. And a few that use a higher number. The key is diesel and kerosene.
As for Bakken, it’s just too much coincidence that we see an oil output increase as we start to capture more and more gas for transport. The condensate was always there, probably flared with the gas. Now captured. Now counted as C&C.
Hi,
Here are my Bakken updates. Sold gas is back to normal so the problems they had should not affect the October data. However in GOR graph we can see that GOR is still declining or is flat.
In the production graph we can see that production continue to increase for most years. Even the 2014 wells see increased production even though they are quite new and should see high declines. According to my calculations, the wells before 2017 together only declined by some 3000 bopd compared to the month before. There were 105 new wells in October compared to 90 in September. So the total increase in Bakken production is both because of low declines in legacy production and because of more new wells with high initial production.
One thing to note is that gas production also increased a bit for most years. The reason for the GOR decrease is just that oil production increased more.
I looked at some of the 2014 wells and could actually not find that many wells which looked like the typical refrack/halo effect (offline for at least a month and then much higher production), although there were some. Most cases of increased production were just small increases which to me looks like they are just pumping up the oil faster.
So I think the higher oil price is behind the increases in production. They took the opportunity to produce as much as they could when the price went up. Also more new wells causes more of the halo effect.
Read the Oasis Petroleum conference call regarding its Delaware Basin asset purchase.
Oasis estimates well cost, drilling, completion and equipping, of $11.5 million.
Looks like in the Permian we are getting back to 2014 well costs.
They’re tightening the definition of WTI crude to stop lower quality blends being sold as WTI.
CME – amendments to the WTI quality specifications – December 15th, 2017
CME Group is amending its contract specifications in order to ensure its quality parameters conform to the oil industry standards established by Enterprise Products Partners LP (Enterprise) that govern the common stream specifications for WTI type crude oil which is deliverable against NYMEX Light Sweet Crude Oil futures contract in Cushing, Oklahoma. Enterprise Products Partners LP has announced that the five additional test specifications will become applicable to Enterprise Products Partners LP’s common stream specifications for WTI type crude oil deliveries in Cushing, effective with deliveries starting with the January 2019 contract month and beyond.
http://www.cmegroup.com/trading/energy/nymexs-physically-delivered-light-sweet-crude-oil-futures-faq.html
For the purpose of this contract, condensates are excluded from the definition of crude petroleum.
pdf file: http://www.cmegroup.com/notices/ser/2017/12/SER-8050.pdf
Energy News,
How much sense makes it to tighten a benchmark when over 80% of production have no chance ever to meet the standard? A benchmark does only make sense if the majority of production can meet the standard. In my view a new Shale condensate standard is necessary for exporting Shale condensate.
Venezuela’s Oil Industry Staggers Closer To Collapse: A Positive Catalyst For Oil
Venezuela’s debt default significantly increases the likelihood of further significant production declines for PDVSA.
The dual impact of sanctions and declining export income could cause Venezuela’s oil industry to collapse.
The loss of a significant portion of Venezuela’s oil production would reduce global supplies boosting oil prices.
I have been watching the situation in Venezuela develop for some time and as the civil conflict has escalated in the near bankrupt Latin American country, the risk of default has grown sharply. Despite Caracas managing to meet previous debt repayments, it appears that the pressure has become too much for the regime of deeply embattled president Maduro and the nation has finally defaulted. This could very well be one of the much-needed catalysts to rebalance global oil markets and keep prices moving towards $60 per barrel.
Venezuela defaults on its debt
SNIP
This has seen PDVSA fail to pay drilling contractors such as Halliburton (NYSE:HAL) and Schlumberger (NYSE:SLB), which by mid-2016 had curtailed their activities in Venezuela because they weren’t being paid. This has caused decline rates at Venezuela’s all important mature oil fields, which are the most dependent on drilling and development activities to maintain production, grow at an alarming rate.
Click the link to read more.
According to the Directors Cut the $WTI – $ND_Sweet price spread has narrowed. The spread was averaging $11 for a couple of years whereas now its around $7. I guess this is due to the new pipeline although the spread only actually narrowed in October.
North Dakota Completions
The Director’s Cut numbers didn’t update (don’t know why) here is an updated chart
Chart on Twitter: https://pbs.twimg.com/media/DRa0HPSXcAATtqr.jpg
The two charts look the same, am I missing something?
The Director’s Cut data should be up to October for the preliminary and September for the final. But for some reason it didn’t show on the first chart, hence the updated chart on the link. The other numbers were right first time.
Got it, sorry.
Thanks for the info.
Energy News,
IN my view it is important to mention that the WTI – Brent spread has increased up to 7 over the last few months. So, the North Dakota spread versus Brent stands now at up to 14,which is already a discount of over 20%. This is a truly worrisome trend. North Dakota grades are drifting deeper into condensate territory. This compares also very well with the Eagle Ford –
Brent spread which reached also 13 and a discount of over 20%. There are already numerous complaints in worldwide refineries about the inconsistent quality of Shale grades.
Reuters – Canadian oil price – 2017-12-18
The volume of crude in storage has hit record levels in western Canada and heavy crude is trading near its widest discount to U.S. crude since December 2013, driven by increased supply and a leak on TransCanada Corp’s Keystone export pipeline last month (now working again).
The discount on Canadian heavy crude blew out to as much as $28 a barrel below the West Texas Intermediate benchmark, pushing the outright price of Canadian barrels to less than $30.
Canada’s oil sands output is forecast to climb by 315,000 barrels per day next year and 180,000 bpd in 2019 to 3.2 million bpd, according to RBC Capital Markets, which described the growth as “unprecedented” and said exports will materially exceed pipeline capacity in early 2018.
https://www.reuters.com/article/canada-crude-railway/rpt-canada-oil-producers-exhaust-options-as-pipelines-railroads-fill-idUSL1N1OF2GB
Rystad Energy – Canadian liquids supply set to grow – 2017-11-29
significant contributions to oil supply growth are expected from oil sands projects, such as the Suncor-operated Fort Hills and CNRL’s Horizon (phase 3 expansion was brought online in November 2017), as well as the offshore Hebron project.
https://www.rystadenergy.com/NewsEvents/Newsletters/EandP/eandp-newsletter-november2017
They spend double digit billion $ every year investing in production – and paint themselves into the corner transporting the stuff to customers.
I don’t get it. There are more easy ways shoting oneself in the foot.
2017-12-18 Genscape – Growing Canadian Production Sends Storage to Record High
https://www.genscape.com/blog/growing-canadian-production-sends-storage-record-high
2017-12-19 – UPI – Forties pipeline system could be out until January – Ineos said manufacturers are creating special parts to fix a pipeline system that carries about 40 percent of North Sea production to inland refineries.
https://www.upi.com/Energy-News/2017/12/19/Forties-pipeline-system-could-be-out-until-January/9501513681817/?utm_source=sec&utm_campaign=sl&utm_medium=1
Well, Dennis, you know where to get the Pending file, now. What gawd awful manipulation you do with it now, is up to you. This is definitely my last post.
Hi Guym,
Thanks, in the future I will use the drilling info data, much easier for me at least.
The problem with the “initial data” is that it is so variable. If you compare “initial data” with drilling info data you will see the difference varies from 400 kb/d to 900 kb/d with an average of about 600 kb/d. Some of this may be the difference in the number of completions (though this data is not very good either and is quite variable).
That is why I focus on the drilling info data, which seems to be better, especially the most recent data (except the most recent two months reported).
Just a different way of looking at things I guess. Generally the most recently reported RRC data seems to be closest to the final output so I prefer to use that rather than “initially reported RRC output”.
I believe you have 449 kb/d for “pending lease output” for Sept 2017 and currently the RRC online PDQ for statewide C+C is 2908 kb/d for Sept 2017. Wouldn’t that suggest Sept 2017 TX C+C output is at least 2908+449=3357 kb/d?
Dennis,
By playing around with numbers – far from any reality, you have really lost any credibility.
Dennis,
In addition to my comment above, the recent discussions about oil production may become irrelevant as it becomes increasingly clear that Shale production becomes classified as condensate production far from any quality which classifies crude oil.
For those of us who don’t understand how the pending file works, rather than making Texas production clearer it’s added a new layer of questions
I’m still getting over the surprise that there is 203 kb/day of production still in the pending file for January 2017
One obvious question, if you wait till the end of the month then does this happen
RRC website + RRC Pending file = Drilling Info as DI is said to be updated at the end of the month.
This raw data takes too much time for just a hobby, month after month, unless you can afford a subscription to Genscape or Rystad who have a dozen people working on it.
Hi Heinrich,
The estimate is based on RRC data and drilling info data.
RRC data at link below
http://webapps.rrc.state.tx.us/PDQ/home.do
EIA gives drilling info data at
https://www.eia.gov/petroleum/production/xls/comp-stat-oil.xlsx
These numbers may be “far from reality”, but my understanding is the drilling info gathers their data from the RRC using output from wells that have not been assigned a lease ID number (the so-called pending lease output data).
Chart below shows RRC initial C+C estimates and drilling info estimates from April 2014 to June 2017, also the difference is shown on the right axis.
The average difference over the entire period is 613 kb/d, but simply adding this to the RRC initial estimate would not give a very good estimate. See chart #2 below with RRC “corrected” which adds 613 kb/d to the RRC initial estimate for each month.
Chart 2
Hi Energy news,
No the RRC online PDQ plus pending lease file output (I call this RRC total) does not equal the DI estimate, on average from Jan 2017 to June 2017 it is about 163 kb/d higher.
I agree it is way too much work to resolve. Just using the Drilling info data from the RRC is adequate in my opinion (except the most recent two months which at incomplete by about 30 kb/d and 260 kb/d based on older drilling info data I have saved on my computer (about 8 datasets from May 2016 to Nov 2017, obviously not all months).
Hi Energy News,
One can think of that 163 kb/d average difference between the RRC total (RRC PDQ +pending lease) and drilling info as representing some double counting (or some other problem with the pending lease data).
So in those terms the pending lease output for Jan 2017 would be 203-163 or 40 kb/d, which may or may not seem more reasonable.
Bottom line the pending lease data is indeed very confusing, at least to me, this may be why drilling info is able to sell their service. The RRC could do a much better job of cleaning up this file so it could be used for estimates, for now I will rely on the data supplied monthly by the EIA.
Link to spreadsheet with drilling info data below:
https://drive.google.com/file/d/1CNkdRpNXGEfnpjbE9loTjqw3fLrDu9Fj/view?usp=sharing
Sportsfans – Round 2 of the OPEC vs IEA is GAMEON. What the frack – it’s not your dad’s NFL. just global economic welfare at state.
“If the coach of a football team tells you that his team will win the cup because they’re the best, but the football association has estimated that the team is not the best one in the league, who would you believe?”
http://www.zerohedge.com/news/2017-12-19/opec-vs-iea-whos-right-oil-prices
November production so far – obviously these are the countries that report their production numbers earliest, as you can see it’s a big drop from the highs last November down -1,845 kb/day or -3.5% year/year
Norway should bounce back from it’s big dip but not sure by how much. Crude+condensate down -292 kb/day from last November 2016. Eni’s Goliat restarted on the 17th Dec and Wintershall’s Maria field has started early…
20.12.2017 Preliminary production figures for November 2017
The main reasons that production in November was below forecast is that Goliat was closed during the whole month and production from Gina Krog, Draugen and other fields was less than expected, some of the reasons being technical problems and maintenance work.
http://www.npd.no/en/news/Production-figures/2017/November-2017/
Early start for Wintershall’s Maria field, Norway: production begins one year ahead of schedule
Recoverable reserves of the field are estimated around 180 million barrels of oil equivalent (boe), of which the majority is oil.
https://www.wintershall.com/press-media/press-releases/detail/early-start-for-wintershalls-maria-field-production-begins-one-year-ahead-of-schedule.html
Norway
SINGAPORE (Reuters) – Surveying the ocean floor for oil and natural gas reserves is gradually emerging from a multi-year slump, everywhere apart from Asia.
The reasons for Asia’s dearth in offshore exploration and production (E&P) include high costs in Australia’s promising waters, declining reserves in production hotspots Malaysia and Indonesia, as well as territorial disputes in the oil- and gas-rich waters of the South China Sea.
With little E&P activity, Asia’s oil import bill – which has already more than doubled since 2000 to over $420 billion a year – will rise further, likely above $500 billion in 2017, leaving other regions to cash in on Asia’s oil thirst.
https://www.reuters.com/article/us-offshore-drilling-asia-analysis/offshore-oil-searches-are-coming-back-to-fashion-just-not-in-asia-idUSKBN1EE0IQ
2017-12-20 – Bloomberg – Shale growth seen as wild card where analysts’ outlooks differ
https://www.bloomberg.com/news/articles/2017-12-20/oil-prices-in-2018-once-again-it-s-all-about-u-s-shale-output
Hi all,
A new post is up
http://peakoilbarrel.com/oil-price-outlook-december-2017/
and a new Open Thread Non-Petroleum
http://peakoilbarrel.com/open-thread-non-petroleum-december-20-2017/