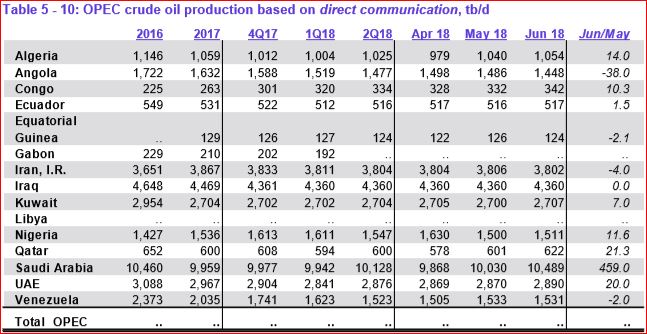
All data below is from the OPEC Monthly Oil Market Report. All data is in thousand barrels per day and is through June 2018.
The Republic of the Congo was added to OPEC this month. The data below does not reflect that addition. I will try to add them next month.
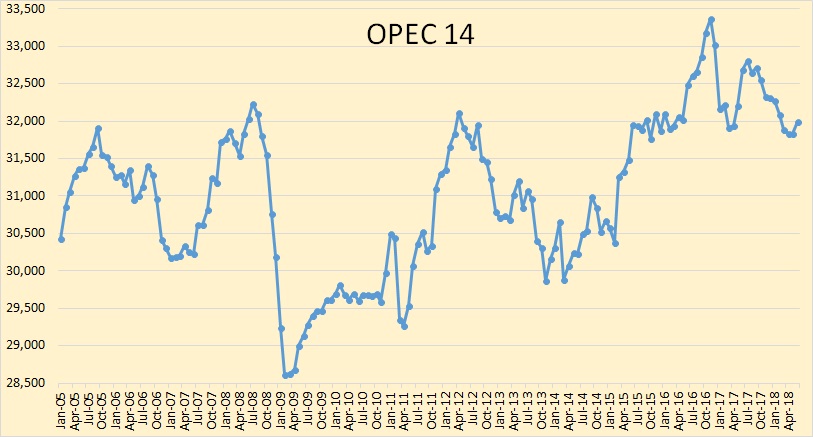
OPEC 14 production was up 161,000 barrels per day in June. That does not include the Congo which was up 12 kbpd.
Notice: This is The Republic of the Congo, a much smaller nation than the DRC, or The Democratic Republic of the Congo.
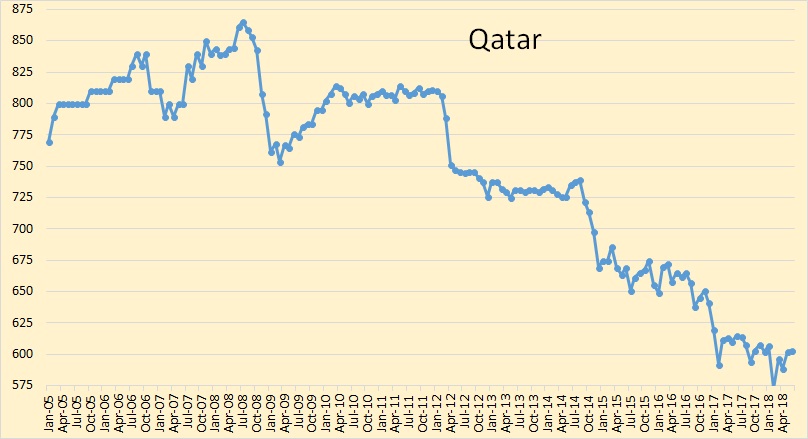
May OPEC production was revised down 39,000 bpd. Saudi Arabia was revised up 28,000 bpd, Qatar was revised up 17,000 bpd while Nigeria’s May production was revised down 79,000 bpd.
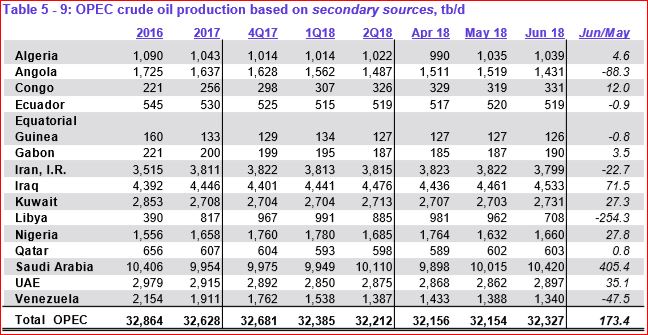
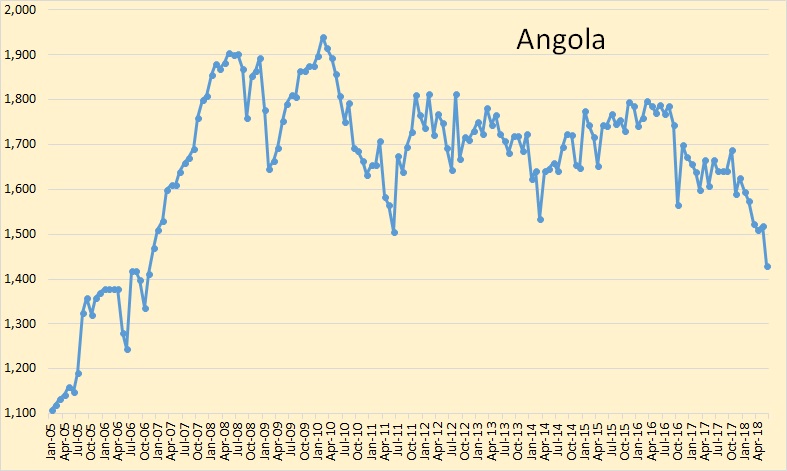
Angola took a huge hit in June, down 88,000 bpd.
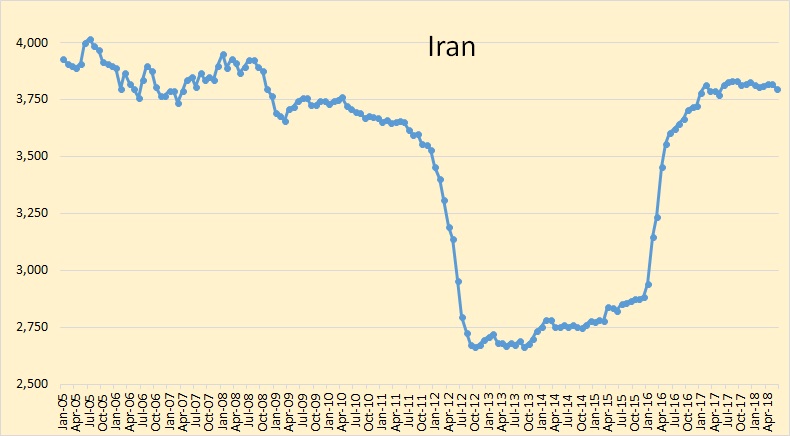
Sanctions on Iran did not have much effect in June. Iran production was down 23,000 bpd in June. Their production next month should be down a lot more.
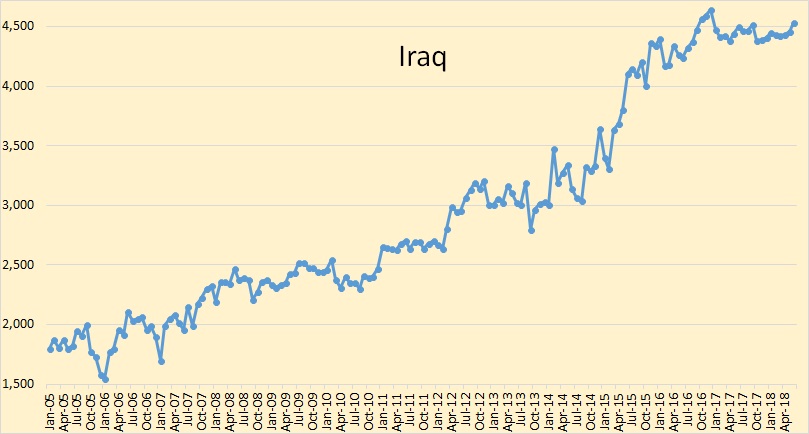
Iraq’s production was up 71,500 barrels per day in June.

Kuwait’s crude production was up 27,000 bpd in June.
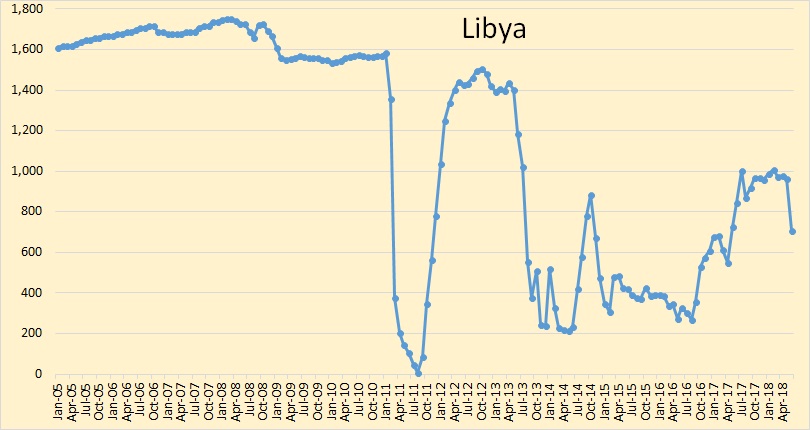
Libya took a huge hit in June, down 254,000 bpd to 708,000 bpd. And it will be a lot lower next month. Their storage tanks are full but their ports are blocked. Production in the field is having to be shut down because there is nowhere to put the oil.
NOC Chairman: Libya’s oil production on slide everyday due to shutdown of exports
“Our production today is 527,000 bpd. Tomorrow it will be less and the day after tomorrow less again. And we are going lower,” Sanallah said.
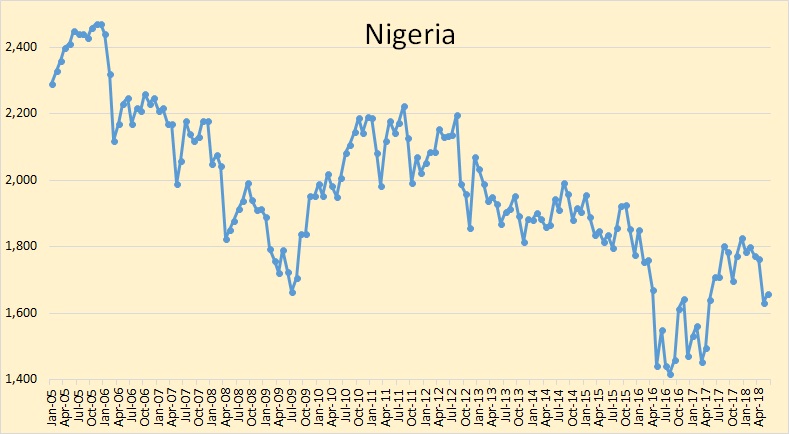
Nigeria’s production was up 28,000 bpd in June but May’s production was revised down by 38,000 bpd.
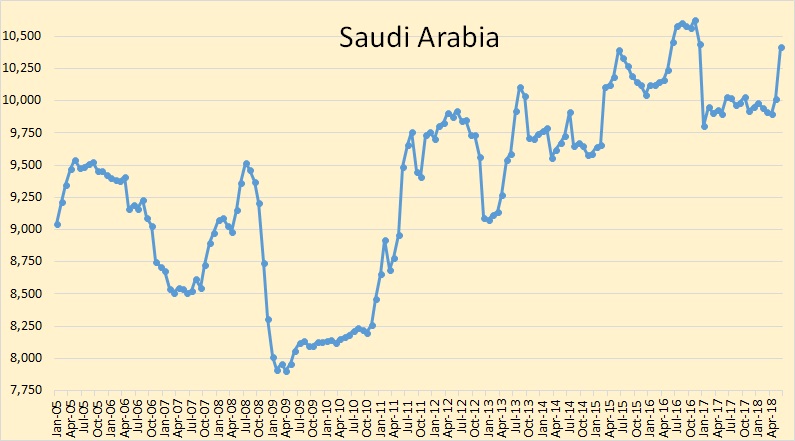
Saudi production was up 405,000 bpd in June and that was after May’s production had been revised upward by 28,000 bpd.
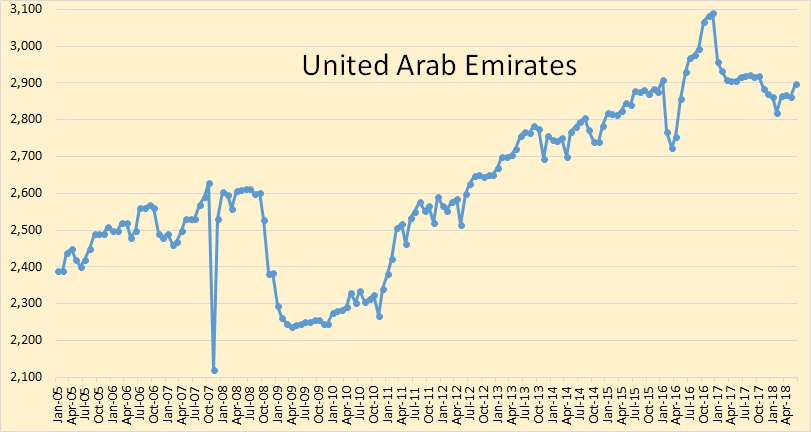
UAE crude oil production was up by 35,000 bpd in June.
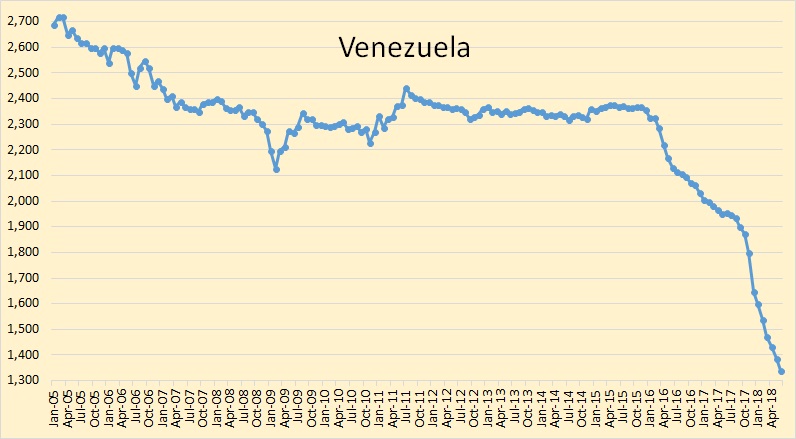
Venezuelan production continues to slide. They were down by 47,500 bpd in June.
OPEC production comes mainly from five nations, Saudi Arabia, Kuwait, Iran, Iraq and the UAE. I have plotted their combined production below.
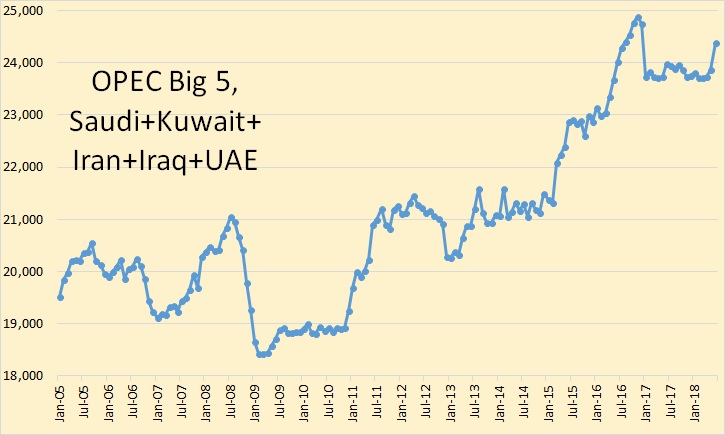
OPEC’s big five production was up 517,000 bpd in June to 24,380,000 bpd. These five nations determine the lions share of OPEC production. However, sanctions on Iran will have a big effect on their future production.
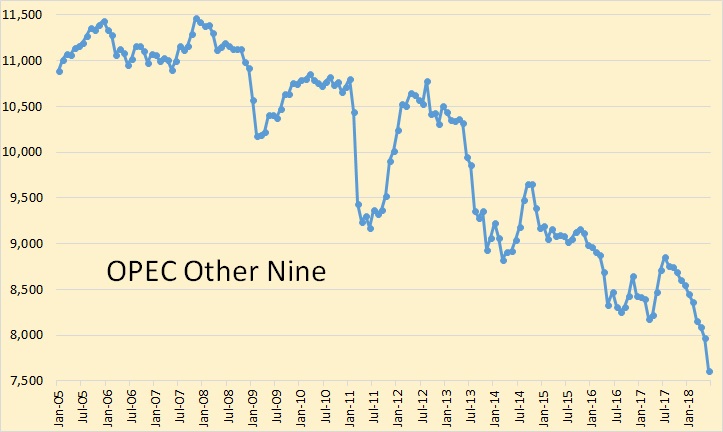
Crude oil production from the other nine is low and going lower. Their combined production was down 356,000 barrels per day to 7,616,000 barrels per day.
257 responses to “OPEC June Production Data”
Congo. Interesting. Cobalt.
Poster Child of exploitation.
Different Congo I think.
Yes, a different Congo. I have just added the following to the post:
Notice: This is The Republic of the Congo, a much smaller nation than the DRC, or The Democratic Republic of the Congo. Before 1971 the DRC was known as Zaire.
Used to be French Congo. I’ve worked there, it’s a bit better than the other Congo. They used to be a Soviet client, but never took socialism that seriously. When I was there the Stasi used to bug our offices, they shot microwaves to reload their batteries, so we usually made sure to stay out on battery recharge hours, and told our guards to stay in the guardhouse.
That’s an interesting bit. Do you suppose the health problems in the Cuban and Chinese American embassies could be the same issue?
I don’t think so, because it’s standard procedure to install sensors. In my case they even swept my apartment for bugs…except when I lived in Russia, where the bugs were known to be hard wired and we wanted the Russians to hear (we fed them garbage).
The Cuban case seems to be some sort of sonic device. And the fact they are using it on Canadians tells me it’s for real.
What if you know we read and you feed us garbage.
I could also be hiding in your attic making noises to drive you crazy.
Thought luck the attic is too hot
My mistake.
Oil export in Lybia back to normal soon, so an increase here in August?
https://www.aljazeera.com/news/2018/07/libya-noc-announces-resumption-oil-exports-180711095201807.html
The eastern ports are open soon – how much is still closed, no numbers in the article.
As far as I understand it, this means that all of Libya’s ports will be open. The ports in the West of Libya were not closed.
So are we prepared to call this peak?
I am not ready to call anything peak yet. However, I am going to look at July OPEC production and I just might make a prediction of the peak then.
It will just be a guess, but an educated guess. I have made educated guesses in the past and have been wrong. But every educated guess is just a little it more educated than the last. 😉
Back around 2009 I thought peak oil would be around 2016.
But with US tight oil producing as much as it has and will, this meant other countries have not needed to produce to their very limit. This has delayed peak oil by a few years.
If increase in demand continues, countries like Russia, Iraq, Saudi Arabia, etc, will be able to produce more without crashing the oil price.
Many oil producing countries are unstable or chaotic and no one knows how much oil Venezuela, Sudan, Nigeria, Libya, Kazakhstan, etc will produce in 5 years, or even 2.
Angola has lots of problems.
https://www.focus-economics.com/country-indicator/angola/exchange-rate
If every single oil producing country had a stable economy and were open to the best technology than peak oil would probably be closer to 2030.
As it is, peak oil will probably be around 2022.
My guess remains 2025+/-5.
75% chance of 2023 to 2027 for World c+c peak for centered 12 month average output.
Hi Dennis,
That is a very reasonable estimation. How long do you think the plateau will last until production will decline though?
Thanks.
Iron Mike,
That depends on many factors such as oil prices and demand for oil as well as political events.
So if we assume URR will be about 3400 Gb (2800 Gb of conventional and 600 Gb of unconventional oil), then an earlier “peak” (which we will call the start of any undulating plateau) allows a longer potential plateau and a “later” peak would result in a short or perhaps no plateau.
So a 2020 “peak” might allow a 10 year plateau and a 2030 “peak” might result in a zero year plateau. Also note that it is impossible to predict the precise path that World oil output will follow, even if we could predict future URR accurately (we can’t). The URR is just the area under the output curve and the possibilities for different curves are virtually infinite.
So there may be those who can predict peak oil to the year, my best guess is 2025 for the assumed 3400 Gb URR for C+C (3700 Gboe for C+C+NGL), peak is for C+C only.
I would say there is about a 60% probability that the peak for C+C will be between 2023 and 2027 (30% probability between 2023 and 2025 and 30% probability from 2025 to 2027, a 20% probability C+C will peak before 2023 and a 20% probability it could occur after 2027.
This is a revision of my earlier 75% probability estimate for 2023 to 2027, the 75% estimate should have been 2022 to 2028.
Thanks Dennis. Very interesting analysis and prediction.
2025 plus or minus 5 years, or sometime next decade. I would say that is a pretty safe bet. Even if it’s next year you are only off by a year.
I will give my prediction next OPEC post. The MOMR is due out the Monday the 13 of August so I suppose it will be then or a few days thereafter. But it will be plus or minus one year at most.
Ron,
We don’t really have a lot of information on URR for C+C, if URR is towards the low end (2500 Gb for conventional based on Hubbert linearization), then the peak may be 2017 to 2023. The large range of my guess is based on an assumption that World URR for C+C will be between 3200 and 3600 Gb, with a best guess of 3400 Gb. Too many variables to make more precise guesses in my opinion.
The large range of my guess is based on an assumption that World URR for C+C will be between 3200 and 3600 Gb, with a best guess of 3400 Gb.
Oh my God! 3,400 Gb total. And we have produced, so far, about 1,265 Gb. That means we have produced only about 37% of the oil in the ground and still have about 63% left to produce.
If the peak is at 50% of URR, that would put it as 1700 Gb of cumulative production. That would put it at around 2031. And that would be the case if the URR numbers you think valid are actually in the ballpark. They are not. They are about one trillion barrels too high. That would put URR at about 2400 GB. Which would mean we are at the halfway point right now.
However, shale oil and the creaming of giant fields has, so far, kept the peak at bay. But not for much longer.
Oh, below are the figures from Dr. Minqi Li’s post. I stress that these figures are not Dr. Minqu Li’s figures, they were taken directly from the EIA, OPEC, BP, and for Russia, Hubbert Linearization. And they are all dramatically way too high.
Hi Ron,
The USGS estimates about 3000 Gb of conventional C+C URR, their estimate for unconventional reserves is about 1000 Gb.
My estimate for conventional C+C (defined as API gravity >10 and not LTO) is 2800 Gb, Jean Laherrere estimates about 2400 Gb for conventional C+C, my estimate based on Hubbert Linearization(HL) is 2500 Gb (HL consistently underestimates URR so I use this as a minimum). Laherrere also estimates extra heavy(XH) oil URR (API gravity<10) at 500 Gb and to this I add 100 Gb for World LTO (EIA estimates 500 Gb).
Whether my estimates are too low or too high will be known in the future.
Note also that the XH oil will mostly reduce the rate of decline after the peak. So the more relevant figure is the conventional and LTO URR which is 2900 Gb for my best guess. This is about 400 Gb more than Jean Laherrere's estimate (2500 Gb) for C+C-XH oil. Also total World C+C cumulative output at the end of 2017 was about 1333 Gb, most of this has been conventional oil (1306 Gb). So with peak mostly determined by 2900 Gb of C+C-XH and assuming the peak is at 50% of URR (probably not a good assumption), we would expect peak at 1450 Gb which is likely to occur by 2021.
There is nothing magical about 50% of URR, the output curve is unlikely to be symmetric.
So with peak mostly determined by 2900 Gb of C+C-XH and assuming the peak is at 50% of URR (probably not a good assumption), we would expect peak at 1450 Gb which is likely to occur by 2021.
I don’t have a problem with that number. I think it is likely to be pretty accurate. My estimate might be a bit earlier than that but not much.
But… but… but… that peak date does not match your previous predictions the peak years later.
Hi Dennis
One can argue, that once terminal decline starts, the decline rate might not be smooth and linear like the chart. But rather a Venezuela type exponential decline rate. Since energy output is directly linked with GDP, once oil is exhausted and GDP is negative, the economic system will collapse. I mean obviously this view would be in a pessimistic pile, but it is possible.
Cheers
Hi Ron,
The 2021 estimate is based on the assumption that peak oil occurs at approximately 50% cumulative production of conventional oil, two problems with that is that LTO output may allow enough output (up to 5 Mb/d) that is likely to move the peak by a few years and also that the peak could occur at some level of cumulative production that is greater than 50%. Note that my estimate is a range of years with a single year chosen (2025)where there is an equal likelihood that the peak will be before or after that year.
also that the peak could occur at some level of cumulative production that is greater than 50%.
I don’t think there is any doubt about that. If it occurs next year it will be past 50% of cumulative production. 50% of cumulative production, I believe, occurred in 2017 or 2018.
Shale oil and the creaming of giant fields absolutely assures that the peak will occur well after 50% of cumulative production. And these two things also will assure that the decline curve will be much steeper than if the peak had occurred at 50% of cumulative production.
Yes Ron,
One of the big secrets is: How long does the creaming of Ghawar last.
Another 10 Years? Another 20 Years?
If these 5 Mb/day fail it will be difficult to replace them.
I have it on good authority that Ghawar is no longer producing 5 million barrels per day. The decline in northern Ghawar, mostly from Shedgum and Ain Dar has been replaced by new production from Khurais and Manifa.
Jean Laherrere’s estimate (July 2016) for World URR of C+C is 3000 Gb, his estimates tend to be conservative. Hubbert Linearization on C+C less extra heavy(XH) oil gives an estimate of 2500 Gb and the URR estimate for XH is 500 Gb.
Note that Laherrere’s estimates keep rising over time, in June 2013 Laherrere’s World C+C URR estimate was 2700 Gb (2200 Gb of conventional).
My estimate for conventional oil URR (2800 Gb) is between Laherrere’s recent estimate and the USGS estimate from 2000 (3000 Gb).
2021–
But I’m a amateur.
It’s just I analyze BAU professionals, living in a smaller box.
Iron Mike
Global GDP is related to all energy output, which includes, oil, coal, natural gas which will not peak for about 20 years. Hydro, wind and solar power and nuclear power.
Some people think that wind turbines and solar panels cannot be produced without the huge consumption of coal, oil and gas to back them up. They could be right and we will all find out in a few years time.
We had some consistent draws in the US crude inventories over the past year, but June draws were over 30 million barrels. Considerably more than last year. A year more like that, and commercial inventories will only wet the bottom of the tanks. Just think, we are probably better off than most countries. I noted that EIA and OPEC are acknowledging US production constraints, but no one is predicting any drop for 2018-19. Miracles do happen, but predicting them should not be the mode of operandi. I still can’t get over that funky STEO report. If the US and Canada part of non-OPEC increase for 2018 is going to be 2.3 million barrels, and they (horribly) project US portion to be 1.2, then Canada has to increase by 1.1 million. OPEC in their report, predicts a 2 million barrel increase, which includes NGLs, I assume. Still horribly off. Anyone see a problem here?
Picking up son from the airport today after his 2 week shift in Alberta (Ft Mac). He seems pretty happy these days so I’ll have to tell him to get the lead out and start producing. 🙂 Hate to see Donald get mad at Canada.
To be honest, I have lost track of Canada expectations of growth this year. Last I heard was it would be around 300k, but that was before the outage, and I’m sure more has happened. Anyone have an update?
I heard that amount as well. Most of the interest has been this summer’s beginning construction of the Trans Mountain pipeline expansion which will see 890,000 bbl/day heading to Asia upon completion. People called down the Govt for funding it, but I believe in rearview it will have been a good decision. I also hope the Energy East pipeline goes ahead, however, Keystone XL might have derailed that one.
I did a more thorough analysis of the STEO using their excel tables. Just comparing dec 18 production with dec 19 production. I just corrected some inconsistency with UK data, as dec19 had a drop of 300kb/d.
non-OPEC 2018 increase: 2.8 Mb/d
US increase: 2 Mb/d,
of which 1.4Mb/d of crude, 0.6Mb/d of NGL. Offshore increase of 400kb/d (to 1.89 Mb/d). Onshore increase of 1Mb/d.
Canada increase: 130 kb/d
Brazil increase: 176 kb/d
Russia increase: 211kb/d
So, indeed… EIA doesn’t forecast any constrains in US production. June to december growth for onshore production is forecasted at 430kb/d. The 1.4Mb/d figure comes probably from the monthly data. They are very optimistic, but there is nothing wrong.
When it says “crude” is that crude plus condensate, or is the condensate included in NGLs? The reason I ask that, is that the monthlies include crude plus condensate. 1.4 million increase does not tie into their summary page. 1 million crude per your spreadsheets does not agree to 600 to the Permian, plus 600 from the rest of the US, including the GOM. The summary analysis has 1.2 million. Adding onshore and GOM from the numbers you pulled is 1.4 million. Adding 2 million from the US plus Canada gives 2.13 million, not 2.3 per the summary. Adding 400 to the ending monthly for the GOM for 2017, gives a lot more than 1.89. Nothing jives. They are supposed to be just “optimistic” when the expect 430k to just magically appear in Cushing or Gulf coast without the aid of pipelines, trains, or trucks? No, wait, 400k of that is supposed to come from the Bakken and Eagle Ford, of which little has happened yet, nor will much. So, most of it has already figured out a way to get teleported. Or, is the optimism politically motivated.
No, the OPEC Monthly Oil Market Report reports crude only. Their data does not include condensate.
The EIA figures are always Crude+Condensate or Total Liquids. The EIA never reports crude only and OPEC never reports C+C.
That makes it a lot worse than I thought. It also makes Tita’s numbers from the spreadsheets totally confused, to me. But, nothing new, there?
NEB currently has Canada increase at about 250kbpd (for both yearly average and December exit rate), that may come down as they incorporate the upgrader outage and East Coast turn arounds.
The GoM is not going to add 400 kbpd, it’s more likely to be negative on average (December may be up slightly as 2017 had three major unplanned outages then (but at the moment EIA are reporting about 30 kbpd which don’t come from any reported wells or leases so they may know something else). GoM has to replace about 20 kbpd per month of decline, which it isn’t doing at the moment, plus overcome any planned/unplanned outages, which seem to be getting more frequent.
Brazil is going to struggle to get 180 kbpd increase. They were down 20 kbpd in May from December. They have two FPSOs ramping up but are fighting 30+ kbpd decline per month (and increasing). The are other FPSOs due but seem delayed and the ramp ups are slower than in the past, principally because of lack of drilling capacity. Probably they need two new development wells per month to keep level, given the normal delivery rate and that some are for injection, they only have 8 rigs, not all on new developments, but there may be some predrilled wells available.
Russia has more fields coming on stream, but it depends how much the mature fields decline – there must be a limit some time on how much in-fill drilling can be done.
This shows recent start-ups for Brazil FPSOs. Doesn’t look like there’s any pre-drilling and it takes about 14 to 22 months to ramp up to 6 to 8 wells – the larger FPSOs at 150kbpd and more need about 8 wells as they average around 20 kbpd (although the recent Mero extended test has been getting 40). So each new FPSO adds about 10 to 12 kbpd per month, which means they need 2 or 3 on the go just to keep steady production. At the moment there are two ramping up; there are others due but it takes about two months to hook up and start drilling.
So, we would expect, at best, sideways production from Brazil for awhile.
Probably until the next FPSO starts up, and I don’t know when that is going, there should be three more this year but there has been talk of delays, and it’s unlikely they would commission two or more at the same time so one might be late in the year and one delayed till next year.
So, replacing the EIA estimates with our own, we get for non-OPEC growth:
650. US (550 from the Permian, 100 Bakken)
Eagle Ford may drop
250. Canada
180. Brazil
300. Russia being generous
1380. Total which is 1.42 short of their 2.8 million, or 2.6 (1.180) if you use their summary page. Even adding another 350 to the US still is close to 1 million short. OPEC contribution seems somewhat “optimistic”, and does not factor in any Iranian drop. Yeah, should balance out. ?Then, we have 2019, which is damn scary. The only potential partial offset is demand. If part of demand is computed based on funky supply numbers, then it is likely to be less than estimated. But not that much lower. Half a million is an overestimation. This much is politically motivated. The latest monthlies that will be posted before November will be August. Only four months to the end of the year. Going to be tough to keep this up. Four more months of inventory drops before November. OMR out, and indicates OPEC is stretched. I still find it easier to plug in my estimates with the OMR report. I get 2 million a day draws through 2019, at a minimum using their June report, and correcting.
https://www.iea.org/oilmarketreport/omrpublic/currentreport/
Their first page graph pretty much depicts serious draws without adjustment. They have a 2 million a day increase in non-OPEC production for 2018, lowered to 1.97 in this report.
1380. Total which is 1.42 short of their 2.8 million, or 2.6 (1.180) if you use their summary page.
Wait a cotton picking minute here. 1.38 million barrels per day increase from four Non-OPEC countries. What about the rest of Non-OPEC? I don’t have monthly data on Brazil but in the last 2.5 years, oil production from Non-OPEC less Russia, US and Canada has fallen by about 1.5 million barrels per day. And that is with Brazil in the “Rest of Non-OPEC category”. It would be a whole lot more if Brazil were not in that group.
No argument, I am only adjusting their increases for the countries they say increases are coming from. I agree, it’s seriously worse than their projections. Plugging those into your graph, we have more of problem.
If the EIA is intentionally misrepresenting available supply, do they know better and are just trying to postpone some sort of economic panic?
Misrepresenting is too strong a term. That would assume they are reporting the actual numbers wrong, which they do not do. These are projections, and they can be manipulated to serve the best purpose of keeping prices down until the elections. That’s pure speculation.
I really have no idea but just guessing, I think they are really overoptimistic and really believe the shit they put out.
You must understand that if people really want to believe everything is okay, and there are really no mega-disasters in our future, then that is what they will believe. Most people believe what they desire to believe. Most people see the future they desire to see. We see that every day, even right here on this list.
Ok, I’ll go with over optimistic. It probably is out of bounds (even for me) to speculate that it has any nefarious purpose.
Another Chart.
Thanks. Yeah, it’s much worse. Looking at that, one could guess 1380- 400 non-OPEC (less US Canada and Russia) for 2018. But, because we were short in 2017, we’ve gone nowhere.
Non OPEC less Russia, USA and Canada seems to stabilize when prices go above $100 per barrel. This tells me investment decisions are made assuming prices will be $80 to $100 per barrel.
When we see prices above $100 and price forecasts change to the $80 to $100 range, that decline will stabilize for a while.
Each peak is lower than the previous peak and each trough is lower than the previous trough. That’s what you call a downward trend.
180 for Brazil is a stretch. Fort Hills and Horizon have finished ramping up so 250 for Canada is also probably a stretch. US NGL may be a chunk to include but I wonder what the global decline for NGL on mature gas developments is. North Sea looks not as good as expected. The only place doing better than I thought is Mexico, and I think that could turn the other way any time.
EIA reports condensate, so does my estimate. There’s about 300k extra in their detail of NGLs that I can’t account for.
But i think there’s a lot of NGPLs (i.e. butane and lighter) in the all liquids numbers, it’s not just condensate (C5+).
Are the details of OPEC, IEA and EIA reports getting more and more focussed on short term issues, as if they have no idea how supply can meet demand longer term? Or am I missing something.
Unless, EIA is using a double standard in their STEO report for US vs Non-OPEC, I believe it would be crude plus condensate, only. It’s crude plus condensate for US, for sure.
The STEO, table 3b, Non-OPEC, is total liquids. Table 4a, US only, is Crude plus Condensate. Table 3c, OPEC, is crude only.
Ok. There is obviously 200k of that liquid which is included in their 1200 US increase (not non-opec), because the non-opec increase for crude is 1 million. So, I have not accounted for about 400k of liquids in my estimate. I guess.
Thanks, Tita, George and Ron.
I managed to erase my own comment on this. And my comment was simple, the only true measurement of market balance for oil going forward is global inventory level. Everything else is perhaps manipulation or guesses.
I agree, with all the intentional and unintentional confusion it stays confused. I stay confused trying to figure out what is confused. Inventory levels will be the only clear measure of what is happening. US inventories should not be dropping fast, as we are about the only country with increased production, but we dropped over 30 million last month. That’s really not small potatoes, as commercial stocks are just a little over 400 million. Though, I think the US will be one of the last that would hit the danger zone.
Good point. My intention was not to give more confusion. These are forecasts from eia and, I always like to remind this, they forecasted Brent averaging 105$ for 2015 in the STEO of October 2014. They never forecast big surplus or deficit.
I messed with the numbers of the STEO from 2018 to guess when the are reliable. Inventory levels are accurate for the US from the monthly report, which is 3 months old (april for July STEO). Other inventory levels are less accurate, but stock changes are reliable from 4-5 month data.
Global inventories increased in April (0.74 Mb/d) and May (1.14 Mb/d). This would be quite a change, as April would be a record inventory build since January 2017, and it would be followed by another record. This have to be confirmed later.
So, now I know what I will look for in these STEO.
You gave data that I did not use before, and understand better, now. You did not confuse.
How does this fit with production and consumption?
I thought we have still increasing consumption of about 1.5 mb/year, and production in April/May didn’t jumped thad much – Opec flat and Permian already near it’s pipeline bottleneck.
As much as I know, many storages are unknown, especially Opec / China. There are these satellite measurements, but there are additional deep storages.
Gathering all comsumption / raffinery input / production data would give an additional picture. Still not easy.
With 1mb/day surplus we should go soon into the next oil price crash to 30-40.
Permian price is then at 0-10$.
“With 1mb/day surplus we should go soon into the next oil price crash to 30-40.”
This follow two months of strong draw of stocks (-2 Mb/d in February, -1.32 Mb/d in March). So, it is more a balance that stabilize prices for the moment.
Consumption is still strong, but there is some variation and April-May were weak months. The main reason of these surplus come from production (Brazil+Canada for April, Brazil+US for May), according to the STEO.
The pipeline constrains don’t appear yet in the EIA data.
And yes, EIA still does some corrections on inventory figures from 4 years ago, but this is not significant.
I think seasonal changes in Brazil ethanol are confusing the total liquids numbers that you are looking at.
Guym,
Rigzone article today says a good part of the drawdown was decreased imports partly from Canada because of the Syncrude outage and also from other sources, and some refinery throughput pullback (how’s that for lingo mastery?) Mostly import decline.
Has the US been getting any crude from Venezuela?
It was this week. Last week there was an overage, as imports were high. Two weeks ago, imports were at an average, exports were down to this week, or closer to an average. That week was a decline of 6. I think 6 has been the average this month.
Don’t know about Venezuela.
Even if we haven’t hit peak yet, the fact that production is likely to be going up by a snail’s pace the next 3 years is a problem. If consumption just goes up 0.75% a year we need 600K extra a year. That seems like a big challenge to a layman like myself.
Well what will happen is that the price of oil will hit $150-$200 a barrel to ration demand.
Which will cause much pain and ruction and gnashing of teeth among the voters, but Europe has had those oil equivalent prices owing to taxation for quite some time and they manage high living standards. $200/bbl probably destroys 10 million a day in superfluous ‘Becky driving by herself to the mall in a 3 ton SUV for no reason’ kind of demand and incentivizes quite a bit of production.
The transition period will be moody for sure, but at $200/bbl, the amount of economic EOR targets in the US is somewhere in excess of 70 BBO from old conventional fields from the industry reports I have seen – its just not economic to do since there isn’t enough CO2 available to flood them, so you need to use more expensive techniques which require very high prices (ethane flooding might be useful????). Worldwide its hundreds of billions. High prices that encourage us to use the resource wisely and not waste the goddamn stuff liberally would be a godsend, if we could quit wasting gigatons of plastic bullshit and 40% of our food – i.e. if everything made from oil was more expensive as well.
It would be painful economically, but Mad Max isn’t coming our way. After 5 years of pain, we might actually finally get our shit together and research some goddamn alternatives.
I believe sugar cane ethanol is very competitive at $120 per barrel. This allows converting grass cattle grazing ground to cane. I believe soy and palm will also become very attractive crops. And I suspect countries like Haiti and Nicaragua will continue having riots.
Yes, I believe you are right. The future energy picture is complex, but authors writing books about this say sugar cane ethanol could have EROEI (energy return on energy invested) of up to 4. Even based on mechanised agriculture. And the big advantage of this crop is that it is not very nitrogen intensive, the biggest fertilizer, currently energy intensive when it comes to natural gas usage. Even when it comes to preindustrial crop rotation, the nitrogen intensive main food crops were often rotated with legume crops which were not nitrogen intesive in the hope to rebuild nitrogen content in the earth. So very long term, sugar cane ethanol is a superb type of renewable energy. (that is what I read, no expert).
Brazil has the biggest potential out there when it comes to size, and it is not inconceivable that they can cover much of domestic fuel demand with this outside aviation and possibly shipping (no need for diesel and gasoline ;-)). It would be in competition with food crops and concerns about deforestation, but still; a big potential there. Brazil is well off in a more renewable future btw, having loads of hydro power, wind power, in addition to biomass power (sugar cane the most promising).
Colombia has large tracts of land it can use for sugar cane, but they’ll have to do large scale flood management.
Cuba has a very large area well suited for sugar cane, and another area which prior to communism was used to raise cattle, but now it’s covered with marabou. The key there is to dump the dictatorship, return the land to private ownership, and I suspect the island could be self sufficient. All they would need is a connection to the USA electric and gas grid, a nuclear power plant, some solar panels and wind turbines in strategic places away from tourist eyes.
i always wonder why Aviation is called out as needing heavier hydrocarbons. Aviation can operate fine using shorter chain hydrocarbons. Turbines really don’t care what is used as long as it burns. Yes range will drop somewhat and there will be more fires, FAA regulations will need rewriting but physically the engines will only need minor changes. Industrial turbines already burn everything from the natural gas through heaviest gunk that can be pumped. Aircraft lifespan is similar to cars. In a few decades they could all be flying using gasoline or ethanol.
Now battery powered aircraft are further off for anything other than very short range use (trainers maybe). With maybe 1/50 at best of the energy density of hydrocarbons and limited efficiency gains (maybe 2x). You are going to need a 10x improvement for commercial use.
By shorter hydrocarbons, you must mean natural gas liquids.
Not a chance. Airline fuel is stored mostly in the wings. Natural gas liquids would have to be stored in pressurized cylinders. The added weight would be enormous and your range would be shortened to a couple of hundred miles at most. And so many pressurized tanks would be a greatly increased hazard.
Jet engines can burn anything that doesn’t need pressure vessels for fuel storage. Alcohol, gasoline, naphtha, palm oil and other forms of biodiesel are fine.
I worked at a power plant that used aircraft engines (General Electric LM2500) as the prime mover and they burned naphtha and diesel. Gasoline was permitted and would have been fine, but we never used it. Same with alcohol.
Its not the fuel for turbines. After all Steam is the source for large turbines. The issue is the weight to energy content for aircraft. Ethanol has only about 65% of the energy as diesel\jet fuel measured by volume. Jet fuel also has some advantages over gasoline\Ethanol\propane: It takes considerable more heat\energy to ignite, an important property during an emergency.
FWIW: I suspect commercial air travel will take a dive once oil production becomes a problem. My guess is that Air travel consumes around 10mbbl/day. Thats a lot of fuel that could be used to fuel ships, trains & trucks. I am sure air travel will still exist, but it will become less used as the cost for air travel soars.
Seems likely that the US will continue to build many more gas fired plants for electricity since it currently the cheapest fuel source at the moment. I see power companies shutting down more Nuclear plants as well as the older coal plants that are becoming costly to operate and maintain. The long term risks is that NatGas is important for building heat\Domestic hot water as well as for petro chemicals. Once its gone it there aren’t substitutes. I also suspect the the cost of NatGas is artifically low due to low interest rates and desperate investors chasing phantom yield on Shale companies. If investors yank capital as deeply in debt shale drillers run into trouble, its could cause NatGas prices to soar.
What’s the efficience between an electric impaler and a jet engine?
Is it like factor 3-4 like in cars?
If yes, you’ll need only 3 times better batteries than now for a short range plane – and these batteries are in the pipeline. 2 times better you can already buy as samples.
Long range jets will never go with batteries – only fuel cells with liquid (or chemical bound) hydrogen will work. When they get the energy density, otherwise you can just burn liquid hydrogen through the jet engines.
It’s still 10 years in the future – until then normal fuel will do it. Or bio fuel in emergencies, the US air force already tested this.
An electric powered aircraft with very high energy density batteries would be a flying bomb. All the redox energy contained in the small volume of the cells, which would need sophisticated cooling to cope with massive current. Thermal runaway of a charged battery pack would be catastrophic, with nowhere for the heat, or the batteries, to go. Good old Avtur, safe as houses in the absence of air, is a much better option.
I think an aircraft, filled until the top with tons of an enflamable liquid is a rolling bomb, especially in every small accident. Only a small leak needed for hell.
Solid state batteries won’t have the big problems as current batterie since there is no more liquid component.
Look for this approach, it works with a non-flammable solid electrolyte instead of hydrocarbons like current batteries:
http://www.eenewseurope.com/news/solid-state-battery-advance-promises-safe-powerful-and-affordable-li-ion-alternative-0/page/0/1
>All the redox energy contained in the small volume of the cells, which would need sophisticated cooling to cope with massive current.
You are assuming the electric plane would be built like a conventional plane, with a small number of large engines, but that probably isn’t the best way to do it. Electric planes are more likely to have a large number of small engines and power sources running in parallel.
This is a good example of how new technology surprises by changing the underlying assumptions.
You are assuming the electric plane would be built like a conventional plane, with a small number of large engines, but that probably isn’t the best way to do it. Electric planes are more likely to have a large number of small engines and power sources running in parallel.
Yep, that is correct!
BTW, BMSs are already pretty well developed for automotive and home storage technology and have a proven track record of reliability. I’ll bet if you flew an electric airplane powered by Li ion battery tech, into a high rise it would cause orders of magnitude less damage due to fire than a similarly sized airplane powered by jet fuel!
https://lilium.com/technology
Electric Jet Engines
The electric jet engines work like turbofan jet engines in a regular passenger jet. They suck in air, compress it and push it out the back. However, the compressor fan in the front is not turned by a gas turbine, but by a high performance electric motor. Therefore, they run much quieter and completely emission-free.
They could build an airplane with super plastics to be invented, something called “algorene”, and use batacitors as described by Phillip José Farmer in “To your scattered bodies go”, a really good science fiction novel which describes the adventures of Samuel Clemens and Richard Burton after they return to life in “River World.”
Ferdnando,
The hype is often confusing when new technologies are introduced. One way you can tell you’re being bullshitted is that the technology claims to solve all problems from the start. Theranos was a classic example of this kind of con.
The way you can tell whether a technology has a future is to check to see if it can fill any market niches. If the technology can’t fill any niche, it won’t grow.
Electric planes might already be filling some sport and training niches. Here’s an interesting video on the topic.
https://www.youtube.com/watch?v=2CS3isCH4bk
If the technology spreads in this niche, it has a chance to mature and start filling other niches.
This is what made Tesla worth looking at — the Roadster proved there was at least one niche for electric cars, so the possibility of filling other niches was there. Now EVs are filling the city bus niche as well, and the luxury car niche. Delivery vans look likely, and heavy trucks may follow.
The fact that EVs are<1% of the market is irrelevant for the time being, because the question is not how many people DON'T buy the technology. The question is how many people DO buy it.
So as tiny as the EV market is, it looks huge compared to consumer electronics. In fact since 2016 more batteries have gone into EVs than into mobile devices, which is the market lithium batteries were invented for. That doesn't prove EVs will take over the car market, but it suggests that the industry is well established already, and not just a fart in the wind.
“but authors writing books about this say sugar cane ethanol could have EROEI (energy return on energy invested) of up to 4.”
Hard core scientists, e.g. you may look for articles of Tad Patzek or some interviews/editorials Hartmut Michl, come to an EROEI of ~1.3.
Plant based biofules cause more problems than they solve.
I believe sugar cane ethanol is very competitive at $120 per barrel. This allows converting grass cattle grazing ground to cane.
Not necessarily! Though I’m not a fan of current cattle ranching practices in Brazil converting grasslands used for grazing to sugarcane plantations is not practical in most of Brazil. Neither the soil nor the climate are appropriate for growing sugarcane in most areas. No matter how much the barrel of ethanol may be worth or what someone believes, you can’t work against nature. But if anybody knows how to produce ethanol, the Brazilians certainly do.
https://www.youtube.com/watch?v=G-pr0cYzuDQ
Disruptive Innovation Festival – DIF
Published on Dec 7, 2015
Leontino Balbo Jr has developed an approach to organic sugar cane production with the potential to disrupt the whole agricultural sector itself.
In 1986, Leontino began experimenting with “ecosystems revitalising agriculture”, a new approach that he believed could increase crop yields, reduce pest numbers and restore natural capital, all while reducing reliance on natural resources.
29 years later, Leontino’s sugar cane farm, based in Sao Paulo, Brazil, has enjoyed unprecedented success with his work becoming a paragon of regenerative agriculture. A hypothesis has transformed into measurable results, with Leontino claiming to be able to produce higher yields, while not raising production costs, using only one third of the resources and providing a swathe of environmental benefits.
I wasnt thinking about Brazil specifically. I was thinking of countries i know, like say Cuba, where the sugar industry was killed by Castro communism. Cuba used to have limits on sugar sales, which meant land was used for grass fed cattle. And because Cuba’s climate is different from Brazil’s, their expertise growing sugar and making ethanol isn’t really needed. What’s needed is a democratic capitalist government.
I am fairly familiar with the used car market, and see a real opportunity for some to cash in on the oil shortage situation with natural gas conversion. High consumption SUVs will trade for a song at auctions later. You can buy them, have your own Certified conversion person, and convert them more cheaply. Because there could be a huge demand, they would sell at a premium. Most people buy their cars from the used car sales places at a ratio of about 2 to 1 to new cars. If I’ve thought of it, others are already in the process of putting it together. Innovation will always get us there.
The conversion does not involve much more than strengthening the valves and the valve seats.
The commercial applications (trucks and busses, primarily) are showing a reduced maintenance cost and a longer life than gasoline or diesel.
The bigger fleets have addressed the fueling location issue by having centralized locations.
More and more, CNG stations are starting to crop up along interstates.
The big breakthrough may arrive when the tanks do not need to be pressurized to 3,000+ psi.
The activated carbon method is being challenged by several other technologies.
The current Gallon of Gas Equivalent (GGE) price in the US is in the $2 per range with some stations in Oklahoma selling for less than a buck.
Ok, showing my limited physics, here. If we lower the psi, won’t the gas tanks hold less gas, and reduce the distance capability?
Adsorption, aka, putting 10 pounds of stuff into a 5 pound bag.
There are a gorillion applications ranging from water, different gasses, liquids.
All this nano technology seems to have spurred a race to uncover better materials to do the stuffing.
At least one outfit has teamed up with a cylinder manufacturer to make formable, lightweight containers to hold the gas.
Check out Activated carbon adsorbed gas – not absorbed – on the net.
Lottsa activity taking place.
Price of CNG at Moore, Oklahoma 7-11 today (according to the CNG pricing site) is $1.29 GGE. That means filling up a 32 gallon F 150 for about 40 bucks.
Pretty cheap.
Ok, googled it. Got the gist, that’s about all. Rather that shooting around, the molecules attach to something creating less space required. Then, you have to reverse the process in a controlled manner. Simple science project? Thanks.
Yes, that’s it.
Kinda like a sponge holding a bunch of water.
Thing is, the fuzzy heads out in Beserkley came up with some super duper improvement in the field of MOFs (Metal Organic Framework) that can adsorb methane way better than carbon or, apparently, anything else.
It is at laboratory level development now, but there are intense, world wide efforts to produce and commercialize similar products.
Could be a real game changer.
Don’t tell me we are looking at cow manure for a source of that methane? Went to one of those science projects. Never again. Methane can contribute 23 times that of CO2 to global warming. I assume humans are a guilty party, also.?
I looked into it about 30 years ago to move stranded gas and to store gas on islands which burn diesel to generate electricity. For example Hawaiian islands which can’t survive with renewables.
Lived on Maui for 10 years. If you wanted any insight into Sugar Cane, I have real time experience.
On a side note:
Spain launches truth commission to probe Franco-era crimes
https://www.theguardian.com/world/2018/jul/12/spain-to-establish-truth-commission-for-franco-era-crimes
(Planned census of civil war and dictatorship victims aims to help families trace relatives)
Maui’s electricity is about 1/4 renewable already, and oil fired plants are closing.
https://www.hawaiianelectric.com/clean-energy-hawaii/clean-energy-facts/about-our-fuel-mix
The big island is more than half renewable, thanks to geothermal.
That’s just electricity of course. But unsurprisingly, the utilities are keen on electric cars.
http://www.govtech.com/fs/transportation/Hawaii-Plan-Plots-Course-to-an-All-Electric-Car-Future.html
Renewable energy has faced a lot of headwind from utilities and the fossil fuels industry, but electric cars have it easier: Rich country utilities, who are faced with steadily decreasing demand for electricity, are very keen on competing in the car market. And they have the political clout to get charging infrastructure installed.
As Norway proved, all you need to kick start the electric car market is charging infrastructure and list prices that are lower than combustion engine list prices to kick start the electric car business. And battery prices are collapsing.
I agree, Maui could make big time progress.
Still having a house there, I’m hoping, but skeptical.
The Spanish government just changed. The new president is Socialist Pedro Sanchez. He runs a minority government known as the “Frankenstein”. Because socialists don’t have sufficient seats in parliament he made a deal with the Chavistas (Iglesias) who in turn are in an alliance with communists (Garzón), and the leftist separatists from Cataluña (ERC, whose leader is in jail), plus right wing Basque nationalists whose five seats are critical to get the majority vote.
Because Sanchez is clearly a left wing populist, but he can only govern with a right wing basque nationalist support, he just found himself in a funny situation: he has to govern with budgets approved by the center right and centrist faction. So he’s limited in the things he can do to destroy the economy, for now.
However, Sanchez is a populist, he has to bs until elections two years from now, so he’s putting out all sorts of populist statements, promises, and nutty proposals. He also created new ministries (which lack budgets) headed by radical feminists and all sorts of red commissions. The list of garbage they proposed is too long to discuss here, but I’ll mention one which has young men in an uproar is a proposal by his minister of justice to pass a law which requires that a woman say yes formally to having sex…otherwise the man would be accused of rape. Another move which created a serious concern is a proposal to raise social security taxes for those earning more than 45000 euros or $54000 dollars a year. In some cases the tax increase reaches $1000 dollars a month, so this will evidently impact payrolls and cause professionals and companies to leave the country.
The “formal yes before sex” proposal violates the Spanish constitution, and on top of the resentment, it has unleashed a lot of jokes about how notary public offices will be offering a service to provide certified witnesses via an app to horny couples.
The communist insistence on rewriting history about a 70 year old event, in which they try to paint themselves as victims, is just another move to please their fanatics. Spain doesn’t have a franquist party, but they try to associate anything which isn’t radically left wing as evil. This is part of their overall strategy. Eventually, if Spain doesn’t wake up, it will suffer the same fate as Cuba, Venezuela, Nicaragua, and other nations destroyed by this vermin.
Fernando,
Random political comments on Spain should be in the Open Thread.
Rants on Cuba should also not be in the Oil thread.
Venezuela is a bit more relevant, but only if focused on oil production or natural gas production, rather than politics only.
Thanks.
Your comments on the oil industry are much appreciated. The Open Thread is intended for off topic comments not related to Petroleum production and you are welcome to put your political comments there.
I think Hawai could go energy independend – they have lots of volcanos. Fetching know-how from Island how to tap them.
Geothermal energy has limits. For example, it’s possible the ongoing fissure 8 eruption which wiped out 600 homes was enhanced by water being injected at a nearby geothermal plant.
Fernando- you are peddling fake news on that geothermal/volcano issue, and you are smart enough to know that.
Hickory, that geothermal plant was injecting cold water to tap the east rift zone magma channel. Cold water injection shrinks the rocks, which in turn reduces the stress in a direction perpendicular to the rift zone axis. The stress reduction allows the magma to open the rift a bit wider and flow at higher volumes. I don’t think it’s a coincidence that fissure 8, that cone which is flowing lava at very high volumes, is located right next to the water injection wells. If you want to put me in contact with the local usgs types and I’ll put them in contact with a USA based engineer who can model the area and the dynamic effects, but they would have to prepare the gridded geomodel and provide the original stress fields.
Fernando Leanme,
I dunno.
The wells at the geothermal plant near Pahoa on the Big Island were producing steam and hot brine. The company (PGV) was re-injecting condensed steam and the brine.
Fissure 8, the one providing the lava, is maybe 600 feet above sea level and part of a string of fissures running down the East Rift Zone of Kilauea. I’d guess that the scale of the whole volcano and its East Rift Zone, which is on the volcano’s side and near sea level, suggests that PGV’s re-injection activities aren’t likely to have any effect.
Disclaimer: I am not now and never have been a volcano.
The big island is already a third geothermal. The sky must be falling.
Iceland is also about a third geothermal (with the rest of electricity coming from wind). Nearly all home heating is geothermal as well.
Synapsid, the injected fluids are cooler than the rocks, that plant extracts energy from hot rocks adjacent to a magma chamber, therefore they do cause a temperature drop in the area around the injection wells, and wherever those fluids are circulating.
It’s evident the east rift formed because the minimum stress is perpendicular to the rift (in other words, the rocks see less compression in a direction perpendicular to the rift zone). When we inject water into a low permeability rock we usually fracture it, and as the fracture plane cools down the rocks shrink, this in turn makes it easier to inject.
So…we know they were injecting water, the water is cooler than the rocks, therefore it shrinks the rocks. The eventual result seems to have been widespread fissuring (a natural phenomenom) with an unusual high rate and volume lava release caused by incremental weakness of the rocks at the físsure 8 location (its unlikely that it emerged right next to the plant by coincidence).
This can be investigated with more certainty by running models. And it’s also evident that the solution is to place the wells in a wider pattern, this will increase costs but it will allow the project to work for a longer period of time.
Fernando Leanme,
All good points, and you did specify fissure 8.
The USGS map of the Kilauea East Rift Zone shows abundant flow coverage within and alongside (within a couple of miles) the fissure line that’s been active recently, some of it as recent as 2016. Fissure 8 is fairly close to the PGV plant but the only other flows that are date back more than half a century. Flows have popped up all around the rift zone, but it’s true that doesn’t rule out PGV’s activity possibly playing a role this time around. I don’t consider it a compelling possibility but it can’t be ruled out.
Now, why Hawai’i County saw fit to permit those subdivisions in the rift zone leads me to wonder about their thinking, but that’s another tale.
“The big breakthrough may arrive when the tanks do not need to be pressurized to 3,000+ psi.”
Electric cars, Propane, or other energy sources won’t matter if consumers cannot afford cars at all. Subprime Autoloan durations have soars as consumers are ever stretched to make the payments. Thats why Ford is exiting the consumer car business and focusing on commercial and Luxury vehicles.
“If we lower the psi, won’t the gas tanks hold less gas, and reduce the distance capability?”
No, in the presence of substances like activated carbon, gases like methane can exists in a denser form as if they were under a higher pressure. Perhaps your familar that if you mix a gallon of water with a gallon a ethanol the total volume of the combined solution is less than 2 gallons.
“MOFs (Metal Organic Framework) that can adsorb methane way better than carbon or, apparently, anything else.”
But not likely commercial cost effective. Any storage media would have to be something low cost like carbonized chicken feathers.
“Price of CNG at Moore, Oklahoma 7-11 today (according to the CNG pricing site) is $1.29 GGE. That means filling up a 32 gallon F 150 for about 40 bucks.”
For now, but a lot of NatGas production & condense is from Shale production. Its likely that at some point the very indebted shale companies will run into financial problems. Then the supply & cost of NatGas & Condensates probably aren’t going to be cheap anymore.
Looks like OPEC 14 peaked two years. Can they beat it?, perhaps by a small amount in a world without chaos.
Today orange fatty called out Germany for being captive to Russia.
I’m pretty sure he was referring to German dependence on imported fossil energy from Russia.
As of 2015 Germany net energy imports are 64% of total [USA 12% for comparison].
If this means ‘captive’, then perhaps we should acknowledge that 11 of our top 13 trading partners
are highly dependent on imported energy from either Russia or the big OPEC producers.
‘Captives’ so to speak.
Better get used to that idea, and learn how to get along with others.
Only Canada and Mexico aren’t ‘captives’, but we don’t look to good at being friends with them either.
Impressive.
I don’t think any other Republican or Democrat would ever say what the Prez said. It’s an agreed upon secret.
But pointing out that Germany and by extension Europe funds NATO to counter Russia, and then sends billions of Euros to Russia each year for stuff that comes out of the ground, makes pretty much no sense. That’s funding the forces one is trying to counter with other funding.
Powerful stuff. He understands what it means. Hard to know if others understand it because they would never have dared say this.
But don’t those Euros come back to pay for things like cars and planes and medicine?
Seeing as the EU is Russia’s biggest trading partner.
Russia has two options, join the EU where it would have a seat at the table or become a Chinese province. The latter seems more likely thanks to Putin’s visionary leadership.
One theme dominates the last 40 years of world history: National leaders underestimate the power of international interconnectedness*.
When you rise to the top in your home country you expect to be the boss. It turns out you are just one of about 200 others, and you can’t do anything about it.
*This might not be a real word.
Powerful stuff. He understands what it means. Hard to know if others understand it because they would never have dared say this
Seriously?! He seems to understand very little about subjects as complex as energy and global international politics and trade relations. He is uncurious and uneducated about world history as well!
As for the Germans, they lost WWII and were forced to change their ways and had to learn the hard way, which doesn’t mean they have forgotten the past or are unaware of their current energy dependence on Russia.
Perhaps you should re-read the Bundeswehr Peak Oil Study which came out in 2010.
And whatever you may think of it, there is a reason the Germans embarked on a national energy transition plan called Energiewende! Which has helped pay the way for a lot of the alternative energy technology in use around the world today.
Would the US have done as much! Putin must be laughing at the thought of his upcoming private summit meeting with Trump!
My impression is that his pronouncements are made for two reasons:
1. To appeal to his hardcore supporters.
2. Whatever he can put his name on.
There doesn’t appear to be any strategy otherwise, and little, if any, thought given to the consequences.
https://demu.gr/100210864491
German TV show replaces Trump with the Baby Trump Blimp – HILARIOUS
US total (oil + products) inventories made a new low (from the high February 2017)
US ending stocks July 6th
Crude oil down -12.6 million barrels
Oil products down -0.7
Overall total, down -13.3 (shown on chart)
Natural Gas: Propane & NGPLs up +6.1 (not included in chart)
Chart: https://pbs.twimg.com/media/Dh1-upjXUBEOjvn.jpg
Weekly change in US total (oil + products) inventories
Chart: https://pbs.twimg.com/media/Dh1_SuAXUAcbc5M.jpg
Must have already been factored into the price based on API numbers on Tuesday as nothing much happened, although it’s going back up today. Looks like Trump is keeping the price down by initiating a trade war and global recession after his tweets to Saudi had the opposite effect than intended.
Oil is down 5%.. Glad Saudi Arabia solved our problems. lol
We should all bow down and kiss the feet of the glorious Saudi king, and thank him for him munificence.
My price model says oil price should average $68 over the near future. I believe the price hasn’t reached that average for 2018, but if I were to update it for $2019, it should be a bit higher.
11/7/2018
US crude oil imports and exports update April 2018 data
http://crudeoilpeak.info/us-crude-oil-imports-and-exports-update-april-2018-data
Mushalik,
Nice report on US imports and exports of C+C, thanks.
Yes indeed, excellent article as always Matt.
“Conclusion
No matter what clever US energy independence calculations are out there, the fact remains that the US is physically dependent on around 8 mb/d of crude oil imports, 4.3 mb/d out of which come from countries where oil production has already peaked and/or where there are socio- economic or geopolitical problems. As of April 2018 US net crude imports were about 6 mb/d, far from oil independence.”
I note also that about 45% of USA imports come from Canada, as well depicted in in your Fig 1. Thus we are ‘captives’ of Canada (to use the terminology of trump), but don’t seem to have much appreciation or respect for their position.
India – June
The Nikkei India Composite PMI Output Index rose from 50.4 in May to 53.3 in June, supported by output growth in both the manufacturing and service sectors. The latest reading was the strongest seen since October 2016 and indicative of a solid rate of expansion
2016-07-11 India has overtaken France to become the world’s sixth biggest economy, World Bank report
Fuel consumption chart: https://pbs.twimg.com/media/Dh5ZYTPX0AAcSz8.jpg
Diesel price in Rupees is up 28% since start of July 2017. The prior record highs when the oil price was >$100 was around R60.
Price chart: https://pbs.twimg.com/media/Dh5n7nNX0AAV03e.jpg
I noticed that for OPEC the countries with big fields have lower decline rates and higher chances of increases than the countries without big fields.
Could this have to do with the fact that advanced recovery works better for big fields?
EOR costs a lot so there are definitely economies of scale (and entry level requirements for it to be worth it).
Broadly speaking on a national level, the best place to find lots of additional oil is near where you already have lots of oil. If reserves are marginal to begin with, it is highly unlikely there’s an undiscovered giant field equivalent to add.
Mostly it’s because Saudi, UAE and Kuwait designed for 50 year field life cycles whereas non-OPEC design for 25; plus all the big onshore OPEC producers didn’t really know what they had when they started out so they’ve benefited a lot from new technology (not so much EOR but more just better drilling and secondary recovery).
So maybe this countries (Saudi Arabia, Kuwait, Iran, Iraq and the UAE.) will be more prone to higher decline rates when these big fields start breaking?
I’m going to post this here even though it isn’t directly about petroleum.
Cupertino, California — Apple today announced a new first-of-its-kind investment fund in China to connect suppliers with renewable energy sources. As part of Apple’s commitment to address climate change and increase the use of renewable energy within its supply chain, 10 initial suppliers and Apple will jointly invest nearly $300 million over the next four years into the China Clean Energy Fund. The fund will invest in and develop clean energy projects totaling more than 1 gigawatt of renewable energy in China, the equivalent of powering nearly 1 million homes.
https://www.apple.com/newsroom/2018/07/apple-launches-new-clean-energy-fund-in-china/
Pretty much all the big money in Silicon Valley believes that the energy business is ripe for a takeover. They figure internal combustion engines and thermal power plants are headed the same way mechanical watches, cassette tapes and cathode ray tubes.
They may be wrong — it wouldn’t be the first time — but that’s where the big bets are going.
The theory is that the business model is switching from fuel based revenues to a flat rate subscription model. That would crush any provider with high operating costs or any fuel costs. On this theory, only renewables will survive the coming price war.
Something similar is happening in transportation. Car makers like Ford are starting to lose interest in selling vehicles, and getting into subscription businesses like car and bike sharing.
From the WSJ Exxon story.
“[Exxon’s] approach is a gamble in a new era of energy breakthroughs such as fracking and electric vehicles. Many of Exxon’s competi-tors are transforming their businesses to move away from oil exploration, and have begun to spend carefully and diversify into renewable energy….”
“‘Most investors like Exxon, but they like other companies better,’ said Mark Stoeckle, chief executive of Adams Funds, which owns about $100 million in Exxon shares. ‘The market is not willing to reward Exxon for spending today in hopes that it will bring good returns tomorrow.’
“Exxon has been pledging to produce more oil and gas for years, but its output of about four million barrels a day is no higher today than it was after its merger with Mobil Corp. in 1999. Even if Exxon succeeds in doubling last year’s earnings of $15 billion (excluding impairments and tax reform impacts) by 2025, as Mr. Woods vowed in his eight-year spending plan, it would still be making far less than in 2008, when it set what was then a record for annual profits by an American corporation, at $45 billion….
“Exxon’s fracking prospects in the Permian basin in West Texas and New Mexico, developed by its XTO unit, remain among its most profitable opportunities, the company says. Still, its U.S. drilling business has lost money in 11 of the last 15 quarters.”
Exxon paid way too much for XTO. Anyway, now that prices are going up, Exxons strategy is very sound…it focuses on being the best in a business with ever increasing prices, where weaker competitors will go bankrupt or will be easy takeover targets.
Propaganda.
Just saw this looking for the release date of the next DPR report, on the EIA website:
“NOTE:
Productivity estimates may overstate actual production which could be limited by logistical constraints.”
So, EIA actually acknowledge these constraints, and admit they may be overstimating production, without saying by how much.
Reliable estimates of takeaway capacity for the Permian. Similar to Genscape, current pipeline capacity is estimated to be about 2.8. Drilling info does not mention total takeaway capacity, but Genscape estimates it at 3.3. Per the article, it was at 3.2 the end of May. The ending production, the end of 2017, was 2.8 from the Permian, making the end of May increase at 400k. I gave the projected increase 550k, because Genscape said 25k of additional trucking, may happen. Note, Drilling info lists some very small additional capacity that should come online this year, and soon, so it will probably wind up to be about 50k higher. Maybe. The gathering terminal gets it from New Mexico and West Texas to the Midland terminal, only, as I understand. The rest of the articles are mostly badly written press, but I think you can rely on Genscape and Drillinginfo.
https://info.drillinginfo.com/permian-oil-and-gas-takeaway-capacity-improvements-on-horizon/
Sometime soon, there will be an odd mixture of increased production and shut ins.
Also, if I estimate Permian production at 600k (generously), it equals the new EIA estimate. The remaining 600k US C&C production will have to come from other shales and the GOM. Good luck with that, it’s July, already, and prices are too up and down, to date. Contrary to the EIA’s and other analysts thoughts, $65 to $70 oil is pretty ho hum to producers. Also, there is no allowance here for other declines, of which there are some.
So, an updated revision to US increases (liquids) would be:
700 c@c US (600 Permian, 100 Bakken and others, GOM 0)
400 US NGLs ? Seems real high for an increase
250 Canada
180 Brazil
300 Russia
Total 1.83 versus a projection of an increase by EIA in the non-OPEC section of the STEO of 2.6, and I think mine is very “optimistic”. And, as Ron points out above, it does not include roughly about 300 to 500k in declines that may happen to non-US, Russia and Canada non-OPEC production. The EIA’s STEO report can be found in the local library next to Mother Goose.
According to the EIA, we are pretty much finished with inventory declines.?
Food for thought.
Based on EIA tight oil estimates (link below), not the DPR, data in kb/d through May 2018.
https://www.eia.gov/energyexplained/data/U.S.%20tight%20oil%20production.xlsx
Curious. Indicates about a 550k increase from Dec 2017, which does not jive with the April monthlies that are posted. Which was about 350k for Texas and New Mexico, and another 50k from ND. Something else we are not considering? Drop in conventional Permian?
The dates on the spreadsheet defies comprehension.
Guym, you should take a step back before pointing errors.
The diagramm is made by Dennis, based on data from the eia spreadsheet. Dates are put in decimal… 2018.4 is for may, not April.
Data (growth) is consistent with monthly reports and DPR. Levels are different, as it doesn’t take account of conventional reservoirs as the DPR does.
1’600 kb/d growth in 16 months… That makes 100kb/d growth each months, and the first months of 2018 are following it.
I’m always a bit wary with the latest estimates (here, May) until the monthly report is out. Especially for the fields located in Texas/New Mexico.
I read 43221 as the latest date, when I pull up the spreadsheet from my IPhone. All the rest look similar. If I had known it was May, there would be no comment. April is the latest date on the graph.
Tita,
Good point on May data point, that is probably less reliable as even Drilling info data is not that good for recent months especially in Texas. Typically its a bit low if anything.
So these EIA estimates would probably be revised higher for recent months.
Guym,
Do you mean the dates on the chart? Those are years, data is from Jan 2017 to May 2018. Years were used so the slope of the trendline has units of kilobarrels per day per year (about a 1200 kb/d annual rate of increase on average over the past 17 months for all US tight oil output.
The spreadsheet has dates by month and year, maybe you aren’t using Excel or are using an older version. and the date column is not formatted properly?
For the Permian basin over this 17 month period it was about an average annual rate of increase of 750 b/d, actual Permian basin increase based on EIA tight oil data (from drilling info) was about 264 kb/d from Dec 2017 to May 2018 and for the entire US tight oil industry the increase from Dec 2017 to May 2018 was 383 kb/d.
Let’s assume the non-Permian tight oil output increases at least as fast as 2017 (due to higher oil prices), or about 450 kb/d in 2018, perhaps Permian output only increases by 550 kb/d in 2018 due to pipeline constraints (I think 700 kb/d is a better guess for the 2018 Permian basin increase), that would be a 1000 (or 1150)kb/d increase in US tight oil output in 2018, perhaps conventional output will decrease, but if oil prices continue to rise, my guess is conventional output in 2018 will be about the same as 2017.
Also note that from 1982 to 2017 World C+C output has increased at an average annual rate of 800 kb/d, this is the long term rate of increase in C+C demand. The estimates of 1.3 or 1.5 Mb/d “liquids” demand increase by OPEC, IEA and EIA include NGL, biofuels, coal to liquids(CTL) and natural gas to liquids (GTL) output. I think a focus on crude plus condensate (aka oil) makes more sense.
Yeah, it’s definitely in my pull-up. I have to go to Safari, then I can pull up the latest excel. Otherwise, it’s garbled. May estimates really do not show much of an increase over April, only about 60k to April’s 120k. However, as Tita points out, they are only estimates. 550 vs 700, is no big argument. First time I have encountered this problem with the iPhone, sorry, I’ll be forewarned next time. Yes, concentrating on C&C makes the only sense. It will be short, and getting to the actual will mean we wait until the monthlies to ascertain the true production. In the meantime, we watch the inventory build expected by the EIA.?
The EIA tight oil estimates are pretty good, not the DPR that is a model which tends to overestimate and includes conventional from the tight oil regions. Main point is that c+c demand increase is only 800 kb/d about half of the all liquids increase estimate of 1400 kb/d.
So output may only be a bit short maybe 200 kb/d.
Ok, then we should be fine. 200k won’t put a dent in world inventories. Ignore everything I posted, EIA is the yin and the yang. Their projections are gold, and oil declines are only a figment of somebody’s wild imagination. I’ll check back in November.
Guym,
The EIA output estimates (of past output) are good, their projections are not very good.
Much of the confusion is due to “all liquids” projections of both production and consumption of petroleum.
Just look at past output data for C+C from the EIA. Output has increased for the past 35 years at an average annual rate of 788 kb/d. In 2017 annual World output was 81034 kb/d and in 1982 output was 53454 kb/d, a difference of 27581 kb/d divided by 35 years results in 788 kb/d average annual increase. Note that the trendline for 1982 to 2017 World C+C output has a slope of 800 kb/d.
None of the above uses EIA projections, just past output data.
I will repeat my previous point that the projections for future consumption are “all liquids” not C+C. Those projections (about 1300 to 1500 kb/d) for World liquids consumption increase in 2018 are not very good, they are about 600 kb/d higher than the likely increase in World C+C consumption in 2018.
So basically I reject most of the EIA, IEA, and OPEC future projections as irrelevant, in all cases their projections for World output are all liquids and not C+C.
Over the long term (35 years) output and consumption of C+C will match fairly closely so using past output as an estimate of past consumption will give a fairly good estimate. The estimates of World C+C stock levels are not very good.
another chart with US tight oil and Permian basin tight oil in kb/d from Jan 2017 to May 2018.
The Wall Street Journal has a big article on Exxon. I won’t bother with a link because you won’t be able to see it if you aren’t a subscriber.
Basically it says we’ve seen peak Exxon.
Which explains why the author writes for a newspaper and doesn’t run an oil company.
What is written about in the Wall Street Journal is relevant to investor interest. When the mainstream business media questions the future of big oil, then that indicates there is skepticism now where there wasn’t a few years ago.
It was only recently that the accepted story was that LTO would solve all present and future oil needs for the US.
I never thought “LTO” was such a big deal. Most newspaper writers are fairly ignorant about the business. Hell, about 50% of oil company managers don’t know what they are doing, so how can we expect somebody working for a newspaper to understand how it works?
Director’s Cut out for May North Dakota just released.
New record production for both oil and gas with pretty low – 42 — well completions reported as preliminary figures.
How much was production?
38,583,489 bbl. 1,244,629 bbld. 96% from Bakken TF (1,189,982 bbld).
Gas – 71,881,378 Bcf. 2.3 Bcfd.
Oil increase is about 1.6% above previous month.
Thanks!
The number of producing wells in the Bakken/Three Forks increased by about 146 wells from April to May 2018.
The completed around 95 according to my data. The is lag in the data on confidential wells that will show up next month in the final data. Also if the Bakken was to get and hold 1.4 million barrels a day the would need to complete around 1500 wells per year.
Munchkins sabre rattling about Iran sanctions affecting everyone, including Russia and China, should raise some eyebrows as to the possible Iranian oil drop. Teapots can probably just give him the finger, but large National oil companies do run a risk. Same with Russian companies, but I think they are getting used to it. Think we have seen the last to US exports to China for awhile.
The Trump administration is becoming well known for its threats, bombast, and imperial manners. But if oil prices go higher because of Iran sanctions we will see Iranian oil move even it it has to do it disguised as pistachios.
For those interested, the latest GOM BOEM reserve estimates are published. The report was published in June/2018 and is effective through December-2016.
https://www.boem.gov/Reserves-Inventory-Program-Gulf-of-Mexico-OCS-Region/
The link above should take you to it.
Are you kidding me?
Figure 1 represents the percentages of Cumulative Production and Reserves in the GOM. Contingent and Undiscovered Resources are not included in this report.
92% of all discovered oil in the Gulf of Mexico has already been produced?
??? Looks like a George question to me.
There are 2 things going on here:
1. The Gulf has historically been a gas province, and that is especially true for the shelf. At it’s peak (in 1996-1997), the GOM was the 2nd leading gas producer in the US, behind Texas, producing some 14 bcf or so a day. Now its’s only producing 2-3 bcf per day, and most hydrocarbon production, by far, is coming from deepwater, which is much more an oil province.
The BOE equivalent of all that historical gas production, as shown in the pie chart, is about 33.5 MMBOE (they’re using something like 5.6 bcf = 1 mmbo as their conversion).
All of this historical gas production skews the ultimate BOE picture.
If they had just shown oil production, the remaining oil would be 15%, not 9 % – still not a lot, but it leads to the 2nd point.
2. The purple wedge is just showing BOEM’s estimate of proven reserves, where they show 3.6 Gbo + 6.8 TCF gas (which equals a little over 1 Bbo). If you add up their cum oil production + proven reserves, you get about 24 Gbo.
Over the years, on this website, a number of estimates of total GOM oil production have been made. These estimates, which have included not only proven but also probable reserves, have shown ultimate EUR of something closer to 30 Gbo.
So if you just look at oil production, and consider proven and probable reserves, the GOM has yet to produce about 33% of the total endowment.
Okay, but if we have produced 67% of all the oil there then we are still way past peak. And when you get that far past peak, production should be dropping off quite steeply. It should be happening right now. What technology is keeping that from happening?
We probably reached peak oil in the GOM early last year,which is essentially when the BOEM report came out. (This peak is slightly higher than the peak in 2009/2010. I don’t believe the EIA assessments which continue to show increasing GOM production at least through 2019). So, if we are past peak oil, and have produced 67% of the EUR, what is keeping production from plummeting, and what will allow the GOM to produce past 24 Gb and up to 30 Gb?
(My own personal commentary – who says production has to plummet after peak oil? Over the years, many commentaries I’ve seen have said that after peak oil, production may continue with an “undulating plateau” profile. Maybe that’s what we’re seeing in the GOM?)
What’s keeping current production levels from dropping off quickly?
I think its because, even though drilling is down, where drilling is occurring is in the biggest fields, where the wells IP at higher rates, tend to maintain those rates longer, and tend to have higher per well recoveries. This will probably not go on much longer, but then something else starts to fill in the production gaps – new projects in these largest fields – like TVEX at Tahiti, the new Atlantis project, and CaesarTonga 2.
What is going to allow the GOM to produce past 24 Gb and up to 30 Gb? Between now and 2022 or so projects like Vito, Appomattox and it’s tie-backs, Mad Dog 2. I’m sure there are others, but these probably have the potential to have the biggest impacts – say over 50 kbopd or so.
After that, what needs to occur is the development of 20K psi technology to handle the HPHT conditions associated with some of the deepest Wilcox discoveries like Anchor.
GoM has had three different development cycles – shallow, deep and ultra deep – which have been superimposed on each other, and the last two were interrupted by the Deep Water Horizon drilling hiatus. Without that there would likely have been a clearer and higher peak around 2013 and 2014. Damage and delays from hurricanes in previous years may also have played a part (e.g Thunder Horse almost sinking).
Because the shallow water was developed so early it benefited from each new technology so early reserve estimates grew significantly and the cycle was drawn out.
The BOEM estimates are highly conservative I think: their 2P is still below the EIA proven numbers (from the E&Ps) though they are catching up. The 2007 SPE rule changes took a big gouge out of the BOEM numbers which is gradually getting put back in. The E&Ps seemed to address this simply by a lot of upward revisions that turned probable into proven and there wasn’t the same drop.
One thing the pattern of declines and increases in reserves doesn’t show is any kind of correlation with current price (less than 100%, and a couple of big negative replacement ratios in the high price years, and two years at about 112% replacement ratio since the price crash).
This shows comparison with EIA. Note also the drop off in discoveries – as you highlight below there is no sign of this changing at the moment.
There has been a big increase in computing power in the last few years, believe it or not. That has allowed the use of a seismic processing technology called Full Waveform Inversion which is better at unpicking the complex ray paths beneath carbonate and salt layers that change thickness rapidly. Thus the deep water GOM would have benefited from this iteration of technology which allowed another round of discoveries to occur.
FWI was key to BP’s most recent Atlantis big resource add that resulted in a new project. It’s probably going to start becoming standard in new GOM seismic acquisitions/processings. BP is the leader in this right now, but the vendors will catch up.
The existing subsalt trends have been, for the most part, defined pretty well with existing seismic data sets. I don’t foresee FWI unveiling a whole new trend that was never seen before.
FWI will be used to improve/upgrade the image on existing discoveries and fields.
It was interesting in the numbers that Atlantis had a big write down, I guess the BOEM numbers don’t include the new discoveries which are due for development in 2020.
So La Geo,
I would think that would result in significant reserve appreciation over time.
Undiscovered resources are about 48 Gb according to boem, contingent resources and reserve growth have a mean estimate of about 12 Gb, so when we add 48+12+23 we get a mean TRR estimate of about 83 Gb. When we assume $60/b oil price the ERR drops to about 73 Gb.
SoLaGeo discounts this a bit, by 37 Gb. 😉
Any suggestions on how to use some of the undiscovered resources in my bank account to pay my future bills., I’m sure they are in there somewhere. Maybe up to about 480,000 dollars worth. My bank has heretofore been rather unreceptive to my attempts at explaining that they are really there… 😉
Sorry, but no matter how many people try to explain the logic, methods and the math behind putting a number on ‘Undiscovered Resources’, I just tend to remain a tad skeptical.
Hey, don’t knock it. I have about $10,000 in “undiscovered cash”. I am going to look for it this afternoon when I take a long walk. In the meantime, I am going to buy me a nice boat, on credit of course. But I will pay it off when my undiscovered cash shows up.
Or you could just get into shale.
Profit and economics are in the rear view mirror.
Don’t worry Fred, it’s all done from scientific geological projections and uses simpler models than climate science.
The approach to resource evaluation should be
aggressive and basically optimistic-even imaginative
and daring. Undiscovered resources will remain undiscovered
as long as investigations are limited to
an inventory of known deposits or as long as investigators
fail to use carefully reasoned geologic
predictions to suggest the likelihood of resource
occurrences. Conclusions must be based solidly on
evidence, the criteria for conclusions must be stated
clearly, and an account of the logic used in the analysis
must be provided. The assessment should state the
date of the assessment: although the rocks change
very slowly, our understanding of them may change
rapidly.
https://www.nwrc.usgs.gov/techrpt/sta13.pdf
Undiscovered resources will remain undiscovered
as long as investigations are limited to
an inventory of known deposits or as long as investigators…
Ah, I finally see the light! All I have to do is convince my bank that they have to look past my known deposits, and also consider the ones they don’t know about yet. So simple, how could I have missed that! 😉
Edit: Unfortunately my balance seems to change faster than my own understanding of it. Usually in a downward spiral of rapid depletion.
Fred,
The tendency of peak oil analysts to ignore the potential for future discoveries as well as reserve growth has often resulted in premature predictions of an imminent peak (2005, 2008, 2015, etc). Those incorrect predictions have tended to reduce the credibility of “peak oil theory”.
I doubt that the BOEM mean estimate of undiscovered technically recoverable resources (UTRR) of 48 Gb for the US GOM is correct.
I am equally skeptical that a UTRR estimate of zero is correct. Let’s take as an initial guess 24+/-24 Gb for the UTRR for the US GOM.
This is simply based on the expert analysis of George Kaplan and SoLaGeo (UTRR=0) and the BOEM (48 Gb) taking the average as the best guess and assuming it will fall in that range of 0 to 48 Gb.
What makes things even more complicated is the estimate of future investment in finding these Ressources.
At the current rates, not much new is found – but this can change again.
24 Gb or 48 Gb unfound reserves must exist AND be found – things go even more complicated.
I could think there are more undiscovered unconventional reserves worldwide, where nobody has looked as for conventional oil.
But they
– must be found in time
– Enough money must be available, they are not cheap
– The country they are found on must be politically stable enough to spend multiple billions of $.
That’s why a peak call is even more complicated – 200 Gb tar sands in Venezuela is less worth than 50Gb frackable formations in Mexiko for example.
And in 10 years it’s perhaps the other way round…
1) Why apply any error bars to produced reserves – they are known pretty well exactly?
2) Why apply much of an error to anything for shallow water – the reserves are almost exhausted and there isn’t much unknown now?
3) Why base the size of unknown for undiscovered reserves on the size of discovered – that would imply the more discoveries in a basin the more the there is to discover and/or the less is known about the remaining undiscovered resources, which is the opposite of what actually happens?
4) Why apply any kind of argument based on one sort of geology to a completely different sort, which may or may not be prospective?
5) Why ignore the fact that the E&Ps aren’t really taking a lot of interest in lease sales at the moment?
6) Why ignore the fact that at current discovery rates it will take several hundred years to find the high levels of the range you are proposing?
7) Why ignore the fact that recent reserve additions are negatively correlated to oil price when your argument seems to be based on an assumed strongly positive correlation?
Hi George,
No such assumptions are made.
The BOEM estimates GOM UTRR as being 48 Gb, you estimate essentially zero. Perhaps you will be correct, I am skeptical. I also don’t think the 48 Gb estimate will be correct.
Correlations between oil price “discoveries” or reserve growth need to take account of the lag between changes in oil prices and the expected future price of oil that informs oil company investment decisions. I would be surprised to see any correlation between oil prices and exploration activity, due to this time lag.
You have suggested that BOEM is quite conservative in their GOM reserve assessments, perhaps their assessments of undiscovered resources are reasonable, I am suggesting perhaps GOM UTRR might be half the mean estimate by the BOEM (24 Gb instead of 48 Gb), the BOEM’s f95 estimate is about 40 Gb for UTRR for the US GOM.
The most recent report is at link below
https://www.boem.gov/BOEM-2017-005/
No doubt you have already looked at it and dismissed it.
Even at $40/b the undiscovered economically recoverable resource (UERR) at the F95 level is 29 Gb (page 37 of the report linked above), mean is 35 Gb and F5 is 43 Gb.
So how do they estimate “technical resources”? When I had to give our staff guidance on how to estimate it I told them to make believe the oil price was $150 per barrel.
They probably use a higher price than $150/b, maybe $200/b. At $160/b the mean undiscovered ERR estimate for the US GOM by the BOEM is 45 Gb, vs a UTRR mean estimate of 48 Gb.
George,
The error bars are just applied to URR, some of which is produced oil, yes the shallow reserves are small and mostly exhausted, most of the undiscovered resource is in deep water 40 of 48 Gb in depths greater than 800 meters (mean estimate).
For UTRR in US GOM water deeper than 799 meters the f95 estimate is 30 Gb, mean is 40 Gb, and 51 Gb for the f5 estimate. For undiscovered economically recoverable resources (UERR) in water deeper than 799 meters at $100/b for oil and $5.34/Mcf for natural gas the f95 estimate is 26 Gb, mean is 35 Gb, and f5 estimate is 45 Gb.
Since 2000 the BOEM estimate for the total endowment of oil in the US GOM has increased from 60 Gb to 83 Gb (mean estimate of all resources including produced oil, reserves, contingent resources, reserve appreciation, and undiscovered technically recoverable resources).
From 2002 to 2016 2P reserves plus cumulative production increased by about 5 Gb
I am only halfway educated in the field of oil geology. But I respect the knowledge of those more educated, like George Kaplan and accept that there are serious geological constraints when it comes to keeping oil production high or even higher at these high levels compared to reserves. The key the way I see it, is that the basins that can contain hydrocarbons are constrained in size and just have to be confined to parts of the earth (dare I say 30% at most?, I have not studied it in detail). And moreover, the most promising basins are already mapped and are in full progress of being exploited. And if more basins are in the horizon and not good enough explored they are in the arctic, offshore or severly landlocked or hampered in one way or another (reservoir complexity and oil quality issues comes to mind). I am in agreement with G.Kaplan that no amount of investment capital can fix the combination of poorer oil resovoir prospects and in addition overexplotation of the best existing resovoirs. So what we are facing is an uncertain oil tail of oil production soon. If enough money is invested, then oil production could be very slow declining in average for a while. But the high point in production resulting from this is most likely below current high. Natural gas, coal and renewables will make the oil peak more livable. But when natural gas and coal meet their limitations in 20 years…the transition period to other things must have been largely accomplished. And the transition can halfway work, some by electric cars, and more electric rail transport, more economic sea transport, more economical house heating, quite a bit with more wind power and solar, more geothermal power, biomass power (e.g. sugar cane) and a further expansion of hydro power. The consequence when it comes to quality of life is unknown. The whole transition is very likely to be slow moving. And there is also a possibilty of a remarkable technology breakthrough, just like there is a chance that an asteroid will hit the earth. Just don’t count on it. This is where I am at the moment, up for revision.
There are many different opinions on this, a good peer reviewed paper at link below.
http://rsta.royalsocietypublishing.org/content/372/2006
http://rsta.royalsocietypublishing.org/content/372/2006/20130179
The paper linked above in section 3b has World 2P conventional reserves at about 1263 in 2011 and cumulative C+C production was about 1160 at the end of 2011 suggesting a World C+C URR of 2423 at minimum.
There is likely to be another 400 Gb of discoveries and reserve growth in my view.
There is likely to be another 400 Gb of discoveries and reserve growth in my view.
Not a snowball’s chance in hell of that happening.
All-time low for discovered resources in 2017
Less than seven billion barrels of oil equivalent has been discovered YTD. ..
Not only did the total volume of discovered resources decrease – so did the resources per discovered field. An average offshore discovery in 2017 held ~100 million barrels of oil equivalent, compared to 150 million boe in 2012. “Low resources per discovered field can influence its commerciality. Under our current base case price scenario, we estimate that over 1 billion boe discovered during 2017 might never be developed.
6.7 boe and about half of that was gas. And it was in such tiny fields that much of that will be uneconomical to produce.
Also, there is no such thing as “reserve growth”. Reserves are reported to grow when there was a bad estimate of URR in a field and that estimate is updated. However, most of the old fields have been reassessed and their URR has already been updated. In other words, most fields have already grown all they will ever grow.
Ron,
There is indeed reserve appreciation, in fact every year there are revisions to US reserves and the net tends to be higher every year, that is for proved reserves, we don’t have good estimates for 2P reserves except in the Gulf of Mexico.
Perhaps you are correct that reserve growth has ended, but I am skeptical. There are a lot of “possible” (the last p in 3P reserve estimates) reserves that are likely to be converted to “probable reserves” over time as well as a large amount of “contingent resources” that may be moved into the reserve category as oil prices increase and those resources become profitable to produce.
This is how reserve appreciation (aka “growth”) occurs.
Jean Laherrere expects no 2P reserve growth beyond 7 years after an oil discovery, the USGS does not agree with Laherrere’s assessment. Again my best guess could be incorrect my low estimate may be right, then again, my best guess could be too low and my high estimate may be better. Time will answer this question.
To be clear I expect the total increase in cumulative discoveries to be about 377 Gb, this is the sum of discoveries plus reserve appreciation. My expectation is that most of this will be reserve appreciation (maybe 2/3 of the total or 251 Gb).
Dennis,
I have to say that you are actually more familiar with BOEM’s reserve and resource estimates than I am, and acknowledge that their numbers, when combined with cum production to date, results in an EUR of around 36 Gbo, which is my high side estimate from below. Maybe I do question their contingent resource numbers a bit, but probably not enough to move the needle too much. And I agree with you that their UTRR number of 48 Gbo is too high. That’s why I apply a 15-20% discount (to be understood as Geologic probability of success) to that number. I think a discount of 50%, which you are comfortable with, is way too high for what are likely to be a lot of Rank wildcat prospects.
Another issue that needs to be considered is this – as new prospects are drilled outside the bounds of the existing trends (and even the Wilcox trend, which was frontier 5-6 years ago, is now becoming pretty well defined), the concern some explorationists have is the trends may be more gas prone (due to either changes in source rocks, or burial depth). So, in a strict sense, these gas discoveries won’t have much impact on oil EUR.
SouthLaGeo,
I am assuming there are geophysicists and geologists that work for the BOEM who are already applying reasonable risk ratios to the original oil in place, though no doubt this assumption might be incorrect.
When the BOEM assumes $40/b oil and a natural gas price that is 0.3 the oil price (in boe) or $12/boe in this case their undiscovered economically recoverable resource (UERR) estimate has a 95% probability of being more than 36 Gb, my WAG is 24 for UTRR, with UERR of perhaps 20 Gb for US GOM, if we take your 20% and apply it to 48 Gb (mean UTRR estimate), that would give us about 10 Gb. Perhaps a range of 10 to 20 Gb would be reasonable for the UERR for the US GOM. That would surely be a better estimate in my humble opinion than either 0 Gb or 43 Gb for UERR (at $100/b) for the US GOM.
SouthLaGeo,
The reserve information should be combined with undiscovered economically recoverable resources.
See
https://www.boem.gov/2016a-National-Assessment-of-Undiscovered-Oil-and-Gas-Resources/
The report linked above suggests about 35 Gb of undiscovered resources at $40/b and 43 Gb at $110/b for the Gulf of Mexico OCS. So potentially there may be quite a bit more oil than what is covered by proved plus probable reserves.
Dennis,
I agree. The 30 Gb I was referring to does not include this upside you reference, although I’ve always discounted those undiscovered resource numbers quite a bit, and I believe recent exploration results may support that.
My current low-mid-high estimates of GOM EUR are 27-31-36 Gbo.
SouthLaGeo,
So your undiscovered ERR would be about 12 Gb, where the BOEM’s F95 UTRR estimate is 40 Gb for the GOM, also there is reserve growth and contingent resources of about 12 Gb combined, making the mean URR estimate about 83 Gb and maybe 70 Gb for the f95 estimate.
The ERR estimate for undiscovered resources is about 40 Gb at $60/b, similar to the f95 UTRR estimate, we don’t have f95 estimates for contingent resources and reserve appreciation, bot can adjust those from 12 to 10 Gb (based on change of UTRR to UERR from 48 to 40 Gb). Note U indicates “undiscovered” rather that ultimate in previous sentence.
This suggests a URR of at least 73 Gb for the GOM at minimum based on BOEM analysis, roughly 2 times higher than SoLa Geo’s high estimate.
The average of these two estimates would be about 54 Gb and my guess would be 36, 54, 73 Gb URR for US GOM c+c(f95,f50,f5 respectively).
Higher oil prices in the future may allow an undulating plateau for quite a while.
George generally dos not speculate about undiscovered resources and models based on 2P reserves, essentially he assumes future discoveries will be zero.
So La Geo seems to include reserve growths and contingent resources, about 12 Gb for his high estimate, bbut also assumes no further discovery.
The BOEM expects minimum levels of discovery of about 40 Gb for the GOM.
I wouldn’t say my high side estimate of 36 Gb includes no further exploration success – I don’t get granular enough to say to say how many Gb may be due to exploration, but it would be at least 1-2 above the mid-case estimate.
I can say though that I’m quite confident BOEM’s 40 Gb of “yet to be discovered” is too high. That’s twice what the GOM has produced to date. I would at least discount that by an average POS of high risk exploration – not sure what that number is these days, but probably in the 15-20% POS range.
I suspect BOEM arrives at the 48 Gb by mapping what they interpret as the most prospective horizon onto all of the undrilled structures (they have access to all of the seismic industry acquires), estimating most likely fill-up on these structures, estimating most likely reservoir thickness, estimating most likely rock properties, then calculating an OOIP from that – then they probably apply their best estimate of a recovery factor to determine the most likely recoverable resource. After doing this for all of these undrilled structures, they just add up all of the resource estimates.
Not sure if this is how they do it, but it seems to me like it has to be some process like this.
So a logical question might be – why doesn’t industry come along and drill all these structures? I can think of a number of reason.
1. Some of these structures may not be well imaged enough for an oil company to risk $150 MM to test them. This translates into geometry risk.
2. Industry may not be convinced that offset well control best represents what could be encountered at the undrilled structure, or there may not be any good offset well control. This translates into reservoir risk.
3. The other 2 risk elements are seal and hydrocarbon presence (some add a fifth element around timing). These can be a bit more difficult to assess, but, in general, for an undrilled structure in the GOM, these will at least be no better than 50%, and usually lower.
So while BOEM may see a 300 mmbo prospect, an oil company may see it as a 200 mmbo prospect with a 20% probability of success.
SouthLaGeo,
Thanks. It would seem that your high estimate matches the BOEM combined 2P reserve, cumulative production, contingent resource, and reserve appreciation estimate for the GOM almost exactly.
So in a sense, if their estimates for everything except undiscovered resources is correct and your maximum estimate is also approximately correct, that would imply that the mean undiscovered resource estimate should be zero rather than 48 Gb (the BOEM estimate).
Note that I am not suggesting that 48 Gb is correct, but 0 probably is not right either.
As a WAG I suggest 24 Gb (the average of the two estimates) for UTRR.
Maybe they should start considering the source rock oil and gas generation potential, how much escapes and migrates to a trap with a certain size?
I mention this because in the past I saw really goofy resource estimates for large traps located fairly far from potential source rocks. And in some cases the seal wasn’t competent enough to trap a large oil column.
Hi Fernando,
The report is prepared by geoscientists and reservoir engineers, you should give it a read and see what they are missing.
Do you have a guess for UERR for GOM at $100/b oil and $30/boe natural gas?
Based on a comment by SouthLaGeo and the BOEM resource report maybe 15+/-5 Gb is reasonable for US GOM undiscovered ERR for $100/b oil and $30/boe NG?
SouthLaGeo,
I believe the evaluation process is as you describe, but I imagine they also apply a risk ratio in their models, unfortunately there is not much detail on the model in the most recent report.
I’ll try and find out. I’m attending an industry event shortly where BOEM usually sends people. I’ll ask them if they apply risk to their UTRR estimates.
Thanks.
Interesting history at link below
https://www.boem.gov/Historic-Assessments/
30gb is a lot of potential years of undulating peaks?
20 of that 30 has already been produced.
George Kaplan’s latest bottoms-up production predictions from his 2/2/18 post showed GOM production levels dropping from the current 1.6+ mmbopd to around 1.2 mmbopd in 2022, and then rising to a final peak of about 1.4-1.5 mmbopd in 2024, and then going into terminal decline after that. I’m pretty much in agreement with that.
Thanks!
Here are my updated Bakken graphs. Not long ago since last time it feels. The April wells production in May was even higher than the record high March wells production was in April. The May wells also had a relatively high production in May (not seen here). There were 107 new wells in May and 98 in April. So many new wells with very high initial production. Total Bakken production increased only a little though. The reason for that was higher declines from legacy wells. It was mainly the 2017 wells that contributed to the legacy declines (30k vs 15k for 2007-2016).
Here is the production graph. Some increases for some years and decreases for others… Not that exciting.
The GOR graph looks really interesting this month. Increases for all years and for some years by a lot (see 2016). The decline rates have been low recently. Perhaps this is an indication that they will start to increase again.
I think there’s a bit of a seasonal signal in the GOR so hotter temperatures increase the GOR, presumably because the separators are unheated. It’s more pronounced in older production when the flows were lower and there would have been more cooling, but it can be seen in the last couple of summers as well and now this year (red is GOR, blue is scaled average of monthly average high/low for ND from the weather service).
Ok interesting. But I can´t really see the correlation from 2007 and later. I think there is something else going on.
There are other things happening – the main one is the upward trend caused by reduction in flaring. The temperature correlation would likely be better using actual monthly temperatures rather than averages and correcting for total gas flow, but the recent correlation has been close.
But I use gas, not gas sold in my data. Is it gas sold in your graphs?
No, GOR based on gas produced.
Ok maybe, but I think we are missing an explanation why it´s not visible 2007 to 2015.
I think it is but there’s lots of other stuff going on, like a big increase in LTO which may have different properties, addition of gas take away so changing pressures in the separators, possible outages from freeze off etc.
An article I found in Oilprice about peak oil:
https://oilprice.com/Energy/Crude-Oil/Is-The-Oil-Industry-Repeating-A-Critical-Error.html
(The title seems misplaced)
If one reads that with a proper mindset one realizes then what is being said there is that oil will flow regardless of price.
Oil stops flowing when there’s no more there to flow.
Most of what he is pointing out there refers to shale production that is not based in economic advantage. The truth of the matter is all oil production will not be based an economic advantage, because it is the stuff of life. It flows because it has to flow, and when it doesn’t flow most people will die.
This really is not rocket science.
I think he has a good point about the shale oil phenomena. No one predicted that shale oil production would increaseas much as it has. To be able to make future oil production forecasts I guess you also need to factor in human psychology. There is still plenty of net energy to society. That energy you can spend on for example producing more cars or you can spend it on shale oil wells. There need to be a balance between investing in new production and on consumption growth. This means that there could be temporary “oil gluts” even as oil production start to decline. If consumption declines faster because of recessions than oil production does, then there will be too much oil. If the peak oil community had not warned about future oil shortages, then perhaps shale oil production would not have increased as much as it has and we would have had shortages by now instead.
Freddy, a careful look at the consumption data from BP reveals explosive growth in African consumption. Double digit % year to year.
Not coincidently, that’s where the world’s population growth is.
Recessions and consumption. Oil is life. If population grows, so will consumption, even if GDP doesn’t grow.
Global Consumption
2007 87.1 mbpd
2008 86.515 mbpd
2009 85.587 mbpd
2010 88.535 mbpd
That’s a tiny 1.7% maximum decline in not just a recession, in the worst global financial event in the history of the world.
And that’s BP data. That’s all liquids. A goodly chunk of that is more sensitive to recession (making plastics) than planting and hauling food, requiring oil rather than plastic making condensate. So the consumption decline in the really important liquid was likely less in the recession.
Population (and its lifestyle) decides consumption.
Yes oil consumption and world GDP declined by a surprisingly small amount during the financial crisis. What would it mean for the world economy if they declined by a couple of percent every year? A scary thought.
A huge influx of credit from everywhere (not at least China), turned the economic downturn around not that long after the financial crisis. The system works in a way that it has to grow and the way to get out of a crisis is through expanding central bank balance sheets (more credit thrown in to the banks first). The downside scenarios if things go wrong in let’s say a year time are too scary to think through. So most people don’t, and I will also not speculate on it.
It’s nice how so many phrases are created to obfuscate a simple reality. “Expand balance sheet”. “Quantitative Ease”.
The simple reality — what this means — is Central Banks, not just the Fed, created money from nothingness and funneled it to places selected to prevent systemic unraveling. The HUGE difference in 2008 vs the past was central banks did not act in their national interests — if those national interests would have risked systemic damage. In the old days, if a country created money from nothing in huge quantities, the other central banks would intervene in the currency markets to make sure that money creating country’s currency was smashed.
This time, no. This time, they orchestrated money creation from thin air by everyone.
And at no time during the process did they let it be all that clear or talked about that capitalism, capitalism fundamentally itself, had outright failed and was being restarted.
Hi and thanks for all great posts,
did not find this posted before
Norwegian oil strike widens:
https://www.reuters.com/article/us-norway-oil-wages-strike/norway-oil-strike-to-widen-from-monday-after-no-compromise-talks-idUSKBN1K50QM
It has to be mentioned that service suppliers in the North Sea have been squeezed to the max during this downturn. Both the Johan Sverdrup and Johan Castberg fields have had their break even price more than halved during the period 2015- to now. Service companies take most (but not all) of the burden, but after a while employees get tired of the lesser compensation they agreed to when they see oil prices rise. Strikes follows.
US – update through March 2018 – Enno Peters
https://shaleprofile.com/index.php/2018/07/16/us-update-through-march-2018/
The EIA just announced that their International Energy Outlook 2018 will be out July 24th.
This event will be webcast.
The IEO2018 builds on the IEO2017 reference case, which presented long-term projections of world energy demand by region and primary energy source; electricity generation by energy source; and energy-related carbon dioxide emissions. In particular, this year’s outlook offers a macroeconomic perspective regarding the uncertainty in economic growth in India, China, and Africa.
2018-07-16 (CERI Study No. 173) Canadian Crude Oil and Natural Gas Production, Supply Costs, Economic Impacts and Emissions Outlook (2018-2038)
This study examines the next 20 years of Canada’s conventional crude oil and natural gas industries, including production forecasts and supply costs. This study covers onshore and offshore conventional oil, including shale and tight oil activity, conventional natural gas, coalbed methane, tight and shale gas, and the associated natural gas liquids (pentanes plus and condensate only), but does not include oil sands.
Executive Summary, conventional crude oil production levels are not expected to reach the highs seen in 2014 before the decline in oil price.
https://www.ceri.ca/studies/canadian-crude-oil-and-natural-gas-production-supply-costs-economic-impacts-and-emissions-outlook-2018-2038
2018-07-16 Petróleo Brasileiro S.A. – Petrobras – The average oil production in the country was 2.03 million barrels per day (bpd), 1.5% lower than the volume produced in May, mainly due to the maintenance stoppage of FPSO Cidade de Paraty located in Lula field at Santos Basin pre-salt and the sale of 25% stake of Roncador field to Equinor, concluded on June 14. We also highlight the start-up of FPSO Cidade de Campos dos Goytacazes located in Tartaruga Verde field at Campos Basin on June 22.
http://www.investidorpetrobras.com.br/en/press-releases/oil-and-natural-gas-production-june-2
Chart: https://pbs.twimg.com/media/DiStZJTX0AA_wzn.jpg
Average full year 2017 was 2,154 kb/day, so it’s down -124 kb/day
Petrobras presentation from May 16th. It shows lower year/year production for 2018. And an increase of 500 kb/day in 2019.
https://pbs.twimg.com/media/DiSwrUNXUAAujFJ.jpg
How can they add 550,000 bpd in a year? There’ll be 5 FPSOs ramping up but two will be pretty much finished this year and two won’t be finished until 2020, so thats maybe 550,000 to 650,000, but Petrobras only has 80% of that, and in the meantime they are probably going to drop 200 to 250,000 from decline and sales, so it looks more like 300,000 (maybe less if the older Santos FPSOs start hitting end of plateau). After that they’d need at least 2 FPSOs per year to stay level, but they bon’t have any due in 2020.
I didn’t notice that they have just reused the numbers from this prior presentation
https://pbs.twimg.com/media/DY0rpHyX0AEJtGu.jpg
The countries that have reported their June oil production numbers
up +469 kb/day from May
down -516 kb/day from the average full year 2017
Chart https://pbs.twimg.com/media/DiS0FO3W0AUoY9g.jpg
Neutral Zone – Khafji, Wafra field capacity 500,000 b/d
2018-07-17 (Platts) London — Saudi Arabia and Kuwait are making headway towards a political agreement on restarting two shuttered oil fields in the Partitioned Neutral Zone as soon as December, according to sources familiar with the deliberations.
The two fields at the center of the dispute are the offshore Khafji deposit and the onshore Wafra field. Crude output is shared equally between Saudi Arabia and Kuwait.
Another source familiar with the operations at Wafra said: “The facilities have been well-maintained. It won’t take long” to restart.
https://www.spglobal.com/platts/en/market-insights/latest-news/oil/071718-political-thaw-could-see-saudi-kuwaiti-neutral-zone-oil-fields-reopen-by-year-end-sources
comment from site:http://peakoil.com/consumption/the-future-of-oil-demand-peak-plateau-or-plummet
“MASTERMIND on Mon, 16th Jul 2018 4:16 pm
The idea that electric cars are lowering demand is ridiculous. Electric cars haven’t made a dent, just a small scratch in oil demand. Electric cars are only 0.2% of light-duty vehicles, and cost so much only the upper 5% can afford them, even with subsidies.
I suspect the peak oil demand idea is one more attempt by the wealthy and powerful to hide peak oil, because peak oil studies have shown that if peak oil were acknowledged, stock markets all over the world would crash since the economy would be shrinking from then on and debts couldn’t be repaid. Credit would freeze and dry up. Panic and social disorder would follow.
https://un-denial.com/2018/07/04/by-alice-friedemann-on-fake-peak-oil-demand/”
I agree with it.
Yeah, the general public has record debt, income growing at less than real inflation and barely a pot to piss in but they are going to buy 30,000 dollar cars in droves….sarc… I’d be impressed if the electric car fleet makes up 5% of the total by 2025…I’m more interested in a really efficient hybrid such as the Hyundai Ioniq. Until you can get 250 miles out of a charge for an electric.
You are in luck, the extended range Tesla Model 3 has a 310 mile range.
You are in luck… if you reserved one a year ago… and if you don’t get one of the “tent cars” made in shoddier conditions than your average skateboard. the tesla thing was good while it lasted – but its over. only /sarc tesla references are allowed going forward. certainly not on a petroleum thread relating to peak demand.
The wealthy and powerful are not hiding peak oil. Peak oil is so far off the general public’s and upper 1%’s radar screen that they have no need to hide it.
Most references I see to peak demand is from people who are trying to ‘wish’ away fossil fuel consumption because of environmental concerns.
Wishing won’t make demand fall.
Demand will fall if either the prices are too high, prices of alternatives sources of energy are lower than, or the global credit [debt] bubble goes pop.
Note to Adam- hybrids and plug-in hybrids are, in part, electric cars. Most cars coming on the market over the next ten years will be both electric and internal combustion under the hood. Pure electric will be common in the decade after, in my estimation.
Yeah that’s true, hopefully over time it will take the sting off oil demand but there are ever more people on the planet who will soon be driving.. Hard to predict the future but the 2020’s should be interesting to say the least. I live in Oklahoma where we are installing a good amount of wind power but there is also untapped potential for solar in the panhandle and western 1/3 of the state. Too bad Harold Hamm owns this state….
Oklahoma has a good blessing of wind and sun. There will be a lot of photovoltaic there in the future. Bolt them down well.
I have a new vehicle that has a 3.6-liter Pentastar V-6 engine, plus 16.0-kWh lithium-ion battery pack plug-in system. Seamless integration, and made in Detroit. Rated 28mpg if only using the gas engine, 84mpge if only using the electricity. I charge it up by solar and get about 32 miles purely on that electric, or 400 miles total range. If you calculate payoff of my solar in just ten years, I am paying the equivalent of less than $1.50 gallon, and much cheaper if you use a 20 solar assumption. Thats a screaming deal, and I really like the vehicle that cost me about 35K. You can put a sheet of plywood in it flat as well.
Many more choices coming along soon.
btw- I’ve only been to the gas station once in two months, when I went up to the mountains. I don’t miss it.
Hickory, pure electric could develop faster. It’s just such a simple technology. That’s why car producers leave the only big problem, the battery, to external companies and focus on their models. The new generation of electric cars already has an average reach of 200-300 miles and prices are coming down. That’s why many companies won’t invest in hybrid technologies anymore.
That to me is the point where electric vehicles can make huge strides, you start telling people they can drive from one big city to another if needed the running out of juice fears subside. That 250 mile per charge number is huge, if that is what say 2020 models will get I’d be willing to buy.
2018-07-11 (Platts) Russia’s spare capacity has grown because oil producers continued to prepare major greenfield projects for full-scale development in anticipation of production caps being lifted at some point this year, analysts said. The country can produce more crude if required, Russian energy minister Alexander Novak said last month.
https://www.spglobal.com/platts/en/market-insights/latest-news/oil/071118-russia-seen-adding-600000-bd-of-oil-output-by-late-2019-analysts
2018-07-17 (Bloomberg) Russia crude oil output up by +273 kb/d by mid-July vs 2016 quota: Now at 11.22m b/d: IFX
Chart, 1st 2 weeks of July: https://pbs.twimg.com/media/DiTiudLX0AEhozk.jpg
Doesn’t look like any of the Permian pipeline companies will get a tariff exemption:
https://oilprice.com/Latest-Energy-News/World-News/Permian-Pipeline-Project-Denied-Tariff-Exemption.html
Delays in completion? Or, just a lot more expensive? If more expensive, then how will they pass this cost on to the E&Ps? They are not going to absorb it.
An update on outages, Nigeria is back from it’s outages but there is still trouble elsewhere…
2018-07-17 Libya’s NOC Declares Force Majeure On Zawiya Oil Port
NOC statement https://pbs.twimg.com/media/DiU0ln_WAAAWUaW.jpg
2018-07-17 (Reuters) Two (of 4) PDVSA’s oil upgraders to be halted in coming weeks: sources
https://www.reuters.com/article/us-venezuela-oil-upgraders/two-pdvsas-oil-upgraders-to-be-halted-in-coming-weeks-sources-idUSKBN1K720G
The Libya issue seems to involve a new party and a new tactic, which can’t bode well for the future.
I know this a true hypothetical, but if Venezuela were a stable country how much of their heavy oil deposits could they churn out per day if they built up the infrastructure for it… 4 million bpd? or more….
About 2.5 million barrels per day would be my guess.
The EIA updated their oil & gas information for Venezuela, if that’s of any use to anyone
Last Updated: June 21, 2018
https://www.eia.gov/beta/international/analysis.php?iso=VEN
and Ghana
https://www.eia.gov/beta/international/analysis.php?iso=GHA
Well damn that’s not that much…I guess getting oil sands to market is way more challenging than fracking rocks, I’m guessing that puts a certain cap on what Canada can produce also, 5.5 mbd or so
Will China take over Venezuelan oil production?
China now taking 28% of Venezuela oil production to repay debt
However, China’s investment money could be enough to stabilize the newer joint venture oil fields at 1 million barrels per day. China would have to take control of the fields in order to ensure their production.