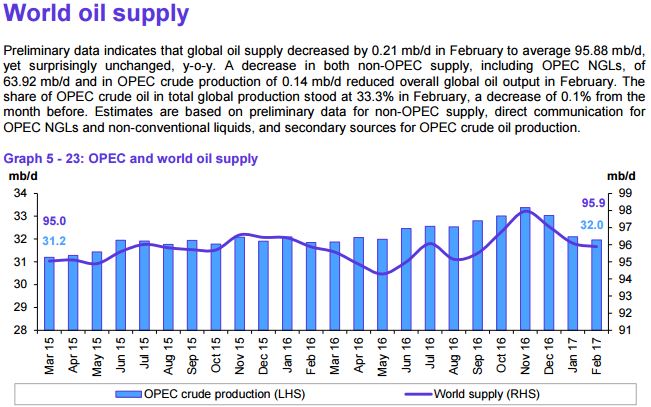
The new January OPEC Monthly Oil Market Report is out with crude only production numbers for February 2017. All charts are in thousand barrels per day.
All data below is in thousand barrels per day and is through February 2017.
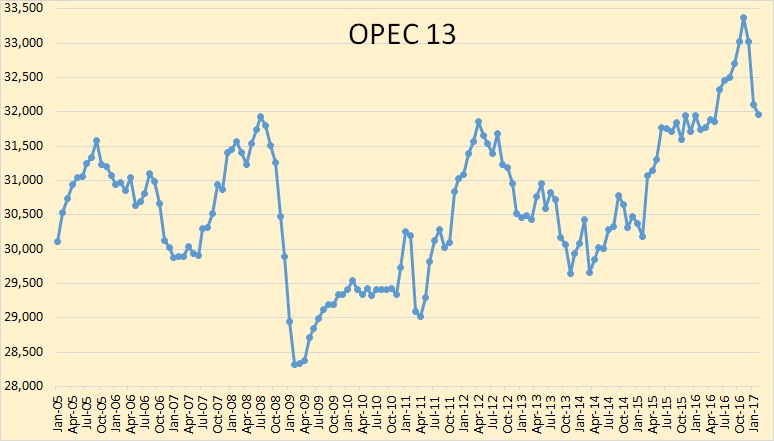
OPEC crude oil production dropped to 31,958,000 bpd in January. That was a drop of 140,000 bpd. In January OPEC production dropped 930,000 bpd for a two month total of 1,070,000 bpd.
Officially OPEC agreed to cut production by 1.2 million barrels per day beginning in January. So they are getting close.
OPEC’s November production of 33,374,000 represented an all time high for the Cartel.
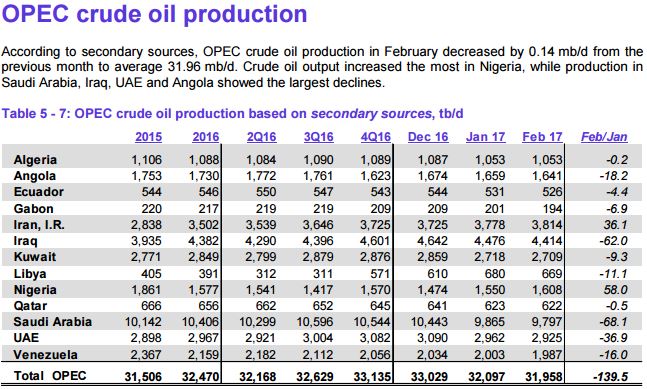
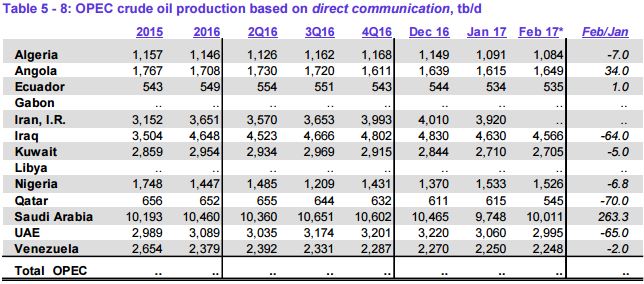
I have added OPEC direct communication to what OPEC’s secondary sources says, Notice the difference in what Saudi says they produced and what their secondary sources say Saudi produced. One source sited this as the reason oil prices dropped today.
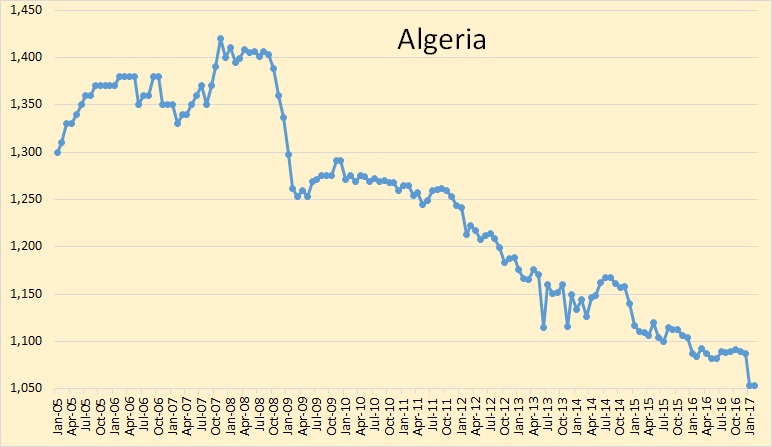
Algerian production held steady in February after a drop of 33,000 bpd in January.
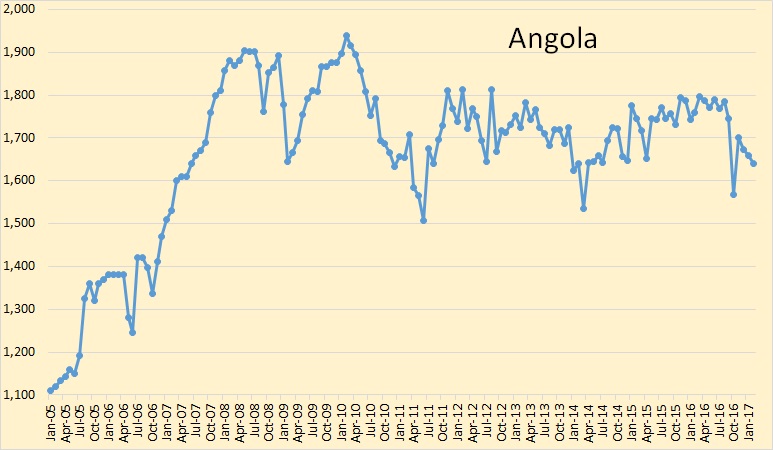
Angola’s production was down 18,200 bpd in February.
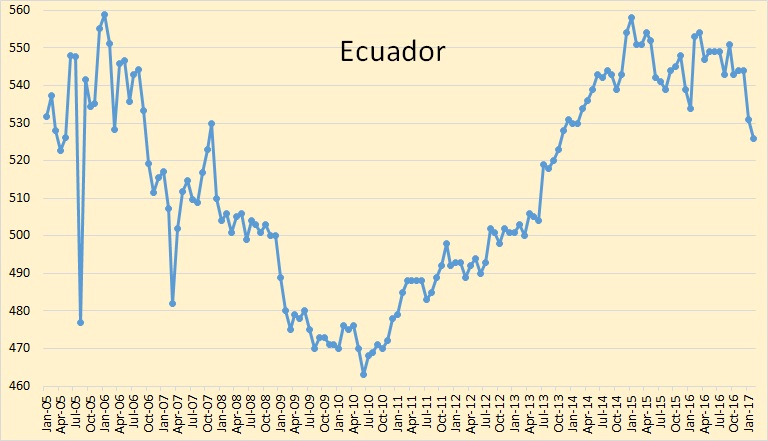
Ecuador’s production dropped 4,400 bpd in February after dropping 13,000 bpd in January.
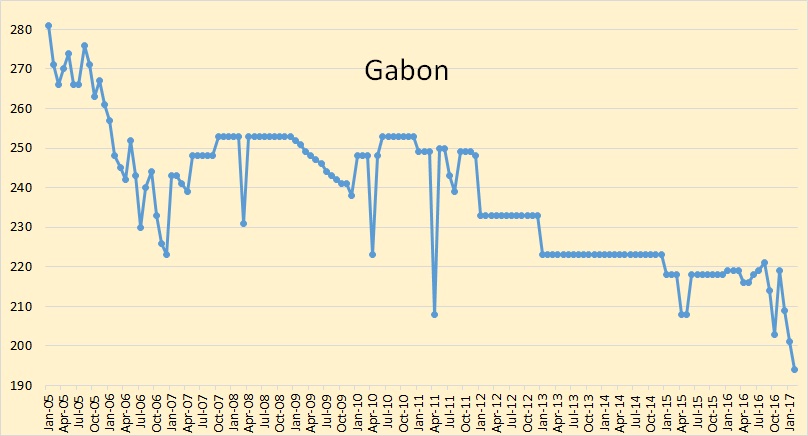
Gabon dropped 7,000 bpd in February and reached a new low of 194,000 bpd.
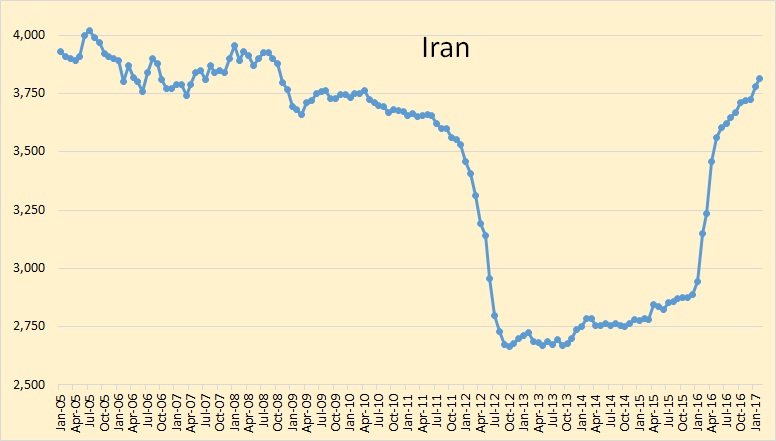
Iran continues to ignore any requests from OPEC to cut production. Iran’s production was up over 36,000 bpd in February to 3,814,000 bpd. The last time Iran produced this much oil was in October of 2008.
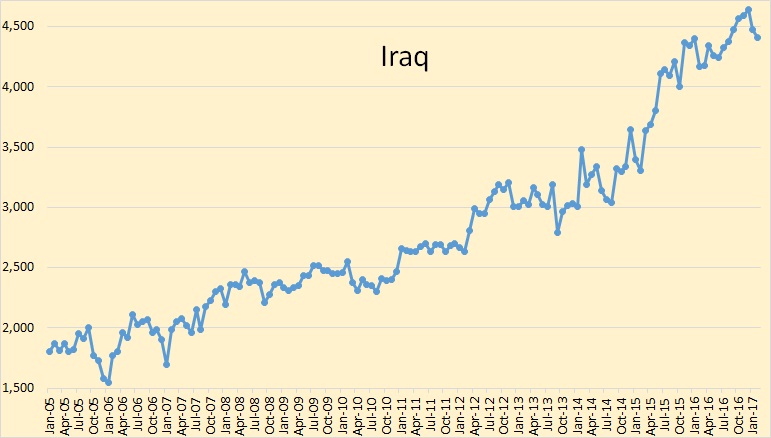
Iraqi production was down another 62,000 bpd in February to 4,414,000 bpd. They are still producing a lot more than Iraq.
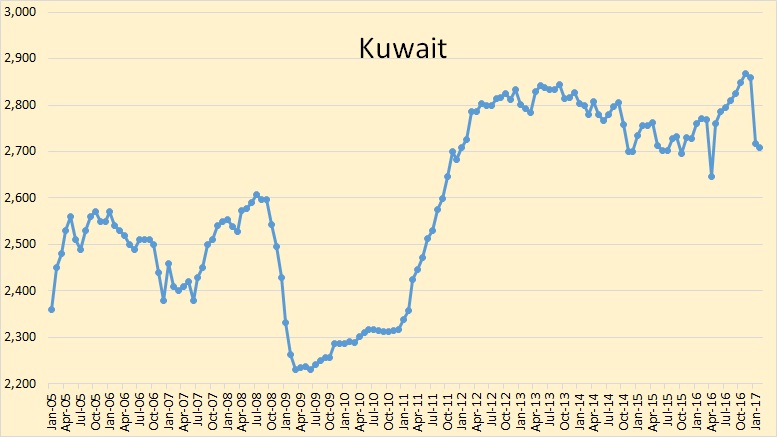
Kuwaiti crude production declined by only 9,000 bpd in February after being down141,200 bpd in January.
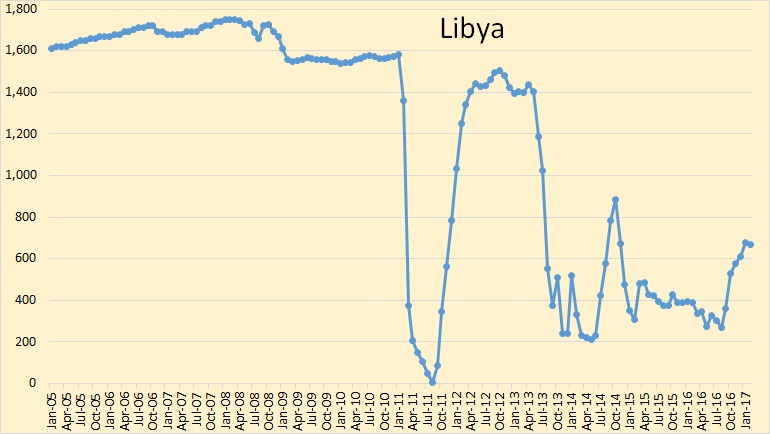
Libya’s production dropped by 11,000 bpd in February to 669,000 bpd.
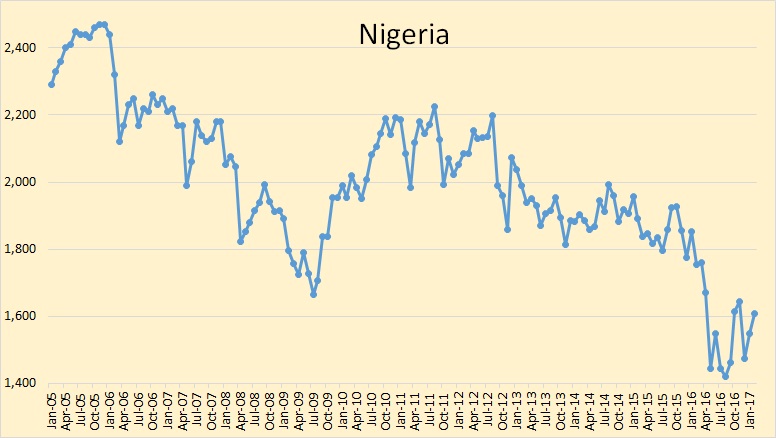
Nigeria’s production was up 58,000 bpd in February. Both Nigeria and Libya are exempt from OPEC cuts because of political problems.

Qatar’s crude oil production declined only slightly in February after declining 18,000 bpd in January.
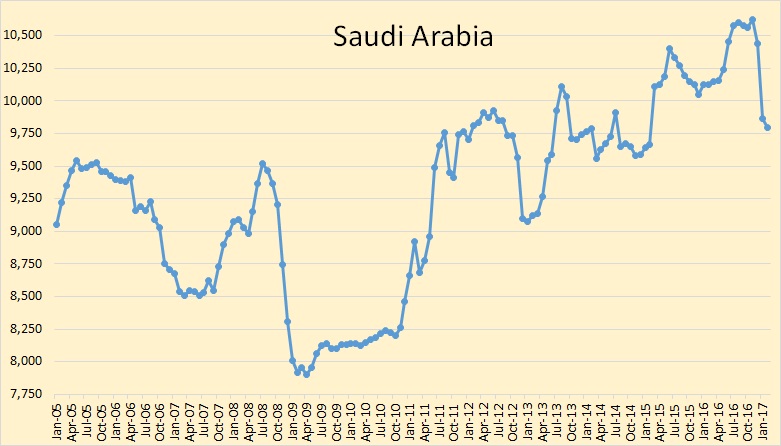
Saudi Arabia’s January production was revised downward by 81.000 bpd. As a result their production was down 578,000 bpd in January and another 68,000 bpd in February. They were also down 182,000 bpd in December. So they are down a total of 828,000 bpd since their high in November.
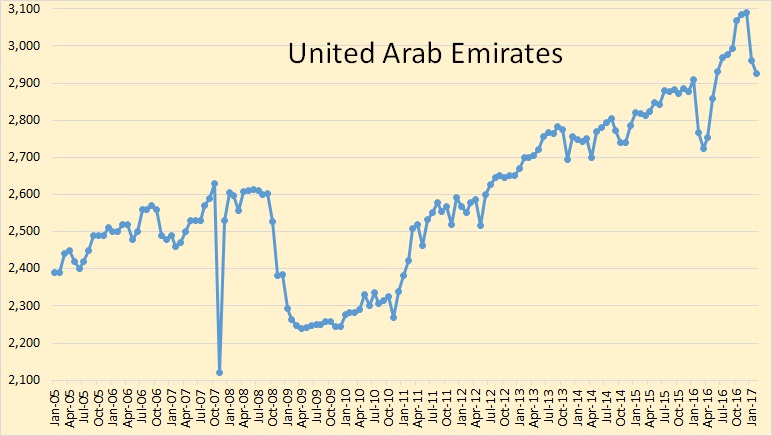
UAE production was down 37,000 bpd in February after being down 128,000 bpd in January.
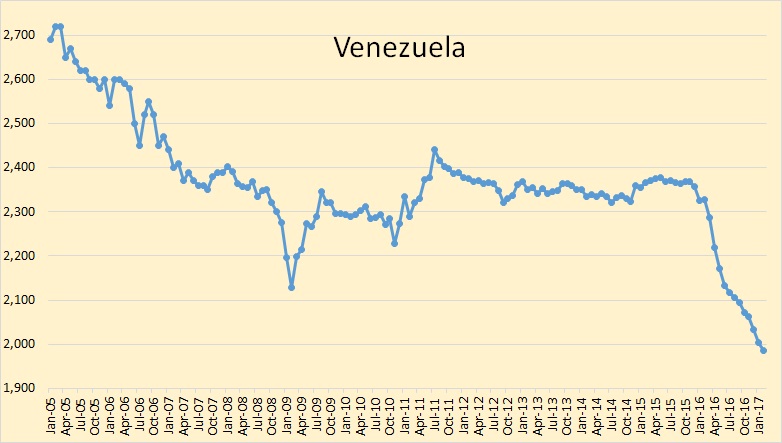
Venezuelan production continues to decline. They are now below 2 million bpd for the first time since the strike of December 2002/January and February of 2003. Production dropped to 620,000 bpd in January 2003 before Chavez fired all the strikers and hired all new workers.
148 responses to “OPEC February Production”
Thanks Ron!
Remember just days ago, that a Nigerian leader said Nigeria was producing 2.1 million b/d.
Even today, a report came out touting the Saudi’s increasing February production.
We depend on the facts from your site!!
To this, I readily concur. I really appreciate the contribution you and your site have made in the middle of a vast amount of disinformation from the press. I also appreciate all that I have learned from your contributors. Even when we disagree, I learn something. Thank you.
Hi Coolreit,
There are two tables in the OPEC report, one based on secondary sources (the one that Ron showed in his post) and a second table based on direct communication with the members. In the second chart Saudi crude output increased in February and the reports you read were based on that second chart.
I agree with Ron that the secondary sources are more reliable than the direct communication.
Bonga is offline for six weeks or so, therefore Nigeria is likely to drop up to 200 kbpd in March, and only get back half of that in April.
World Oil Supply includes imaginary numbers from EIA.
Yes, the EIA lies about US production.
Hi Coolreit,
I disagree. The data from some states is woefully incomplete for about 6 to 12 months and the EIA estimates output for those states, usually the estimates of C+C output that come out monthly are pretty good, the weekly numbers are not very good.
See
https://www.eia.gov/dnav/pet/pet_crd_crpdn_adc_mbblpd_m.htm
Chart with monthly C+C data in kb/d from Jan 2005-Dec 2016 below.
It is the weekly numbers that a really a farce. Monthly production figures are arguable, but only time proves them. My guess is on the monthlies EIA is high on Texas by about 50k a day, at least. GOM is a joke, it is no where near that. Off by, at least, 100k a day. Bakken looks right. Then we have 300k more reported on the weekly estimates, that defies the underlying completion rates. They don’t lie, they just don’t care.
There is almost a 50 million barrels a month increase in Texas production since about 2011.
It declines fast. I am having a hard time wrapping my mind around the premise that it will continue to rise, based upon current activity levels.
I mean really. Pull up the completions from horizontals this month from district 8. Peruse the completion rates. Some are worse than the verticals they replace, some are less than marginal, and some are good. But do you really see it going gangbusters? Then look at what is happening in the much acclaimed Alpine High, looks like a bust to me.
Hi GuyM,
I agree the weekly numbers are not good, but those are for all of the nation and not broken out by state, etc.
The monthly numbers are not perfect, just much better than any other data available, and the estimates are updated over time as more information is available. For the Permian estimate from the EIA, both New Mexico and Texas are included and Permian Texas is Districts 7C, 8, and 8A according to the RRC (though district 8 has the largest output of those three districts).
Have you checked out shaleprofile.com? The wells in the Permian are becoming more productive so that the same number of completions results in higher output than 12 months ago.
https://shaleprofile.com/index.php/2017/03/13/permian-update-through-november-2016/
It’s interesting to see here that many wells from the last couple of years have now reached cumulative production of 100 kbo, but newer wells have reached this level much faster. Their decline also appears to be slower than earlier wells.
The whole post is great, but see the second chart that highlights the improvement in well quality in the Texas Permian Basin. Thank you Enno!
It would be nice to know what caused this huge change – wells in Bakken or other shales didn’t improve by this margin.
Not Permian or any of the knowns, so it must be the prolific Ghost shale under Washington DC.
Hi Guy M
Enno Peters uses state level data from Texas and New Mexico for the Permian, nothing to do with DC.
The Horizontal drilling for LTO started later in the Permian than the Bakken or Eagle Ford, and it takes some time to determine the optimal well configuration and where the best spots to drill are.
Bakken new well EUR increased from 2007 to 2014, for the Eagle Ford it was 2011 to 2015, and for the Permian it was mostly 2013 through 2016.
Screen shot from Enno Peter’s website below for Permian Basin
The Spraberry and Wolfcamp are thicker and more complex. I think there’s more room to learn as things get more complicated. And nowadays companies have less wells to drill, their personnel is less rushed, more focused, and so they high grade prospects much better.
Excellent point.
The numbers don’t add up. This is what Art Berman and me found:
8/10/2016
U.S. Storage Filling Up with Unaccounted-For Oil
http://crudeoilpeak.info/u-s-storage-filling-up-with-unaccounted-for-oil
Yeah, I think I will go with you guys, and the State of Texas over the estimates. Texas used to estimate what the total would come to when all is said and done. EIA ignored those figures, so they finally gave up. I question EIA over their estimates, at one point, and received a very derogatory explanation of how the State of Texas was messed up. Maybe, Perry from Texas, will mend the fences, and get them to cooperate a little better on what the estimates should be. At this point, EIA’s weekly figures look about 500k over for the US, than what they should be. Just my opinion.
Hi GuyM,
I have no idea if the weekly figures are correct, I ignore them because in the past they have been so bad. I only follow the monthly output data which is much better for the most recent 12 months than the output data from some of the state agencies.
Could the government be adding oil from the strategic oil reserves?
Thanks for this Ron. Quick and easy to see that OPEC are largely compliant. Russia and FSU made no discernible cut in January and looking at the oil price it does not look like they did much in February either. Do you think OPEC will a) abandon cuts in July, b) extend the cuts for another 6 months or c) deepen cuts in the second half. For me these are equal possibilities.
Hi Euan,
I think c is less likely, maybe a 10% probability, but agree a and b are equally probable. It will depend on oil prices and stock levels which are difficult to predict.
Kuwait, Angola and Iraq have said they’d all like the cuts extended. Iraq and Angola are the two countries with new production coming on line, so maybe they mean they’d like the other countries to extend while they ramp up.
I would put b) at 70+% probability, with the caveat that most countries are about 80% compliant and that is the highest level of compliance we will see. Having any deal – even one with very low levels of compliance – is preferable to no deal at all. An extension may also see Nigeria given an individual target.
Abandoning crashes the price – this would happen only if prices have soared away (they haven’t), or KSA feels it can’t trust its “partners” to even nominally cut (but most players have at least gestured towards cutting).
Deepening is pointless when there are only 4-5 nations close to fully compliant across OPEC/non-OPEC (KSA, Kuwait, Angola, Mexico, Oman).
I don’t see OPEC going through this useless effort, again.
It brought them tons of money.
Propping up the price by more than 10% for delivering 5% less is a good bargain – especially if you are near or below your costs.
If you have costs of 40$, an up from 45 to 55 gives you +200% earning, -5%.
Long running projects are all cut back, so only infill drilling and fracking crazyness is left. It should stabilize now if nobody runs completely nuts now. The frackers could, sinking a few 100 billions of other peoples money to make everyone losing.
Agree it was cost beneficial. Just not their cup of tea. Yeah, maybe they can get to world to invest in the Permian, so everyone can lose as much as they do.
OPEC is complying, but that just brings it back down where production was before everybody capable of it jacked up production in anticipation of quota cuts. Right?
It is obvious from the graph. It is the same tactics as when they introduced quotas based on reserves which were artificially increased.
http://crudeoilpeak.info/opec-paper-barrels
The report on Saudi production increase is in the direct communication table. It is the first time I have seen such a large discrepancy between the two tables. It makes it difficult to decide who is telling the truth, OPEC or SA. Is SA trying to send a message to Russia, Iran, Iraq or US LTO producers?
The narrative deserves suspicion.
How impartial (re: oil price rise) are secondary sources?
Hi Watcher,
The secondary sources are in the business of collecting data and selling it.
If their data was not good, nobody would buy it. It is as accurate as they can make it, it is impartial.
Azerbaijan ministry are playing up how they have met their obligations to the cuts. In fact they said they would comply through natural declines. It looks like they are declining faster than expected and are down to 780 kbpd – 7.5% decline year on year. OPEC predicts they will average this for the year, so their exit production might be slightly lower and still declining. I think there is a good chance they will decline faster than that. Their previous decline was stopped when they bought on West Chirag in 2013, all their previous oil platforms had fairly short plateaus, and the new one will probably be the same so is likely now to be in decline. They don’t have any more oil prospects, though quite a bit of gas, so maybe some condensate, but generally they are probably going to be in decline going forward. Oil is a very large part of their economy.
Many years ago I coauthored a study which suggested Azerbaijan should cap Azeri-Chirag-Gunashli production at 630,000 BOPD. They would have done better designing a smaller pipeline and stretching out the plateau.
EIA’s Drilling Productivity Report with projections to April is out.
The EIA sees the January rebound in the Bakken oil production as temporary. Slow decline is expected to continue in February-April.
Modest growth from March is projected for Eagle Ford.
Growth in the Permian is expected to accelerate.
Combined oil production in 7 shale plays (which includes some conventional production, primarily from the Permian) is expected to increase by 278 kb/d from December 2016 to April 2017.
Hi AlexS,
A problem with the DPR is they assume a two month lag between changes in rig counts and output. I think (based on data you have presented and my own analysis) that the lag is more like 4 or 5 months between changes in rig counts and changes in output. In short, there may be the uptick they assume, but it will be a few months later than they say.
Also I am not convinced their model is accurate as they seem to show and increase in LTO output in Jan, where the actual data shows a decrease in US LTO output. The Eagle Ford also shows decreases through Jan. In Feb there was a bump up in completions (from 130 to 200) so we may see some increase in Feb in the Eagle Ford.
Dennis,
Oil rig count was increasing since late April 2016 in the Permian and since June 2016 in the Eagle Ford and the Bakken.
Since then, it is up 134%, 142%, and 73%, respectively.
You are right that the DPR data may not be accurate, but sooner or later increasing rig count should have an effect on production numbers
BTW, the EIA/Drillinginfo statistics for January indeed show a decline of 7 kb/d in total US LTO output, but these are preliminary estimates. For example, they show a 13 kb/d decline for the Bakken, while the NDIC data indicates an actual increase of 38 kb/d
Oil rig count in 3 key US LTO plays
Hi Alex,
I agree on the Permian that there will be an increase, based on your chart the increase in rigs was pretty small in the Eagle Ford until Nov 2016, I would expect those to be reflected in March output, I doubt the Eagle Ford uptick in Jan shown by the EIA. The Jan estimate may not be very good, but keep in mind the EIA estimate includes both North Dakota and Montana Bakken so a decrease in Montana may have offset the increase in North Dakota in January.
What will happen to Venezuelan oil production if they default on bonds coming due?
https://www.bloomberg.com/news/articles/2017-03-14/nerves-of-steel-needed-in-2-billion-gamble-on-venezuelan-bonds
My impression is that sooner or later default is inevitable, and there are apparently credible reports that they paid off bonds recently by selling off some or maybe just about all the country’s limited gold holdings.
They won’t have that option more than maybe one more time, if at all.
Maybe they will be forced to let the Chinese send in men and equipment and produce the oil for them, in exchange for enough money for Maduro to continue his tin pot dictator ways.
They got cash from Rosneft mortgaging CITGO. This is being challenged in courts. One group says CITGO needs to stop taking on debt because it’s an asset they want to pay off Venezuela debt. Others claim Rosneft can’t take ownership of USA refineries due to sanctions.
Maduro is beyond tin pot. They are starting to massacre young men in poor neighborhoods, and there’s increasing hunger and disease. They are a mix of communists and narcos. The new Vice President, Tareck el Aisami, is on the OFAC list for drug trade and money laundering.
Here’s the latest overview on Venezuela by the OAS Secretary General
http://www.oas.org/documents/eng/press/Informe-VZ-II-English-Final-Signed.pdf
It’s a 70 page document which lists page after page of abuses.
Things are so bad we are seeing a flood of Venezuelans trying to leave and go somewhere else. The government makes this increasingly difficult by holding up passport issues. However, it’s possible to bribe an official and get one for $500 to $1000 US dollars. Additional bribes have to be paid for birth, marriage and other certificates.
Over the last few months several countries are denying entry to Venezuelans because they are likely to seek refuge. This included the USA under Obama, which set up a system to deny entry or jail Venezuelans with tourist and business visas (this of course you won’t see on CNN).
I’m helping a Venezuelan friend get out, and it has been an ordeal, having to pay bribes and do all sorts of zigs and zags to get the papers she needs to get to chile (which is still accepting Venezuelans as refugees). Unfortunately the EU is getting very strict, and they force Venezuelans back to Venezuela even if they have a tourist visa. Looks like they’ll gave to convert to Islam to get entry?
I was wondering about your friend. I hope she gets out.
We will find out in April after she gets her paperwork done. She’s trying to sell her house and then she’ll need to deal black market to get the money out, and that’s one hell of a risk.
If I were running a large integrated oil company, and I wanted to acquire some shale assets at a reasonable price, I sure would want WTI to stay below $55 bbl. So maybe, I could have my company increase our oil into US storage by say 50 million bbl. We could then hedge that and at the most be out of pocket $2 bbl [no such thing as a perfect hedge, plus cost of money] or $100 million cost. But, in that period of time, if we purchased say, $6 billion of shale assets, I bet that our savings on the purchase price would be greater than $100 million.
If I were running a large integrated oil company, I would import up inventories to keep prices down. Especially, if I learned the nit wit journalist always assumed that was due to local production. Get it now, before prices go up. Simply good business.
Ah, predatory pricing.
IEA just released their monthly oil market report and the oil price inches upwards (also the API guesstimate on crude draw). Strange as it didn’t say anything new: i) it takes time for the cuts to translate into stock withdrawals (delay from production in Middle east until it shows up in the OECD stock), ii) the global oil market is in a deficit and if current projections of production and consumption is maintained to June stocks will be down by 0.5 mbd for 1H17, i.e. approx. 90mb or 1/3rd of OECD overhang.
https://www.iea.org/newsroom/news/2017/march/omr-taking-stock.html
Reuters, March 14, 2017: Investments by Norway’s oil industry will decline more than expected in 2017 and economic growth is now seen fractionally lower than forecast, the country’s finance ministry said March 14 at the start of a three-day government budget meeting. Oil and gas firms are now expected to cut investments by 11.6% year-on-year, against an October forecast of a 10% decline.
http://www.epmag.com/norway-cuts-2017-oil-investment-forecast-1485766
Some of that might be just that costs have come down – e.g. every few months they announce that Johan Sverdrup costs have dropped again. But equally they don’t have many large projects left. Most of the recent discoveries will be developed as small subsea tie backs. There are a couple of other larger topsides due to be installed this year and next, but the big construction costs for those are probably winding down. Only Johan Castberg remains as a large hub type project, with possibly redevelopments of older fields if oil prices rose significantly (I think Oseberg and Froy have been considered, there may be others). If they don’t find something more in the Arctic their industry is likely to keep on fading away, 3 or 4 years behind the UKs.
George
Have you read the reports of the oil discovered in the Weald basin.
I’ve followed it a bit. They had some mad number of over 100 billion barrels, which turned out to be the total possible, unrisked OOIP in the whole Weald, but somehow became the recoverable oil for UKOG. The original chairman or CEO was David Lanigas, who has a history of ramping shares and then selling out, leaving the company to make a loss. It looks like he’s done the same here as he is not now on the board. The latest numbers I’ve seen have resources at 6 to 10 mmbbls, I don’t know what recovery factor they are using, but my guess is they won’t get anything like this much – Surrey (an area classed as having outstanding natural beauty) and around Gatwick Airport is not amenable to pump jacks being located every couple of hundred acres or fleets of heavy lorries driving along the country lanes, even assuming the extended well test, which has not yet been fully approved (earliest possible was late February but I’ve seen nothing) let alone executed, is successful. The planned testing is over almost 2 years with 10 lorries per day – it’s not going to go through without protests.
Angus took the search for natural fractures a stage further by using the Weatherford Ultra Wave Acoustic borehole imaging tool. This is its first use in Europe. Technical papers are to be presented on this at DEVEX �shortly. The tool made it possible to see fractures in the borehole directly, unlike the need to infer fractures from logs. The information confirmed not only evidence of natural fractures in the two main limestones intervals previously tested at Horse Hill, but also confirmed abundant natural fractures in sections of interbedded shales and limestones between and below the two main limestones. Around 200m of the reservoir has this potential.
http://www.lse.co.uk/regulatory-news-article.asp?ArticleCode=v0ev3f6c&ArticleHeadline=Brockham_Field_Update
I’ve always wanted to do a stealth development near Gatwick. First, I would build a fake castle with a 40 meter tall tower. It doesn’t have to be real stone or anything like that. I figure we could use a prefab steel frame with fiberglass covers made up to look like Scottish granite.
The drilling rig would fit inside the tower, and the crew would be dressed to look like Robin Hood’s friends. The engineers would wear fake armor with long swords, and all the geologists would be wearing long dresses and wigs to have that Lady Marian look.
The trucks would have to be disguised as Farmer’s Bounty butter delivery wagons, and the wells would be located in deep underground cellars, lifted with gas lift as needed to avoid pumping units.
Wouldn’t this be a neat project?
And you point is what?
This is from the the IEA’s free monthly spreadsheet updated yesterday.
OECD oil products, closing stock levels, in million metric tons
Total gasoline includes, jet gasoline and aviation gasoline
Middle distillates include gas/diesel oil, jet kerosene and other kerosene
Please note: Files as originally published. Revisions not included.
https://www.iea.org/statistics/monthlystatistics/monthlyoilstatistics/
This is also from the the IEA’s free monthly spreadsheet updated yesterday.
Closing stock levels for crude plus products (The IEA seem to include everything, including natural gas liquids). The USA compared to the total for all the other OECD countries.
It’d be interesting to see OECD less USA for total, crude, products and NGL rather than an average.
Yes sorry I didn’t explain the chart enough. The World Total on the chart is without the USA. It’s the Total minus USA.
Total = 554,761 million tons
Total World (without USA) = 321,035 million tons
USA = 233,726 million tons
The Average on the chart is just half the Total (Total World + USA)/2. I put the average on the chart to see the overall trend while still keeping the chart small.
Thanks for explaining the average.
Very nice chart!
OECD total petroleum inventory (crude+NGL plus products) is about where it was before the GFC. Note we would expect these levels to be higher because total petroleum consumption is higher than it was in 2008. It would be interesting to look at the ratio of total stocks to total products.
Thanks.
A problem with the World stock data is that we do not have a very good estimate of World stock levels, the best stock data is for the OECD, but that is only 47% of World oil consumption so we only have half the data for stocks.
With both of these charts – what is the “average” line?
Does anyone know if at this point global crude supplies are dropping as claimed by SA or still rising?
Have they declined since November? OPEC, EIA, IEA and Jodi seem to think so.
Is it still declining today? Not so clear.
Or was your question rhetorical?
Hi Sean,
A problem with much of the data is that crude plus condensate is lumped with “other” energy liquids such as NGL and biofuels. So if you are asking about output of crude plus condensate we only have decent World data through Nov 2016, for “all liquids” you can use the OPEC or IEA estimates.
IEA data at link below
https://www.iea.org/oilmarketreport/omrpublic/
In 4Q2016 World supply was 98.29 Mb/d and in Feb 2017 World supply was 96.52 Mb/d or 1.77 Mb/d lower than the 4th quarter of 2016. These numbers are for “all liquids”.
EIA data at link below
https://www.eia.gov/totalenergy/data/browser/index.php?tbl=T11.01B#/?f=M&start=200001
In Nov 2016 (most recent data point from the EIA) World C+C output was 81.81 Mb/d (this is the monthly peak in World C+C based on EIA data), in 2015 the average level of World C+C output was 80.55 Mb/d. The drop in OPEC crude output since Nov 2016 (about 1 Mb/d) probably has not been offset by increases in output elsewhere, so World C+C was probably lower in Feb 2017 by at least 0.8 Mb/d (if we assume the EIA STEO February US output estimate is correct). There may be further cuts by Russia, Mexico, and Norway and demand is expected to grow, so the excess inventory will decrease.
Thanks for the comprehensive reply Denis.
I have a new update on the Niobrara basin (CO & WY), available here.
Here are some OECD world inventory forecasts from the EIA’s STEO, Table 3. I was just looking at them.
The WTI price has no axis, it’s just there for reference, to see the trend.
Plus the green line is the IEA’s Oil Market Report world inventory. From their free highlights, OECD commercial inventories rose in January for the first time in six months by 48 mb, or 1.5 mb/d, to 3,030 mb
https://www.iea.org/oilmarketreport/omrpublic/
Taking stocks divided by output, we are close to 2012 levels of days of forward cover in Feb 2017. We would expect higher stocks with higher output.
JODI Data’s Oil closing stocks, 31 countries with reliable data, no gaps, since 2002. Mostly OECD countries. Updated to December 2016. The units on the RHS are million barrels. And I’m just wondering, what have I forgotten to explain? 🙂
If there is anyone interested in China’s oil stocks…
OPEC MOMR, Table 9.5: China’s commercial oil stocks, million barrels
I’m sure that you can buy this data weekly from Xinhua News. But it’s free in the OPEC MOMR with a 2 month delay.
Chart on Twitter: https://pbs.twimg.com/media/C64achcWcAE1zGI.jpg
A number of so called teapot refineries are building their own tank farms. I would guess that they’re not included. And estimates in the news suggest that China’s SPR is still being filled.
Are there any conclusions from this that might disagree with IEA findings – e.g. does Jodi OECD differ from IEA numbers? It looks like high supply from November and December is working into land storage, demand may be flattening (if so that might be the big emerging story), USA is drawing down product stocks, but I think they always do that this time of year anyway (a combination of refinery maintenance and coming change to gasoline standards for summer – I might be wrong). If the stock uptick goes on then a lot of government and company investment plans for this year are going to have to be revised as the price will continue to fall. IEA predict a shortfall in the second half, which presumably would lead to a price increase,\, but I don’t think their forecasts do very well when the demand curve doesn’t follow a previous trend.
My JODI total is higher than the IEA’s figures. Partly because I included Saudi Arabia, but also I was told that JODI contains some SPR type inventory that the IEA doesn’t. I’ve not had time to check this. I will have a look at Japan’s numbers on their website when I have time.
I included those countries because they had reliable data going back to 2002. It was only a few weeks ago that I realised that they are nearly all OECD countries, nearly the same as IEA.
Also, I’m working on a longer list but as you will have noticed yourself countries such as India only started reporting data in March 2011 and Brazil restarted in Jan 2013.
China production numbers are out. The new year there meant nothing for January so they only give total production for Jan and Feb. I’ve assumed equal daily production for both. They are down a bit from December, but a lot (13% y-o-y) from last February which looks like an anomaly. The statistics site gives average yearly decline at 8% which is consistent with most of the second half of last year.
Anybody know if the Chinese use only Sinopec and PetroChina or who external has the production deal?
Cuz if it’s all internal they should be immune to price. The renminbi is pegged by decree. It doesn’t move with any trading against the basket. It is set by decree.
Which makes them Argentina-ish. If all production is NOC or semi NOC, they got no reason to have production care about price. Tra la tra la
I haven’t a clue what you are talking about. Oil is still a global commodity. If it’s cheaper to import then that is what the refiners will do, and if there are producers with undeveloped expensive oil, then they won’t have a market. China’s five year plan to 2020 indicates 4,000 kbpd average by 2020 (up from February but about equal to 2016 average). Wood Mackenzie expects a drop to 3,500 kbpd. I think they will do well to get 3,000. There are no major new projects in development, no recent large oil discoveries and the whole country has been drilled, and I think not many in fill opportunities left on the old fields.
http://www.reuters.com/article/us-china-energy-idUSKBN15118K
Dood, so in your world Chinese refineries are not under government control?
Interesting perspective. Maybe their armed forces check global prices before buying classified avionics, too.
Geology wins. Until it wins, they decree the yuan peg and because they do, they pay PetroChina or Sinopec to produce oil in their fields whatever they want to pay them. They probably burn it all internally, too. Why would they care what the external price of oil is if they burn everything they produce internally?
The only way this is not relevant is if they have BP working in their fields. Seems unlikely.
“so in your world Chinese refineries are not under government control?”
Sinopec and Petrochina (which own most of China’s refining capacity) are majority owned by the government, but publicly traded.
Other refineries are private.
“They pay PetroChina or Sinopec to produce oil in their fields whatever they want to pay them.”
Not so simple. Domestic prices are not totally free, but are closely linked to world market prices, making Petrochina and Sinopec vulnerable to fluctuations in oil prices. In 2015-16, both companies have shut down marginal wells to limit losses from low oil prices. At the same time, China increased imports of cheap oil to fill its strategic and commercial reserves.
Back to the question. Does anyone external have those contracts? One would presume no, since China wants their oil situation to be secret. There was an orbital recon bunch of ppl who reported Chinese above ground storage was not what China said.
And wait a minute. Domestic prices are subsidized. Minimum 25%.
BTW do you have some secret data on the state of their domestic oil wells, to know marginals were shut down? That would be cool.
“Does anyone external have those contracts?”
Which contracts?
“BTW do you have some secret data on the state of their domestic oil wells, to know marginals were shut down?”
I do not have any secret data. Petrochina and Sinopec announced that they are shutting marginal wells. You may trust them or not.
BTW, do you have any secret data on state of wells in other countries? Can you 100% trust what U.S. oil companies are reporting about their wells?
“And wait a minute. Domestic prices are subsidized. Minimum 25%.”
You would be surprised, but fuel prices are subsidized in the U.S. too. Per capita subsidies are higher in the U.S. than in China.
“As an outcome of the G20 meeting held in China earlier this month, both China and the United States volunteered to publish peer reviews of their current fossil fuel subsidies, and the results show that, together, the two countries are annually providing over $20 billion in inefficient fossil fuel subsidies.
The two reports are intense and intricate, as well as quite lengthy. For anyone wanting to investigate the intricacies of both countries’ fossil fuel subsidies programs, the links are as follows:
A report on the G20 peer review of inefficient fossil-fuel subsidies [China] (PDF)
A report on the G20 peer review of inefficient fossil-fuel subsidies [United States] (PDF)
The reports each identified inefficient fossil fuel subsidies currently in play. The United States report identified 16 separate fossil fuel subsidies, all falling within upstream exploration, development, and fossil fuel extraction activities, whereas the Chinese report identified 9 separate subsidies across multiple fields, including upstream fossil-fuel activities and those benefiting professional fuel users — such as fishermen, foresters, taxi drivers, and public transport companies.
The cumulative value of the fossil fuel subsidies identified by the reports amount to over $20 billion — $8.1 billion in the United States, and $14.5 billion in China.
Despite the self-identification process, however, there is no indication of plans to remove the 16 inefficient US fossil fuel subsidies, most of which would require legislation in Congress to remove them, something that is not likely given the current political environment in the United States.”
https://cleantechnica.com/2016/09/20/us-china-fossil-fuel-subsidies-exceed-20-billion-annually/
http://www.oecd.org/greengrowth/oecd-welcomes-ground-breaking-peer-reviews-by-china-and-us-of-their-fossil-fuel-subsidies.htm
Hard to scroll sometimes o a tablet. The point of the subsidy note (25%) was to indicate how their production doesn’t have to be price dependent. Re Argentina. Re US shale.
Not clear who defined ” inefficient”.
Subsidies protect a nation’s consumers so they can consume. I guess inefficient would mean the subsidy didn’t do a good job of increasing consumption.
http://www.ogj.com/articles/print/volume-114/issue-9/drilling-and-processing/us-duc-inventory-likely-to-shrink-over-next-8-12-months.html
Don’t know if it will take 8000 wells to stabilize production. However, if he is only close, we are not going to see much of an increase at this activity level. In the past there has been over a six month lag in the Permian from permit to completion.
Also, no one talks about the rest of the districts that make up over one tenth of Texas production. It has fallen over a million barrels a month, since 2015. Just not buying the projected increase, and EIA needs to take their meds.
I decided to write my own bs about what’s going on, because I have a friend who’s a high level pundit I didn’t agree with
http://21stcenturysocialcritic.blogspot.com.es/2017/03/usa-shale-drillers-versus-opec.html
Reuters Fri Mar 17, 2017 – Halfway into 2017’s oil supply cut, Asia remains awash with fuel.
Thomson Reuters Oil Research and Forecasts data shows around 714 million barrels of oil are being shipped to Asia this month, up 3 percent since December when the cuts were announced.
A record 10.5 million barrels of Russian Urals will arrive in Asia between April and June, Eikon data shows.
Oil from Kazakhstan, the North Sea, Brazil, and the United States arriving in Asia in March is expected to reach 45 million barrels, double the volume in the same month a year ago.
Enduring excess supply could be eased by a robust demand growth?
http://uk.reuters.com/article/uk-asia-oil-analysis-idUKKBN16O07S
chart on twitter https://pbs.twimg.com/media/C7Fr1pRU0AEUaPS.jpg
This seems to be the thinking on twitter at the moment, that production cuts are useless unless they include export limits? Also, possibly importers were buying more oil because they thought that due to the OPEC agreement the price of oil would continue to rise?
As I mentioned last week, it has been interesting to watch as the price fell the rush to microphones to declare that there is actually more supply than demand, when people were standing in front of microphones the week before showing storage graphs and declaring the reverse. There is a lockstep mindset and it’s a tad funny. Wow, those storage amounts changed in one week!
I’ve been wondering about oil prices and supply as a factor with proposed increased military spending.
The military has been pushing for more green technology for strategic reasons. Fuel conveys on the ground are dangerous. Refueling in the air is expensive.
Ships can be nuclear powered, but land vehicles would benefit from needing less petroleum. And renewable energy makes it cheaper to provide electricity on bases.
The Trump administration wants to cut funding at the EPA and the Energy Department, but the Defense Department still needs research, and it also needs to prepare for declining oil reserves. When you start buying big expensive ships and expensive planes, you need something that won’t become obsolete quickly.
U.S. military marches forward on green energy, despite Trump | Reuters: “The military’s zeal for renewable power has already had broad impacts on energy contractors, generating hundreds of millions in contracts for solar companies and helping to reduce fuel consumption by the world’s largest single petroleum buyer.
The armed forces nearly doubled renewable power generation between 2011 and 2015, to 10,534 billion British thermal units, or enough to power about 286,000 average U.S. homes, according to a Department of Defense report.”
PEARL microgrid project demonstrates new possibilities in military energy resiliency > Wright-Patterson Air Force Base > Article Display: “PEARL will allow researchers to evaluate renewable energy generation, storage, and control technologies by demonstrating new variances of hydrogen fuel cell, gasification/waste-to-energy, and wind turbine technologies, in addition to new battery and photovoltaic (solar) systems. Mission assurance and cybersecurity are also critical facets of the project.”
Factoids:
2009 US DoD Fuel consumption 397K bpd. (My previously acquired rule of thumb on that parameter has been 380K, so uptick, and probably from even the most intense Iraq years). That parameter is dependent mostly on operational tempo. It’s mostly jet fuel.
Lotsa tweaks take place from JP-8 and JP-5. Even commercial grade jet fuel is bought and upgraded to milspec, but regardless of detail, the big number 2009 was 397K bpd. This is only about 2% US consumption, but far and away the largest govt consumption, as one would expect.
Operational tempo has changed since then. Comparisons dicey because of that.
Tiny fraction of national consumption so ignorable. Even more tiny a fraction of global consumption.
I wasn’t bringing it up because of quantity of petroleum use. I was suggesting that whether or not Trump wants to defund renewable energy research, the military is still interested and will likely devote some of that increased military budget to it.
https://www.propublica.org/article/preet-bharara-fired-investigating-tom-price-hhs-stock-trading
I guess that this was just another posting accident.
I’ve been comparing the IEAs and JODIs figures for crude oil closing stocks, OECD countries. I guess that most of the difference between them could be explained by the IEAs inclusion of NGL and refinery feedstocks.
Table: https://s9.postimg.org/o27qf4bpb/2017_03_18_IEA_vs_JODI_Crude_Oil_Stocks_kmt.png
The recent convergence of IEA and JODI for the Americas might be due to the large drop in USA NGL stocks
EIA weekly inventory figures: https://pbs.twimg.com/media/C6OWSxLXMAAfmQu.jpg
I left out, Estonia Iceland Luxembourg Slovenia
third word in this post is an oversight, Ron…i hate it when i do that, too…just fix it and delete this comment
Freddy
If you get to read this, I just ran the production numbers on near two dozen of your wells with decreasing GOR.
I ran consecutive checks on the top ten, then jumped in 30/50/100 well increments down to #700 on the list.
I jotted down the three most recent months’ production for both gas and oil to see what patterns may appear.
Observations
… no way was this a systemic, detailed evaluation.
No numbers jumped out with the exception of VERY !ow gas production figures that seemed to lessen – ratio wise to oil – the farther down the list I went. (IOW, low gas numbers may be the root explanation).
The oil output, for the most part, showed fairly consistent production.
The number of producing days varied widely with several 5 to 15 days online months over most of the wells’ three month profile.
Bottom line, there may need to be a more detailed analysis to understand why many of these wells’ gas production profiles abruptly plummet to 1/5, 1/20 their historic norm.
Hi coffeeguyzz,
Thanks for looking into it. Did you see the other sheet I shared? It shows the GOR change from January 2016 to July 2016. Comparing the two sheets we can see that there are a lot more wells with decreasing GOR the last 6 months compared the previous period. So why are there more wells with decreasing GOR and do they have anything in common? I only looked at a few of the wells as it is very time-consuming to analyse the historic data for every one of them. What I could see was that there were both examples of wells that seem to have been choked (dramatic drop in oil production and decreasing GOR) and wells were gas seem to be running out (flat to slowly decreasing oil production and decreasing GOR). However I could not find anything in common for the wells with decreasing GOR. I seem to happen all over Bakken and for most companies. Continental seem more affected, but EOG in Parshal does not seem to be affected at all. I would have expected this to happen to Parshal first as it is an area with lower pressure and less gas. But apparently not. So I don’t feel motivated to look into it more as I cannot find any logical explanation.
I also want to mention that I looked into flared gas percentage for all wells from 2007 and later (without confidential data). For some reason my numbers are around three percentage above Helms numbers at typically around 14% in 2016 compared with 11% for Helm. Helms 9/2011 number is 36% compared to 39% in my data, so at least they appear to consistent. Anyway, in my data flared gas increased to 17,3% in December and 16,5% in January. According to Helm it increased to 13% in December and then dropped back to 11% in January. So still higher than before in my data. What this tells us is that sold gas has decreased more the last two months than the flared gas. This could perhaps be because of technical problems or because gas production is declining faster for wells that capture the gas. Either way, it seems to be mostly Mountrail, McKenzie and Williams that are affected by this.
Some speculations. A very cheap way to follow lower flared gas targets would be to just pump harder for wells that capture gas. You will both get higher production and at the same time GOR will increase causing even higher gas production. However this will make it run out of gas faster. If sold gas is decreasing then they may have to choke the wells that are not capturing gas in order for flared gas not to go over the target. So maybe that is what has happened. I have not looked into this though, just speculating.
Item. Some time in the past data appeared that said “choke management is done to increase EUR of a well and indications are the maximum effect possible increases EUR about 15%”.
How does a remote well with no infrastructure (pipelines) and dependent on trucks for oil pickup and production water pickup get gas to market? What happens if gas is vented without flaring (does it flare spontaneously?) ? A decreasing gas to oil ratio would be a parameter one would like to report to investors/lenders.
Art Berman says: “Changing GOR is important because it suggests decreasing reservoir energy. The Bakken has a solution gas drive mechanism. Initially, oil is produced by liquid expansion across the pressure drop from the reservoir to the well bore. Later, gas dissolved in the oil expands and this is the mechanism that lifts oil to the surface.
Rapidly increasing GOR in the Bakken probably indicates partial reservoir depletion and subsequently decreasing GOR suggests more advanced depletion accompanied by declining reservoir pressure, declining oil production and increasing water cut “
World demand forecasts from the IEA’s Oil Market Report
The first quarter of every year is marked with a bubble in the line and a data label, this is where the forecast starts. The biggest gap is 2Q 2015, from the yellow line to the blue one is an increase of +2 million barrels/day. It seems to have taken them a while to adjust their models to fully account for the increase in demand due to the drop in the oil price?
Official free excel file for the last few years: https://www.iea.org/media/omrreports/Table1.xls
Seems to indicate that oil is almost inelastic – a 50% plus drop in price produced, at most, a 1 or 2% increase in demand, although other factors may have contributed as much as the price did, such as more stability in the Middle East promoting internal consumption or car ownership growth in Asia.
That would suggest moonshot prices when we hit shortages again.
I didn´t save the ref/link but I recently read an analysis of how US consumers responded to the oil price increase in mid-2000. In the short term the price is almost inelastic, i.e. end consumers continue to use the same volume of petrol and cut down on their discretionary spending (or take on higher debt). However, there was some threshold (in time and money) after which the consumption declined a lot. In real life, this means that consumers had to park their car, car share, use public transport etc. Some of the response may also be a result of the financial crises and folks losing their jobs.
The oil price elasticity is asymmetric. Reducing the oil price has less impact on consumption than increasing it.
My feeling is that if a sufficient share of the society has a job than the oil price can reach the moon but it is unlikely to stay therefore any length of time. A high price kill demand.
You seem to be forgetting that the price for gasoline/diesel that car users and the transportation sector in general are paying for carries a massive tax quotient. So, a fall of around 50% in the WTI/Brent benchmarks won’t go anywhere near reducing the price of gasoline/diesel/kerosene for car drivers, airlines in any remotely comparable amount.
http://visual.ons.gov.uk/fuel-prices-explained-a-breakdown-of-the-cost-of-petrol-and-diesel/
If fuel was not so insanely taxed, consumption of oil around the globe would be astonishingly higher, causing the trade deficits of hydrocarbon poor countries to swell to catastrophic levels. Hence the strategic necessity of taxing gas/diesel/kerosene to the high heavens.
The taxes are in the US are primarily to provide funding for road infrastructure. Taxes vary across states from about 30 cents/ gallon to 1 dollar per gallon. So here it is more commodity cost than tax cost.
Yes, US consumers and European consumers differ. I wrote US consumers but perhaps I should have been more clear on that.
One of the speakers at CERAWeek was saying something similar. He said that the rise in living standards and energy demand is fairly predictable unless there is a recession. That’s what gave me the idea to have a look at the IEA figures.
https://s1.postimg.org/umps5x5j3/2017_03_19_IEA_World_Demand_January_Forecasts.png
I think oil price drops don’t encourage lots of extra usage, but oil price rises do encourage conservation.
What Oil Stock Investors Can Learn from the Energy Crises of the 1970s — The Motley Fool: “The chart below shows how the crises spurred increases in fuel efficiency, with an inflexion in 1973 and a huge jump in 1979 — evidence that higher oil prices will change thinking about fuel economy and reduce oil demand.”
Also, I posted that article about how the military is still focusing on renewable energy. It may be the one US institution that is thinking about the long-term and what might happen if fossil fuels either get scare or very expensive, and even more importantly, how to avoid dependence on them because that requires transporting fuel from one place to another, which entails money and risk.
I think even if Trump wants to gut environmental and energy science, if he wants to support the military, he has to allow it to move in that direction.
When you think about it, access to more and cheaper oil doesn’t significantly improve the lives of the average American. It’s important in terms of how much gasoline they need to buy to get to work, but otherwise it might allow them to drive more on vacations or buy fuel guzzling vehicles, but some Americans are moving away from that no matter what the price of gasoline.
There are people who want their big trucks, but not everyone does. And there are people who want to drive lots of extra miles, but not everyone does. So lifestyle issues play a roll, no matter what the price of gas.
Car culture is less of a thing that it used to be. Now there are all sorts of electronic gadgets that can fulfill that status need. And while there used to be big families that needed big cars to haul everyone, now a family often only needs seating for four. And whether they get something big depends on what they want to haul.
Substituting cars with i-phones? Just another way of saying: Significant fall in living standards.
Here in Germany the shift is in full motion with young people – even in families who can afford multiple cars.
It’s the smartphones – if you drive with the bus to school, you can check facebook, snapchat and whatsapp during the ride. That’s more important than having a car.
My generation was other – with 10 you wanted a fast bicycle to ride everywhere you wanted, with 16 a scooter and with 18 a car.
Now you don’t see much scooters, or fast electric bikes (I would buy a fast electric bike before buying a scooter today).
Now the young people drive with the bus, even when a bicycle would be much faster (because of tranfer and waiting time).
EN, J and B-II – but what if supplies just kept on falling because: a) of the time delay for new projects, b) the projects remaining are those not developed when oil was $110 i.e. very expensive, c) we aren’t finding much more conventional and, for all the hype, there isn’t enough shale left and/or it isn’t quite as flexible to bring on line in really big volumes as thought, d) geopolitical disruptions take off again as oil prices rise, e) others I can’t think of?
Would you not need a continually high price signal to keep demand in line (i.e. continually falling). It might be from recession, or switching energy (I think most likely gas and possibly back to coal in the short term rather than renewables), or efficiency gains. In theory I guess the price would rise inversely with how fast such changes could be made – but equally all the things needed to make those changes would suddenly start increasing in price as well (or renewables proponents would probably say they wouldn’t keep falling as fast) – natural gas and coal prices tend to move in step with oil over long enough timeframes. This is not rhetorical, I have no idea what will happen.
I think that your personal view of history colors the way you perceive the current situation and possible futures.
From my perspective the “oil sector” has had two different eras with different dynamics, leaving the 1970s oil crises aside. The firs one ended in 2004/5 and was characterized by increasing supply and demand, low price and “boom bust cycles”.
The price elasticity of supply became a lot lower in the second era. Supply didn’t increase as it used to, net-exports stagnated, emerging economies (China and India) increased their consumption and imports, OECD-countries saw stagnant or declining consumption. One other factor that deserves to be mentioned in this era is low interest rate and financial stimulus that provided producers access to capital and enabled consumers to pay for expensive oil. The result was a high oil price, increase of all liquids, and a boom-bust cycle on steroids with inventory buildup and price collapse. I think this era is about to end in 2019/20.
Both the first and second era had boom and bust cycles. Both also had cartels that tried to restrict supply, sometimes with success. Economic growth is important. Low growth/stagnated OECD economies in Europe and Japan have declining use of oil.
What will follow in a BAU world (no full scale war involving major exporters and/or importers)? This is a big guess: I don’t think that EVs & biofuels will be able to substitute and fill the gap from declining oil output in the beginning of the third era. I therefore expect an oil price spike sometime in the period 2020-23 with a new investment cycle that target what is available (Canadian oil sands) and demand destruction (economic recession). There will be price volatility on the back slope of the production curve. The more central banks print money the higher the amplitude. There is quite a lot of storage being built. I expect institutional investors (“smart money”) to hoard oil on dips and sell on highs.
Some countries will successfully transition their essential activities to use a lot less oil. Others will not be as successful but their oil use will also decline, perhaps even more like in Syria.
Big picture reminder:
Pre 2013ish as the comparison vs newer . . . seeing higher shale IPs and EURs says nothing about sweeter spots or more expertise. Never forget stage counts were lower in the past. Frack more stages, get more oil (at higher cost). It doesn’t have to say anything about sweeter spots, other than maybe distance trucks go for water and sand.
Item 2: high prices are why God gave us subsidies.
This link is all about the cost of producing crude in various countries. I don’t know how the folks who produced the numbers calculated them, but they are probably good in terms of at least establishing the RELATIVE cost of production from one country to the next.
https://www.fool.com/investing/2017/03/19/you-wont-believe-what-saudi-arabias-oil-production.aspx?source=iedfolrf0000001
So from their numbers, shale oil has always been profitable as oil never went below $23/bbl. Do you have any number comparing the total US shale oil production to the total expenses of the shale oil industry? I guess it will be much higher than $23/bbl.
Fernando had some useful things to say about Venezuela in response to my question above, but he didn’t actually answer THE question I asked.
Maybe it can’t be answered, but only guessed at.
What will happen to Venezuelan oil production if the country defaults on it’s bonds coming due?
Any and all opinions appreciated, thanks.
Venezuela doesn’t have much debt.
And surf around to read about $5 billion in debt it issued to itself in January.
Look, people, this is real. Everyone creates money whimsically. Banco de Ven bought those $5B bonds. We live day to day using money, but how can there be some profound laws of the universe about it when the stuff comes from thin air?
I’m not a bond trader, but I dont think oil production will be impacted that much, because its more a function of the money they spend on operating expenses and investments. Right now the money they get cones from oil sales and a bit of cash from Rosneft and other big oil loans.
Rosneft loans have been backed by mortgaging CITGO, but there are legal moves to block that move.
From what I can tell they simply keep degrading operational capability. The last move was to include union leaders into the management structure (supposedly to stop corruption). Union leaders are usually the most corrupt in the organizational structure. They have a criminal background and work as an organized mafia. Plus they have no education nor vocation to know how to run an oil field.
I keep seeing brain drain, people leave as best they can, even though many nations are starting to treat Venezuelans as if they were lepers. Nowadays people running from a communist narco regime don’t get much sympathy.
The Europeans prefer Muslims and Africans, the USA has trump, quite a few Latinamerican nations are now closing their doors, and Canada has that commie loving Trudeau in charge. So it’s pretty grim for Venezuelans, who are suffering from hunger, disease, crime, and human rights abuses, and nobody really cares.
Oil production will continue to drop, simply due to the overall erosion in Venezuelan society, which seems to be undergoing a slow motion genocide of the middle class and educated population.
Hi Fernando,
I believe you have described the situation in Venezuela quite well and quite accurately, and I don’t disagree with any particular point you have made.
But what I am wondering about specifically is whether the financial arrangements that allow Venezuelan oil to be shipped and paid for in international markets will cease to work.
For instance, some companies that are currently selling spare parts to Venezuela may simply decide it is time to finally stop delivery, except if paid on the spot or in advance in some other currency. The political leaders in some countries that currently buy Venezuelan oil might for one reason or another decide to refuse delivery. I have read that some ships from Venezuela have been refused permission to enter ports already due to not being maintained properly, which may or may not be true.
It’s also possible in my opinion, although my opinion is merely guess work, that a default could be the political trigger that results in the country finally erupting into something approaching civil war. It seems pretty obvious that at some point, with things getting worse from month to month, that violence will eventually break out on the GRAND scale.
If I were living there myself, and a young guy without much hope of things ever getting better until Maduro is gone, I would be strongly inclined to burn down some oil field equipment, or set any cop car I could on fire, or just about anything else along such lines.
I’m not claiming I would actually be brave enough to do these things, but when I was young, I was pretty reckless anyway, and young guys tend to believe they are ten feet high and bullet proof as a general rule.
What would such a young man have to lose, except possibly a food ration that is barely enough to keep him alive anyway? He could liberate that much by raiding delivery trucks. With a pretty girl as an accomplice, he could almost for sure manage to get hold of at least one pistol and some ammo, by arranging for her to make a play for a cop and distract him into letting his guard down for a few minutes. There are ALWAYS plenty of horny and not too bright cops and soldiers in outfits such as the ones that support Maduro, and so far as that goes, in other military and police forces just about any where, even here in the USA.
And while I am not an engineer, I have been around a lot of different kinds of industrial infrastructure as a rolling stone tradesman, and a guy who knows something about the trades can usually figure out a way to bring a the work at any sort of industrial installation to a jarring and sudden halt, if he puts his mind to it and is willing to risk being shot or thrown into jail for doing so.
A handful of emery powder, one wrench to remove an inspection plug in a big gearbox, and a critical machine is DONE FOR, without at the very least a major rebuild which in Venezuela might take months, just to get the parts imported.
I am generally opposed to allowing immigrants into the USA in LARGE numbers, because there is no doubt at all in my mind that we need to be doing what we can to reduce the growth of our own population, but it embarrasses me that we refuse admittance to REAL refugees.
And while I do not support the Trumpsters, despite what HRC lap doggie HB has to say, we SHOULD vet any refugees allowed into this country as carefully as possible.
The real potential troublemakers are largely, almost exclusively in fact, young men, and if any particular young man who appears to be a bit suspicious is denied entry, well, if you are going to allow in only a certain number of new people, some other young man or woman or child will get his potential entry privilege in his stead as a practical matter.
And in the case of Venezuela, it is my opinion that the odds of refugees from that country being sleeper terrorists are actually pretty close to zero.
For that matter, the odds of any one guy allowed in from say Iran being a sleeper are also very close to zero, but if we allow them to come in large numbers, it’s a statistical certainty that a few sleepers will be among them.
I’m a hard core realist, and to me a hand ful of people dying in a minor terrorist incident even here inside the USA is not something that bothers me very much. Hundreds and thousands of people die hard EVERY SINGLE DAY here for preventable reasons, so while I sympathize with their families and communities of such victims, I don’t lose any sleep over such incidents.
But speaking as a REALIST and IMPARTIAL observer of the national political scene, every single such incident is gasoline and dynamite, in the hands of the hard core political right, in terms of using the incident to justify such programs and policies as are preferred by the right wing.
And the right wing has ALTOGETHER TOO MUCH POWER these days. Every minor incident is a club the right wing can and will use to pound the left wing bloody at the ballot box.
So as a PRACTICAL matter, the left wing needs to be very careful about WHO IN PARTICULAR, meaning individuals, it wishes to allow.
A woman with a couple of kids, no man, from Iran or Iraq, or any other hot spot is VERY unlikely to ever create a serious problem. But out of a thousand young men from such places………. or five thousand……….
Furthermore, such incidents are also to some extent grist for the left wing political mills, because the left in this country sometimes prefers to deprive every body of a right or a privilege rather than in it’s holier than thou pc foolishness being willing to deprive bad guys and girls of their freedom to do bad things by putting their sorry asses in jail until they are too old to have energy enough when they get out to BE bad any more.
I am NOT advocating locking people up forever on a three strikes basis for relatively trivial crimes such as selling pot or shoplifting, but people that shoot people WITHOUT JUSTIFICATION or commit armed robbery, etc, need to spend some years in the pokey, and it doesn’t bother me AT ALL to see them in orange jump suits and maybe even with well padded light weight ankle chains picking up trash alongside the highway.
At least once in my own life, I might well have been murdered, by a mentally unbalanced man who came to my house quite ready to kill me because I fired his wife who was working as a caretaker for my bed ridden Mom, about fifteen years ago. I knew the danger, and when he pulled into the driveway and emerged wild eyed from the car he came in, with a mattock , with a couple of similar low life sorts, I stepped out side with my double barrel, and I tell ya true, there is not much in this world that has the impact on a bad character that the side by side EYES of a double barrel has on such characters. The lot of them left quite peaceably of course. I didn’t even have to really point it at him, I just pointed it here and there to the right and left of him, lol.
He won’t ever cause ME any more trouble, because I will be dead of old age before he gets out of prison for various other crimes he committed as a repeat offender. Farmers sometimes find it necessary to carry quite a lot of cash, and if you are armed, or suspected of BEING armed, the likelihood of being robbed is substantially reduced.
The same sort of people who often go all gaa gaa about buying their fruits and veggies right off the farmers truck at a city market are very often the sort who pee in their undies at the very thought of somebody other than a cop having a pistol…….. but they rarely stop to think about that farmer being on the road home, with maybe a couple of thousand dollars in cash in his pocket, late in the evening, or the buyers from restaurants being in the market buying a hundred dollars worth of this, and fifty of that, etc, until they have a van load, which can easily run into a couple of thousand, and while sellers who know individual buyers will take their checks, this sort of buying and selling is mostly done on a cash basis. It’s impossible to know ahead who will show up with a couple of bushels of sweet peas you would like to run as a special not on the regular menu, etc.
I’m retired, but I often delivered thousands of dollars worth of fruit over the course of a day to different stores back when I was working, and most of these transactions were for cash with the store managers, with receipts given of course.
They say God made us big and small, but that Colonel Colt equalized us. There are three women in this old world who used to be intimately involved with me who own and carry small pistols, legally, that I gave them as gifts, and I taught them how to use them. The odds of any one of them being the victim of an assault have been GREATLY reduced, because all three of them are known to be armed and DANGEROUS, if assaulted.
I used to be young, and very tough, physically, due to being a big old farm boy used to hard labor such as loading trucks , or building fences, but now I’m old, and sort of fat, and somewhat arthritic as well, and there are some women out there who could whip my ass.
And there are some men out there who would probably be very happy to beat me to a pulp, if they were to catch me out alone on the farm, because they went to jail as the result of my testifying against them in court. They won’t come looking because they have every reason to believe they would doing so.
Law enforcement works, and works well, in some circumstances , and not so well at all , under other circumstances. I’m on excellent terms with my local police, but they are few , and the country side is large, and even getting in touch with them on short notice is often impossible out in the country. Cell service is iffy , and the closest accessible land line phone may be miles away.
If I sound like a right wing redneck, so be it. On a real right wing red neck site, I’m generally referred to as a pinko commie socialist, and that’s just if the person commenting happens to refrain from actually cussing. The ones that cuss routinely call me anything that crosses their mind.
The peeing in their underwear scared of their shadows types on both the left and the right are generally ready to go along with the loss of our rights and privileges in such cases, with the left wing being eager to simply do away with some rights, such as the right to own firearms, and the right wing eager simply to amass and concentrate power in it’s own hands.
This example may be a little far fetched, but it will do to illustrate my point. When I was a kid, and most of my life, I could buy a few sticks of dynamite, no problems, and to a farmer in the mountains, a few sticks of dynamite can be a damned near priceless tool when it comes to certain jobs.
Right now for instance I have a rock outcropping in a road going around a hillside that I could remove easily with dynamite and a drill rented for a day, but it’s IMPOSSIBLE to for me to even hire a demolition contractor to do this job, due to the amount of paperwork and expense involved. Getting it done would cost several tens of thousands of dollars, according to casual inquiries I have made on the phone, because the minute handful of contractors who can do this work don’t show up for less.
But if I were a TERRORIST, I could without a shadow of a doubt steal enough dynamite to fill up the trunk of a typical automobile, at low risk of getting caught in the act. I know of several places where it is used and stored without very much in the way of security, just padlocks and fences and maybe one half dead with old age rentacop , within fifty miles of my home. What sort of places ?
Stone quarries of course.
There are probably burglar alarms on the storage trailers, but by the time a cop arrived , I would very likely be gone.
Maybe this rant will provoke some well expressed comments I can use later on in my book, lol. Pro or con I look forward to any reply that indicates some thought went into it.
“So it’s pretty grim for Venezuelans, who are suffering from hunger, disease, crime, and human rights abuses, and nobody really cares.”
Join the queue. It’s been a long one for quite sometime. Getting longer.
I don’t understand how BTU Analytics shows their oil region DUC count (excess DUCs measure) going down whereas EIAs figures for their oil region DUC count are still high and rising?
BTU Analytics, outside of the Williston Basin and DJ, DUCs are within normal levels of working inventory (From February Upstream Outlook)
chart on Twitter https://pbs.twimg.com/media/C7VF6G-VoAASXoF.jpg
https://pbs.twimg.com/media/C7VF7QKU0AAxfb0.jpg
EIA DPR DUC count for oil regions
chart on Twitter https://pbs.twimg.com/media/C60hVYXWcAEK_Cp.jpg
I think they assume a certain time for the working inventory – something like 6 months, so if there are, say, 80 completions per month then the working inventory would be 480. Anything below this could create difficulty in scheduling completions, and anything higher is considered excess and could be worked off before adding rigs.
Various sources have different definitions of the DUCs, and sometimes they even show divergent trends in the DUC number.
JODI Data world crude + product stocks increased in January from December, mostly due to products. The increase looks in line with the IEAs number from last week of +48mb.
Saudi Arabian crude oil stocks down -10.7mb m-o-m, total product stocks up +3.1mb m-o-m in January
Canada, Brazil and Russia all fell, I think for the first two because of maintenance. I count only 6 countries increasing – USA, UK, Qatar, Nigeria, India and Egypt (only just). Kazakhstan didn’t report though. USA and Nigeria the only big gains and Nigeria likely to fall again in March
Any reason for SA to decrease their oil stocks at low prices? Do they want to maintain low oil prices? Do they have difficulties to supply the market from increased production?
Similar charts as above have been posted here on POB before. I haven’t seen any analysis on SA stock level or how they use their stocks. If anyone has read one that is available, please provide a link. It is interesting that they kept on increasing their stock when the price was high and decided it was a good idea to draw it down when the price is low.
SA may have been producing flat out w. negative spare capacity for more than one year (or they are just pulling our leg). -10mb m-o-m will reduce their stock to the same level as 15 years ago, by end of 2017. The voluntarily OPEC production cut was timely…
Iraq.
ZH is running a blurb that Iraq may be reluctant to continue any cut (with which they have thus far not complied) because of loss of revenue Iraq needs.
More to it. The contracts. Apparently the companies are entitled to compensation by the gov’t if their production is reduced by the gov’t. Big problem.
Iraq isn’t going to join any drumbeat for a cut extension.
I found this article re EROEI although he calls it ECoE.
https://surplusenergyeconomics.wordpress.com/2017/03/19/90-after-peak-prosperity/
UK looks like it’ll be the first western nation to go medieval.
I have a new post on gas and oil production in the Appalachian basin, available here.
How OPEC Lost The War Against Shale, In One Chart
http://www.zerohedge.com/news/2017-03-21/how-opec-lost-war-against-shale-one-chart
this is not news to those of use who are actually oil men, and make a living by exploring for and producing and selling oil and nat gas as opposed to those who seem very comfortable spending their time being complaining naysayers?
From the article: “That said, the new equilibrium only works as long as credit is cheap and plentiful. If and when the Fed’s inevitable rate hikes tighten credit access for shale firms, prompting the need for higher margins and profits, the old status quo will revert.”
Again, how profitable was the shale industry in 2015 and 2016?
With oil price around 50$ on average during Q1 2017, do you think they will publish profit for that period?
No law of the universe says rates are going up. They have fallen for over 30 yrs.
Oil giants upending shale turf where wildcat drillers once ruled
http://www.worldoil.com/news/2017/3/21/oil-giants-upending-shale-turf-where-wildcat-drillers-once-ruled
mike are you paying attention yet?
How is an excess of LTO a good thing for you? Please explain. It’s lowering the price of oil and making it hard for many in the oil industry to make any money. Why do you continue to promote it when the economics don’t look good?
Everything is profit when you cash a royalty check
But the royalty check gets smaller as the price goes down. More drilling means a smaller check.
These “Oil is doing great. You better not miss out,” statements remind me of penny stock boiler room pitches.
The oil giants article primarily refers to Permian Basin operations for Shell Western E & P, states new wells cost $5 million, that wells are profitable at $40 oil and new wells are profitable at about $20 oil. Profitable is not defined. These statements are attributed to Shell Western E & P upper management.
Shell Western E & P
338 horizontal wells in Permian Basin wherein Shell E & P is listed as operator.
247 horizontal wells active in 12/16 in PB
91 wells horizontal wells inactive (not producing) 12/16 in PB
8 have produced 300,000+ BO cumulative
21 have produced 200,000-299,999 BO cumulative
93 have produced 100,000-199,999 BO cumulative
125 have not yet produced 100,000 BO
In 12/16
73 wells produced 3,100+ BO
120 wells produced 776-3,099 BO
54 wells produced 1-775 BO
$20 oil x 100,000 BO, x .75 net revenue interest = $1,500,000. This excludes all production taxes, lifting costs, general and administrative costs, etc.
Enno: Do these production numbers look good for Shell Western E & P Permian Hz wells?
Stay curious.
SS – It is hard to stay curious, when I am totally mystified. At today’s prices I just do not understand how Permian wells pay out unless they average EUR of 200,000 bbl ea. [200,000 x 75% NRI x $40 (WTI net of production costs) = $6 million]. $5 million to drill and $1 million land cost. And that is not discounted [interest expense] cash flow. And Bakken wells might be worse – lower price received, but higher EUR.
It used to be kind of a rule of thumb that you did not start a project unless you could demonstrate an “Internal Rate of Return” in excess of 15%. I would not invest in any normal stock unless I thought that I had a chance of getting a 15% annual return.
It is like asking someone who just purchased a $100,000 Mercedes-Benz how he can afford it. And his answer is, “easy:” I drive 12,000 miles per year. The cost of gas, insurance, and annual maintenance is less than $.50/mile. Obviously ignoring depreciation, and actual interest costs. Or if he paid cash, an imputed interest charge on the purchase price.
I believe that you have noted that many banks do a semi-annual reserve valuation in April and October. I do not know what WTI price they will use, but if it is not over $50, the calculations cannot look pretty.
It’s very simple:
New permian wells have a return of 450k barrel of oil, in minimum. So the break even is 20$:
http://www.approachresources.com/approach/files/ab/ab8ea30d-8a05-4f46-be96-d0568bc41784.pdf
There are lots of these reports on the net – ready to get lots of money from investors. You’ll get rich fast, just buy some permian company stocks or bonds (best both 😉 ).
That’s what goes to the stock magazines and investor newspapers.
If you read oilprice.com, Permian will supply half of the world with oil, soon. No more deep sea oil necessary.
450k – Is that what Enno’s analysis shows?
clueless. I think I am pretty much through with stating opinions. Better with taking the approach of stating historical production on these wells and let those who already are not predisposed to be “pro” or “anti” shale use that data to draw their own conclusions.
Enno Peters does the best job of stating the production facts, however, when I saw the statement that new wells are profitable at around $20 per BO (per Shell management) I thought I would look at their Permian hz well histories and put that into perspective. I think, however, it is better to just look at Enno’s data, rather than me continue to post anecdotal evidence. But, I probably still will sometimes.
I will violate the “opinion rule” a couple times here. $20 WTI sustained would BK our production and most other conventional that I am aware of in the lower 48. It would likely BK almost all GOM and many existing hz wells in the lower 48 that have been producing in excess of two year.
I have had shale proponents tell me to ignore past Permian hz wells, as those were all primarily drilled to define the acreage, and that wells from 2016 and later will be much better. I do agree there has been improvement.
I was hoping for a $55-65 WTI price range for purposes of the conventional production I own an interest in.
I guess one other “opinion” is that it is difficult to point to a time where a major new find of crude oil on US soil did not result in low oil prices. So, until they drill through most of the shale, or LTO, I suppose prices will be low.
I wouldn’t start looking at this unless you are bored and have time to spare 🙂
World crude oil inventories, mostly JODI Data but USA is from EIAs monthly figures. Plus the crude inventory figure for January was taken from EIA’s weekly reports, week ending 3rd February: 508,592mb
The crude inventory picture is incomplete. Especially as it’s difficult to find data on OPEC crude inventories, there’s no data in JODI for Gabon, Iran, Kuwait, UAE. And Venezuela has not reported since Aug2016.
Here is a table with the full list of 51 countries, and some comparisons. (These are the actual figures, not the orange line divided by 2 to fit the chart)
direct link: https://s14.postimg.org/pooy92msh/2017_03_22_Crude_Stocks_Exporters_USA_OECD_Non_OE.png
I was trying to see the oil market in terms of exporters (oil for sale) and consumers (oil buyers). This is the result so far…
Does this agree with Jean Lahererre that here is a correlation between the inverse of the price and the storage three months earlier. It looks like maybe for WTI and US storage, not so much for the others, unless maybe it works if the oil price is converted to the local currency (or basket). Although it might be the correlation is dominated by the price collapse after 2014 and is an artefact of too small a data set?
I’m not sure what it all means 🙂
I included Mexico twice in the chart above. I’ve updated the link to the table but the website doesn’t seem to allow users to delete uploaded pictures. And so this is the updated chart – below, it’s only the orange OECD+NonOECD line that is now around 24mb lower (12 lower on the chart).
It does seem to show that the USA has a lot more crude oil storage space compared to the rest of the world 🙂
From Jan2014, crude oil stocks increased 172mb in the USA whereas only 65mb for the rest of the (JODI Data) world (USA + rest of the world, total 237mb)
Hi all,
New post
http://peakoilbarrel.com/future-us-light-tight-oil-lto-update/
and open thread
http://peakoilbarrel.com/open-thread-non-petroleum-march-22-2017/
[…] above graph, taken from the ‘OPEC February Production” post at the Peak Oil Barrel blog, shows total oil production, in thousands of barrels per day, for the 13 members of OPEC, for the […]