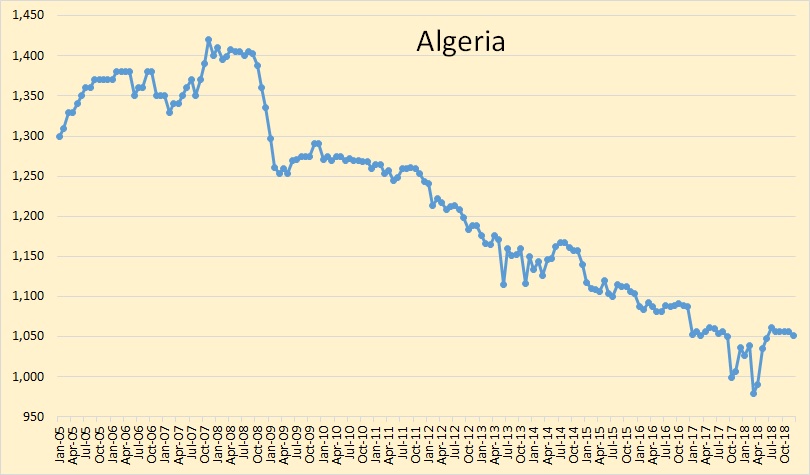
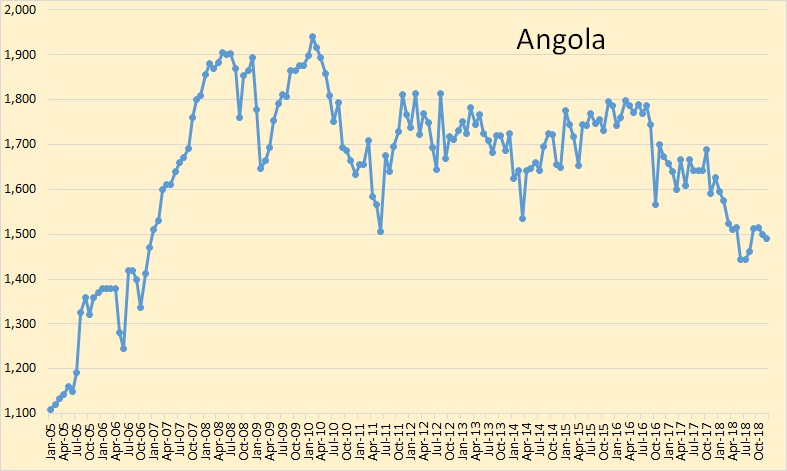
All OPEC data below is from the January OPEC Monthly Oil Market Report. All OPEC data is through December 2018 and is thousand barrels per day.
Qatar has left OPEC and is not included in this months report. All Qatar historical data has been removed from all OPEC charts.
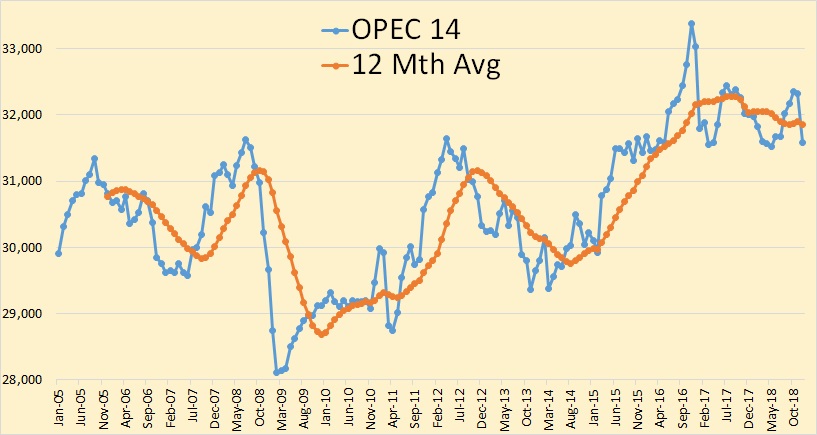
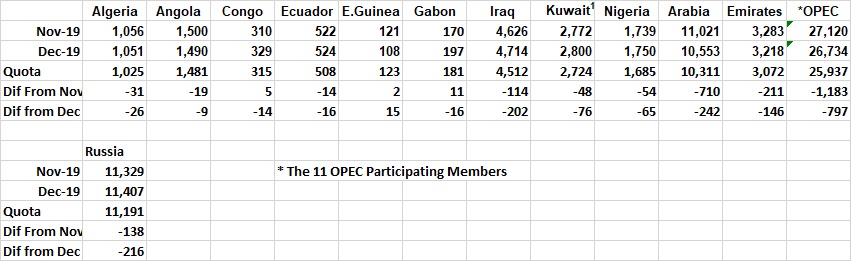
OPEC 14 production was down by 751,000 barrels per day in December. That was after November production had been revised downward by 23,000 barrels per day.
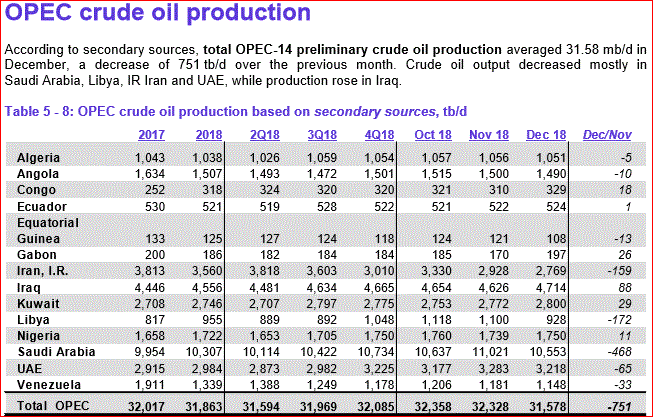
Here you can see who had the big declines in December.
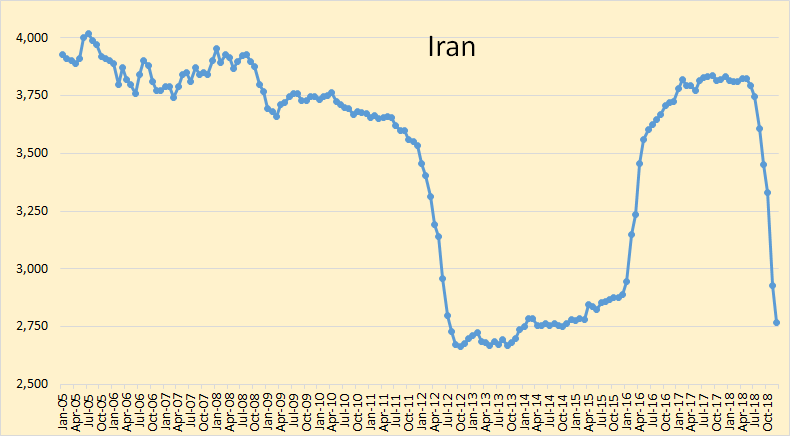
Iran is now at about the average they held during the previous sanctions period.
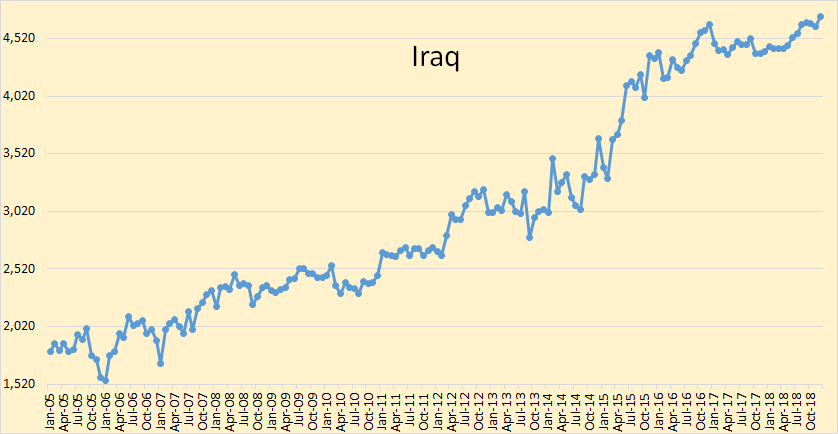
Iraq reached a new all-time high in December of 4,714,000 bpd. That was up 88,000 bpd from November.
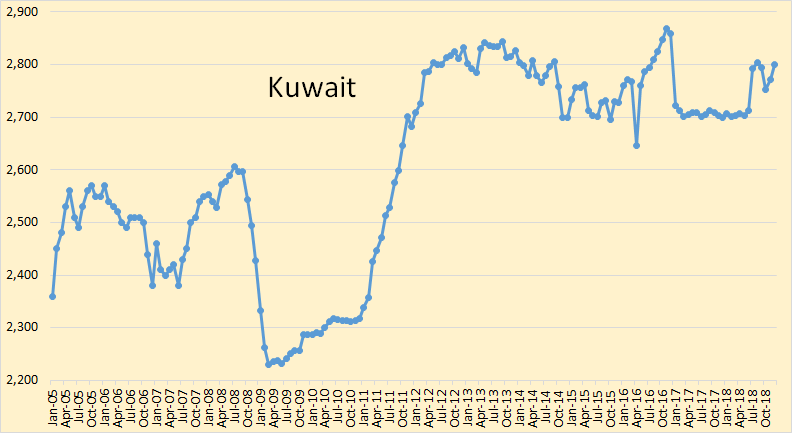
Kuwait also increased production in December, up 29,000 bpt to 2,800,000 bpd.
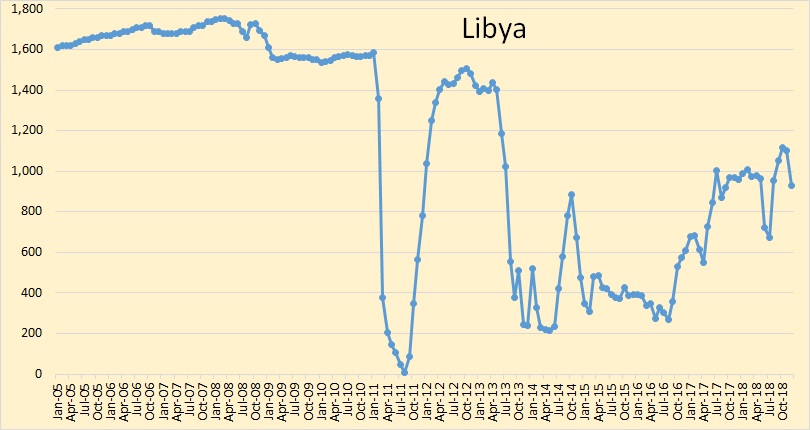
Libya is still having serious political problems.
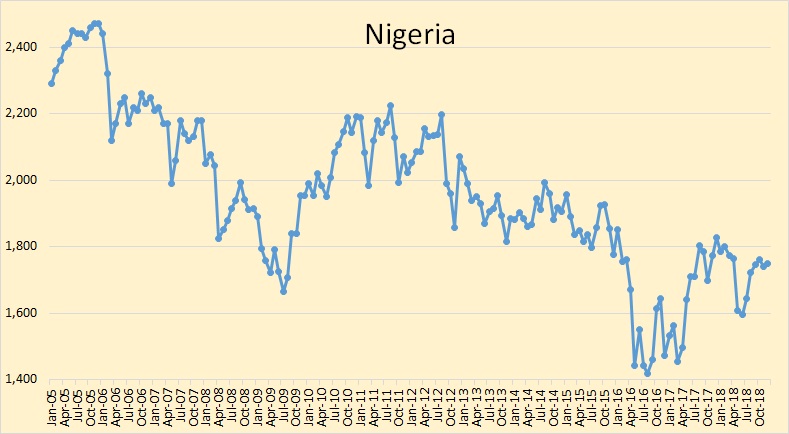
Nigeria is also having political problems but it is hard to tell how much of their decline is due to politics or natural decline.
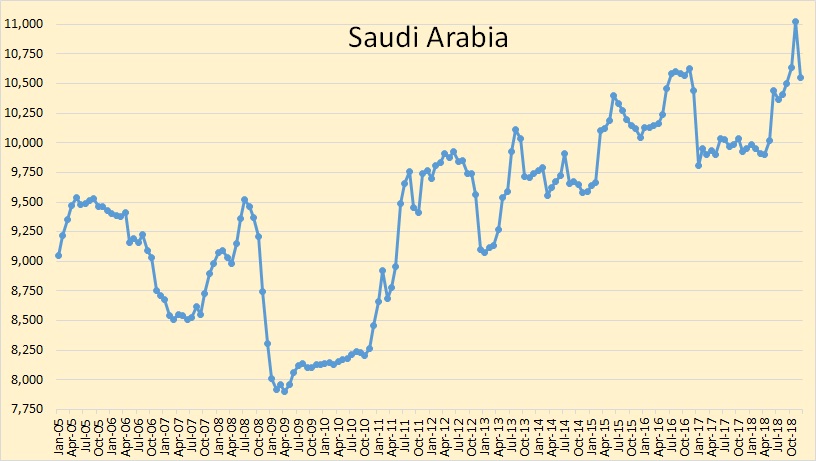
Saudi Arabia was down 468,000 bpd but that was after they spicked up by 384,000 bpd in November. They are now back close to their average for the last seven months.
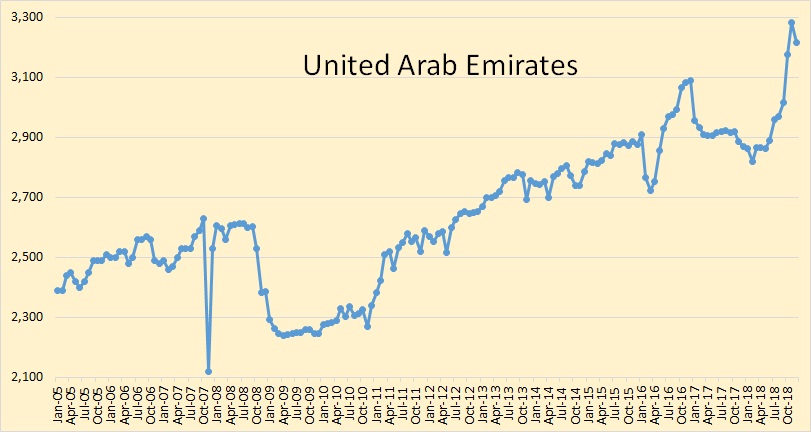
The UAE dropped by 65,000 bpd in December.
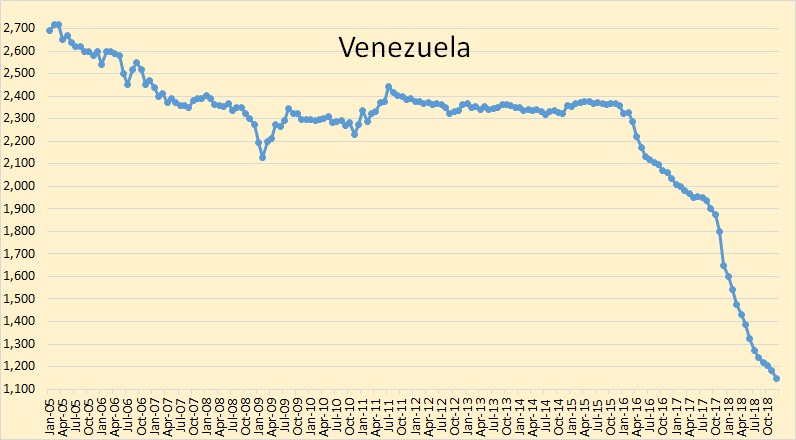
Slowly, slowly Venezuela sinks into the abyss.
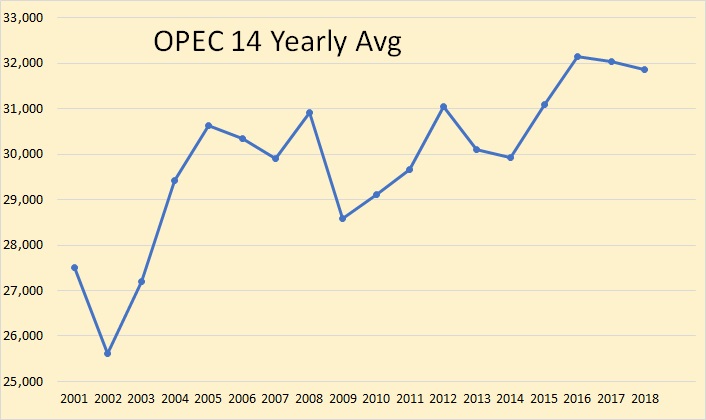
OPEC 14 peaked in 2016 at an average of 32,157,000 barrels per day and in 2018 was down by 300,000 bpd from that average.
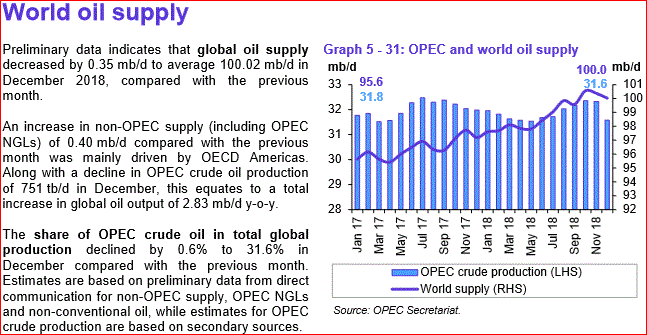
World oil supply, including NGLs, declined by 350,000 barrels per day in December.
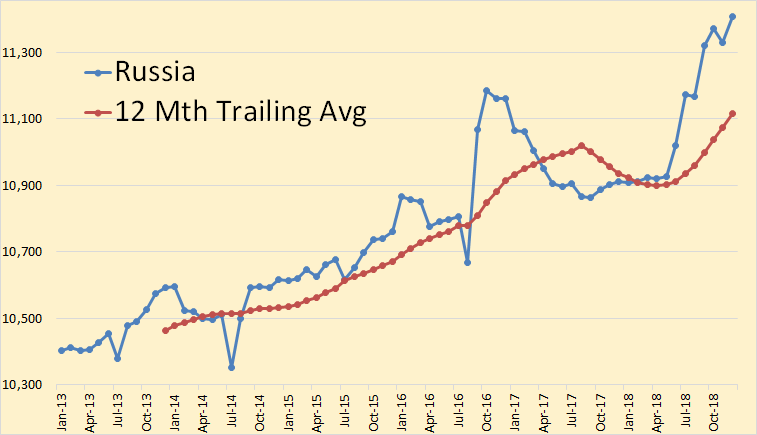
Russian C+C increased by 78,000 barrels per day in December to 11,407,000 bpd.
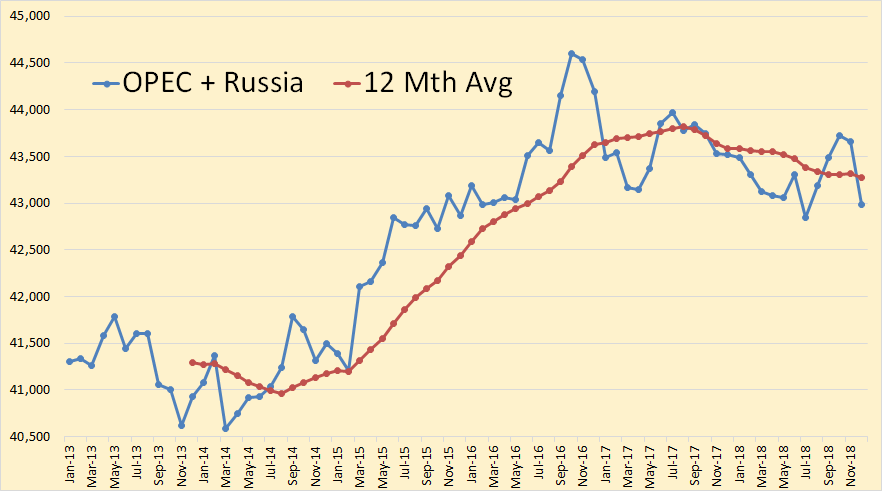
Even before the December decline, OPEC+Russia was in decline. It’s all up to US and Canada to keep up any increase. The EIA includes Brazil in the mix but others have doubts about the ability of Brazil to have any kind of dramatic increase.
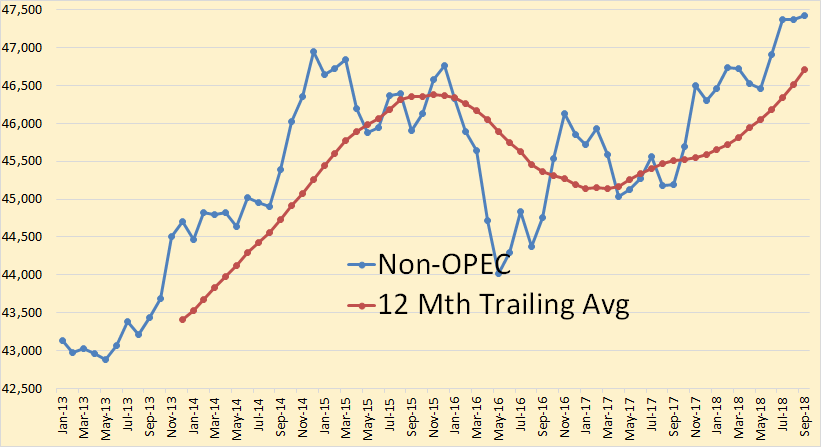
This data is from the EIA and is only through September 2018.
Again, EIA data through September 2018.
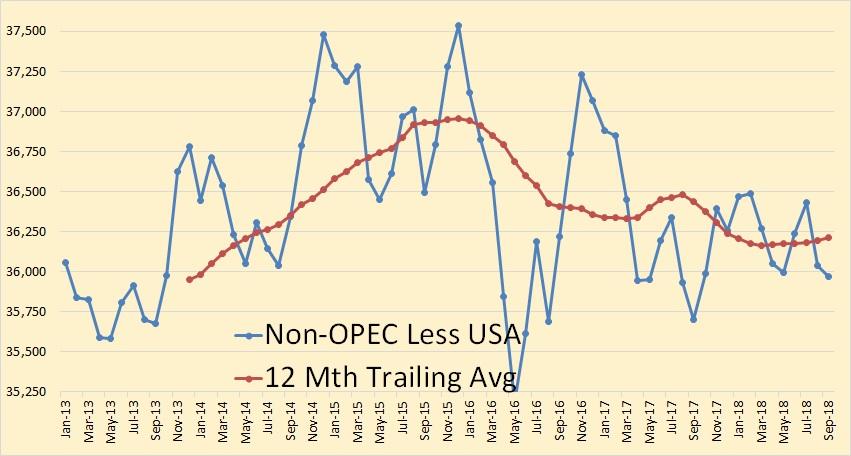
I think it is quite obvious that Non-OPEC less USA has peaked.
Likewise…
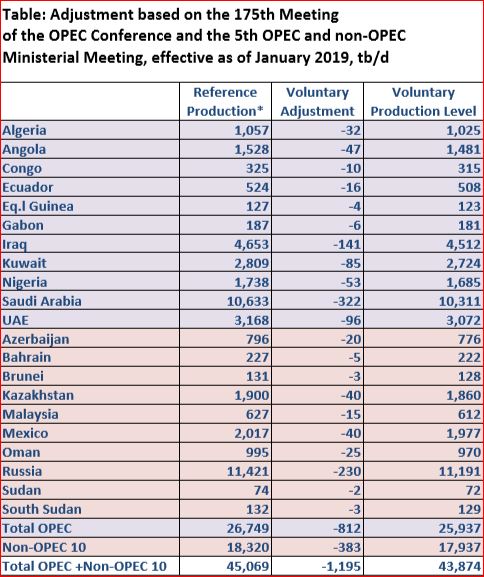
Iran, Libya and Venezuela are exempt from quotas.
377 responses to “OPEC December Production Data”
It appears that outside OPEC and Russia, production growth will largely be from the Permian Basin.
Doesn’t look like Bakken or EFS will grow much more and other shale basins are not large enough to move the needle much, at least based on current data. Canada will be transport constrained for awhile.
When shale hits the tipping point, things will get interesting, but looks like PB will not hit that for a few years.
The charts at the end are really good for analysis. I see if US production is flat, or close to it, for 2019, then World could be flat to down for that period. That could still put 2019 over 2018, depending on how long the OPEC cuts last. I really don’t expect it to remain that way, its just the way it looks at this point, in time. However, it is likely to remain that way for a longer period of time than I first imagined, as the Permian pipelines are likely to be on hold longer than first expected. I see little substantial increase in the Permian during 2019. While Dennis and EIA expect a 500k bpd increase from shale in 2019, I don’t. Even if it does, plugging that in, makes the world, essentially, still flat. Which is horrible for supply, when you consider decline rates, and any increase in demand.
GuyM.
Looking at shaleprofile.com, it appears that PB will add almost 2 million BOPD from 2018 wells, but will drop over 1 million BOPD from 2017 and prior wells (shale only) once final numbers are in for all of 2018.
For USA total, and estimating OK production, looks like US will add around 3.5 million BOPD from 2018 wells and will drop close to 2.5 million from 2017 and prior wells (shale only).
No wonder the market has no clue and is so volatile.
A 100 million BOPD market that is very dependent upon US shale. When US shale hits the tipping point, assuming demand has not began to fall worldwide, oil could jump $100 or more IMO. I assume that will be the shock that will cause demand to crater.
I know I will be subject to much poo poo, by saying this, but I see the price approximating $100 this year. It will not be the tipping point, it will need to be much higher that $100 to kill demand. IMO Obviously price is not determined by fundamentals, especially, when you have such beneficial organizations supplying fundamental information like the EIA. But, panic can override BS.
GuyM,
Let’s say you mean the Brent Oil Price reaches $100/b by Dec 2019 and the average oil price for the year is about $80/b for Brent and perhaps $70/b for WTI. My expectation is for US shale output to grow at an annual rate of about 450+/-100 kb/d, if my guess for average WTI oil price in 2019 of $65/b is correct.
This is for all US basins which are likely to see increased output with oil prices rising. Not sure that OPEC will maintain cuts when oil gets to $80/b or more, I think they will bring on some supply (along with Russia) to keep oil prices under $90/b. If US output is flat rather than a 450 kb/d increase as I have guessed, OPEC/Russia will be able to increase output to keep oil prices in check, if they choose to do so.
I’d rather see higher oil prices to get the EV transition rolling, above $100/b would be great for the environment, but unclear if OPEC/Russia will let that happen as they would prefer to delay the transition to EVs as long as possible.
My guess is that they will aim for $80/b.
Dennis
You are correct. Oil price will not hit $100 this year unless for political reasons. There is now enough spare capacity in OPEC and Russia to cover demand growth that is not met by US production.
The number of electric vehicles sold is nothing to do with OPEC and oil price and everything to do with how good electric vehicles are and their price. If i could buy an electric vehicle for £20,000 which would drive 300 miles, i would buy it tomorrow.
Hugo,
If petrol prices increase by 50% it might make sense to buy an electric vehicle, but I am not sure about electricity costs in the UK.
The price of EVs will decrease while the cost of oil increases, we may reach your price point by 2025, at which time oil prices are likely to be $100/b or more.
I am frustrated by the fact that EV vendors still seem to be bifurcated between totally exotic very expensive cars and those designed for the nerdiest of eco-freaks. All of those available here seem to be burdened with electronic foo-foo designed to attract the short attention span of those much younger than me. Living somewhere between those extremes I’m driving a Chevy Volt, a plug-in hybrid. When I acquired the car in 2016 I assumed that by now some interesting cars would be available at reasonable prices. Here in California that does not seem to be the case. My lease is up in May. I assume I will just buy the car and drive it until one of us stops functioning.
JJHMAN
I agree, BMW have an electric car, which looks awful compared to their petrol models. I really think it has been thrown together to please the eco geeks. Their claim of “up to 160 is rubbish. Real life range is 120 max. I would have to recharge 3 time to make a journey I do regularly.
When you think BMW make about 70 models and variants, it is disappointing.
Things like this car is only usable as a 2nd family car at the moment.
Driving to work while the partner takes the bigger (gasoline) car to distribute children to sporting, activities or for longer rides.
This can be useful if commute ways are long enough – a 30 km single way commute adds up to lots of km in a year.
Anyway, there isn’t enough battery producing capacity now and all these cars are still studies of possibilities.
Next or overnext generation battery tech is necessary to bring a real mass market. When something like this works in mass market, even planes accross the atlantic will be possible:
https://www.greencarreports.com/news/1120563_honda-presents-new-battery-chemistry-that-could-succeed-lithium-ion
The company doing the clains is Honda, not a small startup begging for investor money.
Still 10 years to go and muddle through.
The perfect answer to intermittent wind and solar and needing to reduce CO2 emissions is hydrogen.
Hydrogen produced from renewable energy can be stored to produce electricity or used for heat.
http://www.actaspa.com/projects/project-2/
If the US spent half it’s war budget on this kind of technology the world would not be worried about lack of oil.
There would be plenty of clean electricity.
Why does the US spend so much on war?
https://ourworldindata.org/military-spending
Demand is not limiting the growth of the EV market. Every model has long waiting lists, sometimes years. Hyundai has more back orders for EVs in Norway (population 5.2 m) than it plans to produce worldwide in 2019.
Oil is an expensive form of energy and can’t compete with electricity on cost. Not sure, but I think the prices would have to fall well below $10 a barrel. A lot depends on taxes etc. So cost isn’t really the issue. In fact Tesla’s great contribution to the industry was noticing that most of California’s EV compliance cars were bought buy rich people looking for something cool, not by penny pinchers or people who give a crap about the environment.
The real issue is that the battery industry can’t keep up with demand. The most successful EV manufacturers — BYD and Tesla — are also battery manufacturers. Everyone else is scrambling to find a supplier. For example VW brags it has enough for 15m cars, a drop in the bucket, and SAIC, China’s biggest car company, is partnering with CATL, China’s biggest battery company.
The quickest way to cut oil consumption (if that’s your goal) would be to switch to hybrids, which use much less oil and have much smaller batteries. But EVs are cheaper and easier to design and make, more profitable, much easier to maintain, and more attractive to consumers. From a marketing perspective, hybrids are neither fish nor fowl. The only advantage to hybrids is that they save gas, but that isn’t really a priority, even at $100 a barrel.
In Spain electric vehicles are more expensive, even though they receive subsidies and preferential parking. Most taxis use conventional hybrids, buses and trucks are diesels.
Sometimes I use taxis, and ask the drivers why they don’t use electrics, they explain electrics are too expensive, have short range, take too long to recharge, and the battery lasts even less in cold or hot weather.
Cost per mile of electrics vs ICE over 10 yrs-
(including all costs such as purchase, energy, maintainenece)
about 1/2
if you don’t like that result, then use faulty assumptions for your analysis. You may be able to get results that are closer to equivalency.
Used to like this site for its good analysis and high level of debate.
Now we´re down to “I´m always right, I own the truth and who doesn´t agree with me is faulty”.
I take it you think that professional taxi companies refuse to use “cheaper” subsidized electric taxis because they are ALL stupid? Why don’t you invest in an electric taxi fleet in Spain and make a ton of money?
Fernando, your comment contains real facts from the real world and is the kind of useful commentary that makes this site so good.
My response was to Hickory’s comment, which is the opposite: no facts, only bold statements and harsh words.
Sorry for the misunderstanding.
Hickory, what capital cost have you assumed for your calculation? 0%?
Baggen- my hasty mistake. Should not have indicated purchase price as part of that ‘cost per mile’ statement. Rather just fuel and maintenance.
There are two big wild-cards to these projections. One is the longterm cost of petrol. It might go up rapidly some year. The other is longevity of the EV battery pack. If they wear out prior to a 7-10 yr timeframe, the economics certainly fall short.
Nice anecdote, but the real reason there are so few EVs on the road is that manufacturers can’t produce them any faster. Sales doubled in 2018 over 2017, and factories can’t keep up.
Oil is still too cheap.
In most of Europe with all the taxes added we pay the equivalent of $250 per barrel.
I know 3 people who very recently bought cars and they did not even consider an electric car due to range and cost of the vehicle.
Sorry, sometimes I switch over into delusions of grandeur that I can predict the future? I can pretty well be assured that it will not resemble what the mainstream media, nor EIA think. Never does. Ok, my prediction for 2019, is that it will surprise most in relation to oil price and production. How’s that?
I would be surprised, Dennis, if production rose to 350k bpd, even if prices eventually get to $65 in the next few months. Then again, my delusions are coming over me again?
GuyM,
I am not saying you are incorrect, just expressing an alternative position. So I think your expectation for the change in US output in 2019 might be something like 0+/-100 kb/d?
Not really a huge difference from my 450 kb/d+/-100 kb/d.
Heck we could call it 250+/-250 kb/d and we’d have it covered, and that’s probably not a bad guess, imo.
Bottom line, neither of us knows, I tend to guess a little higher because I consistently guess too low on future output.
Going from a 1300 kb/d increase to zero in one year seems like too big a change at $50/b. If it were $40/b, I would be more inclined to guess that low and maybe oil prices will fall back to that level, but that would surprise me unless there is a recession, which would also be unexpected.
Permian did about 200k better than my expectations with takeaway constraints, so those constraints were incorrect. But, it is at the wall, now. Some of those constraints will possibly go away in the third quarter, allowing for another 1 million. Or, maybe not. Other than a max of 200k from other shales, if the price is right, I can’t see production ramping up until the final quarter, at best. But, then, I was 200k short on the Permian for 2018, so what do I know? Except, I know US production will be far short of making IEA expectations. We are going to have some serious draws on inventories in 2019, and OPEC is licking their chops. In contrast to the EIA economists, Opec has some real oil people covering US and the rest of the world”s production.
Shallow
You, Eulenspeigal, and Dennis made some pretty good comments towards the end of the last thread concerning 3 MM bbls online from 2018, 2 MM bbl decline pre 2018.
Powerful context and implications with those numbers.
Eulenspeigal observed how the mining model applies with the cost of tires/diesel playing a role in decision making regarding production, along with ultimate product pricing.
Dennis employed a flawed, IMHO, projection using past history to assess future production probabilities.
Unconventional hydrocarbon production in the US is now in new territory
vis a vis historical norms and the sooner that this is recognized, the more accurate assumptions may be made regarding what to expect down the road.
Shallow, when EOG claims it now costs less than $5 million to drill and complete a Bakken well, when 5,000 foot laterals in the Niobrara are routinely drilled/completed at – or under – $2 million per, how does that impact the economics?
Does a Colorado well that produces “only” 100 thousand barrels first year now seem viable if the development cost is so low?
In the ongoing Rice brothers/EQT dispute, some interesting data points are coming out.
Contrary to recent trends, the Rices are adamant thst 1,000 foot interwell spacing is optimum. Rather than seeming to forego the recovery of in place hydrocarbons, the Rices feel that cutting edge completion practices can now recover the same – or more – gas with fewer wells.
Think about the implications.
Furthermore – again bucking trends – the Rices claim that 12,000 foot laterals are optimum and longer lengths prompt both operational and recovery shortfalls.
So, if they are correct (and if this view starts to spread to other areas), relatively fast drilled, ultra precisely targeted wells can be put forth on short notice – susceptible to near term market forces – and these wells will now be completed using the entire range of innovative completion techniques (the near wellbore and far field diversion processes being only 2 of these highly impactful processes).
Furthermore, to expand upon my recent chiding of Dennis’ use of ‘averaging’ in looking at LTO stuff, there is WAY too much variability to try to gain accuracy unless one is willing to look deeper.
The Bakken/Three Forks is a good example.
The recent targeting of the second bench of the Three Forks is showing very strong results.
This bench has had a minimal development history as the first bench and Middle Bakken were the early, main targets.
These second bench wells are apt to show completely different profiles than the other wells (higher GOR, faster drop off in production).
These differences are apt to cause skewed analysis absent an understanding of what is going on.
This is true in spades with the SCOOP/STACK/MERGE formations in Oklahoma and most probably with the different stacks in the Powder River Basin and the Permian to boot.
What is going on here, Shallow, is a vast, vast newly accessible resource- both gas and oil – that can be brought to market at short notice, in an increasingly lower cost manner.
Markets seem to be slow to recognize this.
coffee.
I am not sure about the costs you quote. Don’t follow as closely.
In general terms, there will not be good returns in US oil until the Permian Basin is developed to the point the EFS and Bakken are now. The oil price will stay too low.
Exception is in the event of a major Middle Eastern War.
It appear natural gas E & P’s will be a poor investment for decades.
Cheap energy for consumers in the USA.
Interesting that XOM is going wild in PB and CVX is taking a more measured approach.
Would love to know the reason(s) for the different strategies.
Shallow
Regarding d&c costs …
A couple of years back, PDC brought online 4 wells simultaneously from the same pad.
Using so-called monobore drilling along with fracturing all the wells at the same time, PDC claimed a per well cost of $2.3 million.
Recent wells have been drilled in the Niobrara in 2 days time.
Same same in both the Bakken and Appalachian Basin areas that I follow as laterals are routinely drilled at or near a mile per day pace.
The frac water is all piped in.
Sand is used almost exclusively with little to no ceramics.
Sand mines are increasingly located within the basins, thus eliminating much of the expensive shipping costs.
People quoting $10 million dollar range per well may only be accurate where the activity is still in the earlier phases.
Heck, even CNX claims their latest Deep Utica well costs have almost reached their $12 million d&c goals.
This is down from near $30 million just 5 years ago.
This lowered overhead, coupled with quicker, higher recoveries, will expand the prospective footprint enormously across the country.
Coffeeguyzz,
One needs to include land costs pad costs, storage tanks, gathering lines, cost to abandon the well at end of life, it all needs to be included in the cost of the well to evaluate the investment.
Investor presentations are notorious for painting a rosy picture.
In the Permian Basin the full cost of the average well is about 9 to 9.5 million dollars.
For Bakken see
http://www.petroleum-economist.com/articles/upstream/exploration-production/2018/where-next-for-the-bakken
Note that the EUR estimates give in the piece above often use BOE to inflate the EUR when natural gas earns very little for Bakken producers, in fact if they could they would flare it all at current natural gas prices in North Dakota.
The more important metric is Barrels of oil produced, and for the average 2016 Bakken Well this is about 360 kb rather than the 1 to 1.2 million claimed by some. For the average 2017 North Dakota Bakken/Three Forks well the EUR is about 390 kb. The 2018 wells look like they might be 405 kb, but it is too early to make a very good estimate. This assumes the tail of the 2018 well is no worse than 2017 wells and that the tail of the 2017 well is no worse than the average 2016 well. That assumption may prove too optimistic.
Dennis
Actually, operators do not need to incorporate your stated factors when determining the costs to drill, complete, and bring online new wells as those expenses, sans P&A, have already been accounted for.
That is why Rune Likvern’s Bakken Free Cash Flow graphic was both so dramatic as well as misleading.
Pads are built.
Lines, tanks, processing hardware, roads, power supply are already working.
Now, to bring in a rig, frac crew … do their thing so a couple hundred thousand barrels earl will be produced over the next few months … now THAT costs new money.
Hence, the classification of D&C … drilling, completing and bringing online.
As per your referenced article, Hess in 2017 has d&c of $5.8 million per.
Continental has $7.5 million for 50/60 stage wells that are producing way more than earlier wells.
BTW, if you re-read the next to last paragraph of your (one year old) referenced article, you can see it is already wrong about Bakken output.
This is simply another example of why one may want to use discretion when reading the analysis of others.
Final note …
The data used in your referenced article for well costs for Hess, Continental and Whiting came from … wait for it …
INVESTOR PRESENTATIONS!!
Coffeeguyzz,
Land cost has to be factored in as without land there is no well.
All other costs also are part of the equation. It is pretty simple if one has a facility, pad and all other equipment for 10 wells, then one tenth of the cost is assigned to each of the 10 wells on the pad.
This is how businesses analyze investments.
Including D+C costs alone is not the way to analyze the investment, plain and simple.
Well, you may not want to analyze it that way, but the companies spending half a billion/2 billion bucks this coming year to drill, complete and bring online the roughly 15,000 unconventional USA wells do it like that.
They are not gonna track down property owners and give them a check ev’ry time they fire up the compressors.
Coffee. We will never really know any of the true costs for sure.
The only data I have ever seen which gave me any feel for complete accuracy were payout statements for some wells wherein the mineral owners (unfortunately for them) went non-consent.
I suspect the operators with regard to those payout statements listed every expense, as it was to their benefit to do so.
OTOH, it does the operator more good to leave out as many expenses a possible in investor presentations.
Kind of like the fine print which discloses EUR assumes a 50 year well life. What investment banker would care about what a well makes in year 10, let alone year 50?
I suspect you are in the same manner of thinking as Nony, lower forever is best. Ultra consumer thinking, not understanding low oil prices for the world’s largest oil producing nation are now deflationary, and drag down equities (see early 2016 – late 2018). But if you live paycheck to paycheck, as most of the US does, and have no retirement plan, as most of the US does, this is probably how you should view it.
One of three things will likely happen.
1. US Shale hits the tipping point with worldwide demand still rising, and then will be profitable.
2. US Shale hits the tipping point with worldwide demand falling, and it will have never been profitable.
3. A major Middle Eastern War occurrs , which causes shale to be profitable during the time Middle Eastern supplies are disrupted.
Of course, I didn’t see shale coming like it has nor did I see operators in that space be willing to cut their own throats, so I am likely wrong on my predictions.
Shallow
The “we” in your first sentence certainly includes me, you, and I guess everybody who reads and comments on this site.
With over 40 years experience running several successful small businesses, I am well acquainted with the myriad tools, techniques, processes that our system has in place so enterprises can navigate the “revenue in, revenue out” labyrinth to their best advantage.
This is one key reason I look at the financial side with only passing interest.
Important, yes, but – again – pertinent info is simply not available to us.
Heck, even the army of analysts have been fucking up prognostications for years now.
When reality shows that they have been incorrect, tangential excuses are put forth with the atmosphere of “any day now …” being the latest face of those who simply cannot man up and acknowledge that they were wrong.
What’s the big deal here?
Everybody, back in 2008, was of the impression hydrocarbon scarcity was looming.
Excellent array of reasons to hold that stance.
Things changed.
Here we are, a decade on now, and the Permian – a region David Hughes described in his now-modified, no-longer-viewable “Drilling Deeper” passage as inconsequential – is now on the cusp of surpassing Ghawar in daily output.
Surpassing Ghawar, Shallow.
Rapier just said that and I agree.
You would be incorrect to think that I unabashedly favor a lower for longer price scenario as best.
I try to set aside any attachments I may have and coldly assess myriad factors with an eye to future probabilities.
At the moment, hydrocarbon abundance in North America seems assured looking far out into the future.
You want to know what’s coming, Shallow?
What was Rystad’s US estimate?
16 MMbpd by 2025 or something?
That is what is coming.
In your general neck of the woods, smaller, bold operators will start drilling shallow, horizontal wells and fracture like the big boys do, if the geology and economics allow.
Already happening in northwest PA, northeast OH, and south central CO.
Wouldn’t surprise me if it is actually more widespread.
North American hydrocarbon abundance will exist until the Next Big Thing – Energy-wise – comes along to replace it.
Coffeeguyzz,
Not sure about the Rystad estimate, if we assume the non tight oil US output remains at about the 2018 level of 4 Mb/d (it would likely decline) then tight oil output would be about 12 Mb/d, my scenario has tight oil output at 9.5 Mb/d in 2025 (about 7 Mb/d is Permian output).
If there is a war that impacts real crude flow, would that not limit diesel dependent LTO production? It’s clear that such production is TOTALLY dependent on Real Crude flows, but if even a slight disruption of crude flows would rein complete havoc on just about everything.
Longtimber
A war or other event(s) that disrupted oil flow would certainly impede LTO extraction, amongst other major condequences.
However, there continues to be a shift towards electrification and natgas fueled operations across the whole spectrum of upstream operations.
One small frac outfit has been hauling around a gas turbine to power their fracturing activities in the Appalachian Basin for a couple of years.
They just got bought out, are growing rapidly in size, and are planning on working in basins all across the country.
In fact, the innovations regarding natgas processing are so impactful, I would not be surprised to see natgas continue to nudge aside oil – as it is doing to coal in power generation – in a wide array of applications, including the big enchilada – transportation, in the coming years.
Coffeeguyz,
It is the proper way to analyze an investment and I am pretty sure that’s the way a financial analyst within the company would analyze it.
You take all the capital cost connected with a project and you look at your discounted net income over the life of the project to find your return on investment. This is very basic stuff.
When I controlled budgets I separated the pad civil works (road, pad, electric line conduits, potable water well, emergency pit, fencing and as needed payments to land owners) into one item. The mechanical and controls part (pad multiphase line, manifold and individual well lines, test separator, instrument air, telemetry) went into a second item. The well drilling and completion went into a third item, each clearly delineated. This allowed the work to be managed by three separate team leaders, although drilling and completion were performed by separate groups.
The pad project was assigned to a pad coordinator, a senior engineer who made sure the team leaders, the safety, security, legal, community relations, environmental protection, and other departments were able to have input, assign individuals, and get their respective roles carried out.
The pad coordinator didn’t supervise the team leaders, the role rotated to give experienced engineers an entry into project management. All team leaders would go through one year as coordinator before becoming a team leader, except for the drilling team leader, who was usually too senior to spend one year in training.
We controlled every dollar, piece of equipment, hour of labor, and coffee cup, because we had to always be ready for partner and tax authority audits. To accomplish this we had a program in each engineer’s computer, and he or she was upload the charges being incurred, and keep a diary of daily activities. This was used for the daily and weekly reports, and also by accounting when they reviewed service company invoices. The system worked very well, it allowed us to catch over billing and time sheet shenanigans, and in the end we controlled well costs and knew how much they cost.
Fernando,
Thanks for the insight. So bottom line would be that the financial guys probably looked at all costs and looking at a well as an investment would likely have assigned a proportion of the appropriate costs to each well to evaluate the return on investment (using petroleum engineer’s projections of expected future well output and costs to do the DCF analysis (DCF=discounted cash flow).
Is that roughly correct?
I am trying to learn how this works in the real world (at some simplified level, obviously it is hard to convey your years of knowledge in the oil industry in a single comment.
(A blog post would be really cool if you ever wanted to share more of what you know.)
Dennis, where I have worked the “financial personnel” has been almost non existent. The cost control was an engineering, operations and accounting department concern. As I got older I eventually supervised all technical personnel, and the costs were my focus and my boss’, because we had to deliver within the approved budgets.
One issue I have observed working as a consultant is the proliferation of “financial professionals” in the ranks who devote their time preparing PowerPoint slides and excel sheets for others in the “financial organization”. My impression is they should all but one be fired, they contribute almost nothing. The one person I would keep should focus on comparing our performance with other business units and competitors, to make sure we are moving in the right direction.
The assignment of costs (for example the total pad cost) was done according to the Accounting Procedure, a document we shared with the government tax authorities and partners (in many cases the accounting procedure has to be approved by the owners in a joint venture, unitized area, or other partnering arrangement).
Economics for a new pad or platform aren’t run on the accounting procedure costs, they usually load additional costs, for example if a platform has 30 slots but the initial project is for 11 wells, we load all the costs and assume only those 11 wells are drilled. Additional wells which may or may not be drilled are approved later with economics which exclude the sunk costs. So there are three worlds, the accounting books, the financial books used to keep the SEC happy, and the cost books we use to make decisions.
“Additional wells which may or may not be drilled are approved later with economics which exclude sunk costs”.
Exactamundo.
Hence, the sub category of drilling and completion with a seemingly low cost number in areas that are already mature in the development phase.
EQT, as an example, can now decide to drill/complete/turn inline 5 to 6 wells simultaneously from one of their already in place mega pads which will ultimately host 40 to 60 wells.
The efficiency and economy of these efforts is one reason that future production – from mature regions – will be highly influenced by product pricing.
I second Dennis’ appreciation for your contributions to this blog, Fernando.
Coffeeguyzz,
It’s been a very long time since my financial accounting and tax accounting classes ‘ but perhaps there is a difference of purpose here.
Ignoring sunk costs for an incremental financial decision is different when sunk costs have already been armortized or are currently amoritized over the useful life of an asset.
Ignoring sunk costs that can’t be amortized because the sum is greater than the value of proven reserves over its useful life for a incremental financial decision looks like wizardary to me.
Fernando,
I know you have never worked developing tight oil. Would you analyze whether to go forward with developing a set of wells, by considering full cycle costs or only drilling and completion?
It seems to me the kind of financial analysis that only considers drilling and completion cost is the kind of power point financial analysis that is a waste of salary.
For most of the tight oil pads that might have 8 to 12 wells per pad, It would seem there would be no “future slots”, each well is expected to last 15 to 30 years.
If there were a refrack it might make sense to only include D+C for analyzing whether the refrack makes sense financially.
In my earlier comment by financial guy I probably should have said accountant, basically whoever is in charge of running the numbers to make sure the investment makes sense, in your case it sounds as if the senior petroleum engineer/or project manager (not sure what your title was) basically did the financial analysis.
Basically when I look at the numbers in investor presentations, the information looks woefully incomplete you probably don’t bother reading them because you know they are crap.
John
Your last 2 paragraphs get to the heart of much of the current disputes/discussions revolving around “the value of proven reserves over the course of its useful life”.
What happens to the value, John, when WTI goes from $80 to $30 to $65 per barrel?
What happens when recovery rate of OOIP goes from 3% to 20%?
What happens when re-entries like Marathon is doing in the Bakken by running new, smaller size casing, (re) frac’ing with the latest techniques and boosting recoveries higher, in some cases, than the original profile?
Many people here use Enno’s fine site and consistently misconstue the presented data.
The Bakken November numbers have just been incorporated on shaleprofile and I offer you this exercise …
Display Marathon’s production history, then the monthly graphic for 2008/9/10/11, then the monthly graphic for 2017 and 2018.
You should notice several things, most prominently, perhaps, is the profile of the earlier wells.
Big time increase.
Also, the exceptionally high recovery (>200/300k) of the newest wells.
Looking further, one may see the abrupt changes in the monthly production as these usually indicate shut in times.
Enno’s site, AFAIK, still uses calender months versus actual online production days when presenting the profiles.
All in all, John, it would be far beyond mere financial wizardry to obfuscate these valuations as the numbers involved are, understandably, staggeringly large.
The people who – collectively – point suspicions at the unconventional hydrocarbon industry are no longer able to ignore the production numbers.
Focusing on financial vulnerabilities/shortfalls is something I – personally – will leave to those investing hundreds of billions of dollars into these efforts.
Dennis, the economic analysis for single wells or small projects is mostly an engineer’s responsibility, the analysis is reviewed by his boss. Accountants aren’t usually involved. Exxon trains young smart engineers to run economics por larger projects. A company like BP uses a guy with an MBA…but BP wasn’t well managed when I ran into them over the years, although I hear Dudley has straightened them up a bit. So it depends.
As far as I’m concerned the decision has to be made based on actual costs which are incurred from making the decision, and actual benefits ditto. Sunk costs should not be considered, but the tax benefits should be included. This may lead you to abandon acreage with a discovery if you paid a huge bonus in the Gulf of Mexico, because the tax write off can bring immediate cash flow above the PV of the development.
Hope this helps.
Fernando,
Thanks.
A point forward analysis is an odd way to do things in my mind, but I guess economists consider opportunity costs and engineers do not.
In any case, I imagine if you were considering a tight oil project for undeveloped acreage, you would look at the full cost of the project (including land costs , facilities, etc) and not simply drilling and completion costs which is typically how things appear in investor presentations.
Dennis: I worked in a basin where wells were drilled and completed in such a fashion that they had hyperbolic decline very similar to the fracked horizontals in the US. Part of my job was to recommend well locations, part was to study both short term and long term investment options, as well as optimize developments to keep production on plateau (a management strategic objective).
In those days we had to use an HP67 or an HP97, which I programmed to do some of the hyperbolic decline curves. We also had an ibm 38 programmed to store production data and project declines using automatic matches. This system also issued warning flags, such as sudden increases in water cut or gas oil ratio, fluid level anomalies, and low production rate.
As far as planning is concerned, the math doesn’t care much about the well shape, what counts is days to move and rig up, days to drill, time to ru completion equipment, completion days, and time to first oil. Also important were well reserves, expected initial rate, cleanup performance, and type of hyperbolic curve. We drilled about 50 wells a year, and had about 800 active wells. Later I worked offshore for years, in several countries, and later with multiwell pads with horizontal wells in Russia and Venezuela. So when I discuss these topics I assure you I know what I’m talking about.
Fernando,
I am sure you know what you are talking about.
My point was simply that from a business perspective, one needs to look at the overall project costs to evaluate the investment so sunk costs would never be ignored.
As a simple example, imagine a single well was drilled on a pad designed for 10 wells and all facilities were installed that were needed for the eventual 10 well project.
You seem to be implying that all the land, pad, and facility costs would be assigned to well #1, and you would do a point forward analysis on wells 2 through 10 which would only consider the drilling and completion costs for each individual well as the capex.
This may be the way engineers would do things. An economist would take the total capital cost for all 10 wells (at full cost) and consider the capex for each well to be one tenth of the total.
Bottom line, sunk costs should not be ignored in my opinion and a point forward analysis gives a very incomplete picture.
Dennis, the full cost estimate is used BEFORE any money is spent, the sunk cost tax effects are included, but the DECISION is made on a point forward basis. The full cycle appraisal done after the project is complete is useful, and can influence a decision on a similar investment. This isn’t “an engineer” talking, it’s the way it’s done by company managers if they know how to run a company. Play around with a spreadsheet which shows an investment spread over a 10 year period, and run 1. point forward economics every year, and 2. Full cycle economics, and you’ll see how it works.
Fernando,
For deciding on whether to drill a particular well, I agree point forward analysis makes sense.
I tend to think big picture. Imagine you were CEO of am oil company a d are trying to decide if starting a brand new project makes sense.
I believe the anaysis would look at the full life cycle cost when doing the DCF analysis.
Or that’s how I would do it.
Coffeeguyzz,
You may not like the idea of averaging, but it works pretty well.
Chart below compares model vs data using average well profiles convolved with well completions per month. At some point it is likely that the EUR of the average well profile will no longer increase as less productive areas see more completions after core areas are fully developed. For the North Dakota Bakken/Three Forks this is likely to occur by 2020 and perhaps in 2019. After that further drilling is likely to lead to a decrease in average new well EUR.
” … core areas fully developed. …Bakken/Three Forks … perhaps in 2019″.
THIS 2019???
Like, um, THIS year???
(Quickly clasps hand to heart, eyes roll upward, pirouettes 180, faceplants onto floor).
Coffeeguyzz,
We will see, in the Bakken average new well EUR shows very little sign of increase in 2018, at some point an optimal well design is determined and the best areas have already been developed. Further development might keep new well EUR constant for a few years, but at some point the best locations get drilled up. Despite what you may believe, all areas do not have the same productivity.
The oil companies drill the best areas first and eventually those “core areas” run out of room. This has been the case for every field ever developed and is not likely to change for tight oil plays.
Dennis,
Take a look at this recent research and note how the modeling of fracked oil is being reconsidered:
https://phys.org/news/2019-01-physics-big-gains-shale-oil.html
If this is any indication, we are on the right track with a diffusional model.
https://3c1703fe8d.site.internapcdn.net/newman/csz/news/800/2019/2-understandin.jpg
Not sure exactly how EOG is doing it in the EF, as it is a company secret, but they maintain they have been getting 30 to 50% more EUR with a huff and puff for the past three years.
We don’t know any company secrets but only apply basic physics to figure this out. How the flow of oil from a fracked well can be anything other than predominantly diffusion is beyond my understanding. When the ground is fracked, fissures go out in all directions, and that is what a random walk — in other words diffusion — describes. The oil will both go deeper in the ground as well as going to the surface.
The rapid decline of fracked oil wells also has all the indications of a diffusional process. In addition to a hyperolic profile, we used an Ornstein-Uhlenbeck diffusional model (well known to condensed-matter physicists) to model fracked well production.
Interesting Paul,
Thanks.
Wake up DENNIS bakken declines already !!!
You overestimate the shale oil.
Hi tomas,
A one month decline is not really a big deal, below is a very conservative scenario for future Bakken output, my expectation is that actual output will be higher than this scenario.
There are many who would argue that this is an underestimate. It is consistent with the economics and the USGS mean TRR estimate for the North Dakota Bakken/Three Forks.
“Unconventional hydrocarbon production in the US is now in new territory”
Clear, one called scorched earth, basically :
https://www.google.com.br/maps/place/Midland,+Texas,+%C3%89tats-Unis/@32.1635489,-102.2272391,23729m/data=!3m1!1e3!4m5!3m4!1s0x86f9613991a5d10f:0x4715ede17f061bf9!8m2!3d31.9973456!4d-102.0779146
And pumped through QE and zero interest rates, will not end well, most probably, kind of ugly, alas ..
Re Iran chart above (remember, Iran ships a lot of condensate, Ron do you know if that’s captured in the chart?) Their shared gas field with Qatar flows liquid, too.
https://www.bloomberg.com/news/articles/2018-10-17/permian-drillers-are-said-to-sell-new-lighter-crude-oil-grade
“Sales of West Texas Intermediate Light, or WTI Light, started in September with deliveries into Midland, Texas, the people said. Most of the supply for WTI Light would likely be coming from more recently drilled parts of the region, such as Loving and Culberson counties, with initial volumes estimated at around 100,000 barrels a day, they said.
The new stream is being primarily blended to produce so-called Domestic Sweet crude, WTI Midland or benchmark WTI for delivery at Cushing, Oklahoma, the people said. While lighter oil is typically higher-priced, the new grade is being sold at a discount to WTI Midland, the people said.”
[So we have a renaming underway of WTI, not just a new API degree assay, and it’s not as valuable]
“WTI Light has a gravity of 45-50 API, lighter than the typical 38-42 API of WTI Midland, the mainstay sweet benchmark.”
A move started a few years ago to redefine “condensate” up to API 50. But there are many many quotes online that specify it as 45.
And so . . . competition for Iran’s output.
[btw I have yet to find an assay with constituent yield for Permian LTO. It’s always Permian conventional.]
Re Iran chart above (remember, Iran ships a lot of condensate, Ron do you know if that’s captured in the chart?) Their shared gas field with Qatar flows liquid, too.
No, the OPEC MOMR reports crude oil only, not C+C.
From Jan 2015 to Oct 2018 (where we have EIA data) about 52% of US output was 40.1 API or higher.
About 9.8% was 50.1 API or higher, 11.8% was 45.1 to 50.0 API, and 30.7% was 40.1 to 45.0 API for the Jan 2015 to Oct 2018 period.
https://www.eia.gov/dnav/pet/pet_crd_api_adc_mbblpd_m.htm
But Iran most probably sells quite a few barrels getting out the radar of these figures
Take a look at shaleprofile with regard to 2016 and 2017 wells for Chevron and ExxonMobil in the Permian Basin.
Is the decline much lower than would be expected?
Shallow sand,
Compare all operators vs everyone except chevron and XOM, not a big difference to my eye, about 81% decline over 2 years for 2016 wells (all operators minus Chevron and XOM) and same result for all operators (used month 2 and month 25 to get 2 year decline rate).
So looks ok to me.
Thanks.
Better look at the two year cumulative.
Fernando,
Average 2 year cumulative is 183 kb for all operators (175,7 kb for all 2215 wells completed in 2016 for first 22 months, only 1811 wells have 24 months of data).
If we exclude Chevron and Exxon-Mobil (all operators except those 2) the 24 month cumulative is 186 kb (1643 wells) and the 22 month cumulative is 178 kb (2034 wells). For chevron and Exxon Mobil the 24 month cumulative is 156 kb (168 wells) and the 22 month cumulative is 149 kb(181 wells).
So the big boys are not doing so well for 2016 wells over the first 22 or 24 months compared to the overall average cumulative output.
The question we need to answer next is well cost, and whether the large companies drill wells to have a longer life. It can get complicated.
Fernando,
I don’t have information on company well costs. It is possible some companies wells will perform better than others. A full analysis with the limited information available is not possible.
I agree the analysis is complicated indeed.
Thanks for helping me understand the way this works in the real world.
For example: in some cases we have found that a well with a very long horizontal lateral can have a higher initial rate, but it barely drains the toe region (the wells can be very sensitive to pressure drops in the horizontal section, thus gets really bad when it slugs due to production fluid changes and the well drilling plan).
Fernando,
Clearly that information would only be available internally at oil companies. The only information I have is average lateral length (and sometimes not even that) and average output per well over time and number of wells completed. Information on well costs is also not very good, I only have rough averages.
I do the best I can with the limited information available.
Some international distillates inventories week/week changes
(million barrels)
Total Distillates: +10.35
Chart https://pbs.twimg.com/media/DxIp3N8X0AQZKDu.jpg
Light Distillates: +8.55
Middle Distillates: +2.76
Heavy Distillates: -0.96
Chart for light & middles https://pbs.twimg.com/media/DxIql2gX4AUR3te.jpg
USA inventories week/week changes
(million barrels)
Crude Oil: -2.7
Total Distillates: +10.1
Total (Crude + Distillates): +7.5 (shown on chart)
Natural Gas (Propane + NGPLs) -3.3 (not included in the total)
Chart https://pbs.twimg.com/media/DxIsRkOWkAANeMa.jpg
Japan’s seasonal pattern is to draw into February or March
https://pbs.twimg.com/media/DxIt1H7X4AAqDxB.jpg
This year is the largest Holiday+New Year inventory build. The date shown is the Friday at the end of the 4 week period (It’s the inventory change for the last 2 weeks of the year plus the first 2 weeks of the next year). (Crude oil + oil products without propane or NGPLs)
Bar chart: https://pbs.twimg.com/media/DxJT8-fW0AAmqdQ.jpg
Interesting. I knew that water was an issue, but I had no idea it made up 15% of the cost of a well.
https://oilprice.com/Energy/Energy-General/Low-Oil-Prices-Are-Not-The-Only-Problem-For-The-Permian.html
I’d be interested if anyone had other breakdown of costs. The well has a lot of different costs. Pads, pipelines to major pipelines, drilling expenses, “mud” for drilling, more than three miles of pipelines for many wells, and those are just in the first 40 to 45% of the cost of the well. Then, we have the demolition experts that provide the fracs (how the hell do they do that over about two miles of pipe over a mile down) the pressure pumpers, personnel, water, sand, and I am probably just showing my ignorance because I am sure there is much more. Drilling a vertical is not simple, but these horizontals are a real technical feat.
When “man” is gone, and the next generation of biped or triped takes over, I can imagine them scratching their heads over what the hell these things were for.
Available source water, the cost of that source water, how many times it can be recycled and at what cost are one of the many things that will affect the future growth of unconventional shale production in America. Steel, labor, produced water disposal costs, earthquakes, sink holes, anti-oil, climate change agendas, demand, politics and finally…money, money and money and where all that money is going to come from are all vital to America’s hydrocarbon future. My research indicates it will take another $480 billion to drill enough wells simply to fill the 4.5MM BOPD of additional pipeline capacity coming out of the Permian in the next 3 years.
To simply state the solution to these problems is higher prices, is really stupid. Or, if you are Coffee, ignoring prices, and profitability in ignorant bliss, is especially stupid.
It would be helpful to have someone comment on Peak Oil Barrel that actually knew something about the oil business and well economics. But whenever someone like that shows up for awhile they eventually get tired of the dumb ass charts, and price predictions, and getting talked down to, like Coffee talking down to Rune Likvern, Art Berman, David Hughes and Shallow Sand, and they leave. You can’t blame them, really; everyone has an agenda here and seldom does that agenda have much to do with real life. Where do people that don’t even know which end of a shovel to pick up, from Maine and California, no less, get off talking well economics to oil men?
In the Delaware Basin source water costs can now be upwards of $3 per bbl. with ponds and transport and most 18MM# fracs now use every bit of 600K BW. That is why Delaware wells cost $10MM plus. The shale oil industry is woefully behind, still lying, about its recycling, reprocessing of produced flow back water. Every time it starts to crawl forward on that issue leveraged oversupply causes the price of oil to drop and they stop spending money on water and buy it from Juan Venado for $2 per barrel. Groundwater sources are drying up and recharge in arid West Texas only takes several hundred thousand years. Its pretty stupid, but then again, EVERYTHING about the shale oil business is really pretty stupid…especially flaring associated gas to facilitate the exporting of America’s oil, all on borrowed money that cannot be paid back. Our kids will love us for that someday.
Well, hope you hang around some.
Not everybody has an agenda. Many are just interested in learning, and sharing like Energy News.
My interest mainly comes from owning mineral interests. Good, bad or ugly, it’s going to get drilled. Somehow, I feel I owe it to family members, who are no longer with me to learn more. My grandfather had the first fold down drilling rig in S Texas, and is responsible for me having mineral rights. My father was a mud engineer for Fleet fo many years, and my brother did his time as roughneck offshore.
It was your conversation with Dennis that got me interested in looking up the pending data file. I also understand from Enno’s site, you helped with that to cover Texas production. So, when you speak, I listen, first.
Mike, thanks for bringing up the flaring issue. That alone is a frustrating one.
Flared gas in North Dakota in 2018 would have supplied more than the natural gas consumed in all of North Dakota AND South Dakota in 2018.
Flared gas in New Mexico in 2018 would have supplied more than the natural gas consumed in all of New Mexico in 2018.
I know we apparently have cheap natural gas until the year 3000, but even so, this seems to be a tremendous amount of waste, most of which could have been avoided.
I am baffled why XOM would be drilling like gangbusters in the shale areas at this time. As a shareholder, I am stunned that they think it is better to produce 2 million bopd at $50 than 1.7 million bopd at $80.
Most of those guys at XOM are smarter than me, so I am sure I am missing something?
One thing I do know, XOM stock has really been crappy for quite awhile, only the dividend has saved it. I also seem to recall XOM lost in the billions some quarters in 2016 on their upstream onshore US business.
Maybe Mr. Woods can explain all of that to us dumb stripper well operators.
I would sell the stock if I had a clue what to buy, and if I did not have such a low basis in the stock. Funny how well they did prior to the shale revolution.
Split adjusted share price 1/19/1979 $3.07
Split adjusted share price 1/13/1989 $11.13
Split adjusted share price 1/15/1999 $35.53 – when oil was about $10 per barrel.
Split adjusted share price 1/9/2009 $77.57 – in the depths of the Great Recession.
Split adjusted share price 7/18/2014 $102.73 – during the end of a five year run where oil prices were at their highest all time.
Closing price 1/17/19 – $72.13 – $30 and change off the 7/18/2014 price.
Yes, we don’t care about the economics, we just are in awe of the technology and the $2 gas prices.
I hope I live long enough to see how this shale thing plays out.
I posted earlier that Exxon has 280k bpd part of the refinery in Baytown shut down for two months to upgrade it to taking oil from the Permian. They plan on using some, but they are getting the buggy in front of the horse. Another interesting take, is after they complete it, they will be able to make 10k barrels a day more of jet fuel than before. I’m not sure what they are pulling from the Permian now, but in 2016 it was 158k bpd, so they will probably be able to use most of it. If so, that would be a heck of a savings.
Shallow sand,
If you believe oil prices will remain low, sell XOM and buy the market maybe Vanguard’s Total Stock Market Index or S&P 500. If you believe oil prices may someday increase, XOM may increase in value so holding would make more sense, then sell when you think oil prices are near their peak.
Just always remember United States Leather was one of the original 12 Stocks in the Dow Jones Industrial Average (1896 to 1901), it was later bought out by Central Leather Company (also part of the Dow 20 from 1912 to 1920).
At some point it will make sense to sell XOM before it goes the way of Kodak, Sears, and Woolworth’s (all former members of the Dow Jones Industrial Average), I waited too long on GE before selling.
https://en.wikipedia.org/wiki/United_States_Leather_Company
https://en.wikipedia.org/wiki/Historical_components_of_the_Dow_Jones_Industrial_Average
Dennis.
Probably not a bad idea.
I just own 5 energy stocks, not counting whatever may be in mutual funds.
There will be a time to get out for sure, not there yet. But XOM hasn’t been doing so well after a really good run as can be seen above.
OIL (BRENT) PRICE COMMODITY
62.90 USD +1.75 (2.86%)
According to Haynes and Boone 1/7/2019 report, 167 bankruptcies in the N. American E & P space concerning $96 billion in debt since 2015 (inclusive). Of those, 29 in 2018.
http://www.haynesboone.com/publications/energy-bankruptcy-monitors-and-surveys.
Mike,
I agree, my model (assuming AEO Reference case prices) has 4.3 Mb/d higher output in the Permian Basin above Nov 2018 levels (EIA tight oil production estimates by play) of about 3 Mb/d. That will require about 69,840 new wells to be completed from Dec 2018 to Jan 2028 (about 6930 wells per year). If we assume 9.5 million as the full cost of the average well, that would be about $663.5 billion in 2017$, so you may have underestimated the cost, in nominal dollars it would be higher, about $801 billion (nominal dollars), if we assume well costs increase at the rate of inflation (assumed at 2% per year in this example).
In the AEO reference scenario, oil prices in 2028 are about $88/b in 2017$ (or $109/b in nominal dollars assuming 2% annual inflation rate). For comparison note that if we assume an average annual inflation rate of 2% (Fed target rate) then the $100/b oil price of 2013/2014 would be $131/b in 2028 in nominal terms. In other words $100/b in 2014$ is equal to $131/b in 2028 $ if the average rate of inflation was 2%/year from 2014 to 2028.
To me the AEO reference case seems quite conservative.
Tight oil production estimates by play at page below (click on XLS symbol for spreadsheet with data).
https://www.eia.gov/petroleum/data.php#crude
Chart with Permian scenario
https://drive.google.com/file/d/1oSlCRzx1XKqgCOe1KklImcNNH8F1FPFk/view?usp=sharing
Best I can come up with is about 68% of the cost of the well in the Permian based on a site’s quote of an IHS study.
Drilling, rig and fluids 1.28 million
Casing and cement .98
Pumping 1.95
Fluids (I’m sure mostly water) and flow back disposal 1.43
Proppants (sand) 1.28
Total 6.92
Still interested in more detail. The above amount for fluids sounds low, based on what Mike posted. Which could run the cost of a well over 11 million. And, I have no idea what the other 32% was for. Other than they did not discuss roads, site clearing and grading, pads, pipelines to feeders, site equipment and storage, and whatever etc, is. Also, not discussed is the guys who blow holes in the pipes, which can’t be cheap.
GuyM,
Wouldn’t there be some cost for land? Also Plugging and Abandoning?
I am sure Shallow Sand and Mike would have better ideas. Also if it is an older IHS study (from 2016), then water costs may have risen (and costs in general).
Were you using this?
https://www.eia.gov/analysis/studies/drilling/pdf/upstream.pdf
That study gives 6.6 to 7.8 MM dollar well cost in 2014 (today laterals are longer and well costs are likely higher than in 2014).
In the Wolfcamp in 2014 (much of most productive drilling is here) costs are 7 to 8.5 MM in Delaware and 5.5 to 8.6 MM dollars in Midland and again today costs are likely higher. Lease acquisition costs in 2014 were estimated at 1 to 1.3 million per well, but note that as lateral length increases and acres per well increases this cost also increases.
Based on this information and increasing average lateral lengths in the Permian basin
Mike Shellman’s average estimate of about 9.5 to 10 million per well (more in Delaware and a little less in Midland) seems spot on, and clearly he is there and has probably worked on some of these wells (or at minimum knows others who have.)
I assume an average cost of $9.5 million per well in the Permian basin based on his comments.
Mike.
I assume you agree that if every payout statement for every shale well drilled since 2014 were released, the debate would be put to rest?
What are the valid reasons for a public company to keep this financial information private?
I would agree, yes. And could be prepared to prove it. Easily. I could do so with crayons.
The American shale oil and shale gas industry is in desperate need of money, low interest rates, lax regulations, public confidence, more money, liberal loan refinancing over the next 18 months and more money. It wants American’s to believe it is doing good things and all that wasted gas, wasted water, wasted exports of our last oil resources and…debt is important and a necessary sacrifice to the greater good. The shale phenomena and the way it is financed is a great redistribution of wealth in our country; cheap gasoline and fuel oil is a form of fiscal stimulus. If you are in the middle of this redistribution of wealth, life is good and there is a lot of money to be made. So the lying will continue.
Stay warm this weekend up there, man; wow, its gonna be cold !!
10 F isn’t too bad, especially as it is expected to warm up again pretty quickly.
Has been a mild winter here, unlike last year when it got so cold the day after Christmas we had to shut in some low volume wells, and were not able to return to production until a couple days after Valentine’s Day. Had not been that cold since winter of 2013-14, which was very cold. I recall early March, 2014 having a day that began -8 F. But, at the end of the month I was watching a tennis match in short sleeves!
Which is more volatile, Midwest weather or oil prices!
No, it was a more recent one from a company’s site that used current numbers, they said, from a IHS report. But, Fernado’s reply above gives me a hint of what was left out. I really enjoy this site when it gets posts from the likes of Shallow Sand, Mike, Fernando, George, S Louisiana and others who are real live oil people.
Guy, in the shale industry everyone lies about everything. They lie to themselves in morning meetings, to the public in investor presentations and to their shareholders. A recent example of this is the EUR exaggerations reported by Brad Olson at the WSJ, the ramifications of which to reserve estimates in our nation are stunning. As is this: https://www.linkedin.com/pulse/wall-street-journal-validates-predictions-made-scott-lapierre/ A lot of indemnity disclaimers on press releases and investor presentations will, in small print, admit they are lying; Parsley is a good example. That was its “defense” against the WSJ allegations. If one is relying on information about the role shale oil will play in our hydrocarbon future, from the shale industry itself, you are going to have a very distorted picture of the real world.
I am privy to AFEs from every shale oil basin in the country and one of the biggest whoppers the shale industry uses is well costs, that and the stupid metric of breakeven prices. Well costs are much higher than always stated and the shale industry uses all kinds of neat tricks to move stuff around and hide this and that. Not long ago I received AFE’s in the Delaware from a major integrated company whereby est. costs were over $11.5MM per well, with no acreage costs included. As to the really stupid comments above about “sunk” costs that should not be used in the economic analysis, well all that “sinking” put companies like Continental $6B in debt, or Devon $8.5B in debt and ignoring that is sort of, well… it reminds me of socialists who want free this and that but don’t have a clue how to pay for it. New, good wells must pay for old bad wells in any companies asset inventory, even mine and Shallows.’ That is not happening in the shale oil revolution.
By SEC filings I believe less than 20% of the American shale industry’s $20B of potential P&A&D liability is actually set aside.
The real oil and natural gas industry is NOT like the shale industry, I assure you, sir. I am proud of MY industry.
Your smart, you have a good handle on it. Stay the course. Listen to Shallow. I can’t hang around here. Lots of the stuff being said here drives me nuts; the ranting yesterday I simply had to address. To somebody actually laboring in the oil and natural gas industry, exposed to price volatility, out of debt and still providing jobs to good men and women, it was goddamn insulting. I think the asshole told me, or people like me, to “man-up” and admit we’re wrong. I’ll do that when the shale industry pays back its half trillion dollars of upstream and midstream debt and can do what it does without credit cards. I can’t stand people who think they know everything because they read it on the internet.
Thank you, sir. You’ll appreciate this, I know, as will Shallow: https://www.oilystuffblog.com/single-post/2019/01/15/Night-Shift
Mike,
I think coffeeguyzz was talking about me and others that have made predictions in the past that were wrong, rather than things that you have been saying.
I apologize for what ever I have said that has offended you, or for posting too many charts. I find visuals easier than just words, but guess many find that annoying so I’ll use links.
I am with GuyM and Shallow Sand and all who have not already said that any comments you make here enlighten all of us.
Just watched the video, awesome, thank you.
Dennis, the oil business is a complicated assortment of very complex matters, all of them very ‘fluid,’ so to speak; all changing every minute of every day all around the world. There are a lot of headwinds facing the US shale phenomena not solvable by greater productivity, many not even solvable by throwing good money after bad. You did not deserve than man-up comment either.
Thank you.
Mike
Mike,
The Scott Lapierre article is interesting, the tails of the Permian wells (2011-2014 first flow) seem to be showing roughly 15 to 20% terminal decline, significantly different from the Bakken which is showing about 10 to 12% terminal (exponential decline rates).
Could be differences in the rock or perhaps the amount of dissolved gas, we have slightly older wells from 2008 and 2009 to look at for the Bakken, but there seem to be significant differences between the well behavior.
I should probably try the model with 15% terminal decline rather than the 10% I have used based on the Bakken data.
Doing that (changing terminal decline to 15% from 10%) reduces ERR for my model from 61 to 54 Gb (before I have examined economics closely, so far I have only adjusted well profiles, leaving everything else as is.)
When I include all the economics the ERR drops to 53 Gb and 171,000 total wells drilled, so 152k wells after Dec 2018, at 9.5 million per well (2017$), that is 1.444 trillion 2017$. About 50 Gb gets produced after Dec 2018, maybe 48 Gb of this is oil from wells with first flow after Dec 2018.
So the net back on the barrels produced would need to be $30/b on average in 2017$ for net return to be zero.
Definitely does not work at $50/b (in 2017$). I doubt oil prices remain at $50/b, but I am usually wrong on oil prices.
The WSJ article is very technical. I sense something . . . apocalyptic about it. Can one of you more astute commenters put it in plain English?
I submit the following paragraph as one to make a person stop chewing and sit up & listen:
“It is clear that industry tools are failing to reliably forecast long-term oil production from shale reservoirs. As the authors of the WSJ pointed out, these original projections were used to entice investors to pour billions of dollars in to shale developments. Let’s not also forget that these same, questionable, projections were also used to convince the US Congress to lift the longstanding, strategic oil export ban. For readers of my previous articles and the WSJ article, it should be clear by now that models incorporating oil expansion as the primary reservoir drive mechanism offer marked advantages in forecasting production from shale oil reservoirs.”
Michael B,
One way to think of it is that investor presentations often claim the cumulative production from and average well will be about 1200 kb over the 25 year life of the well. In reality the average well produces about 400 kb in the best tight oil plays (Bakken and Permian Basin).
Doing simple math suggests for a given number of wells, output will be about 3 times less than claimed by many oil companies.
Seein g that they tend to exaggerate the extent of their potential productivity, it may also be possible that there are 3 times fewer wells that are economically viable, which would then cut potential oil to one ninth of that claimed. This second step is mere speculation on my part.
The number of completed wells will depend on output, capital and operating costs and the price of oil, many assumptions needed to estimate future output, many of which will be incorrect.
As Mike said it is complex, much more complex in reality than my simplified models. As is often the case Mike is correct, the only one more correct would be his wife. 🙂
Thanks for helping make sense of this.
We don’t use demolition experts, shaped charges are used to make holes in the pipe and into the rock to create a flow channel for the fracture fluids. The shaped charges go in the hole inside a piece of pipe we call a gun. The pipe has the charges aiming perpendicular to the pipe, parallel to its radius. They explode simultaneously because they are interconnected by an explosive chord. There are YouTube videos you can find showing how all of this works, and what to do when loaded guns are run in the hole but then fail to detonate as required.
Ok, not demolition experts, but the job is probably not handed out to newbies. Gotta be some training. Thanks, Fernando.
I was taught to put a yellow helmet on new personnel to make sure we knew who couldn’t be trusted and had to be kept under close supervision. The service companies providing the perforating gun services never sent anybody they felt required a yellow helmet because our contracts specified the minimum experience level we had to have in some critical jobs, like those handling explosives, toolpushers, drillers, wireline unit operator, mud engineer, crane operators etc.
The skill set of many in these jobs is not easily recognized by many observers.
All the moreso as constant improvisimgs, making on the fly decisions, working with whatever is available material/resources often far off the beaten path all put a premium on those able to get ‘er done.
On one of the rigs I worked, a converted drillship, delays, costs, tensions were rapidly rising due to a bunch of unforeseen obstacles.
The experienced crane operator refused to continue risky activity, quit on the spot, and was on the helicopter to the beach next day.
Pressed into service, the young, inexperienced replacement tipped a jury rigged pallet of 4 barrels of hydraulic fluid and killed the tagline holding roustabout a few feet away from me.
So much skill and expertise required up and down the line in this industry that it is amazing what has taken place these past 150 years of hydrocarbon development.
Yes, I have worked in dangerous heavy industry and sometimes the man next to me was the most dangerous part of the operation. One stupid act can quickly get people injured or killed.
Also management that ignores warnings about potentially dangerous equipment does cause major disasters.
Schlumberger Q4 report is out.
Revenue in North America was down 12% in Q4 compared to Q3. Revenue in international markets was near unchanged. Fracking (OneStim) revenue dropped 25%, as Schlumberger decided to warm stack a number of their fleets in the latter part of the quarter.
Haliburton Q4 report coming next week to comfirm the picture of just how much of a decline there is in completion activity overall in North America at the moment.
Low Oil Prices Are Not The Only Problem For The Permian
While low oil prices are beginning to slow the growth of U.S. shale, in the years ahead oil and gas drilling could be curtailed by a different problem: a shortage of water.
Water is a crucial ingredient in the fracking process, and drillers use copious volumes of it. The problem for the U.S. oil industry is that so much of the output growth expected over the next half-decade or so depends very heavily on the Permian basin, where water is increasingly scarce.
Water already accounts for about 15 percent of the cost of a shale well, according to analysts at Morgan Stanley. “In the Permian, total spending on water is expected to double over the next 5 years, to $22B, with E&Ps on avg using 50 barrels (bbls) of water for each lateral foot completed,” the investment bank wrote in a new report. “Assuming 10k lateral feet per well, this implies that the ~5,500 existing Permian well permits will require ~2.75 billion bbls of water to complete.”
That’s a lot of water in an area that doesn’t have a lot of it. “Given the sizeable water need, we believe drought and water scarcity present long-term risks to shale economics, particularly in the Permian, a core area of growth in a drought-prone region,” Morgan Stanley warned.
It’s worth pausing and noting that the warning is not coming from an environmental group, or even a local community organization opposed to a drilling presence. It’s coming from a major Wall Street investment bank, which says that drilling economics in the world’s hottest shale basin could be upended because of water scarcity.
It’s a rather ironic development. Greenhouse gas emissions from oil and gas drilling are fueling climate change, which in turn could make the most desirable oil and gas play increasingly costly due to growing water problems.
Morgan Stanley goes on to provide further detail into the scale of the problem. Morgan Stanley overlaid water scarcity data from the World Resources Institute with Permian well locations, finding that “53% of Permian wells being drilled today are located in areas with high water risk,” the investment bank concluded. “While operators are comfortable with water availability at the moment, there are precedents (most recently in 2011/2012 in Oklahoma) where severe drought conditions materially affected completion performance.”
There is also another separate water problem facing shale drillers. “Produced water” – water that comes out of a well when drilled – must be handled somehow. The volume of produced water that comes out of a shale well can exceed that of oil by a ratio of 10 to 1. The ratio also increases over time as the oil from individual wells begins to deplete, so the cost-per-barrel for water disposal also rises.
There is more to this “Oil Price.com” article than I quote here.
Yeah, that was our discussion we were having above on the same article I posted yesterday. I was trying to get more detailed costs other than water.
The 10 to 1 ratio looks like baloney. Evidently the answer lies in the wonderful world of chemistry. We will have to learn to clean up produced water and use it as carrier fluid.
What morgan stanley report are they referencing ? Shouldn’t be a link for publication purposes ?
Condensate factoids:
Lease vs Plant condensate ratio remains about 82%.
Condensate shipped to Alberta for use as diluent is priced $10 above WTI.
Condensate middle distillate yield varies a great deal by region:
Iran condensate diesel+kerosene (jet fuel) proportionate distillate yield sums to 45% (!!!)
Algerian condensate equivalent yield — 16%
Thai condensate equiv 27%
Australia Northwest condensate 26.1%
WTI (crude, not a condensate) sums to 38.3%. (This is a dated assay, probably lower now and note lower than the excellent Iran/Qatari condensate yield — yes, a US crude has less middle distillate than a Middle East condensate )
(The Iran yield is suspicious. Qatar is lower (though not by too very much) Both superior to Bakken “crude”.)
It depends on the condensate stabilization process used. If you take condensate off the low pressure separator, feed it to a stabilizer with a hot bottom temperature, it drives the light ends overhead. These can be fed to a gas fractionation plant. The bottoms will be whatever you design for. If you run the bottoms hot and keep the top of the tower reflux a bit warm the bottoms will have lower API. The Iranian condensate is probably processed to have the required vapor pressure to be stored safely long term in Persian Gulf tanks where temperature can exceed 50 C.
They ship it fast. Maybe no need to store it. China’s total petroleum product consumption is now 30% diesel, and they buy Iran’s condensate. That distillate yield is why.
Been searching to find info on China’s refineries. All you can see online is a claim of about 13 mbpd capacity, but the details on design and what handles condensate vs crude . . . nada.
Watcher, oil storage tank safety policy doesn’t usually say “if the product will be shipped fast the vapor pressure may be higher than specified, because the vapors won’t have time to escape from the tank, or if the condensate is stored in a vessel, because the vessel will arrive in China before it explodes”.
Baker Hughes Weekly U.S. Rig Count
Oil: -21 at 852
Nat Gas: -4 at 198
Oklahoma -10
Texas -11
Gulf Of Mexico -2
BH –> http://phx.corporate-ir.net/phoenix.zhtml?c=79687&p=irol-reportsother
This Is How Much Each OPEC+ Member Needs To Cut
This Is How Much Each OPEC+ Member Needs To Cut
OPEC published on Friday the long-awaited list of oil production quotas for each country in the OPEC+ deal, as it seeks to shore up market confidence that the cartel and allies will do whatever it takes to rebalance the market.
OPEC and its non-OPEC partners led by Russia decided in early December to start a new round of cuts, aiming to lift the price of oil that had started to plummet in October on fears of building oversupply and uncertain demand growth going forward. The OPEC+ deal will be removing a combined 1.2 million bpd off the market in the first half of 2019. Initial reports just after the meeting in Vienna in early December suggested that OPEC and its allies would not be unveiling who is cutting how much under the new deal.
But two weeks later, Reuters quoted OPEC’s Secretary General Mohammad Barkindo as saying in a letter:
“In the interests of openness and transparency, and to support market sentiment and confidence, it is vital to make these production adjustments publicly available.”
Finally, OPEC published today the list of the countries which will be cutting production, leaving out OPEC members Iran, Libya, and Venezuela who were granted exemptions from the cuts that began on January 1.
The chart of who is expected to cut and by how much is posted up top in the main body of the post.
I have also posted, up top, the production data for the 11 OPEC members who are participating in the cut. The totals represent only those 11 OPEC members. Iran, Libya and Venezuela are exempt from quotas.
Whenever I see the latest Iraq production, I go back to 2011/2012 and revisit this:
https://www.theaustralian.com.au/archive/business/iraq-halves-oil-output-as-reality-replaces-ambition/news-story/9d7e325b5bb16409fb4e5e9864379ba7
“IRAQ is preparing to halve its official production target, forcing oil companies including BP and Shell to renegotiate their contracts.
The Times has learnt that the country’s Oil Ministry, with backing from the Prime Minister Nouri al-Maliki, will set a new target to produce between 6.5 million and seven million barrels per day by 2017, down from original plans to pump 12m barrels, according to industry insiders .”
[12 million bpd in 2017!!!]
“Baghdad believes that it would not be in its interests to try to achieve the 12m target by 2017 because boosting global supply would depress prices.”
[Yeah, we best not do that because of the upset it would cause]
FYI in that time frame a US Special Inspector announced that the US was a more reasonable evaluator of things and the likely number for the 2017 time frame was 9 mbpd.
https://www.chron.com/business/energy/amp/Exxon-Mobil-finishes-one-phase-of-massive-13259589.php
These things keep slipping by me (so what’s new).
With the Baytown upgrade, that’s a lot of Texas oil that can be used in the US, or in exported finished products.
It might be a pretty interesting story to follow up on, as far as overall, how much we are increasingly able to use US tight oil in the US.
From the posts on Exxon’s refinery upgrades, they are looking at long term, Shallow. While current cash flow and income may look weak, they look poised to profit in the future. That has to be all, and more of what XTO produces in the Permian and the Eagle Ford. No wonder they are drilling like hell in both. The wells do not have to be profitable on their own. Integration has its benefits. They are probably interested in gobbling up more weak companies.
Also,
https://www.chron.com/business/energy/amp/Chevron-eyes-Houston-refinery-13295888.php
https://www.houstonchronicle.com/business/texas-inc/amp/Permian-Basin-goes-corporate-13523124.php
I wouldn’t be surprised if we see a shift of use of heavier oils by refineries to the Midwest, and away from the Gulf. It won’t change the pipeline contraints, but it may allow for better disposition once the pipelines are finished. Obviously, it would not affect Motiva, and there is still plenty of heavy oil migrating through Cushing, the Louisiana refineries have different sources, but the rest would be better if the adapted to LTO.
I believe, I had fallen prey to another imagined concept that the media is prone to, that is “refineries will not adapt to LTO over heavy oils”.
https://www.houstonchronicle.com/business/energy/amp/Refiners-investing-to-capitalize-on-flood-of-13408890.php
I keep finding more, that’s not all. We will not be oil independent, but we could conceivably get it to mostly from Canada and closer than the Middle East. Which means that North America could be largely oil independent. For awhile.
As soon as Cdn producers obtain extra pipeline capacity to the coast, hopefully both coasts, the current locked in price will rise to be sold at world prices. There are some political roadblocks for sure delaying construction, but it is just a question of time, imho.
Plus, it might take decades to smoothe over the ill will felt here about the current tariff climate. As it stand now the US will not be a first choice destination unless the money is doing all the talking. I wouldn’t bank on Cdn supplies for NA energy independence. Everything sold will be sold to a World priced market. Everything.
Yeah, I guess it would be damn strange if they weren’t trying to get the best deal. Nobody gives it away to the cheapest bidder down here, either. And I doubt we ever had been given any preference, other than the value received. Bidness is bidness.
Guym,
As I understand it the Baytown upgrade will include a facility that will refine condensate on a relatively small scale, and in addition a separate full-scale refinery for condensate will be built.
European inventories have been slowly declining for 8 months into November. Preliminary data for December shows a small build (not on the chart).
A chart of EU & USA Inventories (Crude Oil + Distillates). It’s monthly but with 2 points of weekly data for the USA
December is week ending Dec 28th
January is week ending Jan 11th
Chart https://pbs.twimg.com/media/DxR-mfuXgAUI0Jb.jpg
Europe middle distillates
https://pbs.twimg.com/media/DxR-9RbWoAAwrgo.jpg
Europe light distillates
https://pbs.twimg.com/media/DxR-_U2WoAEFSrU.jpg
Gee, that’s a terrible glut. Good thing we are going to have a decrease in supply for awhile?
For long time I have read the post here related to shale oil in US and also read news related to this issue. I also follow with the EIA production forcast that stated shale oil will grow with about 1.3 mbpd. After working within oil and gaz for many years and study some geology it is very interesting to read what shlumberger and oil pioneers like Mark Papa that in line with Shlumberger CEO see huge challanges with profit related to child wells, frack hits. I have read it takes 2-3 months to demolished a drilling rigg , tjink that is why we now see a reduction of 21 oil riggs acc. to Baker huges oil rig count. I used a very simple suggestion where I say without any new riggs in 2018 the production wiuld be flat even longer latherals cant match the decline rate of so many wells. Than I took the increase of 2.21 mbpd in 2018 and devide in 105 riggs that was the increase from jan 2018 to jan 2019. That gives at least a decrease at 17 538 barrels pr. rig. 25 riggs means than 438 492 bpd related to decrease in production I believe this might be 500 000 or above I believe instead of a increase of 1.3 mbpd as EIApredict in 2019 this now shows we can exspect a reduction of 1.5-2.0 mbpd if oil price WTI in range 50 -55 USD pr. barrel.
Thanks, Freddy. I thought I was the pessimist here! If we drop to next to nothing on completions in 2019, I have really no idea on how far it would drop, and no one else does, either, really. But, it would drop, substantially. $52-54 for WTI is a damn stupid price, and it can’t stay there if we want oil. End of story.
But, completions dropping to next to nothing at $52-54 is probably not in the cards. Some companies like XTO get their profits mainly from refining, now. And others, like EOG have outlets that get not too far from Brent price.
THE COMING ENRON EVENT IN THE U.S. SHALE OIL INDUSTRY
I believe one of the largest misunderstood implications of the U.S. Shale Oil Industry is that company(s) are being totally truthful in their reporting of data… whether it is production, financial or EUR data.
While Art Berman has pointed out that two-thirds of the U.S. Shale Companies were still losing money (negative free cash flow in Q3 2018), when the oil price was at its highest at $67, this assumes that the investor relations departments are being truthful in regards to their reporting of data.
I can assure you that there is going to be one HELL OF A MESS in North Dakota when the reality of the situation there comes to light. Let’s just say… HEADS ARE GOING TO ROLL.
Surprisingly, energy analysts that should know better don’t realize we have another Bernie Madoff or Enron type of event taking place in the U.S. Shale Oil Industry. Which is ironic because virtually no one in the Securities Industry knew Bernie Madoff had a Ponzi Scheme going on for years.
You know what they say, the BLIND lead the BLIND.
If you are that naive to the accounting fraud taking place in the U.S. Shale Patch, then at least you can get it through your thick skull that 80-85% of U.S. Shale operators are now losing money at $54 oil.
When the Dow Jones and S&P 500 start their decline once the market’s peak again (stocks seriously overbought on a short-term basis) sometime next week, watch as the oil price continues lower in Q1 & Q2.
The oil price has been trending with the markets, especially over the past few months. When the Dow Jones suffered the worst Christmas Eve in the Index’s history, the oil price dropped $3.5 the very same day. We are just beginning to see low oil prices
This should do wonders for the Shale Investors with dollar signs in their eyes and sugar plums dancing in their heads.
Steve
I am also wondering what a Company that average have 3 billion USD in depth will do when investors stop believe in dreams. I believe than they will pump as much as possible from wells that are in core Area or can be profittable to frack since they already are drilled, than it might more or less stop unthil WTI reach 70 -75 USD as there might be some limited Areas that could be profittable with that price. When interest, labour cost, cost of equipment, rental of ground increase together with less productive Areas this will be bad..
Freddy,
Good point about the ability to service or pay back debt when the U.S. Shale Ponzi finally comes to an end. However, there have been two types of methods in funding the Shale Oil Ponzi:
1) Increasing long-term debt while rotating obligations being due by issuing new senior notes (to pay back older ones) that mature 10-20 years from now. Classic Ponzi Scheme
2) By issuing more stock to the poor unworthy investing slobs who don’t have the ability to properly read companies 10-Qs or 10-Ks. Thus, raising money by share dilution is another way to achieve Ponzi Finance
Here are ideal candidates of each:
Continental Resources: a perfect example of the Poster child of what’s horribly wrong with Shale Oil Production in North Dakota as it’s long term debt has ballooned from $300 million to over $6 billion since it started producing shale. At some point, Continental will no longer be able to service its debt, and this will lead to the realization that the majority of its debt will never be repaid.
Pioneer Resources: an excellent illustration of a company that uses share dilution, due to its high stock price, to fund its Ponzi Finance. Pioneer has suffered seven consecutive years of negative free cash flow, hence the motivation to issue $5+ billion in stock since 2011.
So, whether a company is hoodwinking investors via ISSUING MORE DEBT or COMPANY STOCK, they are both examples of Ponzi Finance that will end badly.
steve
Steve, I believe this is how they funding shale business and other Buisiness around the world But in my mind there is normal a value of a Company where the basic might be proven oil resourses within the Area the Company rent or own. Normaly this is oil that will be profittable with a certain possibility to produce in a period of time ,lets say 20 year ahead with a resonable market price of oil. The bank might than allow the Company to borrow up to lets say 75% of this asset. The huge question is how this value of the resourses in the ground have been estimated. Than acc. to Rystad Energy the oil production each well seems to be at least 10% over estimated , they used decline rates for vertical wells to estimate income from horizontal wells that was some persent higher. It might be they are based their estimate at sweet spot data, but this will give much higher value than you might get up of profitable oil in 20 years. If the value goes down they need to ask the stock investors to add more capital or the bank will force them to sell that might give huge losses as thenew Company will never pay more than itis wurth. Often we see the bank choose to continue to fund the buisiness because they are not able to face the fact , take the losses. Hoping for some miracle. On topp off all the President want cheap oil…
Jesus christ. People running on fire.
https://www.commondreams.org/news/2019/01/19/least-66-killed-pipeline-explosion-rocks-central-mexico
Not the first time this has happened and it won’t be the last. The move to delivering by tankers is not without problems, there are not enough to guarantee deliveries and in many places there are fuel stations that are empty, a map of Tepic shows about 50%. We have also had 2 tankers overturn, near here, with the loss of several 10s of thousand of litres of fuel.
Over the years I have seen frequent news of raids on warehouses filled with tanks of hydrocarbons, many in a very unsafe condition, barrels and bottles from 20 l up to caged tanks of 1,000 l.
NAOM
My fav quote from Mr Art Berman at the 36:35 mark- link to his latest interview with CM at PP
https://youtu.be/zkzQRiiN1Jw?t=2195
“I think we’re kinda done lol” ~ AB
Also (paraphrasing): “What people don’t realize is that some of these companies are not in the business of making money, they’re in the business of being given money” (or something like that).
The whole video is a kick–and enlightening.
Yeah, that was interesting. For, the benefit of people who don’t have time to listen. It was basically a question of what are we going to do about oil when the shale gives out, as I remember, it’s been a few days. A lot was covered in that video, it’s worth taking the time to listen. Major points were the EUR of shale is not as advertised. A lot of misrepresentation by shale companies by cherry picking and over estimating, and non-geologists in the EIA doing predictions.
Since shale production began, the shale companies have been their own worst enemies. Without shale, we would already be in a worse situation. With it, we are in a situation nobody has a good picture of, because we are relying on shale companies and the EIA for what will happen. Which won’t happen, as they say. Then as Porky Pig says, “da, da ,dats all, Folks”.
I found it interesting when Berman explained how the way estimates are arrived at–which would look fraudulent to some of us–are actually quite legal, and the governmental entities that bless these methods basically do so out of the hope of increasing their own tax revenues.
So, along with the cherry-picking you mention, we learn that such things as boe (barrels of oil equivalent) includes associated natural gas–which is flared. But, hey, that makes it all worth X dollars, and that’s a good thing for us all!
As my (stroked-plagued) husband said, when we watched the video together, “It all works on FM” (fucking magic).
Yeah, the main point about the governments (states) looking the other way, was on flaring. They get more per barrel, than per mcf.
And, nobody asks the mineral right owner, “hey, it’s it ok if we waste your gas?”. The states are supposed to look out for the mineral right owners, but that’s a joke, now. At least, they should pay them Henry Hub prices for that gas that is flared. It sure as hell is not the mineral rights owner who caused that.
GuyM,
The operators don’t get the Henry Hub price for Natural gas, if they are forced to produce the gas and they lose money on every cubic foot they produce, that money should be deducted from the price of a barrel of oil. It would mean less money for the land owner. The gas is being flared because there is not enough pipe to move it. Now they could stop producing both the gas and oil to stop the flaring, but a lot of royalties would decrease in that case.
And they should cease. I would rather get more money later. There is only X amount of oil and gas. After that, its zero. The lease usually says it should be developed as any other prudent operator would do. Mine was not affected that way, but if I owned in the Permian, I could be totally pissed. All the gas for years flared, and oil production when there is inadequate pipelines for a year, is NOT prudent.
I believe oil guys have said shutting in the well does damage but perhaps not in all cases.
Further development could be curtailed, that’s up to regulators at state level.
North Dakota completions from the Director’s Cut – I was just having a quick look, if anyone is interested. The preliminary month, November, will be revised.
Yes, that would certainly correspond with a drop in production.
Thanks for very interesting chart, think a new well after it is fracked and compleated will have 1-2 months with increased oroduction before it starts to decline. Think 50% decline or more after 12 months. Might be free fall in shale , while IEA predict 1.1 mbpd increased production in 2019. I strongly believe US in future will be a swing producer with limited impact. Oil price might varies 55- 100 USD WTI . US will in future import when shale start to drop.
For those that need some good humor:
https://www.eia.gov/outlooks/steo/report/us_oil.php
The production estimates for shale, and their explanations amused me. I’m sure George and So Louisiana will get a kick out of the GOM estimates. Actually, if you raised WTI to $70 tomorrow, you get get there.
GuyM, thanks for the heads-up on the EIA outlook.
Below is the excerpt regarding the GOM.
“EIA expects production from the Federal Gulf of Mexico to average 1.9 million b/d in 2019 and 2.2 million b/d in 2020, up from an average of 1.7 million b/d in 2018. In 2018, 11 new projects came online contributing to record high production in the region. In 2019, 6 more projects are expected to come online, and 12 more projects are expected to start up in 2020.”
A lot of the recent projects that have come on-line have been, and continue to be, small 1-2 well tie-backs. With the 5-7 of those that came online in 2018, they added maybe 100 kbopd. The biggest recent projects have been Stampede, and recently, Big Foot. Stampede has been on about a year now. Most of the Phase 1 wells are producing, and it’s making ~30 kbopd or so (less than the 50-60 kbopd expected). Recently Big Foot came on line with 1 well, and 1 or 2 additional wells are planned for 2019. Nameplate is around 50 kbopd, and it may get to that level in 2020.
The next big project to come online is Shell’s Appomattox in 2019. Nameplate for that facility is 170 kbopd or so, and I think Shell plans for at least one or two tiebacks. I guess it could get up to 100 kbopd in 2020.
LLOG plans to bring on 2 wells at Buckskin in 2019 – maybe 25-30 kbopd there.
I haven’t heard anything regarding BP’s additional plans for Thunderhorse after they announced the 1 BBO of new OOIP they discovered – don’t know if they’ll will need new drill centers, or if they can reach it from existing drill centers. That will be one key factor controlling how quickly they can start to bring that new oil online.
While there is a lot of good stuff happening in the GOM as far as field development (now exploration is another story), I’m not as bullish on the future production levels as the EIA. Right now I’d put both 2019 and 2020 in the 1.7-1.8 mmbopd range.
Curious to see George Kaplan’s thoughts. He always does good bottoms-up, field-by-field analyses.
Thunderhorse I think has two wells planned this year – not part of the new find. There’s Hopkins, Red Zinger and Claiborne delayed from last year (small wells I think) and North Hadrian and Stonefly plus some new small tie backs (I think one is called Headless Nick for BP/LLOG – two different discoveries). Last year there were no major unplanned outages, even the hurricane impacts were fairly small, this year might not be so lucky with a mature basin. At some point surely Jack and Shenzi have to go off-line for major turnarounds – that would knock 20 kbpd of an annual average. A lot of the fields started up in 2014/2015 reached plateau I think – though I thought that last year and got it wrong, but the number of wells classed as inactive drilling, i.e. expected to be completed soon, has dropped by at least 50%, and once those listed above are completed will be down to low single figures (plus new drills of course) so I can’t see much else. Appomatox doesn’t look like it will have a lot of predrilled wells and needs water injection I think so could take 4 or 5 years to ramp up, though there has been talk of taking it to 240 kbpd. Overall at 1.7 kbpd there looks to be about 20 kbpd per month decline that has to be overcome before there’s growth. I think as recently as 2015 EIA were predicting 2.2 kbpd about now – didn’t happen. Gas is another issue and is likely to go back to general decline (a big chunk of production stopped last year when Hadrian South was exhausted).
p.s. some heavy oil at Great White I think but I’ve forgotten the field name. Great White has subsea separation – I don’t know if the new low API stuff would go through it , but if so might be interesting to see how it works out. There might be a bit at Stones as they’ve opened a new lease there (though not shown on BOEM list yet) but they might be at nameplate limit (actually a general issue for a few fields ‘growth’ where tie-backs are added but never mentioned by EIA) and I haven’t seen anything about new drilling there.
GuyM,
The EIA’s STEO predicts a 340 kb/d increase in USL48 (ex GOM) output in 2019 (Dec 2018 to Dec 2019). As I have said before, seems pretty reasonable, most of this is likely to be tight oil output increases and this is compared to a 1510 kb/d increase in 2018 (so a decrease in the rate of increase by a factor of 4.44.) GOM probably too optimistic.
Did you read the link???? They expect CRUDE (by their definition C&C) oil production to average 12.1 million in 2019. I mean it is the EIA, I got it off their site and it says STEO. To average 12.1, it has to get substantially larger than 12.1 by the end of 2019. What you are saying, and what they are saying in the link causes a lot of cognitive dissonance in my mind. But, that could be just me?
Permian is to AVERAGE .6 million bpd of the increase (lowered from 1, because of pipeline problems) while other shales and the Gulf will make up the other .5 of the 1.1 million bpd. Actually, I calculate 1.2, as that is what you get when you subtract 10.9 from 12.1, but that’s ok, they are just economists?
And that is with an average WTI price at $53 a barrel? Which, I guess is ok, because the press and the companies say they can be profitable at $40 a barrel?
It may stay at $53 for awhile with most believing this garbage. The companies blew away their foot with a shotgun, and now EIA is going to give them a matching foot?
GuyM,
I got the statistics from the link at sidebar. The increase from Dec 2018 to Dec 2019 is 340 kb/d for lower 48 excuding Gulf of Mexico.
We tend to focus more on tight oil. Whatever SouthLaGeo and George think for GOM would probably be a better guess than EIA. For Alaska maybe Doug knows.
Try
https://www.eia.gov/outlooks/steo/data/browser/#/?v=3&f=M&s=0&start=201612&end=202012&maptype=0&ctype=linechart&linechart=COPRPUS
from STEO data browser, you can look at monthly estimates, for all US it is 11.8 Mb/d of C+C and Dec 2019 it is 12.3 Mb/d, for L48 excluding GOM
see link below
https://www.eia.gov/outlooks/steo/data/browser/#/?v=9&f=M&s=0&start=201612&end=202012&map=&ctype=linechart&maptype=0&linechart=PAPR48NGOM
Dec 2018 C+C for L48 excl GOM is 9.46 Mb/d and for Dec 2019 it is 9.80 Mb/d.
Yes, I am quite certain you did not make up the statistics. However, they do not add up well to what is finally put in print. I really do not think we will have a decline in production, its just that any increase will be marginal as long as prices remain where they are. That is, until into the third quarter when new pipelines are added. Then, I don’t care what the price of oil is, these morons will add more production. It’s just that it cant kick up a great deal in the final four or five months of the year.
The Permian is for real, and it will be a big factor. I just do not believe it will be the Superman that it is touted to be. As George says, the lack of investment will probably show up the final part of 2019. And huge drops in inventories will happen long before the end of the year.
On another note, today it looks like oil prices latched on to the Dow fear, again. This keeps up, any increase in production as prices stay low, could be converted to milliliters to get a meaningful measurement.
GuyM,
I agree the increase will probably be small, looks like GOM will be flat and tight oil maybe 35o kb/d increase if the STEO oil price estimate is correct. If prices are lower, output will be lower and if prices are higher output may be higher. As I suggested earlier probably an increase in US C+C output in 2019 of about 250+/-250 kb/d is about the best guess at the STEO guess at future oil prices.
I have read what is in print, they look at annual averages where I look at YOY for Dec output levels. Basically because there was a 1.6 Mb/d increase in 2018, if we compare yearly averages for 2019 and 2018 there would be an 800 kb/d increase in output even if 2019 output was the same in Dec 2019 as in Dec 2018. I think that may be the source of the confusion. Basically he EIA’s forecast is about the same as yours, but the way they report it makes it look different. (where you would say a zero increase, they would call it an 800 kb/d increase from 2018 to 2019.
I know what your saying, but does everyone else who reads this crap? Hell, they get lost at average.
GuyM,
The EIA is trying to make it look like there will be a big increase by using annual averages, it is an exercise in how to lie with statistics. The bottom line is that of the 1.1 Mb/d increase they are touting, about 750 kb/d (about 75%) occurs before the end of 2018 (in other words that part of the increase has already happened.) In 2019 about another 550 kb/d increase occurs, and if George Kaplan and SouthLaGeo are correct about GOM output in 2019 (I would say that this is highly likely), then the actual US C+C increase in 2019 would be about 350 kb/d.
Not a very big change at all, in part due to low oil prices and pipeline, port, and water constraints.
Not going to scroll up to the several places that needed a reply. I’ll just note here that if the price of oil rises it’s really hard for the stock market to fall.
It’s not what it used to be and never will be again. Sovereign Wealth Funds dominate everything and they get their money from oil.
It seems reasonable to expect that if oil debt becomes a problem then Sovereign Wealth Fund money will solve that problem for no other rationale than that it comes from oil. A substance created from thin air is never going to be the mechanism for the death of civilization. That will come from physics. The physics of oil scarcity.
Sovereign Wealth Funds aren’t immune to losses. They load up on assets in volume. Don’t forget they have to exchange their currency for dollars or whatever currency is needed to buy whatever they are buying. Currency moves against their position. They are forced to sell or just eat the losses. But can’t unload a large position in an illiquid market unless CB’s start bailing out SWF by buying their assets at any price. Stock market crash wouldn’t be the death of civilization and that’s exactly why we will get another crash and soon. Might be the death of a few SWF’s but not civilization. Might be the death of 2/3 of shale oil yet not the end of civilization. But you can only load up so much debt on a economy that is reaching energy limits. There will be a debt cleansing and soon. A lot of stuff we have now will be going away. Peoples current level of living standards are going to change and change in a big way. Not the end of civilization even though for some it will seem like it is.
They are immune to losses.
They don’t sell. The oil flows, they buy more, the loss is erased by added oil money. Besides which, how can there be intolerable selling pressure if the owners of 23% of all shares in the world keep buying?
Numbers on a screen are never going to kill billions of people. The numbers will just be changed by decree, and systemically in cooperation with all CBs.
Only oil can’t be addressed. Oil scarcity eliminates food from shelves and stomachs, no matter what money is created to pay truckers. The truckers can have all the money in the world and if there is no diesel available for the tank, the food doesn’t move.
watcher, your general theory has been shown correct for a number of years.
But it also requires a certain amount of global consensus between CB’s, nations, et al taking coordinated actions to keep a global corpse-economy rolling. This is not an assumption that can be made under all circumstances.
the theory also doesn’t entire hold true for countries that are being exiled from this consensus, or otherwise aren’t being allowed to participate (for whatever reason) in the forever-money you are referring to – essentially stranded on the rocks of collapse – Venezuela; Brazil; Iran; Syria – and innumerable small countries. Yes those countries with SWF and the Big Economies are still doing fine – but if their satellite countries raise enough of a stink, it could unravel the consensus.
the rise of right-wing nationalist governments around the world is a strong indicator of this new trend.
Well, there is certainly danger in absolutism as to . . . in all circumstances and at all times this theory must apply blah blah.
The central reality is that oil is everything. Has been since 1925 or so as its relentless power widened (widened, rather than “grew”). Caused Japan to bomb Pearl Harbor. Determined victory in Europe. Stressed the Soviet Union to its end. Has defined for 60ish years the Middle East as the flashpoint for global nuclear war.
CBs will probably communicate and cooperate from now on, since the systemic risk to their power unfolded in 2008. They kept the wheels turning the past 10 years. They don’t have control of the SWFs, the new force in the universe that has appeared as a consequence of simply them getting bigger. They started in the 1990s, but it took until now for them to grow as oil money flowed to them. Now . . . 23% of all common stock shares on the planet. But though CBs don’t have control of SWFs, they share the common goal of status quo maintenance.
As for the rise of nationalism (of any sort, Italy’s nationalism is hardly right wing, nor was/is Greece’s), this is something that for some reason instantly captured the disapproval of the left wing. It has not been thought through. Nationalism is the only possible mechanism for STOPPING the CBs from cooperating and instead actually acting in their own country’s best interests, rather than imposing their orchestrated global control on society.
Nationalism is the force that threatens Deep States. This is not a bad thing. Unless you want perpetual slavery to the power of CBs.
Limits to growth and or oil scarcity creates the environment for Nationalism. Oil scarcity is a direct threat to debt money. CB’s are ultimately playing a losing hand of extend and pretend. Ultimately debt money is going bye-bye. Debt money doesn’t work in an energy contracting environment. Interest on debt will be outlawed by government decree. Bond markets will disappear. Things will be funded without interest payments for awhile until that too doesn’t work. But until then there will most certainly be a lot of can kicking.
all I’m saying is that you’ve stated repeatedly that only “natural scarcity” will cause any sort of decline – and in your own response to that statement you actually agree with and confirm an opposing view – that a breakdown of global consensus between SWF, CBs, and powerful Nationalist Govt’s could and probably will unravel the “oil must flow at all costs” dictum that has prevailed for the past 10 years. And this will happen BEFORE the gas lines. Many groups are already not getting what they want – yet no gas lines – except maybe South Sudan – and once they’ve been trimmed and skimmed enough – they’ll begin to crack. and if those groups hold state power – they will use the power of the state to try and impose their will. good, bad, indifferent, left right, whatever.
The initial production for Nov RRC is now posted on RRC site. Definite oddities from usual whe I add the pending data. Pending data total is trending down, like the completions. However, the initial production is trending up more. The new pipeline came on Nov 1st. I think what I am seeing is production that had been shut in waiting for it. My guess. Maybe Dec will be down, but not Nov. And the deviation from the second month matching EIA’s monthlies to the third month could be from the confusion by the companies while they played wack a mole. It’s not good to shut in these wells, I understand, for a long time after completion. Maybe, they were alternating as best they could. My guess.
August the discount started going down fast, and has stayed lower, which adds to the theory. I would guess the EIA monthlies are a little less than actual since August.
GuyM,
Dean Fantazzini’s analysis agrees with yours, since Aug 2018 the EIA monthly estimates of Texas C+C output may be a bit on the low side.
2019-01-21 (JODI Data) Saudi Arabia crude oil inventories declined by -9.6 million barrels in November
Chart on Twitter https://pbs.twimg.com/media/Dxb2106X0AEVusm.jpg
That works out to be 320,000 barrels per day. Saudi production increased by 384,000 barrels per day during November. So Saudi’s November increase was mostly just emptying their storage tanks.
And from looking at your chart, it looks like the 135,000 barrel per day increase in October was from the same source.
Saudi cuts start from a base of 10,633,000 barrels per day. That is almost their exact production in October. And your chart shows Saudi inventories had been dropping for months. Saudi had obviously been preparing to “cut” production from a level of production they reached by emptying their storage tanks.
hi. folowing this chart with interest as well and i think this an iverlooked prt of the puzzle. it has to be mentioned though that oil product inventory is increasing quite a bit ar the moment (if memory serves me right)
Overall decline was 5 mmbbls, which is above the trend over the past couple of years at around 2 to 3. Crude stocks decline rate definitely increased in the second half of the year.
GAS PROJECTS EXPECTED TO DOMINATE INVESTMENT IN 2019
The dearth of recent oil discoveries and the peculiar economics for LTO plays seems to have a growing effect with only 30% of this year’s oil and gas FIDs expected to be for conventional oil.
https://www.offshore-technology.com/comment/final-investment-decisions-in-oil-and-gas/
Those that are being approved look to be increasingly on the margins: e.g. Anchor in GoM is uHTHP requiring new 20 ksi wellhead technology, Wisting in Barents is the furthest north Arctic development and is 8 years out (and coincidentally Equinor last week reportedly suffered a well control incident during exploration drilling in the Barents Sea: the Norwegian oil industry safety watchdog PSA Norway on Monday said the incident had occurred on January 16, 2019, aboard the Seadrill-owned West Hercules semi-submersible drilling rig); most of the stuff in UK North Sea is now one well tie-backs at les then 5 mmbbls. Even these expensive developments will run out in 2020/2021.
The only upstream oil project in the top ten projects to watch for 2019 (https://www.fircroft.com/blogs/10-major-oil-and-gas-projects-to-watch-in-2019-91515754471) is Mexico new fields, which might not be quite as great as expected.
The lack of investment over the last 3-4 years should hit production hard about mid to late 2019, can the Permian compensate? There’s not much else as far as I can see, (maybe Saudi and UAE spare capacity but their increases at the end of 2018 didn’t last long enough to prove conclusively that they have real long term capacity for reservoirs, wells and surface facilities combined).
Guyana?
It’s interesting to me that EIA data through September 2018 has September as the new peak in monthly oil production, and in the 12 month trailing average. July, August and September all exceeded the previous peak, which was either November 2016 or February 2018- I can’t remember the numbers but those months looked pretty close to being tied for peak oil, until July through September 2018 came along.
Kind of an interesting note.
I was browsing some conventional stripper properties for sale in Permian Basin. Two of the lots LEAD with touting significant commercial water disposal capacity. The oil and gas production appeared to be of secondary importance, despite each being in the 100 BOEPD range, with over 75% oil.
I’d say before it’s over, the people handling the water in the Permian Basin may make more $$ than the ones producing the oil.
It never ceases to amaze me how this shale stuff has been developed like Pithole, PA in the 19th century. Drilling frenzy.
Yeah, I have no problem with developing shale oil, I’ve got some. But, the totally irresponsible behavior, so far, leaves a bad taste in my mouth. What can eventually happen in West Texas can be written into a Stephen King novel.
I keep hoping that big oil will eventually take over the majority of the Permian, and elsewhere. Then, we could be looking at an interest in how much can be used in US refineries, rather than looking at how much can be exported. Exxon has made a good start.
https://oilprice.com/Energy/Crude-Oil/Why-OPEC-Output-Cuts-Take-So-Long-To-Materialize.html
Given Russia has set a new record and the actual potential for Russia, I’d have to wonder to whether there will ever be a scarcity of oil (at least in this century). If oil consumption stops growing and starts falling as EV adoption increases, is it possible everything will work out ok?
Anything is possible, it’s just not very high on probability, to me. Ask the question, again, about July of this year, if you are still wondering. By then, though, I think you will have come to your own conclusion.
And, as a reference point, I would suggest reading the George Kaplan post above. His knowledge of world oil production is encylopedic.
Have no growth fears, Davos is about growth. The wheels come off the “economy” without growth. Growth from this level is Soviet. Minimizing the bloodbath of debt implosion is not discussed.
$21 trillion of “unaccounted discrepancies” in the Pentagon and HUD budgets from 1998 to 2015
https://www.youtube.com/watch?v=WlItNAk4U-U&t=3s
The MSM including NPR reports the accounting cover-up as a nothing burger. Nothing to see here.
https://www.youtube.com/watch?v=V3eHf9JJRZs&t=44s
Need a wall…. Around DC. People confuse the Country with the runaway swamp creatures.
$21 trillion?
Isn’t that just a couple of F35’s?
Might of got lost on the way to newest “liberation”
Lost, Blown or Invested? Where be Handcuffs, Pitchforks or Not a Flamethrowers? Taxpayers and those on the receiving ends of these campaigns deserve at least a Flipout Pie chart!
How much of this is for PetroDollar prop-up/Oil Flows? 1% ? 50%? Budgets and books NOW DARK for National Security matters. So did Congress appropriate these funds or not? If you like your country/planet, you can keep it. OPPS.. so what percentage of US Citizens is/will be conscious that their future is being flushed?
——-
“Given that the entire Army budget in fiscal year 2015 was $120 billion, unsupported adjustments were 54 times the level of spending authorized by Congress. ”
——-
“No Money shall be drawn from the Treasury, but in Consequence of Appropriations made by Law; and a regular Statement and Account of the Receipts and Expenditures of all public Money shall be published from time to time.” ~ Article I, Section 9, Clause 7, The US Constitution
——–
https://www.forbes.com/sites/kotlikoff/2017/12/08/has-our-government-spent-21-trillion-of-our-money-without-telling-us/#77d313ea7aef
https://www.longwarjournal.org/us-airstrikes-in-the-long-war
Sean- “If oil consumption stops growing and starts falling as EV adoption increases, is it possible everything will work out ok?”
By ‘possible everything will be ok?’, I assume you mean in regards to energy supply.
As GuyM said- possible but not highly probable.
I’d go so far as to say unlikely, however the scenario will be very variable depending on the country you live in.
Some countries have poor prospects for adapting to a scenario with less oil available on the market, for example countries that [import a high % of net energy use]. How quickly can they adapt to generate other forms of energy, or do without as much consumption. Examples (as of 2014 data) include Japan 94%, Ireland 84%, S.Korea 82%, Turkey 74%, Spain 69%, Germany 61%
Even if you don’t live in these countries, they may be an important economic or political partner of your country that could become severely weakened due to energy constraints on industry.
Some countries have better prospects, that is a lower dependency on imported energy and a longer timeframe for adaptation. USA is such an example at 9% import of net energy use, and the wherewithal to generate lots of renewable energy, and cut out huge amount of fat (wasted energy use).
Some countries are making longterm plans for less oil, and others not. The USA and Canada currently seem in a hurry to export domestic supplies of oil, and gas, and coal. Some countries or states have incentives for innovative companies and technology, such as for electrification of transportation. Its policy choices. These kind of choices can affect whether thing could ‘be OK’, down the line.
I haven’t seen updated data on country level energy importation, beyond 2014. Keep in mind this includes all energy, whether crude, electricity, coal, etc.
https://www.theglobaleconomy.com/rankings/Energy_imports/
Last data I saw said the vast majority of EV drivers returned to conventional at trade in time. So adoption proves to be a temporary fad.
That’s not what I’m reading.
90% Of Electric Car Owners Won’t Return To Gas
A massive 88 percent said they would not return to internal combustion-powered cars.
Almost nine in 10 electric vehicle drivers would never go back to driving a car powered by petrol or diesel, according to new research.
A study by electric vehicle YouTube channel Fully Charged found that 88 percent of plug-in car drivers said they would definitely not switch back to fossil fuels after having owned an electric vehicle (EV).
Seven percent of those quizzed said they were not sure whether they would turn back to internal combustion, while the remaining five percent said they would consider making a return to petrol- or diesel-powered cars.
However, just under a quarter of the channel’s audience (24 percent) said they currently owned an electric car, with the vast majority (54 percent) claiming to own a petrol-powered vehicle. Diesel was the second most popular fuel, accounting for 35 percent of viewers, while a combined total of 11 percent were the owners of petrol hybrids or plug-in hybrids.
That number looks likely to change, however, with 61 percent saying they would switch to an electric car next time they changed vehicles and nine percent saying they would opt for a plug-in hybrid.
Of those that did not already own electric vehicles, a third (33 percent) said the cost was limiting, while 16 percent bemoaned a lack of home charging infrastructure and 11 percent complained of a lack of availability of electric cars.
Just nine percent said they were concerned about the range that could be achieved by modern EVs.
Where did you see your data?
Maybe you should read sources that don’t have agenda. Like Edmunds, the decades-old source of impartial car information.
Only 27.5% of all hybrid and electric vehicle trade ins were applied to the cost of another hybrid or electric vehicle in 2016. This was a decline from 38.5% in 2015, according to a new analysis by car shopping site edmunds.com.
This was even more pronounced when hybrids were extracted from the data. 25.7% of EV trade ins went towards the purchase of an SUV, and 4.8% went towards another EV.
You guys really need to know when you’re dreaming and when you’re . . . pretending.
By the way, after you hunt down that study why don’t you not try to hunt farther and find some imagined flaw in it. I didn’t spend any time looking for any rebuttal. I didn’t spend any time looking for any supportive underpinning for the study.
But you will, because you’re not impartial.
Just so you know, there is a very good reason why I’m not impartial. I am not rich but, out of a fear of Peak Oil I made substantial investments in PV modules and inverters around 2010, thinking they would be like gold when the effects of Peak Oil started being felt. The LTO boondoggle has postponed Peak Oil for the time being and in the meantime the price of PV panels has halved but, every now and again the name Ghawar pops up in my thoughts.
According to the following article, Ghawar still accounts for roughly 5 mbpd of their total oil production.
Is Saudi Arabia Depending Too Much On The Ghawar Field?
When Ghawar comes to mind an image always pops up in my head that haunts me, actually it scares the crap out of me. I was able to find it in a post that Ron put up here in 2015:
JODI, Iraqi Reserves and Ghawar
What does the picture below look like today, fifteen years after the last pane from 2004? I am concerned that 5 mbpd of Saudi oil production could go South very quickly at any time.
To put things in perspective, I live on an island that imports all of it’s fossil fuel energy, mostly oil but, increasingly NG by way of LNG from an outfit call New Fortress energy. Curiously the New Fortress Energy web site lists only one customer but, that’s a whole other story. Almost one hundred percent of transportation here is petroleum based (except for the twelve or thirteen Nissan EVs that are on the island). If world oil production were to peak before this island’s dependence on oil is substantially reduced, the outcome for me will not be pleasant.
I am not a young man any more. I am constantly reminded by the young men addressing me using the local vernacular for a senior citizen, “elder”, even though I’m not quite at retirement age yet. This island has a sizeable population of young people and I worry that when TSHTF I may be faced with hoards of young, strong men that covet the PV I own, the EV I plan to acquire this year and even the six acre homestead I inherted from my parents. I can’t even depend on local law enforcement for anything much as it stands right now, much less if a state of anarchy were to ensue, so I would have to fend for myself. As far as relocating goes, any hints on a country that would welcome me with open arms? (Along with possibly millions of others.)
Against this background my lack of impartiality stems from the fact that I am desperately hoping that the folks manufacturing renewables and EVs get on with making them as fast as they possibly can so that when oil production does finally peak for good, the effects will not be as bad as they would if there were zero alternatives.
With due respect to all the hands on oil folks around here, I do not think they can produce oil where none exists so, they will not be able to prevent the inevitable. I offer them my sincere gratitude for keeping things going so far and hope they can keep things going until EVs and renewables reach a tipping point. Am I being selfish? You bet!
Meanwhile the number of EV’s keeps growing and growing.
Growth rate of plug-in sales (US) for 2018 rose by 81 percent. Global growth rate of EV’s is around 70 percent/year, 2011 to 2017. Lately it has been about 50% annual growth rate.
Globally there were 4 million EV’s last August and an expected 13 million by the end of 2020.
This is while several major manufacturers are just starting to build their production lines for BEV’s.
Between 50 to 100 percent of new light vehicles could be electric by 2030. Unless TSHTF before that time. Then all bets are off.
What Watcher is describing is irrelevant since it only describes a single owner. Used vehicles get purchased again.
The numbers he referenced are from April 2016, much has changed since then.
https://www.boston.com/cars/news-and-reviews/2016/04/26/why-electric-car-owners-are-switching-back-to-suvs
Well there is some truth to that growth story and I have said before that IMO China is going to be “ground zero” for EV adoption:
China Amazes With 180,000 Plug-In Electric Car Sales In December
December didn’t disappoint expectations. It was tremendous.
While the overall car market in China shrunk in December by significant 16% year-over-year, the plug-in electric car market is booming, reaching a level not even close to what we have seen before.
According to EV Sales Blog, last month closed with 181,385 plug-in car sales, which is 70% more than a year ago and new all-time record – around 40,000 higher than the previous record in November! December was also the fourth straight month with a new sales record.
The market share went through the roof and seems to be 8%!
Considering that a total of 81,000 were sold globally in all of 2011, I think that 181,385 sold in a month for just China is ample evidence of the growth of the EV market.
islandboy, I appreciate your comments very much if they are impartial or not. I also appreciate the Electric Power Monthly updates from you, and I refer to that data often. Most people don’t really realize what a small percentage wind and solar contribute to the overall grid, and they normally have trouble arguing with actual data.
My main question for you and GoneFishing is have you read the article on OilPrice.com titled “IEA Chief: EV’s Are Not The End Of The Oil Era”, and what do you think of it? One quote in the article from Fatih Birol is; “This year we expect global oil demand to increase by 1.3 million barrels per day. The effect of 5 million cars is 50,000 barrels per day. 50,000 versus 1.3 million.” His argument is that cars are not the driver of oil demand growth. The article also mentions that most of the electricity used to power EV’s is coming from fossil fuels anyway.
Thanks,
I’d rather rely on Exxon-Mobil. They have a graph showing world oil supply peaking around 2040. The graph can be found by searching on Exxon view to 2040. There are a couple of caveats with that graph. One is that there is adequate supply for 160 years. The other caveat is that there has to be the financing to bring it to market. They also show a bar graph with 1 trillion barrels of “oil”. All this may seem confusing but I think it may be easy to explain.
When you look at the financing going on with the Bakken, the market may not be in the mood for riskier fianancing such as the Oil Sands of western Colorado and Utah. Exxon seems to indicate that a peak will be reached because the financing is not there????
Most of the trillion barrels of oil is not oil but hydrocarbons such as kerogen. In order to process the kerogen, 3 barrels of water is/was needed to produce 1 barrel of something that will go through a pipeline. In Alberta, you have a major river water resources while in western Colorado, the water resources are spoken for. In order to develop the kerogen, water has to be pumped from most likely the Missouri River over the Continental Divide to that area. As one of the managers of the exploratory companies said: “it will be a political decision on whether to build such a pipeline(s).
When gasoline was $4 to $5 a gallon, was there any talk of running a water pipeline to western Colorado?
The other factor is that Shell(?) found that the kerogen is not very well distributed and the various methods used to try to extract the kerogen and bring it to the surface was not very productive.
If Exxon is right in their prediction and Robert HIrsch’s recommendation about starting to transition well ahead of peak is needed. Anything less than 20 years will be very difficult.
Bill Moore, Editor of EVWorld, talked with the Director of the Toyota Museum about energy supplies. The director said he had talked to the CEO of Toyota. The CEO said they talk to the CEOs of the energy companies. They ask about supplies, outlooks, and risks, etc. The CEO said if they don’t get their product development right, they go bankrupt.
Fast forward to now. If you want to see what the car companies CEOs are thinking, you look at the direction they are headed. Almost all, including Toyota, are or will be switching their ICE production to EV production. For GM, its developing EV Cadillac’s. Nissan its the Leaf. Hyundai and Kia now have EVs. Porsche has the Taycan. Etc. Etc. Etc.
There was a recent announcement that Honda is teaming up with Cal Tech, and NASA to develope and preduce a fluoride based battery for EVs. It all points to the fact that Peak Oil is approaching. It may be a clear peak or it may be that we leave oil via EVs and renewables before oil leaves us. That could also be an interpretation of the Exxon graph.
To me, it does not matter whether people are staying or leaving EVs **right now**. It’s a silly argument. The biggest problem is dealing with dealing resources, increasing resource prices, and how we come to terms with our predicament. To me, EV’s are a possible solution and if and when the time comes, I will likely be plus having another one whether because I really like the selection or that there are no longer producing ICEs or ICEs that I like or could live with.
PeterEV,
Now we use about 1 gallon of gasoline energy equivalent to produce and deliver one gallon of gasoline to a vehicle (not counting the energy for the car to drive to the station and back on route).
All to feed a machine that is 20 percent efficient.
When you speak of tar sands or kerogen, the energy input to get that gallon of fuel increases quite a bit.
It’s called the energy cliff for a reason.
PV on a roof feeding an electric car short circuits those losses and all that material involved. Plus the vehicle is 4 times as efficient, and no exhaust plume or toxic Alberta fish involved.
Hopefully, reason will prevail. Then people will feel stupid not to convert to EV travel, if they need a car. I should emphasize the word need.
It’s not one or the other. In a couple of years Most cars will have eDrive in the Mix.
Electrics can simplify drive trains and remove parasitic loads. 12V is useless.
We have a Rule in Autonomous systems. 12Volts, 12 gauge wire, 12 watts max @ 12 meters.
https://www.popularmechanics.com/cars/trucks/a23306626/ram-1500-etorque/
Wards 10 Best Engines for 2019. – The best DriveTrains have eDrive.
Has Tesla forced Petro engines to raise the bar?
https://www.youtube.com/watch?v=3UdKGZM66dg
Noisy old dinosaur petrol engine and Modern Fuels are so annoying complex.
Thanks Hickory,
I live in Ireland, better start building my peak oil fallout shelter!
Better stock up on some of that great Kerrygold butter!
Ireland has has good wind resource it looks like-
“Wind energy is currently the largest contributing resource of renewable energy in Ireland. It is both Ireland’s largest and cheapest renewable electricity resource. In 2018 Wind provided 85% of Ireland’s renewable electricity and 30% of our total electricity demand. It is the second greatest source of electricity generation in Ireland after natural gas. Ireland is one of the leading countries in its use of wind energy and 3rd place worldwide in 2018, after Denmark and Uruguay.”
https://www.seai.ie/sustainable-solutions/renewable-energy/wind-energy/
Well Sean,
If you subscribe to the idea put forward by Watcher, essentially that electrification of transportation is not viable, then the simple answer to your question is simply No.
[is it possible everything will work out ok?]
Unless mules and bicycles would suffice.
On the other hand, some people do think that electrification is viable. Take the city of Shenzen for example, which is in China and is almost as big as Los Angeles. They now have over 21,000 electric taxis. https://www.apnews.com/62d6c9b22b7f4caaaafdf76af8521d1b
Or perhaps you’d like to consider cargo vans in Germany
http://evworld.com/news.cfm?newsid=35186
Or perhaps you’d like to imagine how well this company will do in the urban centers with small package, meal, human delivery- https://www.gogoro.com/smart-energy/
2019-01-22 (Reuters) Halliburton profit beats on international demand, North America lags
“In North America, the demand for completions services decreased during the fourth quarter, leading to lower pricing for hydraulic fracturing services,” Chief Executive Officer Jeff Miller said in a statement.
– (consultancy Primary Vision) The number of active hydraulic fracturing fleets in the Permian basin fell to 140 in January, versus 192 in June of 2018, a 27 percent decline, according to data from consultancy Primary Vision.
https://www.reuters.com/article/us-global-oil/oil-edges-up-as-investors-latch-on-to-opec-cuts-supply-outlook-idUSKCN1PF01U
Yeah, my guess is there will be a slight bump in production in November from shut in wells waiting on the new pipeline Nov 1st, but that won’t last long.
UNDERSTANDING PHYSICS COULD LEAD TO BIG GAINS IN SHALE OIL RECOVERY
“Researchers propose that companies are applying tried-and-true transport mechanisms for conventional oil extraction but are hitting recovery stumbling blocks because they are not accounting for the difference in physics found at unconventional reservoirs.”
Read more at: https://phys.org/news/2019-01-physics-big-gains-shale-oil.html#jCp
Should be really easy to test – there is no risk for a bigger shale company to try this on a half worn out well.
It must not even be the best horse in the stable – just a C quality well.
Eulenspeigel
Liberty Resources is currently doing an EOR project in the Bakken using this approach.
Many people are eagerly awaiting the results.
There is a short pdf available online that describes this.
They likely won’t make major gains if their goal is to somehow harness or control a diffusive process.
I believe all that they are doing is achieving an understanding of what is actually happening underground after a fracking event. But of course, for any funded research it is always important to claim that the findings will help improve optimize the technology.
But you are correct in that whatever needs to be done should be done in the context of controlled experiments. The entire semiconductor industry is essentially built from extremely precise characterization of diffusion process technology used in creating analog and computer integrated circuits.
Several comments over the years related to various shale EOR efforts (there have been very few) pointed out that “no one knows where the gas goes” when it is injected into the rock.
This is one reason why EOG claimed that their EOR gas injection in the Eagle Ford may not easily be replicated elsewhere as the geology was particulary conducive to their localized efforts.
Granite Energy has been successfully re-injecting gas in their Viewfield Bakken wells for several years now.
The main insight to be gained from showing that the flow is diffusion-controlled is that it completely explains the high initial flow and the rapid decline into a fat-tail.
This can either be approximated by a hyperbolic function (as Dennis uses) or by a more detailed expression one gets from solving for diffusion.
The secondary aspect is to figure out how to use this knowledge to be able to extract more oil. Harnessing diffusion is equivalent to HERDING CATS !
Looks like Paul Pukite has weighed in with a comment on this project.
Yes, I also have a discussion going with an anonymous retired British oil geologist here:
https://andthentheresphysics.wordpress.com/2019/01/10/fact-mongering/#comment-136748
The geologist claims that fracking techniques are “taught in textbooks. “
That’s correct. There are textbooks devoted to hydraulic fracturing (the first I read was published in the 1970’s). As time went by and service companies became more focused in this type of work they published books and monographs slanted towards their products and tools. Some companies published their own training manuals for “frac school”, etc. Check the course offerings at Texas Tech, A&M, UT, Colorado School of Mines and you will see the material they are using.
So it looks like we are the first to show how diffusion flow is the primary mechanism after a fracked event occurs.
The issue is that the geologist said that it is all taught in textbooks so that there is nothing new to determine. Obviously, there is no discussion of Ornstein-Uhlenbeck diffusion processes discussed anywhere.
Doug, that site is getting a lot of attention recently. They seem to know physics well.
Can anybody comment on Permian natural gas handling? Are there pipelines existing or is the NG getting flared?
https://viirs.skytruth.org/apps/heatmap/flaringmap.html#lat=29.43243&lon=15.26825&zoom=3&offset=15
This will give you some idea of how the “big boys” are managing our hydrocarbon future in America from the Permian and the Bakken oil basins. There is a reported 800MMCFPD of associated gas being wasted in the Permian and slightly less than that in the Bakken. In the Permian, because of reporting standards in New Mexico, it is actually way over 1 BCFPD, easily. I just flew it at low altitude, its enough to make you sick to your stomach. Its looks like Siberia, not America, the industrialized capital of the world.
The shale oil industry in the Permian is set to add 5MM BOPD of additional liquids takeaway capacity by 2021 and it wants Americans to believe that will end the flaring. Its a lie. There is no place to put that gas anymore so it will continue to drill marginally
(un)profitable oil wells and waste the associated gas, so that oil can be exported to China. At a $20 per BO discount to Brent. There is rhetoric, most of it also lies, about increased market potential from the Permian to Mexico; don’t believe it. Nor the LNG crap. Mozambique, West Australia, Russia, Qatar, they have the LNG industry on the hip. America, even with its unlimited money supply, is sucking hind tit on LNG.
If you are rooting for an industry in America to deliver the oil and gas goods, regardless of price, profitability or where the money is going to come from, I liken that to socialism. Its no different that wanting health care for all, with no idea how to pay for it.
Its a race to the bottom in America’s unconventional oil basins. Mother Nature has already had Her say in the Bakken and Eagle Ford; she will in the Permian also. And soon. She only has so much water to give to those idiots out there to drill those stinking wells and its an arid desert, W. Texas. Watch for fresh source water to be the #1 detriment to Permian growth. Soon.
Mike. Read Nick Cunningham’s latest on oilprice.com regarding Schlumberger conference call.
I’m trying to link it but am having trouble.
I’ve read it, Shallow; thanks. May I suggest, please, looking at our buddy Jim Brooker’s comments on the Bakken on shaleprofile.com and our dear friend, Rune has added to the conservation also. Bakken operators are still touting very misleading well costs, as are all shale oil operators in all basins; it is a “control” point they have that creates confusion in the economic analysis. I had read about Oasis well costs being upward of $12MM. At $41 NDS oil prices, after all costs are deducted, take home pay per BO is about $12-14 and a $10MM well will require 770K BO to reach payout. Not many Bakken wells will do that and BTW, the point is NOT paying new wells out, it is paying back new wells, paying legacy debt back, AND creating net cash flow to stay on the drilling hamster wheel without getting further in debt.
Mike.
Very good discussion about Bakken on shaleprofile amongst some people who know what they are writing about.
GOR comparison between 2010 and 2017. Plus, all that wasted flared gas!
How about this one. Almost 44% of 11/18 production from wells with first production in 2018!
I saw Rune’s note on well costs. Looks like about $15 billion has been spent on 2018 wells in 11 months to fight the high decline rates the Bakken is experiencing.
Lots of work and money spent to tread water both in terms of production growth and financially.
shallow sand,
GOR is much lower in Bakken than Permian, may not be a big issue in North Dakota.
https://oilprice.com/Energy/Energy-General/Warning-Signs-Flash-For-US-Shale.html
I think the link above is to the article shallow sand refers to.
Mike,
It is pretty easy to figure out the healthcare for all thing, most advanced economies already have it, the US lags way behind in this regard. The answer is very straightforward, higher taxes could easily pay for healthcare for all.
Might as well re-write the tax code as well, eliminate all loopholes, just get some good tax attorneys to write the laws. Simplify the code, no special breaks for anybody, just a progressive income tax where all types of income are taxed equally, no special treatment of capital gains, dividends, interest or wages.
As for the oil industry, it should be treated exactly the same as any other industry and if it pollutes the pollution should be taxed to discourage it.
Dennis.
Off topic, but it is interesting that self-employed earned wages are taxed the highest in a country that says it values small business.
Of course, to counter that, there are quite a few breaks.
But, for a service provider, there aren’t many.
Example, self employed accountant that rents a small office with one assistant. He or she clears $125K after the assistant’s compensation, rent, utilities, etc.
If that accountant is in a state with high income tax rates, can be pretty rough.
But a bloke lucky enough to pull in $125K per year in dividends from inherited blue chip stocks pays much less.
yep shallow. that tax scheme ought to be reversed.
Shallow sand,
Agree dividends should be taxed at the same rate as wages, social security taxes could be paid by workers only and not by employers and this would eliminate self employment taxes.
Dennis
No they should not. If you buy shares in a company, there is a risk.
£10,000 of shares could be worth £8,000 next year. You get no compensation for that loss and you cannot even claim that loss against income.
Only a lower tax rate makes owning shares worth the risk.
The tax allowance before paying tax on shares is much lower already. In the UK you can earn £11,500 before paying any tax, but only £2,000 before paying tax on dividends.
Also if you inherit share that pay you a dividend of £125,000 those share would be worth at least £1,500,000. You would have paid 40% tax on any shares over £325,000. So you would have had to inherit £2,500,000 of shares to pay the £1,000,000 inheritance tax bill.
Scum government steals money from people who work hard and waste it.
https://www.taxpayersalliance.com/new_bumper_book_of_government_waste_exposes_120_billion_of_wasteful_spending
People who earn £15,000 and perhaps earn £1,000 from shares have to pay for these parasites.
https://www.theguardian.com/news/datablog/2010/may/31/senior-civil-servants-salaries-data
Hugo,
Yes there is risk and there is also reward, note that the losses can be deducted from gains, but overall there is no reason to tax income at different rates in my opinion.
I am not familiar with UK tax code. And I am not an accountant so only am familiar with the US tax code that is relevant to my personal tax situation.
Dennis, that’s a novel idea about health care; you should run for congress. Top to bottom, from federal leases bonuses, to corporate income taxes, franchise taxes, sales taxes, production and property taxes (even royalty can be viewed as a form of tax), surcharges on fuel and other services, fees associated with federal, state and local permits, tariffs, etc. etc. the oil industry is the most heavily “taxed” industry in America. And remember, only you can prevent forest fires; the oil industry does not “pollute pollution,” people like YOU do.
Mike,
In the US nobody wants to pay for healthcare, they just want to be cared for for free. 🙂
Health care needs to be taken care of at the Federal level, unless we are going to have immigration enforced at state borders. So only federal taxes are relevant. If small businesses feel the self employment tax is unfair, all social security taxes could come from employee paychecks, or the social security tax could be eliminated and simply come out of the general fund of income taxes.
The idea is to simplify the Federal tax code. For various states and how they decide to generate revenue, that would vary from state to state. I am not suggesting that the oil industry doesn’t pay taxes, lots of people pay lots of taxes, most of those taxes that you list are state and local taxes, typically healthcare is done by the national government in most nations.
I suppose some states could implement their own health insurance system, as Massachusetts did, they might find it puts them at a competitive advantage attracting workers.
Yes people who use fossil fuels generate pollution. A carbon tax would be passed through to the price of the final product (whether its a gallon of gas or kWhr of electricity, so the people like me that pollute, would pay higher prices for polluting.
I imagine oil producers pollute also, or do you guys ride your horse to work? 🙂
Mike,
The USA spent your taxes like this-
From 2001 to Nov 2018 [$5.9 Trillion] on wars in Asia. Do you like what that bought you?
https://www.cnbc.com/2018/11/14/us-has-spent-5point9-trillion-on-middle-east-asia-wars-since-2001-study.html
I believe that a heavily rationed health care for all program, focused on the spending that gets you the best health outcome per dollar spent (like appendectomy, fracture care, vaccinations), would be money better spent. And then people could/would purchase private insurance on top of it, to the extent they choose. Medicare works like that now. The public program could be restricted to something like 7% of GDP. Period. It could work well, but the decisions are tough.
Sounds reasonable.
Hickory,
Your program would be better than nothing. It would still result in rationing of healthcare to the very wealthy.
It may work fine as long as no one needs health care. Otherwise it’s not very different from what exists currently in the US for those younger than 65.
Europe and Canada have the correct idea on healthcare in my opinion.
All of the public programs of various countries are rationed Dennis. Some stricter than others , some with better outcomes than others.
Medicare does this by deciding which procedures, or drugs, or provider types, to cover, for specific illnesses. They tend to not cover the treatments that are less effective, and have to draw the line somewhere. Overall, the program is pretty generous in its coverage.
Regardless, any single payer system will have to have rules of coverage to live within its means. Determining its means is an important decision, and I’m sure people will spend lots of time arguing about that level.
Nonetheless, such a system for all, with a private layer on top, is workable, acceptable to most, and can be affordable depending on the decisions that are made- the devil is in those decisions.
Hickory,
Yes the decisions are difficult, but a full health care system seems a better option than stripping things to bare bones for most and leaving the premium care for the very wealthy, which would be the likely result of your initial suggestion.
The problem with such a system is you end up with a penny wise pound foolish system. A comprehensive system focusing on good public health would be most likely to minimize overall health system costs for an equal level of health care benefit.
Well, not quite what I was thinking. I would suggest a level of single payer care that was moderate in degree of coverage, not bare bones. But the amount spent would be strictly limited to a percent of GDP, such as 7 or 10- that would have to be decided somehow.
But to have an unlimited system in a culture where there is so much self-destructive behavior, and obesity with its related illnesses, is not viable. Also, in our culture most people avoid contributing to the funding pool.
I believe the democrats are going to regret advertising support for a system without strong limits. Its just naive.
Hickory,
Setting limits makes sense. Whether 7 to 10% is the right number seems like should be up to society to decide. UK spends about 10% on healthcare including both Gov’t and private spending. About 8% government spending and 2 % private.
https://oilprice.com/Energy/Energy-General/Warning-Signs-Flash-For-US-Shale.html
Here is the link Shallow. See, Dennis, they only read the 1.1 increase. It’s the way the damn thing is written, and nothing about averages. Nothing about averaging one year to the next, it will be THE projection, until it doesn’t happen.
And, you can sort of estimate the decrease in production, based on some info in the article. 54% of capex went to covering declines in 2018, and expected to get to 75% in 2021. Loose estimate for 2019, might be 61%. So, if activity drops 30%, then only 9% could be for increase. So, it’s easy to guess positive or negative here, depending on the activity level. Which is damn hard to get a grip on. Not 600k bpd for an average, that’s for sure. Then too, what’s the decline rate for the conventional that’s still going on out there. And, if the Bakken and EF cut back, they gotta be close to that 75%, already. Or, really, if they stay the same, now, production could drop.
Yes this article is a good read. It refers to shale oil as a treadmill, but really as time goes on its an uphill treadmill that’s increasing in speed and verticality as time progresses, and the runner will be getting progressively more exhausted. If this boondoggle of a ponzi scheme does delay a peak of production until 2025 as Dennis predicts, it will be a rotted house of cards ready for a precipitous fall.
As written before, I see LTO production more as an ongoing mining operation than conventional oil drilling.
See it perhaps as an good old gold mine – you have to continue digging corridors to fresh ore spots, and as time goes on the ore spots get worse when you already have scraped out the best parts. When stopping digging new corridors you are out very fast on ore spots, so you have to dig to get gold.
The same with reasonable LTO: Get your acres, build up a drilling and fracking team and then go straight through your acres. Design this on a lifetime of 20 or more years until you reach the other side.
That’s how a state company like Statoil would do this. If you hire the fracking team from a contractor, make a long running contract, as with pipeline companies. So you won’t get hit by all these up and downs.
On the other hand: Every mining operation is a “threadmill”, the moment you drop the tools you get nothing.
GuyM,
Yes people don’t do the research. From EIA STEO, Dec 2018 C+C=11.8 Mb/d and Dec 2019 C+C=12.32 Mb/d, an increase of 0.52 Mb/d, with about a 0.2 Mb/d overestimate of the GOM level of production in Dec 2019, so actual C+C output will increase over the next 12 months by about 320 kb/d in the United States. Chart below from EIA.
North Dakota natural gas production percentage flared
The low was April 2016 at 8.8%
Latest, November 2018 20.8%
You know, my recall is that pre shale, when oil production in the US was in decline, there was generally no acceptance that the reason was geological. I seem to remember that it was all about government restriction on exploratory drilling, which might indeed have been correct. The point being that when production begins to fall again, it again will not be accepted as a geological limit.
This will ensure that there are no preparations for an absence of food movement from farms to mouths. It can all be fixed if only the government would let it be fixed, you see.
“The point being that when production begins to fall again, it again will not be accepted as a geological limit. . . . This will ensure that there are no preparations. . . .”
There. You’ve said what I’ve been thinking, but much better.
The great horror of the failure to correctly predict the date of peak ten years ago (through no one’s fault, really, it’s too complicated and the data are too unreliable), is that, as in The Boy Who Cried Wolf, the people become inured, cynical, unbelieving.
And people who smugly cite that fable forget that the wolf does come at the end. And now we’re just doubly unprepared.
There won’t be Peak Oil on a global scale. There may very well be peak oil in the USA and many other countries, but not on a global scale. This will have grave geopolitical implications, unfavorable to the US & its allies, but extremely favorable to a few others. Hence the geopolitical conflicts we have been witnessing in the last few years.
There won’t be Peak Oil on a global scale.
That statement makes no sense whatsoever. Peak oil means peak world production of oil. Of course, some oil exporting countries will stop exporting oil. That will accelerate and exacerbate the problem worldwide. But it will be peak oil on a global scale, no doubt about that.
What makes you think that Iraq/Iran/KSA & Russia are anywhere near Peak Oil? There is no evidence of anything like that whatsoever. On the contrary, these countries (and a few smaller ones) seem able to just boost production at will, even without the benefit of western finance and/or technology. Moreover, why is the world’s preeminent power (along with her EU allies) so intensely interested in these aforementioned countries? If you think rationally about it, there can only be one answer.
Apparently you don’t understand the definition of peak oil. When peak oil happens, every country will not necessarly be at peak. Peak oil happens when the increase in countries that have not yet peaked do not produce enough to make up for the decline in the countries that are past peak.
Peak oil is when world oil production peaks and never reaches that production level again, regardless of the cause.
Not necessary – you could have a double peak.
Scenario: After a first peak in 5 years and 10 years decline, international companies and politcs double down all together on Canadian and Venezuela tar sand oil and bring production up there by a large margin ( and a really really huge investment).
This would induce a double peak – but at some time production will go down.
The USA has a similar curve – the conventional peak in the 70s?, a long decline and the future LTO peak. When you look at the USA production curve until year 2000, you’ll have a classical peak oil curve.
I don’t think this will happen – it seams they are doubling down on electric cars at the moment instead, much better.
Not necessary – you could have a double peak.
If you had a double peak, only the highest peak would be peak oil. You can have only one highest peak. That is, unless both peaks are, to the barrel, exactly the same height. And odds against that are millions to one.
Stavros,
We will find out in 2025 when US tight oil peaks, at that point any increases in demand for oil (which has increased at about 800,000 barrels per day each year on average from 1982 to 2018) will need to fill in the decline in US output (which will fall from 14 Mb/d to 10 Mb/d from 2025 to 2035 at minimum), so the oil producing nations that will meet the 8 Mb/d increase in demand, plus the fall in US output of 4 Mb/d (I am not even including falling output from the many other nations that are already in decline) would need to produce at least 12 Mb/d more oil in 2035 than in 2025.
I will submit that it is highly unlikely that World oil output will either increase forever or remain on an undulating plateau forever. Based on reasonable assumptions a more likely outcome is that World oil output peaks between 2023 and 2027, with my best guess being 2025 based on the information currently available.
Note that it does not matter whether it is peak “supply” or peak “demand” for oil. If oil prices are determined by a free market, supply is equal to demand so whether it is supply or demand that has peaked is of no consequence, any difference between the two just changes stock levels. Those cannot decrease to less than zero, so there is a limit to supply shortages.
Ron Patterson Wrote:
“Of course, some oil exporting countries will stop exporting oil.”
Which ones? I think just about every export is dependent on selling oil abroad to support its domestic economy. Perhaps the US *might* stop exporting, but that’s because it will be a net importer. I can’t see the Big producers (Russia, Canada, OPEC Nations, etc) ever quit exporting. But if you can think of nations would & why, I would be interested in your opinion.
Canada would definitely stop exporting oil if they did not have enough oil to supply domestic markets. Ditto for Mexico. Many countries would stop exporting rather than see their population riot because they have no gasoline for cars or diesel for trucks.
Indonesia has already gone from an oil exporter to an oil importer. Other countries will do the same as their oil production declines.
Your correct Watcher. I don’t recall there ever being a general public concern over peak oil for the past sixty years, anyway. Since I was 10. Nor, do I ever remember members in my family, who were in the oil business, ever discussing peak oil. There were some periods of shortages, but peak oil was never mentioned. I never recall hearing the term, until I researched oil blogs, and came across this one. And while it is part of peak oil, I still think the bigger danger is when supply can never cover demand, which may be sooner than peak. And that may be in the process, now.
GuyM Wrote:
“I still think the bigger danger is when supply can never cover demand, which may be sooner than peak. And that may be in the process, now.”
Oil Demand exceeding supply has happened many times. I think we got a preview of it back in 2006-2008. I recall thieves drilling holes fuel tanks of parked cars, Schools planning to cut school to three day weeks, Airlines in near crisis mode (Bankruptcies & forced mergers).
The issue is when Peak Oil happens the world continues to be forced to use less and less every year. I suspect it will be impossible for most nations to make a peaceful & non-chaotic transition. I think the USA probably would double down on its ME wars to secure Oil for itself which will likely trigger other major importers like China & India to take action. Obvious they need a lot of Oil imports to keep their economies functioning.
For the most part, we appeared to have squandered our *second* chance for mitigation. We got about another 10 years of low cost oil, but sooner or later its going to deplete and we’ll be back in crisis mode.
Lol. You recall 2008, I recall the rationing and long, long lines at gas stations in the 70’s. Most of that was a precautionary effort. And that was when gas was cheap. The first thing that will happen, this time, is a gasoline/diesel spike in price. People would have a hard time existing with higher costs, and then there will not be enough available to all. We won’t run out, but it would effectively hobble the economy.
But, it won’t hit the US first. We will be able to watch the news reports of other countries suffering, first. And, they will drag the world economy down with them. And, we may still be posting on this board of the expected date of peak oil while this is going on.
I really don’t think pinning down when peak oil will happen, is as important in relation to when will production increases will not be able to keep up with demand increases, and decline rates. Yeah, you can say that demand and supply will always have to balance, but what about all those people lower on the demand curve that no longer get to participate.
FWIW: I also recall the gas lines in the 1970’s. Odd & even with license plates, etc. But 2008 crisis is more relative\closer to now than the 1970’s. Back in the 1970’s USA tapped Alaska, and the UK developed the North Atlantic field. In both instances 1973 (Arab embargo) and 1979 (Iraq\Iran conflict) it was an artificial constraint. In both cases Oil production increase since Production did not peak.
Guym Wrote:
“But, it won’t hit the US first. ”
True since it will hit the poor nations first that get out priced by the more wealthier\industrialized nations. It was the high oil prices that triggered the Arab-spring rebellions. I am sure will see a lot more again.
Guym Wrote
“We won’t run out, but it would effectively hobble the economy. ”
I suspect Nations drowning in debt and staring down the demographics cliff will be full of strife leading to major riots, crime, and gov’t collapse. Look at what happened to Puerto Rico. Its reverted to a third world economy. PR’s Crushing debt has pretty much permanently destroyed any hope of reconstruction unless the US Federal gov’t does a massive bailout.
As I see it, I see three problems converging in the 2020s: Declining Global Oil Production; Too much debt (Gov’t, HouseHold, Corp), and Demographics (Unfunded entitlements & Pensions, Healthcare costs, lack of appropriate Skilled Workforce). Its like having a table with three legs knocked out.
No argument on those statements.
GuyM,
Demand will decrease as people combine trips, carpool, buy more fuel efficient vehicles, use more public transportation, etc.
There are always those that cannot afford as much as they would like to buy if they had higher income. When I first graduated college and had relatively low income, I found a way to make ends meet, as oil prices rise many people will find a way to get by.
Note that World oil prices averaged about $114/b (in 2017US$) from 2011 to 2014. From 2015 to 2017 that average was about $51/b. The World GDP Growth rate was 2.75%/year over the 2011-2014 period (using market exchange rates).
Also note that people switching to more efficient hybrids, plugin hybrids, and smaller less powerful vehicles creates opportunities for businesses that provide those products. Likewise there will be opportunities for businesses that foresee the coming energy transition and these industries will be growth industries providing employment for those that need to find new employment as the fossil fuel industry gradually shrinks (as depletion occurs). Capitalism though not perfect, is highly dynamic and allocates scarce resources efficiently, but only if properly regulated to account for positive and negative externalities.
All fine and dandy, but middle distillates will go first, right? I know you maintain that trains can help replace trucking, but none of the Wal Marts I have seen have a train stop.
That we will adapt, is highly probable. But, it will be far from business, as usual.
Guym,
I agree it will not be business as usual.
Although I would argue that business as usual has never really existed, except in the sense that things have continually changed over time.
So for me business as usual is constant change and that is likely to continue, though the rate of change is variable with fits and starts.
Things are likely to change, we live in interesting times.
The middle distillates will be used more efficiently for the most important uses as the price rises. Trucks will become more efficient, long haul land transport will move to rail and EVs can replace diesel for short haul routes as barrery prices fall and diesel becomes more expensive.
It won’t happen overnight the transition will occur over 1 to 2 decades (likely 2025-2035+/-5).
Quite the soothsayer?
And what if the fit hits the shan before that period, or are you sure that is the way it is going to happen?
I mean, I have many thoughts about how many geopolitical, and economic events may create a bigger deficit of oil, including tight oil. But, something will happen to change expectations, and it is unlikely that it is anything that I have thought of. Stuff happens.
GuyM,
My expectation is that oil will peak from 2023 to 2027, best guess 2025. I also expect oil prices will rise as a result. I expect things will change (as has always been the case), perhaps the rate of change will increase as high oil prices will change behavior. ( Consider the change in oil consumption from 1978 to 1982).
As to future world wars or major economic crises, this assumes those do not occur until 2030 to 2035. If they happen sooner, things would change, difficult to predict the future.
Not at all sure what will happen, when future recessions, wars, speed of technological development, future oil and other energy prices are all unknown.
It is simply my guess as to how things play out at current rates of technological progress and the absence of major wars or major recessions from 2019 to 2029.
Norwegian production continues to decline and continues to miss NPD forecasts. For November the miss was put down to “technical issues”. One thing that is happening is that that Troll oil rim is declining quickly and the new wells don’t compensate for very long (it is nearing the end of life before phase III gas blowdown starts there so might be expected to be erratic as the water contacts increasingly impact the long horizontal wells and the drilling zone narrows). Another issue may be the rapid water increase on some of the new fields: Fram H and Brynhild came and went in a couple of years; Knarr, Svalin and Boyla have seen steadily declining production as the water cut has grown steadily, almost from start-up; Goliat, Byrding and Ivar Aasen look like they are in the early stages of following the same path. Edvard Greig hasn’t seen any significant water yet and is maintaining nameplate fairly well.
This is water cut – not including the most recent start-ups which are zero so far except for a bit of completions fluid as the wells get kicked off.
They are blaming December’s reduced production on “technical” problems as well: https://www.reuters.com/article/us-norway-oil/norways-december-oil-output-misses-forecast-idUSKCN1PG0K4
BTW, their gas production is coming even lower than anticipated as well. Good news for Russia.
This is the production for start ups since 2014.
GOM, Norway and offshore Brazil were all supposed to be adding production this year. And it looks like the Saudi’s production additions last fall were mostly from storage, not increased production. Slowdown in the Permian. Venezuela and Iran out for political reasons. Political uncertainty, as always, in Libya, Iraq and Nigeria. Could be an interesting year!
The lagged effect of the oil price collapse in late 2014 seems to be finally making itself felt in global oil production statistics. That price collapse will weigh down on production for years to come. In the 2020s we will be able to distinguish between the weak oil producers that can only produce at extremely high prices, and the resilient ones, who can produce at more or less any (realistic) price point. BTW, Iraq is producing at record levels.
Stavros H.
Oil prices among countries are very dependent up strength or weakness of each country’s particular currency.
I think much of the high prices in US $$ from 2010-14 was due to QE and a weak US dollar.
I do agree with you that the countries you mention have much cheaper to develop and produce oil than US shale.
Most conventional US onshore reserves are also cheaper than US shale, but there just isn’t much of that left.
I am sure the countries you mention were cash flow positive in 2016, but the tax receipts impact was too much for those countries to bear, thus they cut production. Also why they are cutting now.
USA is not developing shale in a rational manner, and it is very sensitive to price. Per shaleprofile.com, US shale added 3 million BOPD from 2018 wells, and lost 2 million BOPD from 2017 and prior wells, and that is just in the first 9 months of 2018.
Too much focus on US shale. I’d think OPEC plus Russia would be tiring of this.
Stephen – Interesting yes, that’s about the only good thing to say about living through the beginning of the end of global civilisation. UK will be declining as well, 2018 production is going to be lower than expected (probably a bit under 2016 as a secondary peak) so 2019 may not be as big a decline, but likely the start of an accelerating decline period (gas will be more obviously falling). Iran decline might not just be political – they are looking to use EOR to maintain flow on old reservoirs, who does that if there are fresh greenfield sites available. Iraq is still trying to develop its centralised water injection system and not getting very far. Angola might have run out of new oil once the second Kaomba FPSO comes on stream (the first one doesn’t look so great so far and Total have already approved FID s on new tie-ins there, which would suggest poorer than expected well performance). Oman I think is off plateau but it’s hidden by their cuts, so decline should accelerate – development there is mostly gas at the moment. Saudi projects are now all end of life redevelopment or gas rather than new greenfield or extensions for oil. Eagle Ford and maybe Bakken might be in decline, the price effect seems to have a three month delay on drilling/completions/production so we’ll see. The jury is still out on GoM peak; reported numbers to October average are slightly less than 2017 production – depends on availability for the last couple of months.
Yeah, Stephen. that is what I have been saying. Inventories should be going bye, bye soon.
Inventories will go down. That is the purpose of OPEC’s oil cuts.
https://www.cnbc.com/2019/01/03/opec-is-cutting-more-oil-than-it-planned-says-former-aramco-executive.html
They need $80 oil to balance their budgets.
Hugo,
Inventory levels are already very close to 5 year average levels, the main reason for the cuts is to raise the price of oil. When it becomes apparent that the rate of increase of US tight oil output has slowed, oil prices will rise. This probably will be apparent by May 2019.
That depends on how well the EIA continues to create the illusion of Permian and US growth. I agree, there is some pretty good data on the EIA site, the monthlies the most telling of all. But, not enough people read the good parts. They are keyed in on the Drilling Productivity Report, what’s written in the STEO, and the horrendous Weeklies. All of which, are crap. My bet, it’s later than May, and by then EIA will be touting the new pipelines. If decreases in inventory levels start being scary enough, it will offset BS. But, those big decreases will not even start until the second quarter. Who knows?
If prices stay within, or below the $55 a barrel mark for over five months, it’s a new ball game. Total US production will be down, even if the Permian increases a little. I was looking at a Haynes and Boone report, and borrowing has not slowed down, even with increased profits. Decreased production could slow down new pipeline openings. There at capex definition now, and safe to bottom line. There has been a cutback in completion crews, already. Gearing back up, quickly, is a real question mark. There are a lot of possibilities this year. Could go either way, depending on timing of any oil price increase, and how much of an increase/ decrease.
In the meantime, significant investments outside of US shale will be few and far between, which will ensure that we travel down the path of decreasing supply. And, any decrease in demand will be far outweighed by decreasing supply increases, no matter when peak oil actually occurs.
Yes. There is a saying “bullshit will get you till the top, but it won’t keep you there”. It fits the situation in the oil market. I admire Kibsgaard of Schlumberger to actually be in a position to be quite franc about the US market at the moment and also actually have the balls to stick against the mainstream view (being from the same country as him may make me biased to be fair. I actually know the family name through relatives; admiral in the navy, doctors and such from the north western part of Norway. Impressive people and very good at expressing themselves especially in writing. For sure I am not neutral in the judgement of the SCH boss). I don’t think Halliburton is equal in that respect; more loyal to the US government.
And we don’t have to wait long until OPEC+ (picking their moment as a surprise maybe…) tighten the market for real with no real options left. For sure will happen this year, but most won’t recognise what is happening until it is already a mainstream fact. I think oil prices will go up and that 2H 2019 will be a period to watch, as I and most others in the oil business would have the choice to save for a rainy day or think we are well equipped to weather another storm.
Kol, it was stable before Permian clogged up, and OPEC cut production. With other declines, they don’t have to get more serious about it. Just keep doing what they are doing, pointing at the bullshit EIA statements that over production is near.
The best info on tight oil from the EIA is the “tight oil production estimates by play” at page below.
https://www.eia.gov/petroleum/data.php#crude
since Dec 2016 the linear trend has been an annual increase in tight oil output of 1395 kb/d each year (Dec 2016 to Nov 2018). My guess is that US tight oil will peak at about 9.5 Mb/d in 2025, an average annual increase of about 360 kb/d each of the next 7 years (the rate will be faster in 2020 and then gradually decrease as the peak approaches in 2023).
Oil prices could fall again.
https://oilprice.com/Energy/Crude-Oil/Huge-Backlog-Could-Trigger-New-Wave-Of-Shale-Oil.html
Yeah, it could because of incessant mouthing, but production in the Permian is now limited by physics, until pipelines MAY be completed sometime in the third quarter. And further limited by discounts if they attempt to defy physics.
Hugo,
The DUC data from the EIA’s drilling productivity report is not very good.
A better source is shaleprofile.com
https://shaleprofile.com/2019/01/16/us-update-through-september-2018/
click on well status, then show well status, then choose DUCs.
In Feb 2015 there were about 7698 DUCs in US and they decreased to 5521 in Aug 2016 during a period when US tight oil output was decreasing by about 575 kb/d (April 2015 to Sept 2016).
In Feb 2018 there were 7285 DUCs in the US and in Sept 2018 there were 5549 DUCs, similar to the minimum level in Aug 2016, a certain level of inventory of DUCs is normal and the Sept 2018 level is fairly low, at a level not seen since July 2013 (prior to the low of Aug 2016). The output level of US tight oil was 311 kb/d in July 2013, 4300 kb/d in Aug 2016 and 6750 kb/d in Sept 2018.
The question is how low can the number of DUCs decrease? Probably not very much from these levels. The Drilling productivity report numbers are not very reliable, I usually ignore that report.
A large percentage of DUCs are dead DUCs. Which further complicates DUC counts. They will never be completed. My guess is somewhere North of 30%. There is a three to nine month lag between completed drilling, and completion. Depends upon who the company is using for completion, and their backlog, and cash flow of the operating company. So, a big DUC count is normal. No matter how well the oil journalists understand the subject matter, they all seem to go for creating an effect, rather than reporting all the facts. Even Nick.
Dennis
Thanks for the info
Hugo,
You’re welcome. Note that the shale profile and DPR DUC estimates are pretty similar through May 2018 and then at shale profile the counts decrease while in the EIA’s DPR they increase, sometimes the most recent few months of data at shale profile get revised upward, so possibly the decrease from May to Sept 2018 is just a problem with state level data not being very timely. My guess is the EIA “DPR data” from June to Dec 2018 for DUCs is based on their model which is not very good in my opinion.
I don’t think we have a very good handle on actual DUC counts, probably somewhere between shale profile and EIA DPR estimates is about the best we can guess.
Related:
https://www.zerohedge.com/news/2019-01-24/7-factors-driving-oil-prices-2019
Look like it’s all kicking off in Venezuela where is Fernando for an update.
What does the break in diplomatic relations with Venezeula mean in terms of the oil biz?
There is no official break in diplomatic relations – Trump declared Maduro isn’t president anymore, so he can’t break the relations because he is a “nobody”.
It depends now – when the old regime collapses without noise, oil production can be restored by new investments. A couple 100k/day very fast I think by deliviering dilutant / reopening harbours / droping sanctions / delivering much needed spare parts / paying workers by new credits.
When there is a civil war before, it can collapse to exact 0 for a couple of time. And when Maduro wins it’ll stay round about there.
Yeah, heavily dependent on how this goes. If things spiral such that Venezuelan production shuts down, that’s going to do a lot of damage to the country in general. Which will make restoration take longer, cost more and work from a lower base.
It’s going to have to result in the military taking over, and who knows where it goes from that point. I don’t believe any country will invade and “liberate”. The civilian population defeating the military is a long shot, but not impossible. My guess, not knowing much.
Juan Guaidó, the self declared ‘opposition leader’, is just a telegenic stand in for the right wing leader Leopold Lopez, who in 2014 was jailed after inciting violent protests during which several people died. Lopez, now under house arrest, is a Princeton and Harvard educated son of the political and financial nobility of Venezuela, which lost its position when the people elected a socialist government. Lopez is the man the U.S. wants to put in charge even while he is much disliked. A U.S. diplomatic cable, published by Wikileaks, remarks that he “is often described as arrogant, vindictive, and power-hungry”.
The coup is probably not going to happen—-
(And if Maduro announces that he is recognizing Jill Stein as President of the United States . . ?)
It’s going to take a while to see if Venezuela frees itself from Maduro and 21st Century Socialism. Guaidó needs to push to get the OAS seat (I believe they are still meeting, but I lost my connection). Then he should get control of all Venezuelan state accounts and properties, and that includes CITGO. The cash flow can be used to buy food and medicine and to help refugees. And also to arm an additional army division with officers and soldiers loyal to Guaidó and the National Assembly. This division can be set up fast because there are thousands of army deserters in exile. And when it enters Venezuela it should lead to other army units joining it to take control. It will be tough, but I think the reds can be defeated.
Fernando Wrote:
“all Venezuelan state accounts and properties, and that includes CITGO. The cash flow can be used to buy food and medicine and to help refugees. And also to arm an additional army division with officers and soldiers loyal to Guaidó”
Seems like a lot of “if’s” Unless he gets some major foreign financial aid. I would imagine the Oil infrastructure is going to need a lot of money to recover (ie perhaps in the Billions). My guess in a Coup or Civil war, Thieves and unpaid Oil workers will strip everything that they can sell. Pipes, Fittings, Valves, Pumps, Generators, or anything that can sold for scrap metal
.
It might be quite a long time before VZ can turn around Oil production to generate enough revenue to get VZ back on its feet again.
Fernando Wrote:
“I still think the bigger danger is when supply can never cover demand, which may be sooner than peak. And that may be in the process, now.”
Only if they can be equipped, paid, and fed first. I don’t they are going back to VZ unless their basic needs are met.
I doubt there is much of a market for scrap metal in Venezuela, but there’s little doubt in my mind that desperate people are already stealing and selling anything small enough to be easily transported.
If somebody is willing to provide arms, the people of the country will take them up, in my estimation.
Sometimes armed rebellion is justified.
I know some lefties who used to be sort of wishful about collecting guns here in the USA.
Now they are talking a somewhat different tune, in private, wondering if they may need a gun to protect themselves from and resist what they see as a fascist takeover of our federal government.
The Interamerican Development Bank recognized Guaidó, which really helps in the clash with the Usurper. Right now I’m focused on getting Maduro put out of action, although I’m aware that a recovery plan has been drafted. Unfortunately one of the key contributors is a guy I think is somewhat of a well connected idiot, who doesn’t really know how to manage a field or a project, but pretends he does. Anyway, this isn’t the right time to discuss what needs to be done. First thing we need to do is win this battle in what’s sure to be a very long war, until first Venezuela, and then Cuba are liberated.
It is bizarre how little coverage of the Venezuela news we are seeing in the USA.
I see that some European countries like Spain France and Germany will support Juan Guaido, but only if new elections are called within 8 days. That gives Maduro some big wiggle room.
The EU is well known to support red dictatorships, they have gone out of their way to help the Castro regime for six decades.
The statement issued by the EU is a subtle move to prop up Maduro, and this has already been pointed out by several groups in the European Parliament. It’s also not feasible under Venezuelan law, so it would concede to Maduro tyrannical powers.
Thus either the EU retracts or it will be ignored. Today will be an interesting day, because General Jesus Milano just put out a video on YouTube stating Guaidó is president. He also said he wasn’t about to start a civil war, that army units should side with the people and stop the thugs sent by Maduro to terrorize the barrios (they unleashed groups of murderers who are shooting people and arrested over 1000. This includes a 14 year old Amerind girl who was accused of terrorism for protesting). The natives in Amazonas are either fleeing into Brasil or siding with Guaidó, and Brasil is moving troops towards the north to help this humanitarian crisis.
Since you all are focused on oil issues, I expect oil exports to be cut in half within days.
Five scenarios discussed here-
https://www.vox.com/world/2019/1/25/18195894/venezuela-guaido-maduro-trump-war-future
How do we know Guaidò is the right man and with which right are foreign states allowed to require that Maduro retire? I don’t picture that eg. Theresa May will require Macron to step down because of his low popularity and all the police violance against the yellow vest demonstrants. How many in Venezuela has actually heard of Guaido in Venezuela? 20%?
By now 98% of Venezuelans heard of Guaidó.
How do you “know Guaidó is the right man”? You don’t. What you need to know is that Guaidó was elected president of the National Assembly by a large majority of its deputies on January 10, 2019. The Venezuelan constitution requires the Assembly meet and vote one president, two vicepresidents and two secretaries, therefore the vote was required.
Guaidó got the Assembly to vote for him because the four largest democratic political parties made an agreement in 2015 which led to a deputy from Voluntad Popular being proposed, and voted almost unanimously (54 socialist deputies backing Maduro walked out, one socialist deputy is abroad and actively opposing Maduro).
Maduro’s presidential term expired Jan 10, he’s the expresident. He claims the right to continue with another term because he organized rigged elections on May 20 last year (his popularity was dropping so fast he had the election held months ahead of time in a futile attempt to get more backing). These pseudoelecciones were boycotted by the large democratic parties, so he propped up two fake opposition candidates which of course “lost”.
These elections were denounced as illegitimate by the EU and the OAS, so in a sense they marked Maduro as a tyrant who was executing a self coup.
Most nations don’t really care when a government goes rogue like this, but Maduro also caused a huge humanitarian crisis driving millions of Venezuelans to leave, and they are straining resources in neighboring countries. Plus the human rights abuses are gross. So over the last six months a consensus evolved in countries such as Colombia, Ecuador, Peru, Chile and Brasil that Maduro had to go, he was causing them problems and the current flood of refugees wasn’t slowing down.
The USA has been very careful to follow behind these nations, and didn’t take a more proactive stance until it was told they would back USA moves.
The Europeans are more like the US left, taking the low moral ground and doing what they can to help Maduro survive. But I don’t think they count for much at this point.
So you see, Maduro isn’t “retiring”, he’s an expresident who has evolved into a tyrant, and will probably be forced out of office by brute force if he doesn’t flee to Cuba. I am pressing to have this resolved as quickly and peacefully as possible, but I wrote Vecchio he should get backing to create a new police force with 20 thousand volunteers, a move which will put a lot of pressure on Raul Castro to remove his military from Venezuela because it would be a diplomatic disaster for him if we start capturing Cuban prisoners and putting them on YouTube.
Latest Monday evening: The paperwork is flowing well for the takeover of overseas assets and bank accounts by Guaidó. He will be naming a new PDVSA and CITGO board of directors. The cash flow will be tightly managed using a strict control system to avoid any hint of corruption. This means the oil sold to the US and countries which recognize Guaidó will be paid to bank accounts Maduro can’t touch. I assume Maduro will now try to market tanker loads to India or China. I need to get on the India issue ASAP.
Israel recognized Guaidó. I saw Netanyahu giving a speech to that effect. I also have unconfirmed reports that Israeli troops are in Brasil, ready to go over the border and capture a few Arabs of interest hiding in Venezuela. Don’t take this too seriously.
Maduro chickened out and mumbled a speech about the US embassy. Bottom line they aren’t touching it.
The Venezuelan consul in Miami declared herself loyal to Guaidó.
The kidnapping of the 14 year old Indian girl by Maduro’s FAES (these are like SWAT units which are going around killing and terrorizing) has the natives in the Amazonas tribes seething. There seems to be sone sort of low level warfare in the region.
The town of Tucacas rebelled, beat up the chavista major, kicked her out of town. I saw a video of the melee with a few National guardsmen trying to calm the town to avoid more violence.
Things are going well. By next week we should start organizing the new police force using military deserters and exiles with a military background. Luckily there are about 50 Venezuelans with US military experience and tours in Iraq or Afghanistan, who are willing to help train others and participate in the peacekeeping operations.
I saw a video of a convoy of tank carriers with heavy tanks and armored vehicles heading west. I think the Cubans feel the first incursions will be by Colombian units from Catatumbo? Have no idea.
Still later. Here’s the latest Trump decree
https://www.whitehouse.gov/presidential-actions/executive-order-taking-additional-steps-address-national-emergency-respect-venezuela/
US gasoline inventories have increased to a new record high. The prior high was Feb10th, 2017 at 259,063 kb.
U.S. Petroleum Balance Sheet
EIA pdf file http://ir.eia.gov/wpsr/overview.pdf
Saxo Bank summary
https://pbs.twimg.com/media/DxsEtH4XgAEuBcq.jpg
Oilytics https://pbs.twimg.com/media/DxsF-hmU0AEXdIl.jpg
Latest estimate for Texas C+C output from Dean Fantazzini.
Dennis, unless one has absolutely perfect color vision, and many, including me, do not, these two colors look exactly the same.
Sorry Ron,
Maybe this is better.
EIA Annual Energy Outlook 2019 presents yearly modeled projections and analysis of energy topics
https://www.eia.gov/outlooks/aeo/index.php
US crude oil production projections https://pbs.twimg.com/media/DxsNTnUU0AA9z06.png
Of the fossil fuels, natural gas and NGPLs have the highest production growth, and NGPLs account for almost one-third of cumulative U.S. liquids production during the projection period.
Thanks Energy News,
For tight oil they predict about 114 Gb of output from 2015 to 2050, where USGS has the mean TRR of the US at about 75 Gb and with the AEO reference price case in 2018 the ERR is about 60 Gb, about half of the EIA’s AEO2019 estimate for US tight oil.
Some interesting news related to shale oil production forcast from rigzone. Think this is based on same funtamentals as CEO Shlumbergers latest interview..
https://www.rigzone.com/news/wire/cracks_emerging_in_us_oil_machine-24-jan-2019-157993-article/
George Kaplan,
To get back to some sort of normality in this oil market turmoil, let me try to comment on your posts and great graphs further up in the thread.
“Norwegian production continues to decline and continues to miss NPD forecasts. For November the miss was put down to “technical issues”. One thing that is happening is that that Troll oil rim is declining quickly and the new wells don’t compensate for very long (it is nearing the end of life before phase III gas blowdown starts there so might be expected to be erratic as the water contacts increasingly impact the long horizontal wells and the drilling zone narrows). Another issue may be the rapid water increase on some of the new fields: Fram H and Brynhild came and went in a couple of years; Knarr, Svalin and Boyla have seen steadily declining production as the water cut has grown steadily, almost from start-up; Goliat, Byrding and Ivar Aasen look like they are in the early stages of following the same path. Edvard Greig hasn’t seen any significant water yet and is maintaining nameplate fairly well.
This is water cut – not including the most recent start-ups which are zero so far except for a bit of completions fluid as the wells get kicked off.”
A few things are happening in the Norwegian side of the North Sea. The old giants like Troll, Oseberg and maybe even Ekofisk after a while are rightly underperforming. Snorre (a giant field) late life is the Equinor project focused on next. Maria was the most recent addition of oil fields in 2018, but leveled at 25k/d; well below nameplate capacity. The Capex costs were however also about 20-30% below expectations. Additional greenfields are not doing great in terms of volume or performance. But there were a lot of opportunties in general left behind by the majors on the Norwegian shelf of the North Sea (BP, Total, Exxon etc). And Aker BP, DNO, Lundin and Spirit Energy have purchased the left over portfolios and are making sure that the opportunities primarily in the North Sea, but also in the Norwegian Sea are getting focused now. Aker BP is making a point on recovering much more at Valhall ( a giant with currently only 25% recovery rate). I guess the majors were afraid of decommissioning at some fields which is a cost to be reconned with. Aker BP has a max 35$ break even target for any project going forward and I think that is the norm for the other E&P’s as well. (I guess it is less far from the truth than the shale companies in the US are prospecting). The main story is that overcapcity in the service sector offshore combined with more intelligent subsea solutions and less manpower have reduced break even costs substantially. It is very obvious that oil production in Norway will decline for about a year, and then increase (due to the major Johan Sverdrup field) to whatever short or long term goal the government has. Equinor is operating the field and the company is controlled by the Norwegian Gov. Some sort of steady state production around 1,5 mb/d for Norway as a total will not last more that 10 years; hard to predict overshoot or undershoot. The future will depend on what the gas phrone Norwegian Sea and Barent Sea will contribute in new fields; let’s hope some will be oil. And what about opening of the most promising area, Lofoten. It happens to be a tourist haven as well as one of the best areas for catching sesonal cod (fish), so votes are against in parlament at the moment. You can never be too certain about exploration in the future, depends on seismic and not at least on capital invested. But probabilites are steadily declining, along with average field sizes. The Barents Sea seems to be far from another North Sea so far.
U.S. Set To Pump More Oil Than Russia And Saudis Combined
U.S. Set To Pump More Oil Than Russia And Saudis Combined
By Rystad Energy – Jan 24, 2019, 11:00 AM CST
Join Our Community
In a major shift, the United States is set to produce more oil and liquids than Russia and Saudi Arabia combined by 2025.
In Rystad Energy’s base case oil price scenario, US liquids production is forecast to surpass 24 million barrels per day over the next six years, thereby outpacing the combined output from Russia and Saudi Arabia.
This is only about half the article. Go to the link to read the rest. But I would love to get some expert opinions on the probability of this actually happening. And by 2025 no less.
Also notice they have Russia and Saudi, combined, peaking in 2020. Pessimistic for them but wild optimism for the USA.
Yeah, well, Rystad is convinced that Bakken wells have 700kb of oil (not BOE) on average, which makes them about 100% nuts, or conflicted, or both.
Or possibly just propagandists?
Lets hope they are just deluded—-
Well, it pretty hard for them to have a realistic and objective viewpoint. When your main sources of information is the EIA and E&P input, then reality and delusions mix together.
Rystad probably predicts that the USA will start tapping the outer gas giant planets and moons for Hydrocarbons. Imagine Giant Space freighters bringing back an entire years supply in one trip!
(I am joking by the way)
Or perhaps it includes US’ latest confiscations of oil rich countries such as Venezuela and Iran. Just to give the countries true democrazy of course.
And I wish I could claim I was only joking.
Mr. Patterson
The descriptions seem a little confusing as the article describes oil production then expands to oil and liquids.
The notes under the chart clearly include oil, condensate, and natural gas liquids with a base case of $58/bbl WTI.
There should be no doubt that a massive increase of NGLs is coming as the multi hundred billion dollar buildout of infrastructure – especially petchem projects – turns into ongoing, operating facilities.
Likewise, the ethane and propane currently coming from US shale is the cheapest on the planet and will continue to be a sought after source of feedstock for global petchem operators.
The biggest constraint is the infrastructure which includes pipelines, processing plants, fractionators, storage, ports and even ships.
Production from Oklahoma, southwest Pennsylvania, West Virginia, Ohio and the Permian could reasonably contribute to the stated figure of 24 MMbld liquids by 2025 … or come pretty close.
If I remember correctly the decline rate of current LTO wells is a combined 500,000 barrels/day. So if the LTO production doubles, the combined decline rate will also double to something like 1,000,000 barrels/day or 12,000,000 barrels/year. This is a hell of treadmill to overcome — is this even physically possible?
This is interesting reading, from what I have seen here in Norway oil, gaz and condensate are separated on the platforms. There are exsports pipes for oil , and gaz. Some are transported by tankers. As I have understod in US there is sites where gaz , LNG is prodused and other produsing shale oil that also have some other liquids and gaz. I believe most of this increase will be in Areas where there is huge resourses of shale gaz if there is investors willing to pay new infrastructure, pipelines . What we know is when oil price drop to a level that makes projects not profittable oil Companys stop investing. When that happen to shale oil the impact of decline rate each well will be clear for everyone also EIA. Else in Norway there isstill lots of gaz left as first the oil is prodused from the reservours and I believe that is also similar other offshore fields. One majour oil discovery is now built out Johan Sverdrup that is an elephant but such discoveries happen very seldom here. Statoil and other have increased drilling budget for the comming years but if that will leads to new significant discoveries in barents sea remains to see. I believe peak oil here happens many years ago and future discoveries will be limited.
Propaganda Alert! Propaganda Alert! Propaganda Alert!
Guaido plans Citgo leadership shakeup, new Venezuela hydrocarbons law: sources
https://www.spglobal.com/platts/en/market-insights/latest-news/oil/012419-guaido-plans-citgo-leadership-shakeup-new-venezuela-hydrocarbons-law-sources
no comments re recent dpr? i find it interesting to see that productivity per well is droping or at least leveling off now in all basins…
I really never have any comment on the dpr, other than it is crap.
From their site:
Productivity estimates may overstate actual production which could be limited by logistical constraints.
The Drilling Productivity Report uses recent data on the total number of drilling rigs in operation along with estimates of drilling productivity and estimated changes in production from existing oil and natural gas wells to provide estimated changes in oil and natural gas production for seven key regions. EIA’s approach does not distinguish between oil-directed rigs and gas-directed rigs because once a well is completed it may produce both oil and gas; more than half of the wells produce both.
Footnotes:
1. Oil production represents both crude and condensate production from all formations in the region. Production is not limited to tight formations. The regions are defined by all selected counties, which include areas outside of tight oil formations.
2. Gas production represents gross (before processing) gas production from all formations in the region. Production is not limited to shale formations. The regions are defined by all selected counties, which include areas outside of shale formations.
3. The monthly average rig count used in this report is calculated from weekly data on total oil and gas rigs reported by Baker Hughes.
4. A new well is defined as one that began producing for the first time in the previous month. Each well belongs to the new-well category for only one month. Reworked and recompleted wells are excluded from the calculation.
5. Rig count data lag production data because EIA has observed that the best predictor of the number of new wells beginning production in a given month is the count of rigs in operation two months earlier.10
The whole thing is full of computing apples and oranges trying to get how many bananas. The one most glaring error is number 5 above. Two and a half months would be optimum, most are later than two months. I have no idea how they came up with this two months bullshit. Every month in Texas, there are a substantial number of wells permitted, drilled, and completed for gas production. In those, there is rarely any significant liquids, other than some condensate, or LPG. I am pretty sure that recompletions in Texas include a lot of previous DUCs, why would you drop those? And they are including oil and gas from all formations in the region. Permian has about 30 formations, many are conventional. One big one is being developed for gas. Eagle Ford, not as many, but still substantial. Also, the EF area includes some huge wells that were developed in the Austin Chalk, and are NOT EF wells. Over a million barrels a day that I know of that are included from conventional sources, and different formations. And these are only the most glaring errors.
The report makes no attempt to match actual production from a well, because it is trying too hard to be forward looking. Which simply is not realistic. Especially, when you turn your back to reality. Is it accurate? Well, I once read that the chances of an electron’s orbit of a hydrogen atom reaching Mars was on a probability curve, so I guess its possible.
Thanks Guy M., very interesting information related to how shale plys there are developed. From what i understand the core is as follow:
1. When develop a shale field they start with the Area that have the best production rock. This Area is called sweet spots and is usualy below 10% of total Area in the shale field. They want to.drill as tight as possible within this areas to get out as much as possible of the oil with lowest cost. If space between latheral to small frack hits occour. There are signs that shows core Areas in Eagel Ford, permian starting to reach their limit for number of wells as frack hits increase cost significant.
2. Some have started to drill outside core Area, as this might be profittable with oil price WTI 60-70.usd/ barrel but guess this now have stopped with price 50 usd.
3. Last week 24 oil rigg was demob. from shale oil fields , most from permian. The highest number in years, it is exspected this trend will continue.
4.There are news that investors are now nuch more sceptical to invest , as they have not get the profit they was promissed. This might have to do with it is proven the wells give 10% less oil than they forcast.
Bsed on the above I believe still there are reas that priduce profittable oil at 50 dollar but thoose are not as many as before. I also believe if they drill outside core Area the result will be less oil each well and higher depleation rate. The improvement in tecnology like longer latherals , more drill bore each rigg to increase utilization i.e have soon be fully utilized. As a Engineer I admire the work they have done for at least 5 decades , and I believe it is now more an Art as some say but in my mind also tecnology have a limit, and I am not sure if the reduction in drill rigs , fracking we now see is related to pipeline constraints or simple the fact that the investors start to doubt they will get back their money…
I think your understanding is pretty good. As to why there is a pullback in rigs, I think both reasons are the cause. In the Permian, the constraints are the major issue. In other fields the price, borrowing sources, and investor backlash are probably the major reasons.
I guess the drilled but uncompleated wells (DUC) is mosteky only drilled . Remained will than be production pipe, fracking stages each 300 feet aprox. BOP and some pipe arrangement. In additional propant after fracking , some liquid /chemical as oil,gaz flow better. Guess laterials now might be 15000 feet horizontal section , and well price compleated might be as much as 10 mill. usd. How much cost remain average to compleate a DUC ? 75%?
Different for wells, but rough guess is 65 to 60% more capital required from drilling through completion.
Some international inventories week/week changes (million barrels)
Total Distillates: +3.94 (shown on chart)
Light Distillates: +3.55
Middle Distillates: -3.20
Heavy Distillates: +3.59
Chart https://pbs.twimg.com/media/DxxZIVRWkAIibLQ.jpg
Light & Middle https://pbs.twimg.com/media/DxxZoFwWoAEjUi0.jpg
US inventories week/week changes (million barrels)
Total (Crude + Products): +13.2
Total Distillates: +5.19 (shown on chart)
Crude Oil: +7.97 (shown on chart)
Light Distillates: +4.05
Middle Distillates: -0.04
Heavy Distillates: +1.18
Propane & NGPLs -6.77 (not included)
SPR no change
Chart https://pbs.twimg.com/media/DxxaYdNXgAA9Gxd.jpg
Gasoline https://pbs.twimg.com/media/DxxcAiXXQAEX0mM.jpg
Its an interesting conundrum.
https://oilprice.com/Energy/Energy-General/Gasoline-Overproduction-Leads-To-Negative-Margins.html
I think middle distillates will just have to suffer some. We have been importing more oil to keep up the production.
Last week’s announcement by the huge utility, Con Ed, that it is placing a moratorium on new gas hookups for southern Westchester has created quite the firestorm.
Many developers who stand to lose BIG bucks by the de facto new building halt – along with several municipal governments who will see a screeching stop to urban re-development plans – are all up in arms about this new state of affairs.
Despite backwater regions like western Massachusetts and upstate New York bitterly complaining about similar moratoriums for years, the size and scope of this latest brouhaha has the potential to affect the broader anti hydrocarbon movement as the spotlight will shine brightly on these imminently looming, severe consequences of shunning hydrocarbons in a modern day setting.
Interesting times a’comin’.
Job Cuts At Enigmatic Apple Car Project Underscore Self-Driving Tech’s Hard Realities
https://www.forbes.com/sites/alanohnsman/2019/01/24/job-cuts-at-enigmatic-apple-car-project-underscore-self-driving-techs-hard-realities/?utm_source=TWITTER&utm_medium=social&utm_content=2100881721&utm_campaign=sprinklrForbesMainTwitter#5eae676c4b57
Baker Hughes U.S. Rig Count
Oil: +10 at 862
NatGas: -1 at 197
Permian +3 to 484
Williston +2 to 58
http://phx.corporate-ir.net/phoenix.zhtml?c=79687&p=irol-reportsother
Texas side actually went down 4, it was the NM side of the Permian that increased.
Is there any way of knowing if the Permian +3 rigs are oil or gas or a combination
The Baker Hughes spreadsheet is the only one that I look at, it says that all the rigs are designated as oil. There are subscription rig counts that give more details.
Baker Hughes – North America Rotary Rig Count (Jan 2000 – Current)
Ovi, They’d be a combination in that area. Gas will likely be flared a lot.
Limited spare capacity even with a “cutback”.
https://www.cnbc.com/amp/2019/01/24/oil-ceo-majid-jafar-says-oil–prices-to-sit-between-60-and-80.html
Concerning Venezuela. Suppose Maduro has a majority. Suppose the election victory of just last year was correct. Oh, maybe there were voting irregularities and the opposition, some of them, chose to boycott — but his win was pretty big. Suppose if the opposition had not boycotted he still had won, but by a smaller margin.
Well, I guess those folks are misguided so it’s okay to overthrow the democratically elected government . . . because they are misguided. As they were when they elected Hugo Chavez in 2000 with 60% of the vote. Then in 2007 he ran again and won re-election with 63% of the vote. The international community didn’t challenge his victory. He won again in 2012 by a smaller margin, undergoing cancer treatment at that time. The opposition accused him of “spreading largesse to the lower class” (his political base — as if this is somehow unusual in any country’s politics).
So 3 times in this century socialism has won election in Venezuela, no, sorry, make that 4 times. Maduro won last year and he was Chavez’s heir apparent, who persistently defeated all challengers.
He and Maduro got elected. Over and over. That’s what the people want. Misguided people who I suppose must be silenced.
BTW useful to note that in the 1980s and 90s healthcare and nutrition were generally poor in Venezuela. Chavez took advantage of that to win his first election, and then embarked on his program to funnel resources paid for with oil to the lower class. The upper class has never liked it. So they want it stopped, regardless of democracy.
Democracy
You must be deranged
https://www.theguardian.com/world/2017/aug/01/venezuela-maduro-government-opposition-leaders
Your suppositions are wrong. If you wish feel free to follow me on Twitter, I retweet once in a while what’s going on. I don’t retweet videos showing people getting killed or tortured (the snuff and torture videos appear to be released by the regime to terrorize the population), but I do show protests, repression where the regime forces fire guns but there are no corpses, and people screaming at them from the buildings in the area.
Your folks are somewhat 2nd string players. This stuff about being elected to the national assembly is milquetoast. You are going to have to get some claims of nerve gas used on the populace. That’s the 1st string stuff and what it takes to get bombing missions scheduled out of the Pentagon.
Get to work on that. And hey, it’s not that hard. You don’t have to have the gas be anywhere near the oil fields. Just get some smoke on video in Caracas and claim it is chlorine, then trot a doctor out to the microphone to talk about the chlorine symptoms.
The change process is going well. This statement was issued yesterday
Statement by a Treasury Spokesperson on Venezuela
January 25, 2019
Washington – A U.S. Department of the Treasury Spokesperson today issued the following statement on Venezuela:
“This week, President Trump recognized Juan Guaidó as the interim President of Venezuela. Diplomatic and economic relations between the United States and Venezuela must be consistent with the United States’ recognition of Juan Guaidó and the National Assembly. The United States will use its economic and diplomatic tools to ensure that commercial transactions by the Venezuelan Government, including those involving its state-owned enterprises and international reserves, are consistent with this recognition.”
I assume you understand what it means?
FernandoL,
Bloomberg reports that Netanyhu announced Israel’s support for the opposition in Venezuela.
Well, he does have an election coming up, I think. Though why that would matter I don’t know.
Here’s a really funny video, Maduro making a video where he fakes waving at a crowd. He’s lost so much backing his own propaganda people are showing how his TV appearances are rigged to show he has some support.
https://twitter.com/alvisepf/status/1089086587755995136?s=21
Venezuela – Trump’s Coup Plan Has Big Flaws
https://www.moonofalabama.org/2019/01/venezuela-trumps-coup-attempt-is-based-on-a-seriously-flawed-plan.html
We shall see——
It’s over cooked baloney written by people who know nothing about Venezuelan politics.
Watcher- “Misguided people who I suppose must be silenced”-talking about voters.
Good to know where you stand on democracy.
“Coup” is a word avoided by corporate media when not quoted from Maduro or his supporters; as Reed Richardson noted, an AP profile (1/24/19) of Guaido referred to his naming himself president as a “standoff,” a “challenge,” an “uprising,” a “frontal assault on Maduro’s authority” and a “restoration of Venezuela’s democracy”—but never a “coup.”
This should get even more interesting—-
(Liberals will side with fascists against socialists, etc)
The Prez is likely not the engine behind this. He has a particularly wacko array of Deep State foreign policy advisors who are raging that he had the gall to ignore their desires in Syria and instead, withdrawl.
So now . . . they pivot.
Notice how the US, under any president, generally doesn’t pursue regime change anywhere there is no oil?
We could say Maduro carried out a self coup when he decided to create his own Assembly after losing the assembly elections in 2015 in spite of his attempt at massive fraud.
Apropos of nothing in particular, I recently stumbled across this interesting book and its discussion of the failings of the Macondo BOP (Chapter 6), especially of the blind shear rams, probably old news for Mike but interesting for a layman.
https://www.nap.edu/read/13273/chapter/6#63
tl;dr – The BOP failure should not have been the surprise that it was.
US diplomat convicted over Iran-Contra appointed special envoy for Venezuela
(Elliott Abrams, who was linked to failed coup against Chávez, to join Pompeo to urge security council to recognize Guaidó as head)
https://www.theguardian.com/us-news/2019/jan/26/elliott-abrams-venezuela-us-special-envoy
Well, at least no embarrassment is involved–
God bless President Trump for helping the Venezuelan people.
Let’s hope he can find it on a map.
May possibly be his Bay Of Pigs.
But maybe Venezuelan Oil can be brought back under elite control?
I’m advocating the use of CITGO’s cash flow to create a heavily armed police force with about 20 thousand volunteers, who will enter Venezuela in 3-4 fronts to create liberated areas, and recruit additional law enforcement units. This will create an environment where existing Venezuela Army units will support them, and together they can gradually liberate the country.
The initial phases will require the destruction of all air assets loyal to Maduro, but those are very few, poorly maintained, and its likely some pilots will take those planes and helicopters and flee to liberated areas.
I describe what I think should be done because I want the few remaining chavistas to understand that they are about to get squashed, and that it’s better to surrender under the terms that were offered yesterday by President Guaidó.
Flaring – we have to wait 9 months for the 2018 natural gas flaring report
2018-10-24 (S&P Global) U.S. flaring data is collected from producers by state agencies, who then share it with the U.S. Energy Information Administration. The EIA in turn aggregates and publishes the information on an annual basis, but after a nine-month delay.
https://platform.mi.spglobal.com/web/client?auth=inherit&sf200858251=1#news/article?id=47199929&cdid=A-47199929-12062
EIA data up to 2017 https://www.eia.gov/dnav/ng/ng_sum_lsum_a_EPG0_vgv_mmcf_a.htm
You can look at the Satellite images Mike provided, and can tell that is not right for New Mexico.
The world is swimming in $244 trillion of debt
(I know Oil Slick Dick said this didn’t matter- but)
https://markets.businessinsider.com/news/stocks/debt-around-the-world-hits-244-trillion-near-record-2019-1-1027872023#
The quote was deficits don’t matter. Not debt.
The only way to deal with debt of the magnitude that exists is with inflation, which has been scarce.
It’s generally popular to wave hands in the air and declare that excess Central Bank money creation (where excess is defined as creation in the absence of GDP growth) is the source of all inflation. The US created 23% of GDP in about 6 years and would love to have inflation as high as a reliable 2.5%, but it just has not happened. The even better example is Japan, whose money creation dwarfs all others, and they can’t get anywhere near 2% inflation.
There is no particular sign that inflation is going to arrive and shrink debt. There is also no international bankruptcy court to expunge the numbers.
The most likely scenario is a coordinated, orchestrated effort on the part of all central banks to buy up each other’s debt. All the central banks will then refund interest paid to them on this debt that they hold and that debt will then mature, various country Treasuries will return the principal at date of maturity, which will be refunded to the relevant Treasury and the debt will disappear over 5 or so years.
Never ever forget money is a substance created from nothing. Nothing about it has to make sense or conform to any physical law.
I stand corrected Watcher—–
A word from the elves.
https://www.dailyfx.com/forex/technical/article/fx_technical_weekly/2019/01/25/Crude-Oil-Forecast-Sharp-Rebound-Appears-Set-To-Continue.html/amp
Us stocks are about to to roll over technically. and test lows. Should take CL with it lower. If you look at the monthly candlestick chart on CL it’s a make it or break it kind of month.
Yes, if stocks tube, then commodities (CL) will tube, too. We’ve seen that recently. My guess is that it is to get into a cash position, as much as possible. People who invest in commodities, usually invest in the stocks, too. They will sell to either cover margins, or simply to be in a “safer” cash position. But, commodities will eventually fare better than the market.
Also, affected by hedging:
https://www.bloomberg.com/amp/news/articles/2019-01-25/sinopec-says-it-lost-688-million-on-misjudged-oil-prices
Only thing i don’t like about dailyfx.com technical analysis is they are only showing half of what they should on their chart. There is a long term trendline coming off the lows from 2009 that put CL in a massive falling wedge. Which is bullish but not until it breaks the trendline coming off the highs of 2008. There is still room for oil to fall to $20 or less before rebounding and challenging that 10 year trendline.
Chart – some countries that have already reported their December production (The list is on the chart). Their average production in 2018 was almost flat with the average in 2017
(Still waiting for Brazil, Canada & USA etc – Petrobras has already reported its Brazilian production: up +99 kb/day in December from November).
Chart https://pbs.twimg.com/media/Dx7-ktCX4AAj3ev.jpg
Mexico revised down its 2018 production by an average -18 kb/day. Due to less light oil production than previously reported.
Chart https://pbs.twimg.com/media/Dx8ANy_WwAEsGvl.jpg
China crude oil production +66 kb/day in December m/m
https://pbs.twimg.com/media/Dx8CryqX0AAHhkP.jpg
There is talk of the FED rebalancing their portfolio. Sell or allowing their long dated anything that is over 5 or 7 year bonds to mature. Rolling everything over into short term debt. Which would put upward pressure on long dated bonds. It is basically the reverse of operation TWIST. Market will sell this news. Not good for stocks or commodities. But as markets rollover people will buy the long end of the bond market as a flight to safety. Pushing long term yields right back down. This is how the FED finds buyers for the debt that it holds. This sucks money out of everything including shale oil. Because it’s no longer the FED with unlimited money buying the long term end of the bond market.
It also gives them cover for the resulting market crash. They can show you that they aren’t allowing their balance sheet to shrink anymore nor are they raising interest rates anymore. So it can’t be anything they did. They can cut interest rates and market still tanks. So it can’t possibly be anything they did. Right? Right. They are popping the bubble they created. It’s just what they do. So they can start from the bottom a blow another bubble just as big as the current one we are in.
https://oilprice.com/Energy/Energy-General/Trouble-In-Paradise-For-US-Frackers.html
2019 capex is not looking so bright.
https://home.treasury.gov/news/press-releases/sm594
So much for Venezuelan oil for awhile.
Also,
https://oilprice.com/Energy/Energy-General/Political-Crisis-In-Venezuela-To-Reshape-OPEC.html
The General probably won’t have a desk to sit at to try to run opec.
Most interesting development. If Venezuela ships oil to US, then the payments will have to go to his opposition. So, needless to say, PVSDA is over shipping to the US. But, who knows how much in payments haven’t been paid yet to PVDSA for oil already received. Citgo profits go to the opposition. Now, we are about 400 to 700k bpd short on heavy oil, and Sauds are producing and shipping less heavy. Not helping with the middle distillate situation
2019-01-29 (S&P Platts) The sanctions announced Monday immediately prohibit US exports of diluent to Venezuela, which will likely hinder PDVSA’s ability to produce and market its crude.
The loss of roughly 120,000 b/d of US diluent could accelerate the decline of Venezuela’s oil production, creating a tight supply picture for the start of the summer driving season and the potential lifting of Iran sanctions waivers in May, according to ClearView analysts.
https://www.spglobal.com/platts/en/market-insights/latest-news/oil/012919-factbox-us-sanctions-pdvsa-creating-likely-major-diversions-of-crude-diluent-flows
Maduro won’t last that long. As you will recall I wrote about Venezuela production dropping after the January 10 event. We are in the middle of a power transition, which is supposed to happen with a minimum of violence. But it’s really hard to make predictions when there are so many moving parts and information can be so unreliable.
I noticed CNN en Español and BBC were not providing reliable information about Venezuela, their coverage was slanted to discredit Interim President Guaidó. However, yesterday I saw Fernando del Rincón interview him and he was very balanced. So it looks like the fake news may be getting stopped as CNN management realizes they can’t lie all the time about something like this.
To give you an update, there’s a small number of Venezuelan diplomats issuing videos in which they announce they change allegiance to Guaidó. About an hour Guaidó named about 12 ambassadors, mostly to Latinamerican nations. One of them was really interesting: ambassador to the Republic of China (Taiwan).
I think you heard about the Bolton notebook caper, hinting the US is sending 5000 troops to Colombia. I think it’s a bluff. It made Maduro move the little armor he had left towards the Colombian border. To me it makes more sense to take a region where the population is really hostile to Maduro, near the coast, with a landing strip capable to take C130’s and land a Venezuelan police force. For example a little town called Tucacas rebelled yesterday, it doesn’t have an airport, but the highway into town has a very straight stretch a C130 can use. From Tucacas it’s fairly easy to block the Valencia road, take Puerto Cabello, and also move west towards Coro. That Venezuelan police force can recruit police militia volunteers in that area, then hop to Lake Maracaibo and take Maduro’s soldiers (if any) in a pincers movement, with Colombian soldiers providing one of the jaws. This assumes the US will provide fraternal assistance and destroy any armor or artillery units loyal to Maduro from the air. But I think they’ll turn loyal to Guaidó as soon as they understand they are trapped.
2019-01-29 (Bloomberg) PDVSA’s Angry Creditors Prowl the Caribbean for Oil to Seize.
Suppliers are using courts to block tankers from leaving ports. At least four companies have used the tactic since U.S. oil company Conoco Phillips successfully arm-wrestled PDVSA, in Dutch Caribbean courts last year as part of a global legal war to recoup a $2 billion arbitration award.
https://www.bloomberg.com/news/articles/2019-01-29/pdvsa-s-angry-creditors-prowl-the-caribbean-for-oil-to-seize?
Conoco will get the seized property back, with a 30 year license. The others we will see.
EIA Monthly Energy Review released today (updated to October)
https://www.eia.gov/totalenergy/data/monthly/index.php
Table 11.1b World Crude Oil Production
October 2018: 84,064
October 2017: 81,392
Average 2017: 81,092
Chart https://pbs.twimg.com/media/DyCGZrfX4AEKqAz.jpg
Without the USA or Canada
https://pbs.twimg.com/media/DyCGrzFXQAEZ2O9.jpg
Thanks Energy News,
Chart below has trailing 12 month average C+C output for World and World less US, World less US was pretty flat for 2018, the increase in World output in 2018 was mostly due to increased US tight oil output. Part of my reasoning for a 2025 peak in World output is that US tight oil output is likely to peak in 2025 based on USGS mean TRR estimates, US EIA AEO reference price predictions and reasonable economic assumptions for well CAPEX and OPEX, transport costs, royalties, taxes and fees.
The peak in US tight oil output is likely to coincide with the peak in World oil output with 2024 to 2026 being the likely range of when this occurs.
Dennis, I think you are overelooking the fact that US shale production will slow dramatically long before it peaks. That slowdown will be enough. That is, although US production may continue to increase for a few years, that increase will not be enough to overcome the decline in the rest of the world.
Yeah, that is what I have been saying. It probably wont keep up with declines. 2019 will be a slow, very slow year in increase, if at all (pipelines are still a question). It will just take a while in 2020, for it to start kicking up. You give an average of around 400k bpd average until your peak. Assuming a larger growth amount in the first years, which is reasonable. Even if they get pipelines in by 2020, that year will still be lower, as then there will still be getting problems getting all that extra shipped out, until probably late 2020. So, then we are looking at 2021 as the bigger growth year, but we are fighting declines, which, by then, I think will overwhelm the growth. JMO
Look at this chart from IEA
https://www.iea.org/newsroom/news/2018/november/crunching-the-numbers-are-we-heading-for-an-oil-supply-shock.html
Thanks Guy, I am saving that link for a later post.
Korean consumer demand, there was a deeper October dip than seasonal average (I don’t have any insight into Korean demand I was just looking at the dip)
Chart https://pbs.twimg.com/media/DyEpojYXgAA1bxt.jpg
The dip is mostly due to naphtha but also diesel and gasoline too
https://pbs.twimg.com/media/DyErEj_WwAIwL2a.jpg
The EIA’s MER to October
https://pbs.twimg.com/media/DyErMGDWkAEKkJu.jpg
[…] Das geht z.B. aus den OPEC-Produktionszahlen vom Dezember 2018 hervor, die auf peakoilbarrel.com zusammengefasst und mit Graphiken versehen wurden. […]