All OPEC data below is from the September OPEC Monthly Oil Market Report. The data is through August 2020 and is in thousand barrels per day.
NOTE: This new theme is screwing up the size of my charts. It seems it has a size threshold where they have to be slightly larger than my input charts to show up larger. I will have it fixed by next my next post where all the charts show up larger.
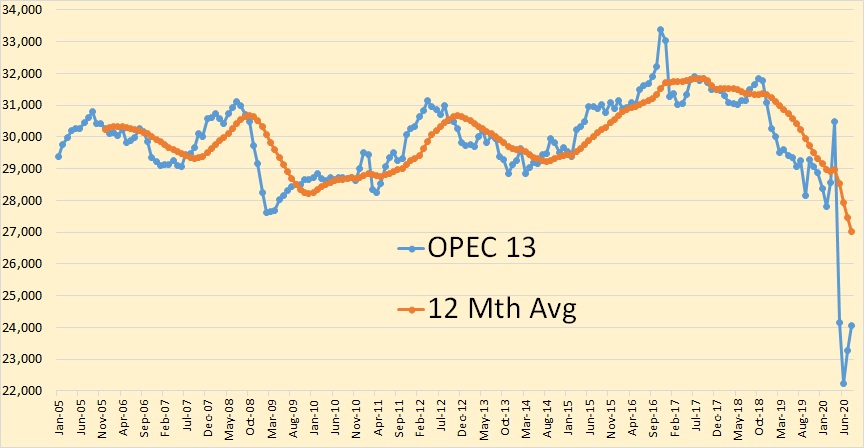
OPEC 13 crude only production was up 763,000 barrels per day in August. However, that was after June production was revised upward by 50,000 barrels per day and July production was revised upward by 110,000 barrels per day.
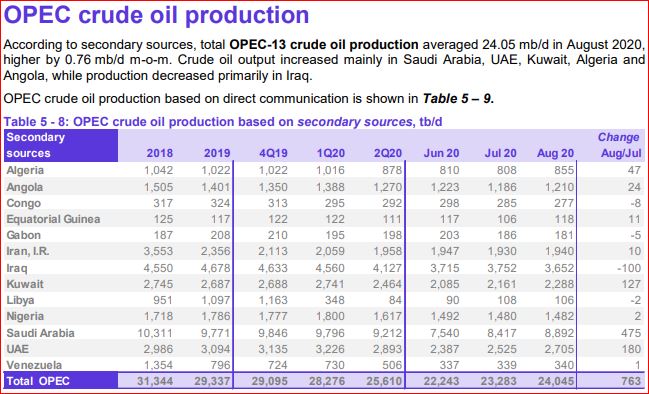
This is the data used in the charts below. It is basically a composite of reports by several production tracking agencies.
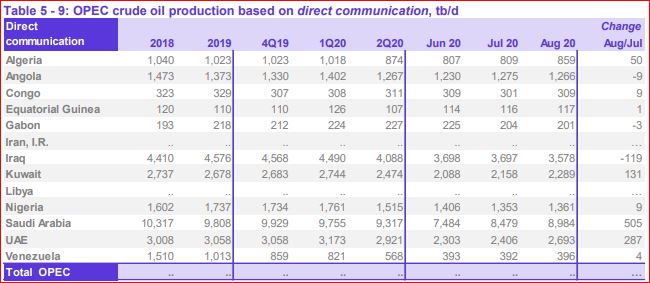
OPEC Headquarters called each member nation and the above are the numbers they received.
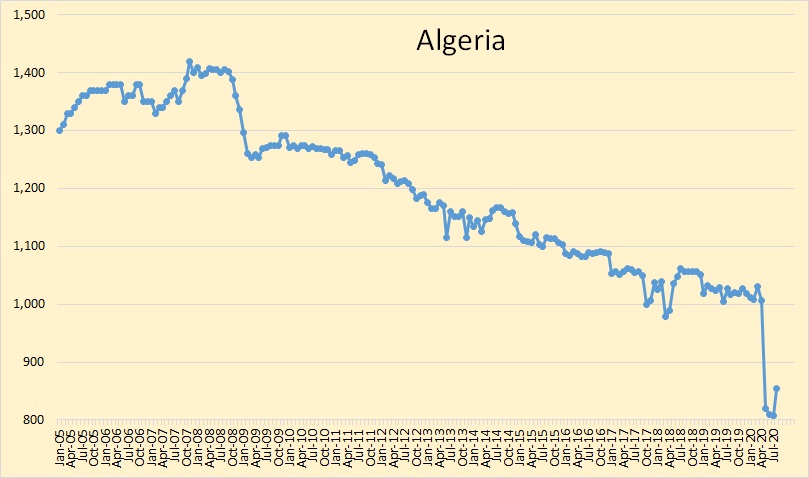
Algeria crude oil production was up 47,000 bpd in August.
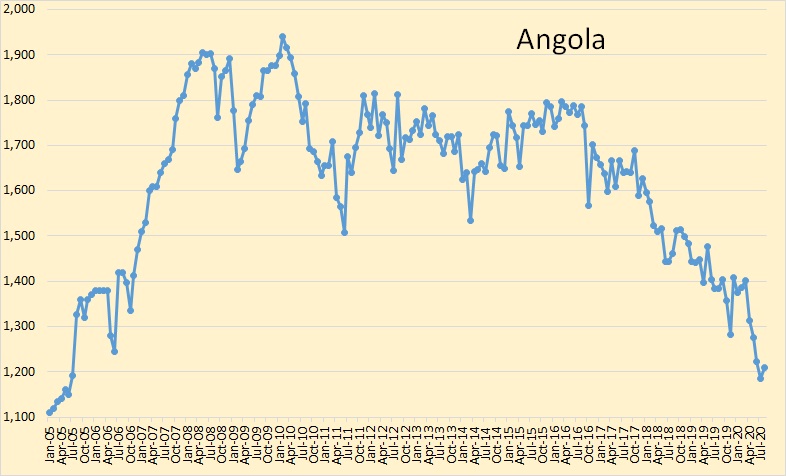
Angola production was up by 24,000 bpd in August.
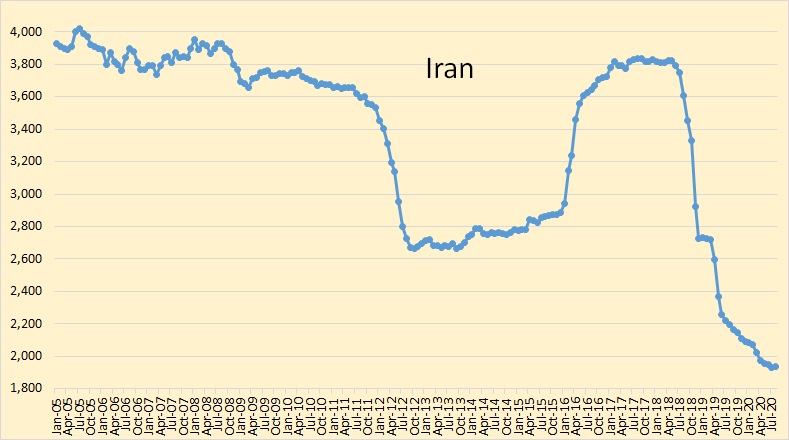
Iran seems to have bottomed out at just under 2,000,000 barrels per day.
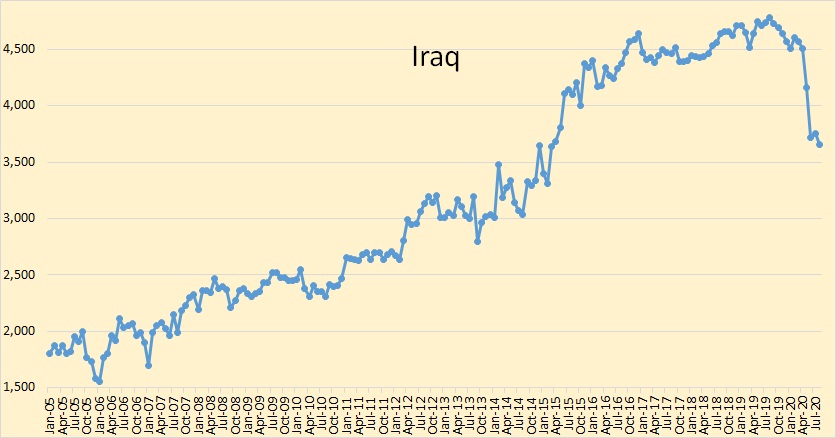
Iraq was down 100,000 barrels per day in August. They should have increased production like Saudi, UAE and Kuwait. They din’t. Strange.
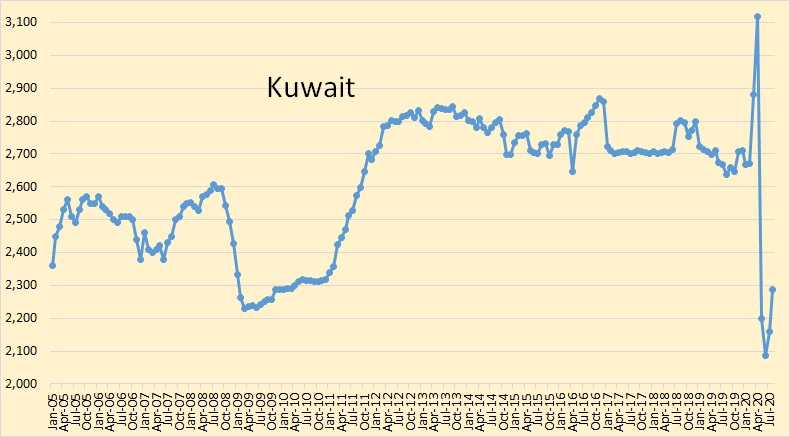
Kuwait was up 127,000 barrels per day in August.
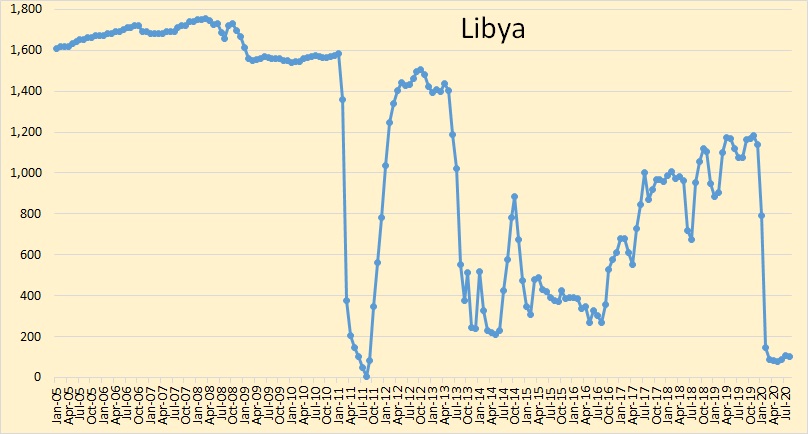
Libya should have increased production in August. They didn’t.
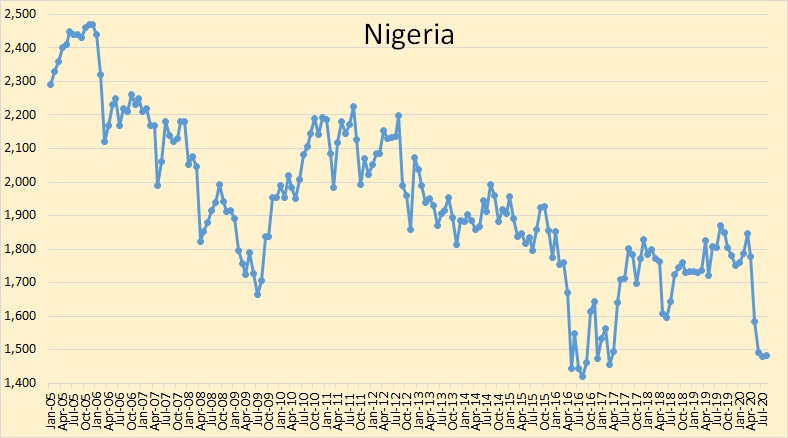
Nigeria is still having rebel problems.
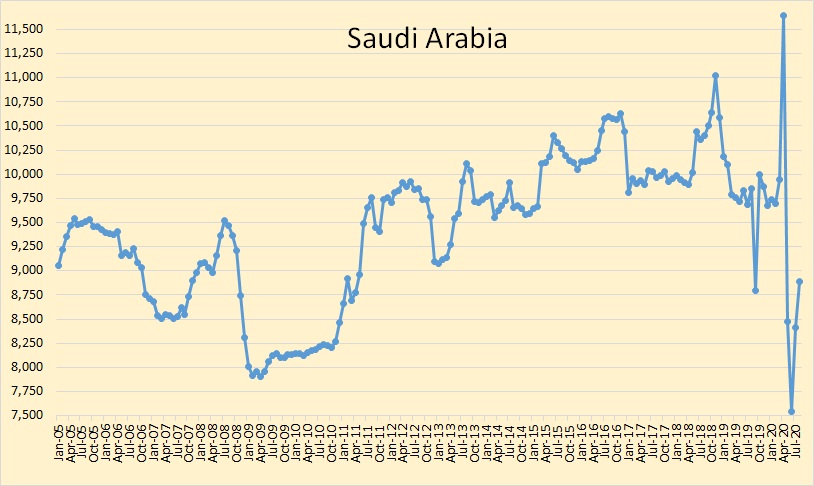
Saudi Arabia increased production by 475,000 barrels per day in August.
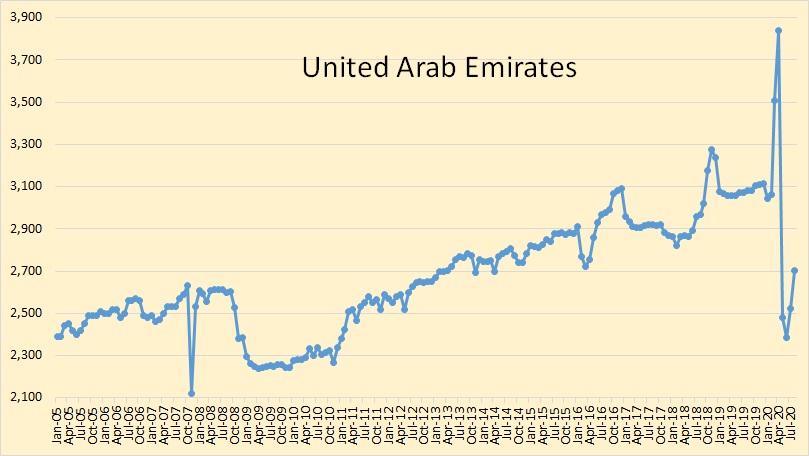
UAE crude oil production was up 180,000 barrels per day in August.
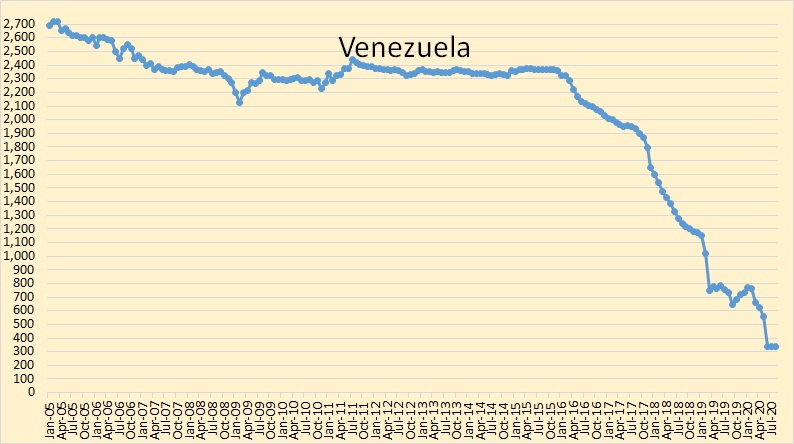
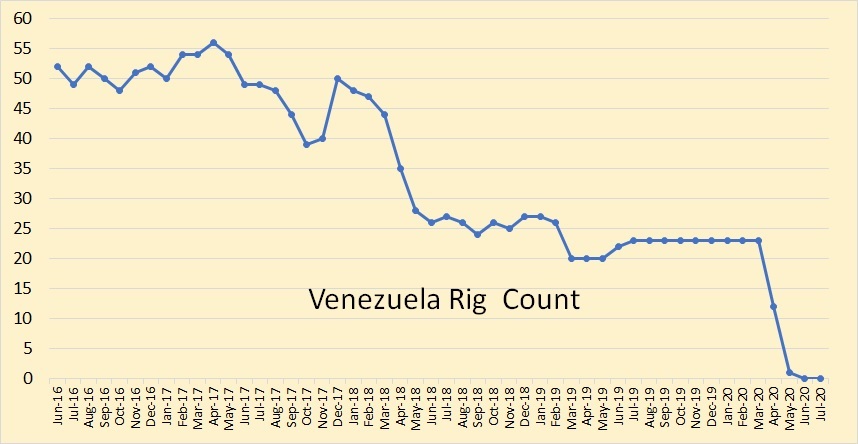
Venezuela production held steady in August. That will change soon. They have a strong possibility of going to zero soon.
Venezuela Faces The Real Possibility Oil Production Dropping To Zero Bold Mine
Analysts predict Venezuela’s oil production could fall to zero by 2021. Industry consultancy IHS Markit estimates that Venezuela is pumping around 100,000 to 200,000 barrels daily and that production will keep falling. The perfect storm of sharply weaker oil prices, economic breakdown and U.S. sanctions could very well see the unthinkable occur, the fall of a major global oil producer and founding OPEC member. While an oil production recovery is possible, it is someway off because of the immense capital, skilled labor and infrastructure required.
The impact on Venezuela’s already failed economy will be immense, leading to greater starvation in a country already reeling from a major economic crisis. It is feared that the Venezuelan state could implode, creating further instability in a region marred for decades by asymmetric conflict between various state and armed non-state actors. Already, Caracas has lost control of vast swathes of territory which is under the control of non-state armed groups including leftist Venezuelan collectives (colectivos in Spanish) and Colombian guerillas, notably the ELN, and paramilitaries.
Venezuela Is Tearing Apart Oil Pipelines to Sell as Scrap Metal
(Bloomberg) — Venezuela’s capacity to produce some much-needed gasoline and diesel of its own hinges on a single oil play. To tap it, the Nicolas Maduro regime is willing to cannibalize the country’s crumbling energy infrastructure to pay contractors with scrap metal.
Unlike the tar-like crude from Venezuela’s Orinoco region, the light oil from Monagas state is the only kind that’s easy to process into fuel at the country’s aging refineries. It’s also the only area where production doesn’t require the help of sanction-wary partners.
Venezuela can now be considered a “failed state”. The below link is just over one year old.
‘Failed state’: Venezuelan displacement and starvation multiply
Starvation in Venezuela is on the rise, according to an FAO report on food security and nutrition published last month. Malnourishment there surged sevenfold, from three percent in 2010 to 21 percent last year.
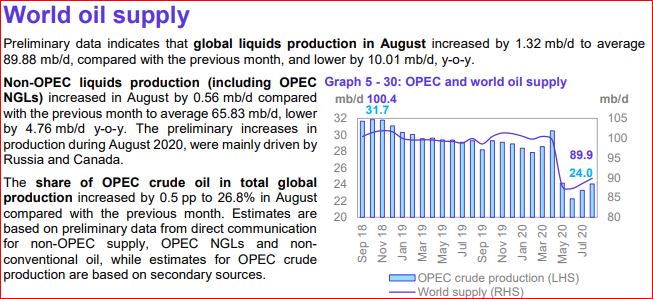
Here OPEC plots OPEC crude only along with World all liquids. That throws their percentage comparisons way off.
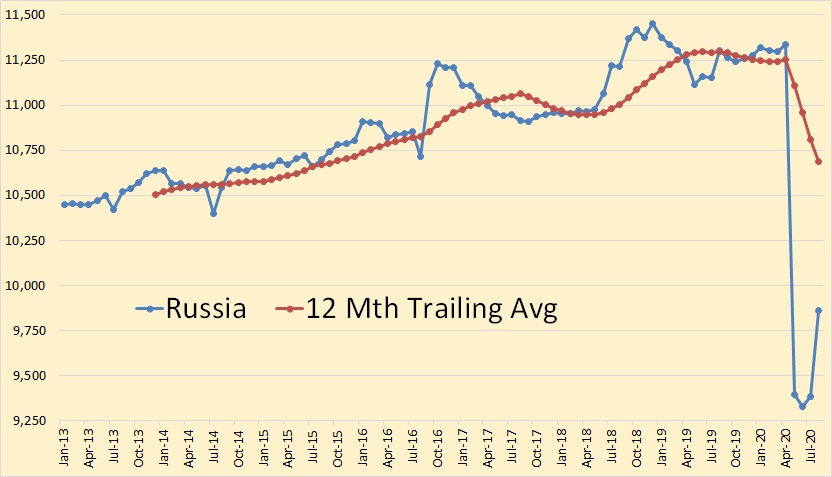
Russia is the only other oil producing nation with production data through August, 2020. Russian production was up 479,000 barrels per day in August to 9,860,000 barrels per day.
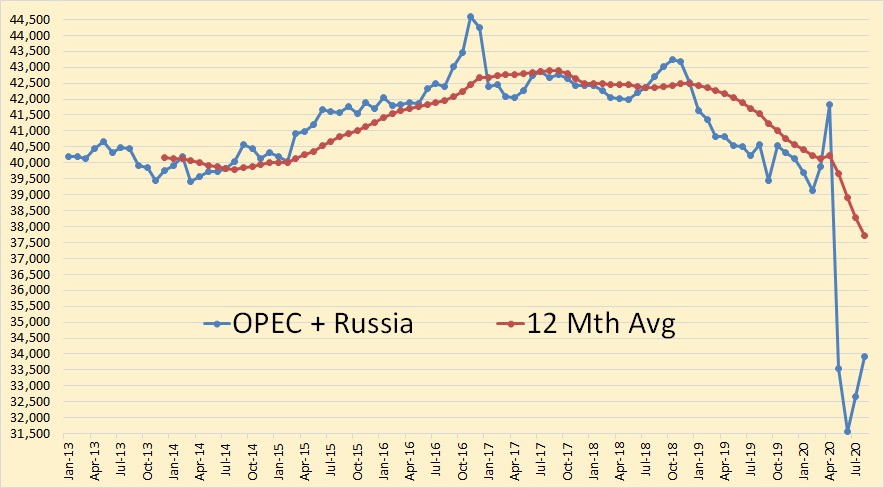
OPEC + Russian oil production averages between 52% and 55% of total world oil production. The combined, OPEC crude only and Russian C+C was up 1,241,000 barrels per day in August to 33,906,000 barrels per day.
132 responses to “OPEC August 2020 Oil Production”
BP just announced Peak Oil is here.
We’re through the looking glass now. The paradigm changes from here out, pandemic or no.
So a self-serving oil company, a player in a capitalist game gets to call “peak” at the moment of its arrival . . . without any legal, moral or financial consequences. All the while extracting maximum profit and ZERO responsibility for the implications of its silence. More than free-market economic units, we are above all moral/ethical social primates with responsibility to our tribe and nations. Damn you silenced psychos.
This is just a self serving emotional rant we no informational content
So far the peak is in 2018, both annual and monthly (and 12 month centered average). If the economy recovers eventually (2022 or 2023 for a return to 2019 level of real GDP for the World is my guess), we might see the 2018 peak surpassed by 2025 to 2026 with an eventual peak in 2029 to 2030 at around 84 to 85 Mb/d for World crude plus condensate output.
If the World economy never recovers as some believe then the peak will remain 2018, from my perspective that is not very likely.
For all who think pre covid is coming back . Some maths . below is a post from Dennis on the last thread ;
“For World Bank data for World real GDP per capita from 1960 to 2019 we have the following average annual growth rates over 20 year periods.
1960-1979, 2.73%
1980-1999, 1.28%
2000-2019, 1.60%
future long term growth rate perhaps 1 to 1.25%, but essentially not known. ”
2019 total world GDP was $ 142 trillion . WB and IMF say -3% for 2020 . They are always too optimistic like EIA ,BLS and IEA . I think 5% . Just a gut feel . So we will end 2020 at about $ 135 trillion . As above growth rate is between 1-1.25 % . I will be optimistic on this side and say 1.5% .Then by Dec 2024 we will be $143 trillion or pre covid . This is not going to occur . Why ?
1. Globalisation is over .
2. Several industries like travel,tourism,aircraft mfg,shipbuilding,mining,oil and gas are not coming back .
3. All that could be monetized and financialised has been done . We are now monetizing fictitious assets via derivatives ,CLO ,CDS etc . Too many claims on the same asset . This dam will break soon .
4. Negative feed back loops have been triggered .
5 . Up till now the world has been ignoring climate change ,well that is now the bull in the china shop . If Covid was bad ,wait till this kicks in hard . The fires and ice melts are just warm up sessions . Hickory on the ” Non Petroleum post” says ” Million in California thinking of migrating ” . So now the world will have a new problem ” internal refugees ” . Just for an update the ” internal refugee” problem is already happening in India triggered by climate change .
Not a pleasant scenario and I wish it does not occur , but” If wishes were horses ,beggars would ride ” . 😉 .
A wild ride with no stop signs .
Hole in Head,
When we account for likely population growth (using SSP 2 from Lutz et al) and we assume a 1.5% per year rate of growth for real GDP per capita, we end up with an average annual rate of growth for World real GDP (at market exchange rates) of about 2% per year from 2020 to 2060. If we assume real GDP decreases by 4% (equivalent to your nominal GDP decrease of 5% where a 1% rate of inflation is assumed), then World real GDP returns to above the 2019 level by 2022, if we assume real GDP per capita grows at 1.5% per year.
The rate of growth from 2020 to 2040 is about 2.2% per year for World real GDP and from 2040 to 2060 the average rate of growth of World real GDP slows to 1.8% per year, and for 2060 to 2080 the average rate of growth of World GDP slows further to 1.5% per year. This is due to population growth rate slowing over time and reaching a peak in 2070 at 9.68 billion, population falls to 9.28 billion in this scenario by 2100. (This is the middle scenario of 5 different scenarios by Wolfgang Lutz and collaborators at http://dataexplorer.wittgensteincentre.org/wcde-v2/ ).
Dennis, where the world stands today any projection beyond 2025 is irrelevant . We must recognise that at is a changed world . I have explained why we will never be pre covid . As to economic growth coming because of population growth , I disagree . The current population growth is all in not poor but destitute basket case countries in Africa and MENA, parts of Asia . They are a drag on growth ,not a contributor to growth . In your post of 15th you have said ” My guess those changes will not be enough to offset rapid growth of the economy in China and India, which together have 2.5 billion people, so some growth in oil consumption will occur.”
Well India is facing starvation in the very near future , forget growth . As a matter of fact it has already started .
http ://www.thehindu.com/news/national/other-states/coronavirus-lockdown-death-and-hunger-stalk-village-in-agra/article32595049.ece
Hole in head,
The point is that the data is for World real GDP per capita annual rate of growth of about 1.5% from 1983 to 2019. If World population grows at 1% from 2020 to 2025, the World real GDP grows at an annual rate of about 2.4%. If we assume a 4% fall in World real GDP in 2020, 1.5% growth in real GDP per capita from 2020 to 2025, and that the SSP2 scenario from the Wittgenstein center is correct from 2020 to 2025, then the 2019 level of World real GDP in 2010 US$ (85 trillion) is surpassed in 2022 and grows to $92 trillion (2010 US $) by 2025.
See https://data.worldbank.org/indicator/NY.GDP.MKTP.KD
for data.
India will recover from the economic downturn and return to growth in my opinion. World Bank expects India’s real GDP will fall by 3.2% in 2020 and then increase by 3.1% in 2021. These estimates of the future are not likely to be correct, the future cannot be predicted.
Dennis , all I can say is that your info and knowledge about the ground realities in India are akin to my info and knowledge about Mars .
hole in head,
Probably correct, I did not claim any special knowledge about India, eventually there will be a vaccine and eventually it will reach everyone who wants to receive it. Generally capitalist economies are pretty resilient especially when there is good government policy (that ignores the laissez faire nonsense of classical economics). Perhaps the Indian government is as inept as the current US government, that can change at the next election or in some future election.
My guess is the World bank has experts that are quite familiar with the realities on the ground in South Asia. Like all forecasts, yours, mine, anyone’s, the World Bank will have a perfect track record being incorrect 100% of the time, same for IMF.
BP Bombshell: India’s Oil Demand May Peak In 2025
https://oilprice.com/Energy/Crude-Oil/BP-Bombshell-Indias-Oil-Demand-May-Peak-In-2025.html
have at it.
Somebody at BP must be smoking something strong to arrive at that conclusion. You need to visit India and China to realise that there is no way those countries are peaking gdp/oil consumption anytime in the next 10 years and probably 20-30 years for India. In India there are masses of motorcyclists everywhere you go. They all want to own cars and will at some point. The country is far, far from a scenario where people can drive electric cars. Most of the diesel consumption is from trucks – that’s not going to show a deceleration as long as the country grows. And it will keep on growing for a very long time indeed.
hole in head, I get the doomsday scenario you are painting. Just keep in mind that in India 150k people die every year from traffic accidents. When all this ends, the country will have a few thousand more deaths because of covid. This is not to minimise the impact of the disease but to say that yes, it is bad now but it will be overcome.
And yes, it will get some time to get covid under control, but it will come under control from vaccines or burn itself out as most pandemics have done in history. Humans will survive and get back to normal. That has always happened before and I don’t see covid changing that.
And when it gets back to normal, people will want to travel – yes in planes too! I know, difficult to believe now, isn’t it! Oil demand will go up because the world is very, very far from fully replacing oil, at least in transportation.
It would be great if some one could post the essential points BP makes arguing that oil has peaked.
And a link to another commentary on BP’s analisis:
BP projects peak oil demand is very close or already happened
Global oil consumption is slated to plateau early this decade even without vastly stronger measures to combat climate change, BP said in a new analysis.
Why it matters: BP now sees this moment arriving a decade sooner than last year’s version of their long-term outlook for oil-and-gas, coal, renewables, cars and more.
The new projection signals how the COVID-19 pandemic is reshaping analysts’ views of the energy future.
The timing of peak oil demand, and the slope of its decline, will affect carbon emissions, corporate strategies and the finances of oil-producing nations.
Driving the news: BP projects demand for liquid fuels (a rough oil proxy) entering a long plateau in the early 2020s in their “business as usual” (BAU) scenario.
It assumes “government policies, technologies and social preferences continue to evolve in a manner and speed seen over the recent past.”
Oil demand plateaus at roughly 100 million barrels per day — where it was before the pandemic drove it downward — for almost 20 years, and then declines slightly through 2050.
The intrigue: In other BP scenarios, oil demand never reaches pre-pandemic levels again and declines steeply by 2050, the end of its outlook period.
BP’s “rapid transition” case assumes policies strong enough to slash energy-related CO2 emissions by 70% by 2050. It shows oil demand falling to roughly half of pre-COVID levels by 2050.
Under its “net zero” scenario — which explores policies and behaviors aligned with holding temperature rise to 1.5°C above pre-industrial levels — demand falls to about one-third of pre-pandemic levels.
When it comes to transportation, the largest source of oil demand, all three scenarios see increasing efficiency, while the “rapid transition” and “net zero” cases both see much greater increases in electric cars and hydrogen fuels than BAU.
Where it stands: The report comes as BP is planning to diversify away from its dominant fossil fuel business in coming decades, including plans to cut aggregate oil-and-gas production by 40% by 2030.
The big picture: Oil demand across the models is “significantly affected” by the pandemic, due in part to its economic effect in emerging economies that are centers of demand growth.
“The experience of coronavirus also triggers some lasting changes in behavior, especially increased working from home,” the report finds.
Yes, but: “We can’t predict the future; all the scenarios discussed in this year’s Outlook will be wrong,” said BP chief economist Spencer Dale. Instead, BP uses these scenarios to “better understand the range of uncertainty we face as the energy system transitions to a lower-carbon world.”
Here in Finland The Neste (finnish oil company also having refineries abroad) announced yesterday it will close the Naantali oil refinery; although a small refinery as thesethings go it was interesting that the company gave several reasons why they are doing that. One was that there is serious overcapacity in refinery business and they see the future of oil business to decline – also new investments would be needed etc. Some 400 people will be laid off so small potatoes as such but I get a feeling that this reflects the future of the business…
Thanks Ron.
Link to BP outlook
https://www.bp.com/en/global/corporate/energy-economics/energy-outlook.html
Chart below uses BP Statistical REview of World energy to estimate NGL output per EJ of Natural Gas for the past 10 years and takes the weighted average over those 10 years and assumes this is the correct number for 2020 to 2050 (an assumption likely to be incorrect). Then we use the scenario estimate in exajoules for oil and convert to barrels of oil equivalent. The Gas consumption scenarios are then used to estimate future NGL consumption and this estimate is then deducted from the C plus C plus NGL (this is what BP calls oil) to get a crude plus condensate estimate for the three scenarios (BAU, Rapid, and Net zero). My recent oil shock model is presented for comparison (only the value at 2015, 2018, 2025, 2030, etc is shown with straight lines connecting the data points).
They are saying peak DEMAND.
The weasel word of a producer that doesn’t want to tell the world what we all, here, at least already know. That even if they wanted to, they couldn’t meet demand. Turns out when supply falls, it takes demand down with it, regardless of the nuance about balancing supply and demand.
Anyone who thinks this is BP saying we’re all smoothly transitioning to a fossil fuel free future right now, hasn’t been paying attention.
That’s a lot of mental gymnastics to reach that conclusion.
Storage is still at record highs. Production is still exceeding demand, even with voluntary cuts, and prices are low.
Nothing about that suggests scarcity.
Doodles,
There has been a big decrease in exploration and investment in the oil industry. When the World economy recovers we will draw down those stocks quickly as ramping up output will take time. US tight oil might return to previous peak by 2030, but it will require oil prices over $65/bo in 2019$. Without higher oil prices supply is likely to be short by 2025, perhaps sooner.
This is not a bad chart showing the huge exploration deficit.
The black line indicates the volume of discoveries required per month to maintain a 100 MB /day consumption habit indefinitely. IOW, a huge deficit
The world may never consume more oil than in 2019, BP says
London (CNN Business)Demand for oil may have peaked last year, according to BP, which says the global market for crude might never recover from the coronavirus pandemic.
Ron
Iraq says it will make additional oil cuts in August to make up for over production in previous months.
https://af.reuters.com/article/idUSKCN2522CE
Actually, I think that they are managing the petrol incomes and that they are sparing the ressources (which are mature only for a little part).
I subscribe to Tom Whipple’s newsletter entitled: “The Energy Bulletin Weekly”. In today’s edition, he starts off with two quotes and a graph. The first quote is this:
“…a looming transition that in the decades ahead will shift the world away from using oil, natural gas and coal…. Still, whatever the time frame, climate change and political pressures will move the world towards low-carbon energy sources, and it is not too early to see how this shift is likely to affect the global balance of power… China is poised to be the big winner, Russia and Middle East oil exporters the big losers. The U.S. is likely to fall somewhere in between.”
Daniel Yergin, VP of IHS Markit, and author of coming book
“The New Map: Energy, Climate and the Clash of Nations.”
The book is being released tomorrow, September 15, 2020.
Not sure why exactly he picked China as “the big winner” unless they use their rare earths at home to make batteries, electronics, solar cells, etc. coupled with their work ethic They also play a long game such as sewing up a 25 year economic agreement with Iran. Maybe I can see why.
China makes 80% of LFP Batteries Globally and the majority PV wafers. Yes everything needs batteries.
PeterEV and all,
The Energy Bulletin is a great site. There’s a Daily News section and the Weekly Review that shows up Tuesday or Wednesday or Thursday. It’s Tom Whipple’s old peak-oil site and the single best one I’ve found, really tightened up in presentation and expanded in coverage.
“Joe Bob says: Check it out.”
To me the big question this decade is how many other petro states go the way of Venezuela in the coming decade. Oil prices look set to be especially turbulent with so many factors at play. The good times lead to lots of promises and expectations. The bad times make debt explode and pisses off the citizenry – good times for Chavez, bad times for Maduro. Look at Exxon and KSA – they have unreal dividend expectations that cannot last. Another three or four dominos could fall. My black swan wag is Russia. As Putin’s health inevitably starts to wane with no obvious successors, Russia could fall off a cliff by the end of the decade.
Steven+Xep,
Please, do not warry too much about Russian black swan wag. They will find the way out, as they always did it through the history. The big oil was always the curse for USSR and later for Russia.
The sooner they get off the “oil needle”, the sooner they will get themselves out of the shit where they are now.
“The big oil was always the curse for USSR and later for Russia.”
and the Germans, Ya, Operation Barbarossa to secure crude for Hitler’s campaigns.
Sergey,
With the Russian oil industry going in the same stupid direction as the U.S. Shale Industry, by the ramping up of horizontal drilling, I think the country’s production will run into a brick wall within the next five years.
steve
Steve,
Generally horizontal drilling results in more barrels produced per dollar invested for a given resource. Note that some resources such as tight oil will be more expensive to produce. As far as I know there has been very little (perhaps none) tight oil production in Russia.
Although tight oil has been an economic failure in the US, it only took off because of horizontal drilling combined with modern fracking methods.
When oil prices rise Russia is likely to be fine, in better shape certainly than US tight oil producers at any given oil price level.
Russia less centralized and more resilient than many western nations.
Ok maybe it’s the USA that’s the next Venezuela…
Below is a chart of Bakken production, (Not ND). Production was up by 25 kb/d in June.
Nice “rebound”
See
https://shaleprofile.com/blog/bakken-monthly-update/north-dakota-update-through-july-2020/
Enno Peters at shaleprofile.com has North Dakota at 1011 kb/d in July, Middle Bakken and Three Forks formations only (most of ND tight oil is produced from these two formations) at 921 kb/d in July 2020. The June level of output for all ND was 868 kb/d based on the latest data from shaleprofile.com
Also Enno Peters pointed me to a great post by Mike Shellman, link below.
https://www.oilystuffblog.com/single-post/2020/09/04/Here-We-Go-Looptie-Loop
Yes Dennis, especially Eric Gagen’s comment to Mike’s post…
John,
I agree, great comment by Mr Gagnon and a great response from Mr. Shellman as well.
I like the quote of Liam Deming that Mike posted – the hit to ExxonMobil’s credibility coincided with its headfirst plunge into US shale.
As an XOM (formerly Exxon and Mobil) shareholder for 25+ years, I completely agree.
Thanks Shallow sand, I agree another excellent tidbit from Mike.)
The quote he refers to is (copy and pasted from http://www.oilystuff.com ):
…the past decade’s shale miracle did wonders for drivers, oil executives and “energy dominance” fantasies, but not for investors. It isn’t a coincidence the hit to Exxon’s credibility is rooted in the same thing that turned investors off the sector in general: an expensive pivot to shale.
Liam Denning, Bloomberg
Mike Shellman’s blog has lots of great stuff at https://www.oilystuffblog.com/
The current “chart stuff” is quite interesting.
Mike has to be one of the best resources the upstream industry has. He has been there, done that in many facets, and he also has a lot of contacts who have a wealth of knowledge and experience.
I believe the end of the “oil era” will come largely because lack of talent entering into the upstream industry. The young “Mike’s” of the world aren’t going into upstream. Heck, us older people won’t let our own kids get into it.
Not only has there been a prolonged period of lower oil and gas prices, but we are being bombarded with the notion that the industry is a dead end.
During the 2005-14 boom, the industry attracted talent by paying way more than almost any other industry. It can’t afford to now, and won’t be able to unless we see much higher prices.
US upstream is a very specialized field that takes a significant amount of training. As workforce has been cut to the bone, there isn’t a up and coming group being trained.
You have probably heard about the “great shift change?” It was happening during the boom. It has accelerated greatly since 2014.
Shallow sand,
Those problems will result in less supply of crude and is likely to lead to higher oil prices, we may not get back to the very high levels of 2011-2014, but $70 to $80/bo seems pretty likely within 5 years in my opinion.
Dennis,
Even if we get back to $70 in five years, how much drilling acreage in these shale fields-regions do you believe would be left??
I just looked at Pioneer. They state they have 680,000 net acreage of inventory in their investor presentation, but fail to mention that they only list 25,000 net UNDEVELOPED acreage in the company’s 10-K SEC Filing remaining with 660,000 in developed acreage. They also throw in 98,000 Royalty acres… LOL.
I have been looking at many companies and their net undeveloped drilling acreage has fallen to 10-20%. So, are we going to GROW MORE LAND and ACREAGE?
Lastly, the third largest producer in the Bakken, Whiting Petroleum just did a 1-75 Reverse Spit of their stock on Sept 2nd. The stock is now trading at $21… LOL. Add this on top of the 1-4 Reverse Split in Nov 2017. Now, factor out all that MESS and Whiting is worth 7 cents a share.
I give the U.S. Shale Industry about five years, and more than half of the production will be gone.
steve
Steve,
Keep in mind we have to think in three dimensions. there are many layers of productive rock in the Midland and Delaware basins, so an acre that has been developed (has some wells producing) might be able to support several more wells at different depths (horizons) before full development is reached.
The reports cover proved reserves and there are no doubt probable reserves that are not in the annual and quarterly filings, also the proved reserves change as prices rise, they will be different at $40/bo than they are at $70/bo because more acres will be profitable to produce at the higher price. The mean USGS estimate for technically recoverable resources in the Permian Basin is about 75 Gb, for an oil price scenario that rises to $75/bo by 2030 and thin remains at that level until 2040 and then price declines and using a discounted cash flow analysis (10% annual nominal rate) to judge profitability of completed wells, the economically recoverable resource becomes 53 Gb, with cumulative production from Jan 2000 to July 2020 of 6.2 Gb, leaving roughly 46.5 Gb of economically recoverable resources for the oil price scenario examined. This is Permian basin only, for all of US tight oil I get economically recoverable resources of about 79 Gb, with cumulative output to July 2020 of about 18 Gb, so remaining tight oil resources of 61 Gb.
Oil Price scenario in chart below.
Dennis,
“Keep in mind we have to think in three dimensions. there are many layers of productive rock in the Midland and Delaware basins, so an acre that has been developed (has some wells producing) might be able to support several more wells at different depths (horizons) before full development is reached.”
Dennis, yes there are several layers of rock but keep in mind that the operators already selected another layer to produce first the most profitable one. The layers that might be left can of course technically be produced and you will probably argue this with a higher oil price. Indeed a much higher price will be needed imo.
These are the operators that tooted break even BO prices of 5, 10, 15 dollars per barrel and during that time the price was what 50-60? yet they didnt start swimming in cash, did they break even? Not even close they amassed a massive amount of debt while producing THE BEST resources they had available.
So even if oil prices increases above the 50-60 it will not get better since they will then be producing from second or third grade economical rock. So they will need even higher price to come up with the same shitty result. Oh wait not even that is true since these new wells in the less economic rock will also be burdened with the debt interest from the uneconomical wells previously drilled in better rock at a better oil price.
Sure it might get produced, but would you invest your own money in it believing to get them back and then some?
Baggen,
I use the data from shale profile to construct the well profiles of both oil and natural gas for the average Permian well which I assume costs $9 million for drilling, completion, facilities, and land cost in 2019$, oil prices are as I have shown and I assume natural gas rises to $2.20/MCF at wellhead. NGL is estimated by using Texas and New Mexico average NGL output per MCF of natural gas and NGL is assumed to sell for 25% of the crude wellhead price.
Wells are only completed if their discounted net revenue (in constant 2019$) over the life of the well is greater than the real well cost in 2019$. Note that I assume average well productivity starts to decrease in Jan 2019. For a high oil price scenario (from EIA AEO 2019) and assuming mean USGS TRR, I assume 254 thousand wells total are completed (about 28 thousand wells completed through July 2020), at a high oil price it is profitable to complete those wells and ERR=TRR=75 Gb, but I do not believe the high oil price scenario is realistic, using the scenario with oil prices rising to $75/bo by 2030 and staying at that level to 2040 and then declining, I get about 53 Gb for ERR with 161 thousand total wells completed. Also the model calculates cumulative net revenue from Jan 2010 to Dec 2019, this was about $66 billion in 2019$ (I assume constant $9 million well cost from Jan 2010 to Dec 2040, before 2015 well costs were likely lower than this). I assume interest on debt is a 7.5% annual rate and all debt is paid back by 2030 under the assumptions of the model, by 2047 cumulative net revenue (in 2019$) for all Permian basin tight oil wells is about $700 billion.
I do agree that average well productivity will decrease. Permian model in chart below.
Baggen,
Chart below has average well oil EUR for Permian for my model (wells assumed to reach end of life at around 23 years, though model assumes no further output when net revenue is no longer positive.)
We probably do not agree on how steeply average well productivity will decrease, my guess is based on the information I have from the USGS assessments of the Permian basin.
Dennis,
I think you are moving the goalpost a bit now, you were talking about layers that had not yet been developed as in rejected for first development by the operator, then in my opinion you cant compare it towards current history of production profiles and well economics for already developed best average acreage of all producers.
The second and third layer that was rejected for first development was of course so for a reason, money. It wont be in my opinion single digit % change in cost to those wells and probably they will also produce less per horizontal length (probably reason for rejection was not only deeper more complicated drilling but perhaps also inferior rock compared to first pick for initial development).
We can be pretty sure it wont get drilled from free cash flow.
I think your figures hinges on if there is someone willing to put in the capital again into these companies with yet another promise about profits, this time in worse rock then before and with larger debt burden.
Perhaps there is enough people willing to part with their money for a third run.
Would you put your own money in?
Baggen,
No, oil and natural gas too risky for me. You assume all the best wells have been drilled, I don’t think that is necessarily the case. There is a lot of rock volume that is undeveloped, I agree oil companies try to drill the best areas first, but undeveloped rock may be unsampled and as I imagine you are aware, the rock is not uniform.
The model needs to be updated after 2018, either the average well profile assumption is incorrect or the number of completions I have estimated is incorrect. The model has been running low.
Dennis,
I think we actually agree on a lot of parameters just not all of them.
I dont really assume ALL the best wells have been drilled just a majority of the best acreage for probably a majority of the tight oil operators and this will show up as a very slow decline of average well production in your national wide model on that we agree.
What i do assume though is that the different layers that was the initial discussion if there are three layers in the same acreage and the operator has developed one to perhaps 50% there might still be some prime location left in that layer, but layer 2 and 3 that was rejected for first development was so for a reason. Its economy wont be as good as the one picked first due to reservoir debt, complexity, rock and probably a lot of more reasons people that are actually in the industry could name.
I am aware the rock is not uniform, and that is not a good thing for the operators.
Again about your model i actually agree with it or “understand” it if you so will but in this case its history based on the average wells from the “first pick” locations. When operators are forced to access layer two or three not because they want to because they have no other option left to drill it will be more expensive to drill and in general the rock quality will also be sub par.
However i think we both agree on that those layers will at some point be developed. If i interpret you correctly you think it will be drilled profitable and that current debt will be payed back and investors will get some return on their money, this is where i think differently.
One thing also with tight oil, i regret not saving the article i came across many years ago witch basically showed profit for tight oil operators didnt scale very well with higher oil prices as service operators adjusted their prices with just a short delay and this makes perfect sense considering the short lead times from drilling to production and high initial decline rates of the tight oil.
Baggen,
I agree that we are mostly in agreement.
The only difference is I assume there is less of a difference between the best horizons and next best. I expect a gradual reduction in EUR and stable real well cost. Note that well cost per foot fell over the 2015 to 2018 period, as optimal setup was developed, I think this stops after 2018, but that constant real well cost may be maintained, but the assumption is easily changed.
Interesting comments. One recent ‘thing’ learned from Covid is how much we can cut back on driving and FF use. Plus, with a move to working from home our consumption expectations may be off even if the economy recovers.
Paulo,
Crude plus condensate output increased at an average rate of about 800 kb/d over the 1983 to 2019 period. Perhaps this growth will be eliminated by more people working from home and fewer business flights. My guess those changes will not be enough to offset rapid growth of the economy in China and India, which together have 2.5 billion people, so some growth in oil consumption will occur.
I doubt the adoption of electric transport will be enough to reduce growth in consumption of oil until 2030 to 2035. Peak oil is likely to be due to lack of supply rather than lack of demand, around 2028 to 2030.
Paulo,
Clarification, the annual increase in output over the 1983-2019 period for World C plus C was about 800 kb/d each year (used a least squares linear fit to EIA monthly data from Jan 1983 to Dec 2019 to find the slope of the trendline.)
Chart below may be clear.
Dennis Coyne wrote: “doubt the adoption of electric transport will be enough to reduce growth in consumption of oil until 2030 to 2035.”
That brings up another question. Has anyone looked at how many EV’s and hybrids the world can put on the road before we hit supply constraints for the minerals needed to make the batteries?
Many people companies and organizations have.
For the intermediate future (and perhaps well beyond), the constraint is battery manufacturing capacity, not material supply.
https://youtu.be/n_gvvj56rzw
For those who may be interested, here is our household (family of 4) gasoline expenses normalized to the pre-pandemic condition (Jan/Feb) and broken down in–mostly–two month increments. Location: British Columbia, Canada.
Jan/Feb 2020: 1.00 – Pre-pandemic conditions
Mar 2020: 0.55 – Transition to “lockdown”
Apr/May: 0.34 – Full lockdown / social distancing and very little driving
Jun/Jul: 0.66 – Gasoline prices recovering, some summer activities on top of the usual driving
Aug/Sep: 0.45 – Estimated to 16 Sep: With summer closing, driving has returned to the essentials
My wife and I both work full-time, me nearly 100% of it at home and her ~75%. We own one car and are often going three weeks between full-ups–this with the fill-up being done at the 1/2 tank level. Frankly, I will work from home as long as I am able! The savings are quite large. No more eating out for lunch, no more random coffees, no more parking fees, reduced auto maintenance expenses, and the list goes on-and-on. I have not gone to a restaurant in six months–no take out, no delivery and no dine-in. While our grocery bills have gone up from less eating out, our savings have been growing hugely due to the elimination of all that nickel-and-dime stuff. This is perhaps one of the biggest and most important lessons from this experience, one I will not forget. Guess the teachings of the Great Depression are back, in a weird way!
-best
Thanks to both you and Dennis for the reply and comments. Tomorrow I am going to town. Because we drive so seldom it is kind of a big deal for me. I will actually be getting some take out to eat at a view point….just because. Our lifestyle has always been home cooked meals and big gardens and harvests, but I do miss the occasional meal from Cantons (Chinese food). Instead of meeting a friend for a catch up over lunch, it will be solitary and just a bit sad. The radio will have to do. 🙂
What we decided to do is reserve eating out for special occasions. I will soon be breaking my “fast” as my daughter is having a birthday soon, where she reaches the age-of-majority, a special event worthy of a celebration. I hear you–we are feeling the continued “isolation” and cannot wait to be through this pandemic. Alas, I think it will be another good 12+ months before some resemblance of normalcy is at hand, and then maybe…
We are on similar path Graywulffe.
Thanks for the reply, and good to know of others on a similar trek.
-best,
BP is trying to position themselves for a bailout. Oil will not get a bailout unless they pretend to be green cheerleaders even more so than they have postured to be up to now. So you can pretty much ignore what they have to say.
This weird perception that is unfolding . . . that the virus has shown us that we can live without oil consumption . . . rather overtly ignores that we are living on 4 trillion-dollar deficits and 8 trillion dollar Federal Reserve balance sheets and no one knows what happens when a decision is made by counterparties to refuse to engage in these transactions.
The very natural inclination exists to look at this murky money situation globally and then blink and realize that you need to go and pick up some food. You get the food and start to eat and in a subconscious way shrug and decide that as long as the food is in your mouth murky money situations are not worth trying to understand.
But there is an endpoint to this. Someone will insist on having an item of value given to them in return for food. 4 trillion-dollar deficits will require oil consumption at some amorphous point in time. Every imaginable organization in the world right now is planning for the future with a absolute unequivocal default presumption that the virus will be eliminated next year. If it is not someone along the chain of transactions is going to stop and cross his arms across his chest and walk away.
It will be farmers and oil people, and not a single one of them will have as part of their decision process a sense of gradualism because some bizarre transition hasn’t happened yet. When they choose to cross their arms and walk away that’s the day you start to starve. The Magnificent Transition that is perpetually in the future won’t put a single calorie in your mouth. Nobody will schedule the day they cross their arms across their chest to be convenient for you.
Watcher ,well said .
“that the virus has shown us that we can live without oil consumption”- Watcher
Whoever you have decided to quote, and use as foundation of your argument, is portraying a false statement.
The pandemic has shown that we can live with less oil (maybe 10-20% from peak), without failing off the deep end economically.
That assumes we use energy for important uses, rather than important frivolous uses.
No guarantee that frivolous uses/industries will survive in a world facing oil depletion.
Do the economic policy conditions exist in various countries that will weed out frivolous/luxury use rather than just the needs of the average person?
Probably not. A good chunk of our economy is predicated on frivolity and extortionate use of energy. Take that away, people may be pissed. Especially those that kinda rely on that for a paycheque or their pension plan.
We most certainly can live with less fossil fuel energy overall. As to whether we will, is dependant on the globe having a change of heart over what our economy means to us and how we live our lives. It’s rather hard to run on a platform of less in the future than our parents had.
“It’s rather hard to run on a platform of less in the future than our parents had.”
True, but market forces will likely be the tool that weeds out ‘optional or frivolous’ uses of energy rather than policy, in the coming decades of oil depletion.
For example, all the people who now fly or go on cruise ships for vacations., will cut that out if the prices get too high.
And consider all the entertainment sector oil consumption- in the usa all of the sports team and fan travel is optional.
Much of the military fuel use is optional, in most years.
Driving at high speeds, over 50 mph, is optional. A slower speed could cut 10% of the nations fuel use without any cut to GDP, wage or job numbers. Hint- listen to good music.
For example.
I suggest that any young person would be smart to concentrate their career path toward an industry that does not depend on optional use of energy.
Well stated!
Democracy will likely be one of the earlier casualties of peak oil. I would also expect slavery to undergo a renaissance.
The USA, Brazil, etc this has already happened.
But things can get even more despotic.
There is no need to, because in many cases, less is more. For example, flat screen TVs and LEDs are vast improvements on the tech they replace, but use much less energy.
By the same token, chatting with friends online is much simpler and more convenient than driving over to visit them. It also saves lots of gas.
This is how Tesla was successful where other EV companies failed. Instead of saying “this car is cheap” the came out with the roadster, which could outrun a Ferrari on a quarter mile track and cost <$100K.
Watcher. Farmers and oil producers will cross their arms if they cannot cash flow.
We crossed our arms for four weeks in late April – early May. We will do it again if forced to. We obviously weren’t the only ones.
We will do the same with regard to grain too. But, so far, the US taxpayer has provided bailouts in that regard. I remember when cash rent was $50-75 and acre back in the 1980s-early 1990s. Last year, US taxpayers paid farmers a bonus of $55-82 per acre across the corn belt.
North Dakota is back above 1 million barrels per day. Production in July was 1,040,388 barrels per day.
Chart below is based on EIA data from link below
https://www.eia.gov/energyexplained/oil-and-petroleum-products/data/US-tight-oil-production.xlsx
An interesting tidbit, US tight oil output increased by 3427 kb/d from March 2015 to March 2020 (current peak for US tight oil). Permian basin tight oil output increased by 3142 kb/d over that same 60 month period accounting for about 92% of the US tight oil increase from the peak in March 2015 to the new peak in March 2020.
The question going forward is whether future Permian basin increases can more than offset the decreases that will occur in the rest of the US tight oil basins, with higher oil prices this might happen, at current oil price level it is not likely at all.
Your link doesn’t work Dennis.
Ron,
It might only work if you have MS Excel, it works for me.
it is the “tight oil estimates by play” spreadsheet link at page below
https://www.eia.gov/petroleum/data.php
click on crude reserves and production to expand that section, then click on XLS link under “tight oil production estimates by play” to download spreadsheet with data.
If works also with LibreOffice Calc.
Ron, the link points to and tries to open a MS Excel file. Works fine even on my no-Windows-anywhere Chromebook…
John,
I think Ron was expecting a web page, I should have mentioned it was, as you described, a link to download an Excel spreadsheet. Perhaps it does not work correctly on all browsers.
Hint:
Excel is something I will not touch.
For many reasons—–
Dennis, it did work for me. I just didn’t notice the xlsx link in the bottom left corner of the page. Sorry about that.
Ron,
No problem, I should have clearly stated that the link was for a spreadsheet download, I will do that to avoid confusion in the future.
Dennis
The September STEO is not showing much of an increase in production from September 2020 to December 2021 for the L48. The July, August and September projections have been fairly consistent. August has been left out since it is very similar to July and September.
The September DPR shows October Permian production increasing but at a slower rate than previous months. The October increase is projected to be 23 kb/d. For October the DPR only shows the Permian with increasing production. As you say price could change things. However I believe at this time, preservation of capital is front and centre.
Permian
Ovi,
I don’t usually pay much attention to the DPR, I think Enno Peter’s supply projection will be more accurate than the DPR. I am fairly certain that US output will be lower then predicted in the September STEO.
I used the page linked below for the chart below
https://shaleprofile.com/us-tight-oil-gas-projection/
Output of tight oil is 4793 kb/d for Dec 2021 for this scenario, a fall of 1800 kb/d from the EIA official estimate for tight oil output for July 2020.
I agree that US tight oil output is likely to decrease, especially if the STEO oil price forecast is correct, Brent at 45 in Jan 2021 and 50 on Dec 2021 will not be enough to increase the tight oil well completion rate in my view. The scenario assumes 253 tight oil wells are completed each month in the US from Sept 2020 to Dec 2021.
Ovi,
I took a quick look at the DPR, they have output in October 2020 1499 kb/d lower than March 2020, so it looks like the economists at the STEO shop don’t talk to the guys at the DPR shop.
The DPR estimate change in output is similar to the shaleprofile projection change in output from March 2020 to Oct 2020.
Frac spread count 85 for Sept 11, down 2 from last week see 2:45 of video linked below
https://www.youtube.com/watch?v=0tD-tZ9p-aw
Correction, the STEO L48 excluding GOM tracks a little more closely with tight oil output, it seems to match up pretty well with the DPR. DPR (includes conventional output in the tight oil and shale gas regions) estimate in chart below along with STEO L48 excluding GOM and a DC model estimate (which is fairly close to the shale profile projection). My estimate and that of Enno Peters suggest the STEO estimate for L48 excluding GOM may be too high, this assumes L48 conventional onshore output remains at roughly the July 2020 level through Dec 2020.
Well, the DPR is usually way off, but occasionally they get pretty close. At any rate, their prediction for the coming close months is always interesting. Their report came out two days ago. They have everyone declining in October except the Permian.
EIA Drilling Productivity Report
Chart below uses EIA official tight oil estimate and the average difference between DPR and tight oil estimates (871 kb/d) from Jan 2019 to July 2020 and the average difference between L48 excluding GOM STEO estimate and tight oil estimate (2103 kb/d) from Jan 2019 to July 2020. These differences are added to my model estimate for tight oil from Aug 2020 to Dec 2020, where the model assumes 265 tight oil completions per month from Aug 2020 to Dec 2020. These estimates also assume no change in L48 onshore conventional output over the Jan 2019 to Dec 2020 period, in other words it is assumed L48 conventional output excluding Gulf of Mexico (GOM) is 2103 kb/d over the entire Jan 2019 to Dec 2020 period. This assumption is likely invalid, it is a simplification as except in unusual circumstances (May 2020 and Hurricane flooding), conventional output will be relatively stable. The DPR estimate and STEO L48 excluding GOM are included for comparison. The Dec 2020 values in kb/d are STEO=8590, DCL48exGOM=7830, DC tight regions= 6600, and DC tight oil=5731. As always my guess will only be as good as the assumptions I have made, those assumptions are incorrect 100% of the time.
Note that my model, if extended to Jan 2022 has tight oil output falling to under 5000 kb/d with a low of 4980 kb/d in March 2022, that model assumes Oil prices gradually rise at $2/b each year from Jun 2020 level, tight oil well completion rate falls to 225 in March 2021 (from 265 in Dec 2020) then gradually rises to 399 tight oil completions in March 2022 due to assumed rising oil prices. The future oil price assumption is also guaranteed to be incorrect. If prices are higher than I have assumed, output will likely be higher, if oil prices are lower, output is likely to be lower.
The 5000 kb/d tight oil output in Jan 2022 implies for the DPR tight oil regions an output of 5870 kb/d for Jan 2022 and for L48 excluding GOM a C plus C output of 7100 kb/d for Jan 2022. The STEO L48 ex GOM estimate for Dec 2020 is 8590 kb/d vs 7830 kb/d for my estimate, a difference of 760 kb/d. For Dec 2021 the STEO has 8980 kb/d for L48exGOM, my estimate is 7120 kb/d, a difference of almost 1900 kb/d.
Bottom line the STEO is very optimistic for C plus C output based on their oil price projections.
Part of the difference between my scenario and the STEO is the rapid rise in Brent oil prices from $45/bo in Jan 2021 to $50/bo in June 2021, my scenario has a slow steady rise in Brent oil prices at an annual rate of increase of $2/bo each year. The $50/bo price for Brent crude is not reached until Jan 2023 for my scenario and the maximum price of $70/bo is reached in Jan 2033, $60/bo in Jan 2028. As always, the scenario is likely to be incorrect, true for any scenario devised.
With Venezuela approaching failed state status it is fair to wonder if their Orinoco tar sands will ever be utilized.
It is possible that electric transport will be common in the 2030-40’s, and by that time the expensive liquids from the tar sands may be technically recoverable, but not economically.
Perhaps the product will be used for heating oil in the cold north winter, if it cheaper than coal, nat gas or ocean wind.
How much of the crude oil URR estimates are attributable to Venezuela production?
Hickory,
For my recently presented scenarios extra heavy oil is about 200 Gb of the cumulative total of 3000 Gb for c plus c URR. Venezuela might represent 50 to 100 Gb of this total, with the balance from Canadian oil sands.
Thanks Dennis.
Hickory,
Corrections in comment below. The URR for all extra heavy oil for my recent models is about 135 Gb, not 200 Gb, this includes Canadian oil sands plus Venezuela Orinoco belt. My best guess is only a 7.5 Gb URR for Venezuelan extra heavy oil (could be anywhere from 5 to 10 Gb), most of the extra heavy (XH) oil output in the model is from Canadian oil sands (roughly 127 Gb).
A rapid transition to other forms of non-fossil fuel energy could easily reduce XH URR to 80 Gb, if we assume a 5% annual decline in XH oil output after 2040. Shock model with updated XH and LTO models assuming $75/bo maximum Brent price from 2030 to 2040 (chart posted elsewhere in this thread) below.
Hickory ,your question “With Venezuela approaching failed state status it is fair to wonder if their Orinoco tar sands will ever be utilized ”
Answer : Never Ever .
P.S : Dennis is going to say ” Never say ever ” . But I am serious ,never is never in this case .
The pathetic political aspect of the Venezuela failure is that wingnuts use this as a warning against communism and fear-monger that the dem’s “only vision is to turn America into Venezuela”
Yet, if the Venezuelan gov’t was right-wing, how would anything have turned out differently? They still would have been crushed by low oil prices, and the economy would be in shambles as all the capitalists moved out.
Political comments like this are probably better in the non-Petroleum thread, though I often stray into politics here as well.
Dennis, I put that quote in there because that is actually a response I received. The point I was making is that politics is meaningless if no one wants to buy the oil. So instead of the politically-charged “failed state” it should be “crashed bubble”.
hole in head,
I tend to agree that Venezuela might not produce much oil from Orinoco in the future, in the grand scheme I only expected 100 Gb at most, about 3% of World URR. I double checked my model and it is actually only 135 Gb of extra heavy oil total for Canada and Venezuela, with about 19 Gb cumulative production to Dec 2019, leaving 116 Gb. Canadian Association of Oil Producers forecasts about 22 Gb of Canadian oil sands output from 2020 to 2035 and cumulative Canadian output is about 10 Gb from 2005 to 2019, for 32 Gb from 2005 to 2035. All extra heavy output (Canada and Venezuela) prior to 2005 is roughly 5Gb.
For my extra heavy(XH) oil model I have about 37 Gb of XH output from 2005 to 2035, this suggets Orinoco output over the 2005 to 2035 period is only about 5 Gb. Potentially all extra heavy oil output after 2035 could be just Canadian oil sands, from my perspective I cannot clearly foresee future political events in Venezuela. Unlike you, I am not clairvoyent. 🙂
Note that this estimate suggests no more than 10 Gb total URR for Venezuela extra heavy oil (Orinoco belt) or about 0.3% of a World URR of approximately 3000 Gb of crude plus condensate.
I do not have good estimates for the split between Canada and Venezuela prior to 2005, if we assumed 50% of the 5 Gb produced before 2005 was from Orinoco (it is likely less than this), the model would have only a 7.5 Gb URR for Venezuela XH, this assumes all extra heavy oil output after 2035 comes from Canadian oil sands.
Today’s Oil rig count.
US down 1. Permian down 1. Williston up 1.
Even though WTI is steady at $40, there has been no change in drilling activity since essentially the week of July 17. There were 180 oil rigs in operation that week, nine weeks ago.
https://www.economist.com/leaders/2020/09/17/is-it-the-end-of-the-oil-age
This magazine also had an infamous headline in 1999 predicting $5 oil forever.
I drove 12 hours one way in the Midwest on interstates over Labor Day weekend. Heavy traffic. If I got close enough to see a Tesla I missed it. I did see thousands of semi trucks. Every rest stop/truck stop full of them.
I drove to Chicagoland today. Again several hours on interstates. I saw one Model X and one Model 3.
There are more Tesla’s in Nevada and Utah. Maybe saw 25 while out there for a week in August.
The oil companies just need to wind down. Winding down would be a sure win IMO.
shallow sand,
Most Teslas are probably on the coasts in the US, they are not for everyone. It will be interesting to see how the cybertruck does. Have you ever test driven a Tesla, you might be surprised, they are kind of fun to drive, but the nicest car I had owned prior was a Toyota Camry, so apples to oranges comparison.
Dennis ,correct . Fun to drive but unaffordable for the general public . Period . Will be bankrupt in a few years . I can’t forecast the date and time but sooner than some think .
hole in head,
EV prices will come down as production scales, when total cost of ownership(TCO) for cars in its class is considered, Tesla is considerably cheaper than Mercedes, BMW, Lexus, etc.
Currently there is greater demand than supply in OECD nations for Tesla Model 3 and Model Y, as demand for these more expensive models is satisfied and Tesla moves on the the Cybertruck, and Semi, eventually (perhaps in 2024) a cheaper Tesla will be built. Also higher fuel prices will accelerate transition to EVs and plugin hybrids, though personally I think the EV will have a cheaper TCO.
Nikola is unraveling. Rivan is next in line. Prices will always be unaffordable. Scaling production to lower costs has a limit and then the law of diminishing returns kicks in. Good riddance to bad rubbish
hole in head,
We will see.
The electric vehicle industry is on an explosive growth path.
New models coming to the market in the next two years will be hard to keep track of.
Keep an eye on the Ford Mustang and the VW ID4 , as examples.
There are dozens in multiple segments.
Hickory , the question is not whether you can make them , the question is whether the general public can afford them . I agree in the next two years it is going to be difficult to keep track of the bankruptcies in the EV sector just like we are seeing in the shale segment .;-)
h in h- look back at your statement at the end of the decade. don’t be too embarrassed, its not uncommon to miss a huge trend even when it towers over us.
Many people discounted computers early on- who could afford that, or cars, or gasoline.
I didn’t believe CD players would ever be affordable.
I was very late to game on computers too.
Pretty much all of us are late to the game/realization on electrification of transport.
Even Musk was slow on it in the 90’s.
Dennis
Here is some interesting info. California EV sales were 47% of total US sales in 2018.
Here is some other info. I compared EV sales on a per Million basis. Basically California EV sales on a per million basis are almost five times greater than in New York. Are Californian’s richer or greener?
EV Sales Population Sales Per Million
California 153,442 39.51 3,883
New York 15,752 19.45 810
https://evadoption.com/ev-market-share/ev-market-share-state/
The Sales Table vs Population above should look as follows
————-EV Sales —-Population—– Sales Per Million
California —-153,442 ——39.51 M ————3,883
New York —–15,752—— 19.45 M————-810
Ovi,
Some states have EV incentives, others do not. That might be part of the difference, Californians do have high income and very little good public transport.
Dennis. I have ridden in a Model S. Pretty neat.
I have a cousin that has a Model 3 and he really likes it.
Both owners I know are in the top 1%. Both also have ICE vehicles.
I don’t like the look of the cyber truck. But I’m getting old.
shallow sand,
See if your cousin will let you test drive his Model 3, even more impressive when you’re at the wheel.
The cybertruck is different, but think back to the 1965 F150, it was different from todays pickup. I didn’t like it much at first, and I have never owned a truck, always cars for me.
Not surprising they have ICE vehicles, my guess is if you ask your cousin which car gets driven most, it is the Model 3.
My car is a Toyota Camry, my wife’s is the 3, when we go somewhere together we drive the 3 about 99% of the time.
I wish I could visit more often, but live on the West Coast. They have the largest Ford SUV as other vehicle to transport 4 children.
It doesn’t matter what I or people over 50 think too much about an EV truck to be released in two years. I’ve had a closer up look at Rivian and like it, hope the company can make it, manufacturing based in Midwest in an old ICE factory.
Dennis, I think your experience is not uncommon.
My 2018 LEAF gets driven 99% of the time, even with its limited range compared to the Tesla.
The ICE car is a Ford Fusion, which is normally reserved for trips that might exceed the range of the LEAF, rarely gets out of the garage. In fact, I keep getting a “low battery” warning because the Fusion’s never-off electronics keep running down the battery.
Probably everyone in the world is just like you and doesn’t use gasoline or diesel anymore. Is that your point?
Greenbub.
I shouldn’t post anecdotal observations.
Just reading MSM leads one to believe nobody is driving light passenger vehicles powered by FF.
But in my travels, both locally and through the Midwest, that is not what I observe.
I do see more Telsa’s than I used to, but it’s still a small number, and typically either when in or near a wealthy suburban area or in a university town.
I recently read a government forecast that by 2030 7%, of light transport vehicles in the USA will be electric. Significant, but still a small percentage.
Furthermore, I don’t see light traffic on the interstates and two lane highways I travel, except I do agree rush hour isn’t as bad.
Not really sure why I keep on this. Can’t do a darn thing about the price of oil. It was blah, then great ten year run, now in a bad 6 year run.
Should just not worry about it and if we get to a point we have lost more $$ than we are comfortable with, we will just shut in, like we did in late April. $35 in the field is close enough to paying bills.
No, you SHOULD post your anecdotal observations. You are in the oil business and you are also talking about long trips -which is a decent sample size to remark on.
Greenbub.
Here’s one that’s not anecdotal.
One place I travel to 3-4 times per year is Chicago.
I see the most EV there, but again not many.
I looked at Illinois Secretary of State registration statistics just now.
As of mid-September, 2020 there are almost 23,000 EV’s registered in Illinois.
As of mid-September, 2020, there are almost 9.8 million vehicles registered in Illinois.
Shallow sand –
“I don’t like the look of the cyber truck” is an interesting comment on a vehicle designed for work.
The idea is to eliminate the paint shop and the stamping, huge investments when you build a car plant. The body is all flat and unpainted, but stainless steel. That makes the vehicle more durable and much cheaper.
Seems like a better idea than buying a rust-prone truck with a goat’s head emblem on the grill so people will think its “tough”.
https://www.argusmedia.com/en/news/2142495-indias-oil-product-demand-shows-recovery-in-september
Pretty good detail on recovery of consumption in India.
I was surprised to read a similar report because I don’t see traffic on the road. That’s perhaps my biases – I live in Bangalore and within that in an area filled with Tech companies who all have options to work from home.
I suppose a lot of people filled up their tanks since the lockdown started towards end of March. Traffic surely has picked up though and I expect it to keep increasing every week.
Too add , local metro services and public transport have now safe distancing protocols so many who would be using public transport are now using their own vehicles .
Some Netherlands gas data.
The Netherlands is scaling back gas production for reasons not particularly focused on climate. They’re the biggest gas producer in the EU and their gas comes from one very large field and a bunch of very small ones. They don’t produce the same kind of gas. Much like oil has sulfur content of varying amounts, the very large field in the Netherlands has a high nitrogen content in its natural gas.
So Netherlands consumption has two different kinds of design. One is L gas, meaning low caloric (high nitrogen), and the other is more regular gas from small fields or imports.
The large field is being shut back not because of climate issues but because they are getting earthquakes. It is not fracked, it is the extraction that is making the ground unsettled. So they hope to stop production from that field in about 10 years. Their phrasing is “when obligations for it have diminished”. Those obligations include exports, so their Parliament gave them wiggle room
Price doesn’t matter. They’re shutting it down. It’s all a little bit complicated because home heating by natural gas in the Netherlands is designed for high nitrogen content. Adding nitrogen to other sources is apparently not viable.
It’s quite a lot of gas in question. Nordstream 2 definitely has been influenced by what is unfolding in the Netherlands.
Interesting, and tough hit to the country.
The largest field Groningen, that is subject to the shutdown by 2022, is one of the 10 largest in the world and accounts for the vast majority of Netherlands production and reserves.
‘Earthquakes are blighting a 350-square-mile region ….“In 10 years it went from a good house to a ruin,”
‘Decades of extraction has reduced pressure on the gas-bearing rocks below the surface, causing them to contract. That has led the ground to sink by about a foot, and earthquakes have rumbled. More than a thousand tremors have been recorded since the mid-1980s. Thousands of homes and buildings have been damaged, including some of the region’s rich stock of medieval churches. Residents readily say they fear harm should quakes shake loose chimneys or ceilings.’
‘This slow-motion disaster is forcing the Dutch government to curtail gas production with consequences that are likely to be profound for its economy. To calm the seismic activity, gas flows have been throttled back about two-thirds, beginning in 2013. In September, the government said it aimed to halt extraction completely by mid-2022.’
‘The gas still in the Groningen field — an estimated 17 years of the Netherlands’ consumption at current rates — fits the description of a “stranded asset,” petroleum deposits that cannot be sold and used as fuel. The companies will not be compensated for its loss, estimated at $70 billion, and the government will also be taking a hit. ‘
https://www.nytimes.com/2019/10/24/business/energy-environment/netherlands-gas-earthquakes.html
Homes built in the Netherlands this side of 2017 are no longer connected to the gas network. This is mandated by law. The country is moving away from gas altogether, be it for heating or electricity generation. The Nord Stream is not of concern for the Dutch.
Shell to cut costs:
https://uk.reuters.com/article/uk-shell-costs-exclusive/exclusive-shell-launches-major-cost-cutting-drive-to-prepare-for-energy-transition-idUKKCN26C0GO
I use frac spread data from Primary vision network (link below see 3:15)
https://www.youtube.com/watch?v=w1ky8I2u8j8
To find an estimate for oil frac spreads I use onshore US horizontal oil rig count divided by total onshore horizontal rigs based on Baker Hughes North American rig count data (pivot table at link below)
https://rigcount.bakerhughes.com/na-rig-count
I multiply frac spread count by the ratio of horizontal oil rigs to horizontal oil plus gas rigs to estimate the number of oil focused frac spreads, then I find the trailing 4 week average of that oil frac spread count and present below. Note that the frac spread video has some interesting tidbits such as the frac spread count in the Bakken is now higher than the oil rig count. This also suggests that the ratio of rigs to frac spreads does not remain constant, so this estimate is very rough.
A new thread on Non-OPEC production has been posted.
http://peakoilbarrel.com/may-non-opec-oil-production-drops-to-2013-levels/
A new Electric Power Monthly thread has been posted.
http://peakoilbarrel.com/eias-electric-power-monthly-august-2020-edition-with-data-for-june-and-h1-2020/