A post by Ovi at peakoilbarrel
Below are a number of oil (C + C ) production charts for Non-OPEC countries created from data provided by the EIAʼs International Energy Statistics and updated to October 2020. Information from other sources such as OPEC, the STEO and country specific sites such as Russia and Norway is used to provide a short term outlook for future output and direction for a few countries and the world.
Note. I have just been informed that the EIA published their November report early. Normally they post the update at the end of the month. I will update this post ASAP and publish a November one. Sorry

Non-OPEC production reached its current lowest production rate of 45,319 kb/d in May 2020. According to the EIA, October output increased by 276 kb/d to 47,126 kb/d from September.
Using data from the February 2021 STEO, a projection for Non OPEC output was made to December 2020. The projected October to November increase of close to 700 kb/d largely reflects the increase in US output associated with the GOM coming back on line in November.
Ranking Production from NON-OPEC Countries
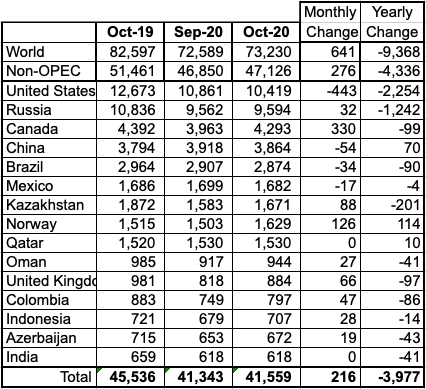
Above are listed the worldʼs 15th largest Non-OPEC producers. They produced 88.2% of the Non-OPEC output in October. On a YoY basis, Non-OPEC production decreased by 4,336 kb/d while on a MoM basis, production increased by 276 kb/d to 47,126 kb/d.
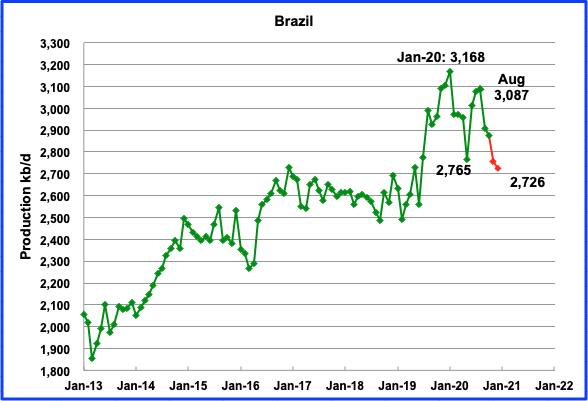
The EIA reported Brazilʼs October production was 2,874 kb/d, a drop of 34 kb/d from September due to planned field maintenance in the Tupi and Buzios oil fields, according to OPEC, and the presence of Covid on their sea platforms
According to this source December’s output dropped by 29 kb/d to 2,726 kb/d, (Red Markers). Maintenance and Covid could be continuing issues.
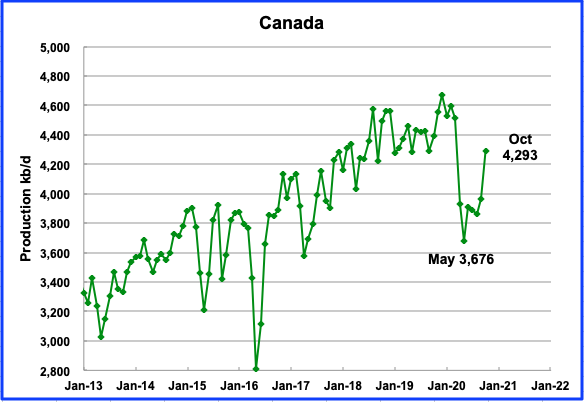
The EIA reported that October output increased by 366 kb/d to 4,293 kb/d. One possible explanation for the sudden output increase is that most of Canada’s crude oil exports are heavy oil and US gulf coast refiners have substantial need for heavy crude to feed to their heavy oil refining capacity. Venezuela and Mexico, two other heavy oil producers that supply the US, are experiencing declining heavy oil production, leading to increased US demand for Canadian heavy.
Below is a table of crude exports to the US from a range of countries.
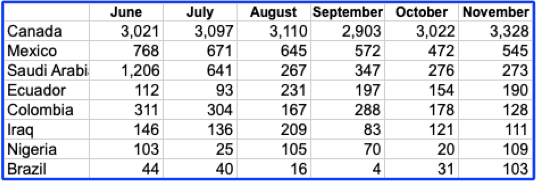
Canada is the largest exporter of crude to the US. Note how Mexico and Saudi Arabia exports have dropped since June while Ecuador’s have increased. The 1,206 kb/d of imports in June for Saudi Arabia is related to their production surge in April of 2020. A more typical monthly import number in 2018 and 2019 would be between 500 kb/d and 1,000 kb/d.
According to this source, the US did not import any oil from SA in the first week of January for the first time in 35 years, a reversal from just months ago when the Kingdom threatened to upend the American energy industry by unleashing a tsunami of exports into a market decimated by the pandemic.
The decrease in Saudi Arabia imports raises the question of whether SA sees the quickest way to get WTI and Brent prices into their preferred price range is by reducing crude sent into the US. SA fully understands the impact of the release of US inventories every Wednesday at 10:30 by the EIA. Current inventory is 14.4 Mb higher compared to 1 year ago. In July inventories were higher by 100 Mb.
Oil exports by rail to the US in November were 173.1 kb/d, up from 92.8 kb/d in October and up from a low of 38.9 kb/d in July. Two companies ConocoPhillips and Gibson Energy have developed a new and safer way to ship Canadian Western Canada Select (WCS) oil by rail to the US.
Oil from the oil sands in Northern Alberta is pipelined to Hardisy Alberta via pipeline. The bitumen must be diluted with diluent, approximately 30% diluent and 70% heavy crude, WCS, to be transportable by pipeline. It is then put on trains and shipped to the US. The new idea is to remove the diluent in Hardisy and then ship the heavy crude as a nonhazardous commodity.
The project calls for construction to begin in April, with the diluent recovery unit (DRU) in service sometime in the second quarter of 2021. A subsidiary of ConocoPhillips has agreed to process 50,000 barrels per day of inlet bitumen blend through the DRU, according to USD, a master limited partnership formed by USD Group, and Gibson, a Canadian crude oil-focused infrastructure company.
The DRU will produce DRUbit, which USD describes as “a proprietary heavy Canadian crude oil specifically designed for rail transportation.” The product enables the crude or bitumen to become a nonhazardous, nonflammable commodity, according to USD. The producers hope the project will serve as a way for heavy Canadian crude to get to the U.S. Gulf Coast in a manner that’s economically competitive to pipelines, in part because it can use the existing railcar fleet. CP has also said the product will allow 30% more crude to be loaded in each tank car, making the rail costs more competitive with the pipeline.
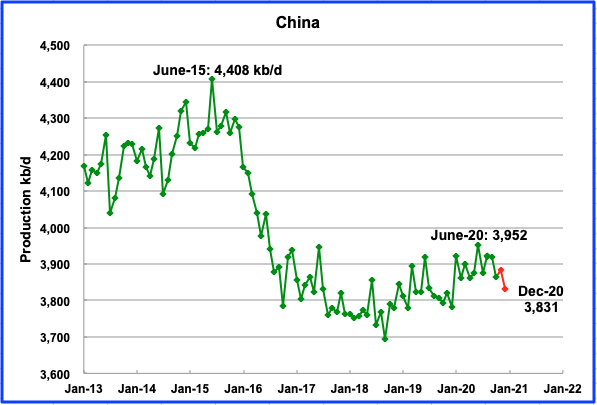
The EIA reports that Chinaʼs October output decreased by 57 kb/d to 3,864 kb/d from September. This source reported crude output for December dropped to 3,831 kb/d. (Red markers).
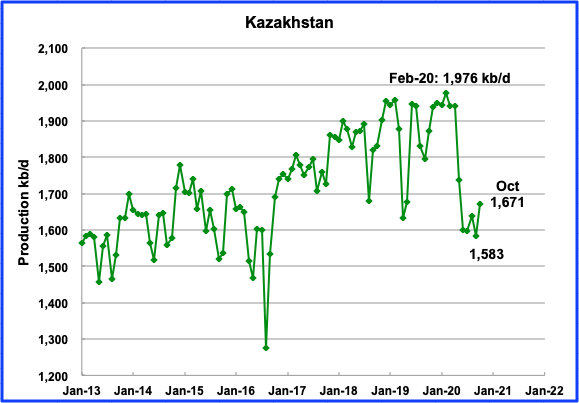
Kazakhstan’s October output recovered by 88 kb/d to 1,671 kb/d. The big drops in May and June are associated with their commitment to reduce output to the members of the OPEC + pact. In the last OPEC + meeting, they were permitted to increase their output.
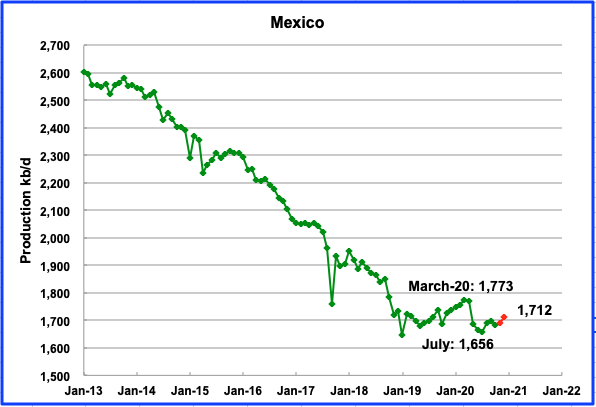
Mexicoʼs production decreased in October by 17 kb/d to 1,682 kb/d, according to the EIA. Data from Pemex shows that production in December increased to 1,712 kb/d (Red markers).
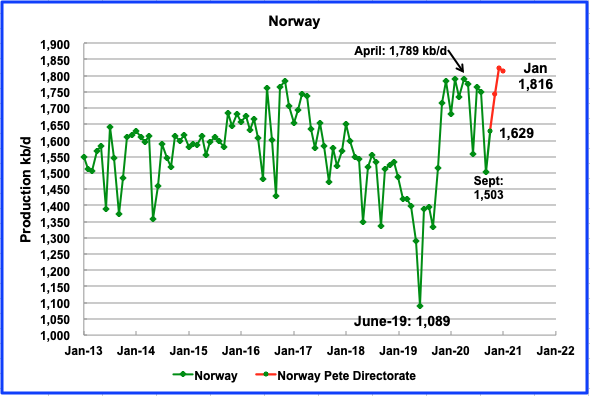
The EIA reported that Norwayʼs October production was 1,629 kb/d, an increase of 126 kb/d from September. Low production in September was due to annual maintenance.
According to the Norwegian Petroleum Directorate’s (NPD) February report, oil output increased by 79 kb/d to 1,824 kb/d in December and decreased by 8 kb/d to 1,816 kb/d in January. In October 2019 the Johan Sverdrup started phase one production with an expected maximum output of 500 kb/d. In September 2019, Norway’s output was 1,333 kb/d. Adding 500 kb/d would bring Norway’s output to 1,833 kb/d. It appears that target was achieved. January 2021 production was 1,824 kb/d, essentially on target.
In the previous NPD reports, they made the following statement: “On 29 April 2020, the Government decided to implement a cut in Norwegian oil production. The production figures for oil in “Month” include this cut of XXX,XXX barrels per day in the second half of 2020.
The January report just states: “Oil production in January is equal to the NPD’s forecast”. This means that Norway is now back to full production and is not contributing to the OPEC + output reductions.
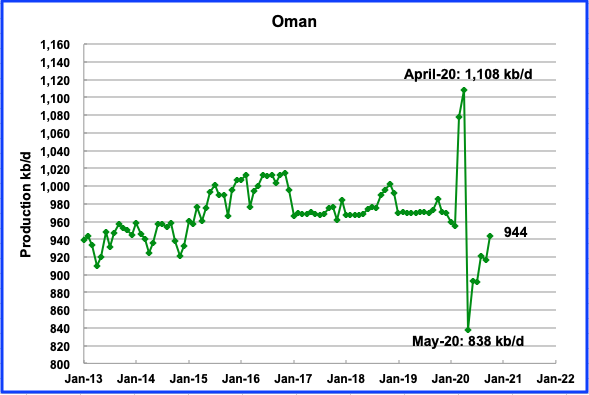
Omanʼs October production increased by 27 kb/d to 944 kb/d.
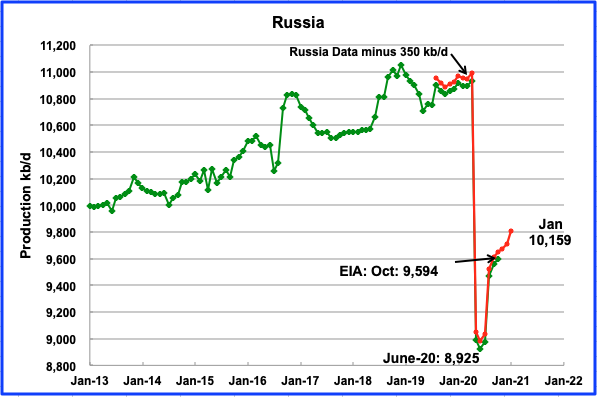
According to the Russian Ministry of energy, Russian production increased by 100 kb/d in January to 10,159 kb/d. According to OPEC, production in Russia is expected to average 10,200 kb/d in 2021, slightly higher than January’s output.
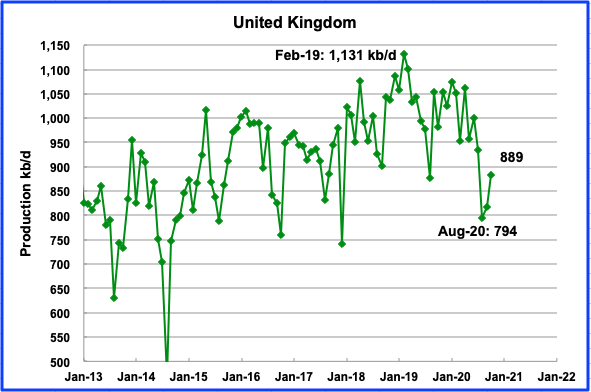
UKʼs production recovered by 71 kb/d in October to 889 kb/d. The recovery is due to the completion of some of the planned summer maintenance. According to OPEC, UK production is expected to average slightly over 1,000 kb/d in 2021.
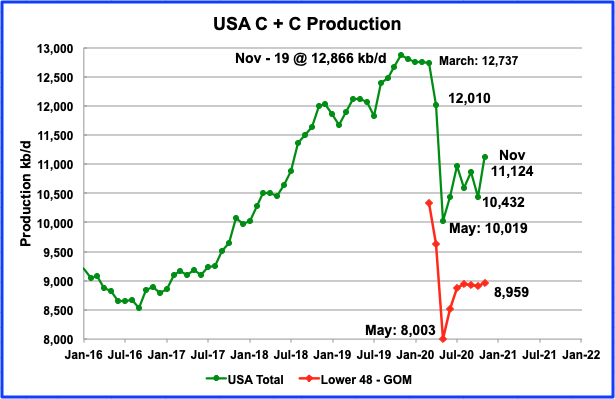
Novemberʼs US production increased by 692 kb/d to 11,124 kb/d from Octoberʼs output of 10,432 kb/d. Novemberʼs increase was largely due to the GOM coming back on line after being shut twice because of the October hurricanes. The effects of shutting the GOM can be seen in the November onshore L48 production red graph which has been essentially flat since August at 8,959 kb/d, 13 kb/d higher than August. Of the 692 kb/d November increase, the GOM contributed 645 kb/d, 93.2%.
As noted above, there has been essentially no increase in oil production in the onshore L48 since August. During August there were close to 180 rigs operating in the US. By November the US rig count had increased to close to 235. The increase was only sufficient to offset the continuing decline in the previously drilled and producing LTO wells.
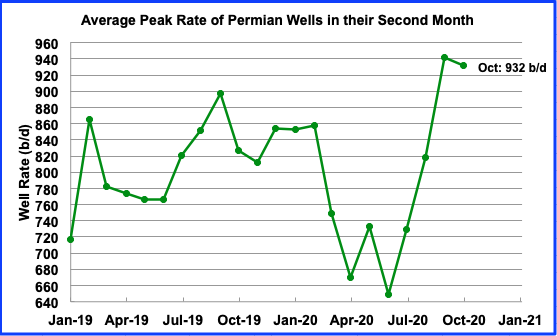
This chart shows the peak production that Permian wells achieve in their second month. The data was taken from ShaleProfile. It is an indicator of the progress that drillers have been making in increasing the efficiency of their drilling operation. September was the highest rate achieved at 941.7 b/d. It is not clear whether the increase is associated with longer laterals or whether the drilling area of these new wells has a higher quality than previous areas. These 2020 wells are producing more oil, total barrels, than last year’s wells up to November.
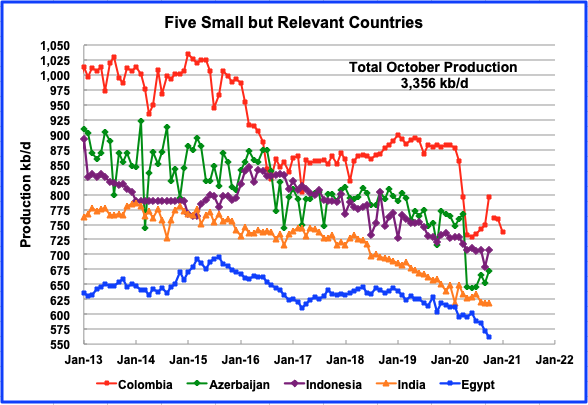
These five countries complete the list of Non-OPEC countries with annual production between 500 kb/d and 1,000 kb/d. Their combined October production was 3,356 kb/d up by 85 kb/d from Septemberʼs output of 3,271 kb/d. Columbia and Azerbaijan appear to be recovering, however the EIA data for October is not consistent with data from Hydro Carbons Columbia (HCC).
The HCC reported November production increased to 761 kb/d in November, according to this source while the same source reported October production to be 751 kb/d. However the EIA’s reported October production of 797 kb/d is not consistent with the later source. For January, the HCC is projecting a production drop again. (Last red markers for Columbia)
World Oil Production
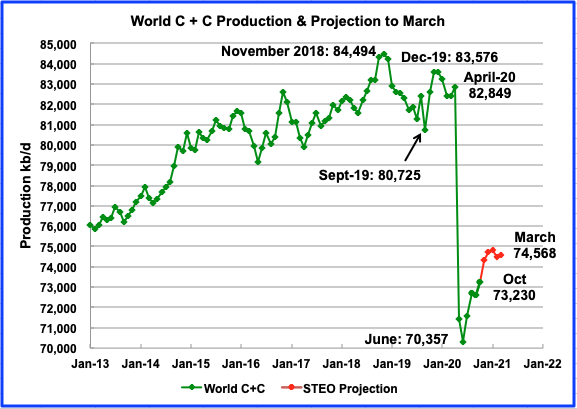
World oil production in October increased by 641 kb/d to 73,230 kb/d according to the EIA.
This chart also projects world production out to March 2021. It uses the February STEO report along with the International Energy Statistics to make the projection. It projects that world crude production will grow by 1,100 kb/d to 74.331 kb/d in November but then stay relatively unchanged till March.
3 responses to “October Non-OPEC Oil Production Resumed Climb”
Thanks Ovi.
Schinzy
Much appreciated
Due to the early posting of the EIA November World update, a November update has been posted one day after the October update was posted.
A new thread October Non-OPEC oil production has been posted.
http://peakoilbarrel.com/november-non-opec-oil-production-jumps/
A new open Thread Non-Petroleum has been posted.
http://peakoilbarrel.com/open-thread-non-petroleum-february-21-2020/