This is a guest post by David Archibald. The opinions expressed in this post do not necessarily represent those of Dennis Coyne or Ron Patterson
Mexico, China and Beyond
Ron Patterson’s post asking if China’s oil production has peaked reminded me of Mexico
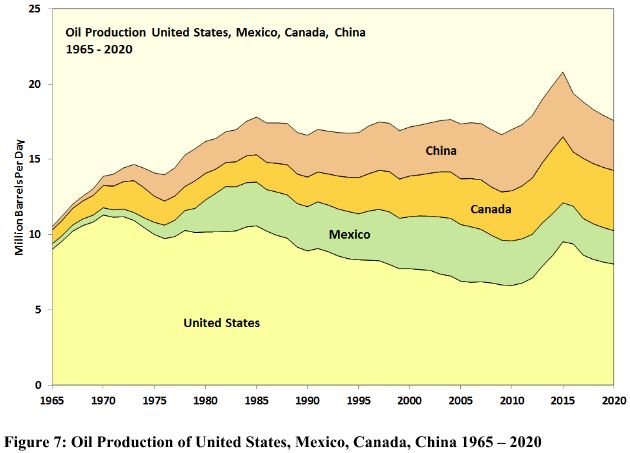
which also produces mainly from supergiant fields. Mexico’s oil production peaked in 2004 and has averaged a 3.5 percent per annum decline rate since, with a peak yearly decline rate of 9 percent in 2008. China’s oil production has fallen 10% from its peak in 2015. Part of that is oil price-related as the Daqing oil field has an operating cost of $46 per barrel and could reverse as the oil price rises. The comparison of China and Mexico with a projection to 2023 is shown in the following figure:
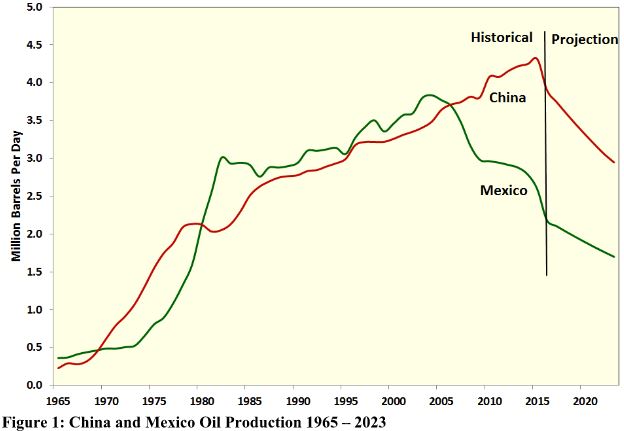
The production histories tracked each other from 1965 until they parted ways in 2005. Themainstay of Mexican production had been the Cantarell field as shown by this graph from The Economist with data up to 2011:
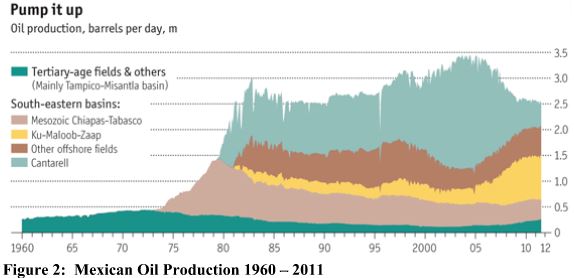
Cantarell production had been pumped up with nitrogen injection until sudden collapse in2005. Part of the decline from Cantarell was offset by increased production from Ku-Maloob-Zaap. Mexico is now producing slightly more oil than it consumes. In the absence of successful privately funded oil exploration from here, Mexico will become an importer of both oil and food.
A good description of the Chinese oil production industry is provided by a paper by Aleklett, from the University of Uppsala, et al from 2010 using data up to 2007. One field, Daqing discovered in 1959, had been producing about a million barrels per day for close to 30 years:
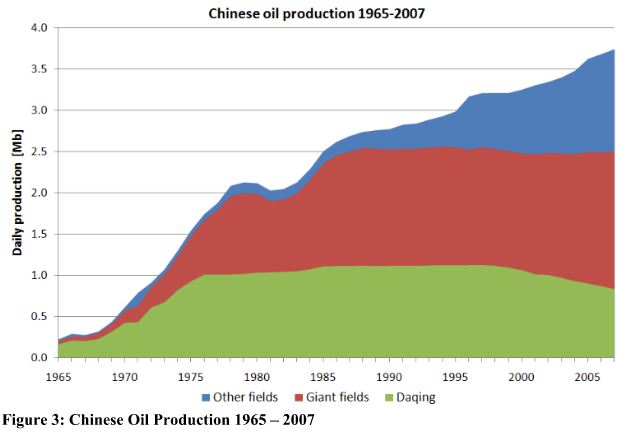
Table 2 from that paper is reproduced following. It shows that only one of the Chinese giant oilfields would not have entered decline by 2015:
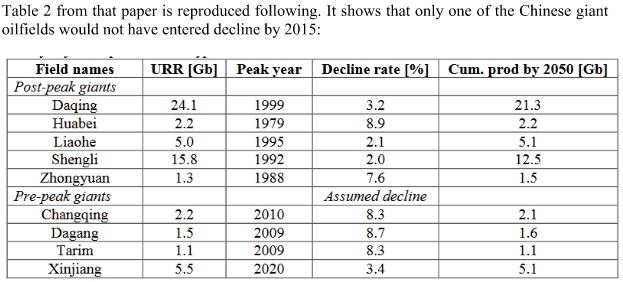
In our modelling we have assumed that Chinese oil production decline will by 4 percent per annum from 2016. That will help tighten the market but the big question is what will US shale oil production do? An outlook for the Bakken is provided by Figure 4 following:
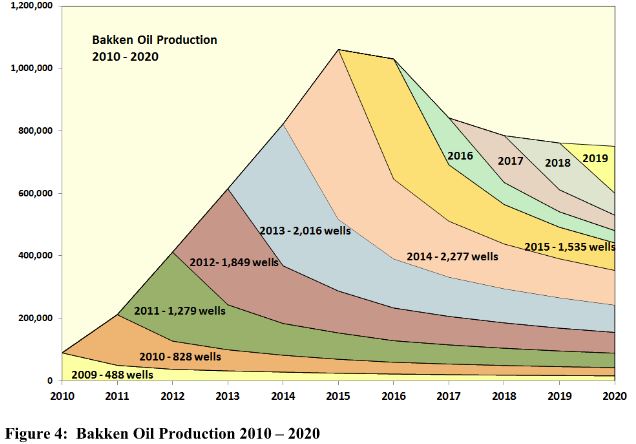
This figure ignores the wells drilled prior to 2009 and is based on production started from January in the following year and thus has a lower peak production than a chart using monthly data. It is an attempt to develop a projection using a correct decline curve for the Bakken. The data for 2016 and beyond assumes that 600 wells are drilled each year. This is also about the rate that would keep production nearly flat until well locations run out. Figure 5 shows what the whole US shale oil industry looks like:
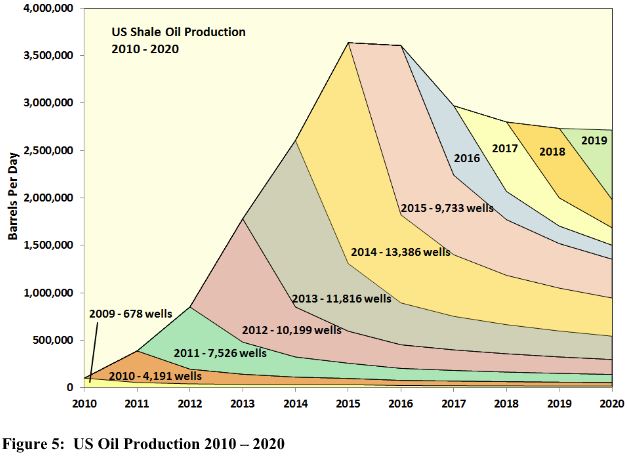
The methodology is the same as for Figure 4. The data for 2016 and beyond assumes that 4,000 wells are drilled each year. This rate of drilling would keep US shale oil production flat on the proviso that well quality does not deteriorate.
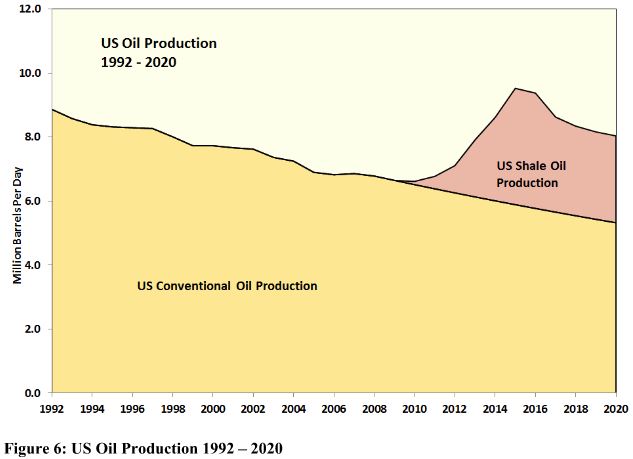
US conventional oil production has been declining at about 2 percent per annum for decades as shown by Figure 6. Presently that decline rate is just over 100,000 barrels per day per year. If US shale oil production stabilizes due to drilling of about 4,000 wells per year, total production will still decline.
If China has now tipped over into a decline emulating that of Mexico, the three biggest sources of oil production decline are now lower US oil shale drilling, ongoing Mexican decline and Chinese decline. On top of all that is the damage done to the upstream oil industry around the world over the last two years dues to low oil prices. The ability of the U shale oil industry to come roaring back may be determined by the quantity and number of drilling locations at various oil prices. Civil wars in a number of Middle Eastern countries is another hard-to- quantify factor, though positive.
David Archibald is the author of Twilight of Abundance.
_____________________________________________________
Editors Note: Please limit comments on this post to petroleum related subjects.
203 responses to “Mexico, China and Beyond”
I have estimated China’s oil imports under the assumption that Chinese oil decline would follow the same pattern as the US
5/9/2016
China’s oil peak 45 years after the US peak
http://crudeoilpeak.info/chinas-oil-peak-45-years-after-the-us-peak
Matt – how come you don’t allow comments at your site (which is very good by the way, if a bit Australia-centric for a lot of us here)?
Because I would not have time to go through all these comments
10/6/2015
China’s offshore CNOOC started to peak in 2010
http://crudeoilpeak.info/chinas-offshore-cnooc-started-to-peak-in-2010
Chinese oil demand is now very uncertain.
The End of China Inc?
15/9/2016 As time is running out for China to pay off its bad debts, 101 East investigates if this could be the end of China Inc.
http://www.aljazeera.com/programmes/101east/2016/09/china-economy-160913081105227.html
In February 2015 China expert Anne Stevenson Yang did this presentation at the CSIS describing that the end of QE3 – which coincided with the oil prices drop – was a turning point for China’s capital reserves.
https://www.csis.org/events/china-reality-check-has-hard-landing-china-already-started
In April 2016 she estimated China would be running low on FOREX within 9 months
http://www.grantspub.com/files/presentations/Stevenson-Yang%20Spring%202016.pdf
Latest:
Warning Indicator for China Banking Stress Climbs to Record
18/9/2016
The gap is the difference between the credit-to-GDP ratio and its long-term trend. A blow-out in the number can signal that credit growth is excessive and a financial bust may be looming.
http://www.bloomberg.com/news/articles/2016-09-18/bis-warning-indicator-for-china-banking-stress-climbs-to-record
Hi Matt,
I have pulled data for country a and country b from the BIS data. Which country is in financial trouble? If one assumes that past trends continue, perhaps country b will be in trouble, but if the trend flattens as it did from 2010 to 2012, or slowly declines as it did from 2004 to 2009, then perhaps not. Or perhaps country a is in trouble due to its lasting high credit to GDP %.
Anyone care to guess at which countries a and b represent?
Country a is Switzerland
Country b is China.
Excellent post. This should be better known nationally, although no one is listening. Throw on top of that offshore drilling, and I think you have the greater part of non-OPEC production. All are in decline over the next two years, no matter what the price of oil goes to. It would take two years of healing before there is enough capital to expand. That still would not affect the curves, overall. Except for Canadian oil sands, and they will be reticent to jump back in; and couldn’t because of the time required to increase. I think you have depicted it well to 2020, disregarding pricing.
Bakken Crude Slashed by East Coast Refineries
Explains why BNSF is 3000 petroleum rail cars lower per week.
http://www.bnsf.com/about-bnsf/financial-information/weekly-carload-reports/
All of the daily production of Canada, China, Mexico, and the United States is consumed by the United States and then some.
Good thing oil is bought and sold and not hoarded.
Pemex are already predicting more than 10% decline for next year, which is more than projection shown I think.
http://www.energia16.com/news/investment-in-oil-equipment-could-reach-14-billion-in-mexico?lang=en
They only really reduced the decline rate by pumping up KMZ with gas flood, including N2, which kept them level for a few years after 2010. That will probably end the same way as it did with Cantarell, i.e. some years of big declines. Things might get worse still in the next year or two as Pemex are going to be expected to lose less money from know on.
What does this statement mean: “In our modelling we have assumed that Chinese oil production decline will by 4 percent”, what is “our” referring to – is this still quoting Kjell Aleklett or referring to someone else and why 4%, is that just a convenient number or based on some more fundamental reasoning? At the moment the decline is accelerating towards 15%.
The USA conventional decline is being kept low by a lot of production coming on stream in GoM. That is probably going to slow down considerably from 2017 through 2020 – maybe to a plateau for the GoM, and hence leading to an accelerating decline for USA conventional overall. After that, given that there aren’t many discoveries and a lot of the majors have stopped looking, the GoM will probably go like China, at least 10% and maybe as high as 15% declines.
Some time around late 2018 the cuts in development budgets since 2014 will start to impact strongly, and sometime around 2020 the lack of discoveries will impact (i.e. there won’t be as much to develop even if the budget is available) – I think, but don’t have convincing data, that around 25% of new production over recent years has come from discoveries made less than 5 years previously. That suddenly won’t be there. Other countries could quickly take over from the three given as the big decliners – difficult to predict who though, India and Oman look to be in similar positions now that China was last year having used a lot of EOR, but I think the big shock will come from one of the main OPEC producers.
The LTO predictions look in line with results presented by a Total engineer and available at ASPO France, and that are based on fairly detailed first principal modelling from what I can tell, so these profiles might well turn out to be pretty good in the end.
Hi George,
I know you have no idea what oil prices will be (and I don’t either, but I am willing to guess.) Let’s assume the World economy does not immediately crash as oil output starts to decline (it is unlikely imo that all of the rapid declines that you foresee will happen simultaneously so rapid decline in World output is unlikely in the next 3 years).
Let’s also assume that price is determined by supply and demand and that World demand increases by 1%/year or more and that World supply will decrease by 1% to 2%, wouldn’t you expect that oil prices would rise? Under those circumstances I would expect increased completion rates for US LTO and US LTO output may return to its previous peak by 2019 and remain close to that level by 2021. By that time there will have been time for further development in the GOM and other offshore areas, as well as oil sands development assuming that oil prices remain above $85/b over the period.
I think it likely that oil prices will remain in the $80 to $150/b range from 2018 to 2030, unless there is a World depression in the interim. I also think it likely the World C+C output will remain within 2 Mb/d of 80 Mb/d from 2016 to 2022 (78 to 82 Mb/d).
Oil prices may rise but they don’t impact supply for several years.
“By that time there will have been time for further development in the GOM and other offshore areas …” – Not in the GoM, there just aren’t enough undeveloped known discoveries, only enough to just about maintain the plateau until 2020 assuming they get developed. There’d need to be new lease sails (at the moment not much interest), new exploration (at the moment all majors are pulling out), good luck with discoveries (at the moment the new options look to be reducing in size and number and they are in new areas so large discoveries are needed to be able to develop a hub), then 5 to 10 years to develop what will be very expensive oil when the companies are loaded with debt. Oil price over the next 5 years isn’t going to impact that timing.
Brazil will increase production slightly, what price and debt exposure they need to develop the pre-salt remains to be seen. Angola will continue a gentle decline unless it all falls apart with either the rebels or the IOCs justing getting fed up and pulling out. Nigeria have a few project options but no exploration at the moment and face a pretty big gap new production in a couple of years.
Hi George,
There will be more infill drilling with higher oil prices, that will affect output and does not take a long time (1 to 2 years), LTO can also ramp up quickly as most of the infrastructure is in place and will react relatively quickly to an increase in oil prices. This may not increase output at first, it will slow the decline, then it will be stabilized and then supply will rise after 2 years, in the mean time demand will continue to grow and oil prices will gradually (or perhaps sharply) increase. The faster the rise in oil prices, the quicker the supply response will be (infill drilling and LTO) and deepwater projects and exploration will be ramped up more quickly in the face of high oil prices.
Do you have an estimate for World C+C URR? Laherrere’s current estimate is 3000 Gb. Model below uses that estimate with gradually rising extraction rates (from World proved developed reserves, estimated using the shock model and backdated discovery data from Laherrere, and EIA output data to determine historical extraction rates).
Dennis – do you know how to do in-fill drilling on deep water fields? I think probably not in detail. There has to be a well slot on a subsea manifold available, probably two to support injections. Also there has to be capacity for all the control and monitoring of the well that is needed – this goes through an umbilical which goes to some kind of termination unit and then each service is split to the wells. If there isn’t capacity then new manifold, flowlines, umbilical and risers are needed (that’s three years), but likely there won’t be a conductor slot available on the hub so things stop there anyway. Even if you have the slots maybe you don’t have the capacity in the flowlines – they get multiphase flow and pressure drop relations aren’t what you think sometimes. Generally they have a narrower range of operation than an oil line and they don’t get built with a lot of excess capacity “just in case”, and pretty soon after start up the water cut and GOR starts to hit limits. Next you have to be able to test wells so they need to be routed through different manifolds without commingling. Next you need to make sure you have processing and injection capacities. And if all that works you go ahead and try to book a very expensive drill vessel which may or may not be available. But before any of that you have to have identified a decent location in the formation where you are going to get some kind of benefit rather than just stealing production from an existing well set. It is nothing at all like a small onshore jack pump and doesn’t get done in much less than two years, and financially it is easy to show it is nonsense in most cases because you are forking outt millions and millions of dollars just to accelerate a bit of production, not to increase your recovery. It is rarely done..
Hi George,
I meant infill drilling onshore in Russia and the Middle East mostly. That and a higher LTO completion rate may be enough to maintain the plateau, have all deepwater projects in the World that are being developed reached their maximum output levels?
So yes, I was aware that infill drilling is generally not done in deepwater, though I could not have given an extensive list of the reasons, I would have said it’s not profitable to do so in most (or perhaps all?) cases.
George Kaplan: I enjoy reading this kind of post greatly, thank you
Hi George,
SouthLaGeo, seems to think that the GOM will remain on plateau until about 2022 in his “medium” scenario, perhaps he is incorrect, but he seems to follow the GOM pretty closely, no doubt you think his low scenario is too optimistic and expect declining output from 2016 or 2017 forward. I don’t know, I would tend to take the medium scenario based on his judgement.
They might make it to 2022 if all the known discoveries are approved for development and brought on line before then (which means FID for the big ones like Shenandoah, Kaskida, Mad Dog II and Vito by the end of next year). After that it will go down at 10 to 15% unless there are big discoveries soon. And as I said the GoM on plateau means an acceleration in USA conventional decline rates, because there has been significant growth rate since 2012.
Hi George,
I agree that conventional decline has accelerated due to low oil prices, I do not expect low oil prices will continue for much longer (I will call “low” less than $55/b). Eventually oil supply will fall below the demand level at $50/b or less (by early 2017) and oil prices will rise as stocks are drawn down.
Note that US L48 onshore declined at 3.8%/year from 1985-2000 and this rate slowed (when LTO output is deducted) to 1.6%/year from 2000-2015, higher future oil prices may moderate the US L48 onshore conventional decline rate to between 1.6 and 3.8%/year, maybe 2.7%/year. US LTO output may recover to the previous peak and remain at that level for 5 years or it may peak for a couple of years and then gradually decline for 10 years before further completions are no longer profitable. This will depend on oil prices and whether non-core areas can be profitable. This is not known.
Again SouthLaGeo sees this differently with about a 5.5% annual decline rate from 2027 to 2040 after a plateau out to 2027 at slightly below peak rates (about 1.55 Mb/d, where peak is 1.6 Mb/d for medium scenario.)
He seems to be more optimistic than you about the GOM. I don’t know myself.
That should have been principle not principal.
My principal complaint is that some people have no principles.
Daqing oilfield production has stabilized at around 800 kb/d in 2008-2014 thanks to a sharp increase in drilling in previous years. However in 2015 the number of development oil wells drilled dropped by 29% (to 5,106 from 3,645 in 2014). In addition, a number of producing marginal wells were shut in due to low oil prices. As a result, Daqing crude oil production declined by 4.6%, to 756 kb/d, and the decline continued in 2016. (Unfortunately, Petrochina does not provide field-by-field production numbers in its quarterly and interim reports).
At this point, it is difficult to separate the effects of field depletion and lower oil prices/lower capex/less drilling. In my view, as oil prices are unlikely to reach $100 in the next few years, drilling volumes at China’s ageing fields are unlikely to return to previous levels, although they may partially recover. Hence, the decline in production will continue, but the pace of decline will decelerate.
Daqing field production oil production vs. development wells drilled
Data source: Petrochina, various annual reports and IPO prospectus
Here is a chart for Daqing oil production in 1960-2008 from CNPC, Petrochina’s parent company (in million tons):
I should note that plateau output was much longer and the decline in Daqing output was much less steeper than at Prudhoe Bay, although Daqing was producting since 1960 while Prudhoe Bay since 1977.
I guess the decline was also much less steeper than at Cantarell.
Prudhoe Bay oil production
source: http://thediplomat.com/2015/07/china-peak-oil-2015-is-the-year/
Daqing oil production forecast to 2020, from the same source
http://thediplomat.com/2015/07/china-peak-oil-2015-is-the-year/
Hi AlexS,
I believe that Archibald believes output other than Daqing may decline more steeply, but would think the US L48 decline would be a better model for China.
From 1973 to 2005 the US L48 C+C output declined at about 2.12%/year. Perhaps the Chinese have developed their fields more aggressively than the US, if so the 4% decline assumption of Archibald may be valid, my guess would be 2 to 4%, but I don’t know enough about whether China has been more aggressive in going after oil than the US (I am skeptical about this assumption).
Hi AlexS,
That is a great article, thanks. You may have mentioned this somewhere, but that piece makes a “conservative” 4% natural decline rate assumption for China, but this is different from the overall decline rate of 4% that Archibald has assumed. Generally the regional decline rate would be less than the natural decline rate unless all oil development ceases (which is unlikely over the next 10 years).
The original driver for this article was China’s sudden 10% drop in production after decades of a monotonic increase. That reminded me of Mexico. If you go to Akelett’s paper, he says the decline rate will be 3%. But the decline started six years later than his modelling and perhaps the Chinese pushed their EOR too hard and therefore the decline will be steeper. At best, the work in this piece is a best approximation of the possible future. It is like the value of having a plan while knowing that the plan will be altered starting from the moment it is put to paper. If China has tipped over into steep decline then that has big geopolitical implications as their free energy to conduct wars against their neighbors will be declining rapidly. China has installed about one million barrels per day of coal to liquids capacity which would use about 180 million tonnes of coal per year – 20% of US coal consumption.
Hi AlexS,
What is your guess for World oil output in 2016? Do the supply forecasts of the IEA, EIA, and others seem a bit optimistic to you? My expectation is around 80 Mb/d at most for C+C output in 2017 and maybe 81 Mb/d in 2018, I doubt this will meet the IEA’s oil demand forecasts (which seem more reasonable to me.) This indicates rising oil prices from 2016 to 2018, perhaps to $85/b (my guess).
After 2018 I believe that the World will struggle to maintain 80 Mb/d and would expect further increases in the oil price (assuming 1.2% demand growth continues) to over $100/b by 2019/20.
You may believe my supply forecast is too conservative(low) or my demand forecast is too optimistic (high) or both. Or like many others, you may be wise and choose not guess the future of the oil market.
There’s an interesting bit in the table in David’s article above concerning ultimate production in Chinese fields. Dagang is shown as having an estimated URR as 1.5 Gb, but cumulative production by 2050 of 1.6 Gb. Similarly, Liaohe has an URR of 5.0 Gb, but a cumulative production by 2050 of 5.1 Gb, while Zhongyuan has an URR of 1.3 Gb, but a cumulative production by 2050 of 1.5 Gb. Can anybody explain why the cumulative production by 2050 for these fields will go beyond their URR?
An obvious suggestion is that the URR estimate is too low or the output assumptions for output from 2008 to 2050 are too high. Often a URR based on the HL method results in a URR that is too low.
In 2005, many estimated World URR at 2000 Gb (ignoring extra heavy oil resources), today the estimate is about 2500 Gb, using the HL technique. In 2030, it may be 2800 Gb. There is good data for the US from 1859, if you play with the HL estimate you will find the URR estimate tends to increase over time.
So the short answer, nobody knows what the URR will be.
Most of the above discussion is rather academic. Fact is, China’s largest oilfields are (and have been) declining rapidly and all the Chinese companies have been using up reserves more rapidly than competitors. When I worked in China there was a major push (aided by international consulting firms) involved introducing advanced EOR methods, such as those developed at Prudhoe Bay in largely depleted fields such as Daqing. You’d be wise to ignore those URR numbers which are mainly fiction with zero relationship to reality.
Perhaps I ought to add that my main purpose for being in China was to assess reserves for a Texas based American company anxious to become involved there. I’m not a petroleum engineer but I read both Chinese and Russian (in China a lot of technical reports are still in Russian).
Over a seven year interval I was able to interface with many many highly informed people and learn to distinguish the wheat from the chaff (mostly anyway). In a nut shell, my view is China’s old oil fields are toast and that production would be a bit higher but for the relatively high cost of EOR in general (i.e., can’t be justified at current oil prices).
China oil production has a good chance of increasing substantially in the near term.
“The South China Sea opened around 45 million years ago when the “Dangerous Ground” rifted away from southern China. Extension culminated in seafloor spreading around 30 million years ago, a process that propagated to the SW resulting in the V-shaped basin we see today. Extension ceased around 17 million years ago.[15] Arguments have continued about the role of tectonic extrusion in forming the basin. Paul Tapponnier and colleagues have argued that as India collides with Asia it pushes Indochina to the SE. The relative shear between Indochina and China caused the South China Sea to open.[16] This view is disputed by geologists[who?] who do not consider Indochina to have moved far relative to mainland Asia. Marine geophysical studies in the Gulf of Tonkin by Peter Clift has shown that the Red River Fault was active and causing basin formation at least by 37 million years ago in the NW South China Sea, consistent with extrusion playing a part in the formation of the sea. Since opening the South China Sea has been the repository of large sediment volumes delivered by the Mekong River, Red River and Pearl River.”
Sediment. Seems a bit young for oil, but there is a 7.7 billion barrel “proven reserves” claim by several sources (including EIA). 7.7 > 1.x at Daquing. Doug, isn’t 45 million rather young?
“China is “disappointed to the point of despair” with Japan’s conduct in the South China Sea, it said Monday, after Tokyo announced it may set up training patrols with the US in the contested region.”
That’s Monday as in yesterday.
When oil was formed and moved is always a question. For example, they’ve now decided the Alberta tar sands formed 100 million years ago (rather than 60) and I know Prudhoe Bay oil is in Triassic-aged rock. As near as I can remember conventional deposits are: 70% Mesozoic, 20% Cenozoic and about 10% Paleozoic in age. Most oil shale deposits are in old rock: some as old as Middle Cambrian. So you’ve got a good question there.
Didn’t BP explore around there a lot in the 90’s? The seismic looked good, the wells were very expensive, but all they found was water.
Watcher,
My guess is that “extrusion” should be replaced by “extension” in the above quote. “Tectonic extrusion” has no meaning that I know of (though I could invent one), especially in connection with the opening of a structural basin.
I can sell you a property in Pakistan that’s full of sediment, in an area known to have oil and gas. For a slightly lower price I can get you leases in the Southern Caspian, which are known to have huge piles of sediment, and very large structures. Other areas with huge piles of sediment are found in Africa, say to the East of Lake Turkana. If you are interested in sediment in glamorous spots, we can definitely find them for you.
One guesses the primary evidence of oil is willingness to kill people for that region.
DougL,
How did you learn Russian?
(Old DLI graduate here)
When in university we had to be proficient in two foreign languages, besides English. My (Norwegian) wife spoke Russian & French fluently so we decided to speak Russian on weekends and French on Tuesdays and Thursdays. Norwegian and Swedish didn’t count. We kept doing this when we had kids but, for some reason, switched from Russian to German on the weekends. Our kids wanted to scratch Deutsch and do Spanish but it never happened. Actually, Spanish would have been more useful — I think.
I’ve been wanting to learn Russian for a long time and began it as part of an online course at Russia Today a few years ago (but have left it momentarily). Russian’s one of my favorite-sounding languages.
How do you like it and how well do you think you speak it?
“How do you like it and how well do you think you speak it?” I’m 75, living with a terminal disease and don’t do anything well anymore. Actually, I enjoyed speaking Russian around home (weekends) and liked Pushkin’s poetry. Probably my grammar sucks — based on how my wife rolled her eyes on occasion. I used to talk to Russians in Siberia who claimed I sounded OK but likely it was because they thought I sounded OK — for a foreigner.
Well that’s interesting and fair enough about your Russian. I have maybe 4 words.
But sorry to hear about your illness. How are you managing and how much time do you think you have? Life is ultimately terminal of course. I wonder how I’ll exit.
CNPC website on the use of EOR at Daqing:
“In the late 1980s, Daqing Oilfield entered the later stage of high-water-cut development, with its total water cut up to 90%. Daqing focused on enhancing the recovery efficiency of the major reservoirs in Changyuan by taking measures like stabilizing oil output and controlling water cut, drilling infill wells and carrying out tertiary oil recovery tests like polymer flooding and ASP flooding. After polymer flooding had been put to industrial use, the recovery efficiency was increased by 10% on the basis of water flooding, equivalent to an increase of 300 million tons in recoverable reserves.”
Meanwhile, the chart below indeed shows that proved oil reserves of the Daqing field are rapidly depleting. A sharper decline in 2015 may also reflect reserve re-assessment due to low oil prices.
As of the end of 2015, proved oil reserve life of the Daqing field was 6.5 years. Of course, there are also unproved reserves. But production volumes have persistently exceeded proved reserve additions.
Daqing field proved oil reserves and reserves/production ratio
Data source: Petrochina annual reports and IPO prospectus
90% is not uncommon. There are quotes of Texas wells running at 99%. Expensive water.
A big unknown at least to me is the quantity and quality of the remaining shale oil drilling locations in the US. Off the top of my head I would say that the Bakken is at least half drilled out and the quality of what remains is tapering off, requiring successively higher prices. Do you have any knowledge of the matter?
Hi David,
Hughes estimates about 20,000 to 29,000 potential wells in the ND Bakken/TF, about 11,000 wells have been completed so far so, if his low estimate is correct you would also be correct, the NDIC thinks there will be 55,000 wells completed, I think Hughes high estimate will be about right.
For the Eagle Ford Hughes estimates about 42,000 total wells and about 16,000 oil and gas wells have been completed as of Sept 1, 2016, so there is still a fair amount (26,000) of wells to be drilled, if Hughes estimate is correct.
I don’t know about the Permian basin, I expect if oil prices rise there is a fair bit of oil completions left there. Probably there is an EIA estimate but is likely to be too high by a factor of 1.5 or more.
Comment moved to non-Petroleum Thread. I reserve the right for Ron or I to delete off topic comments, limit comments about other writing of David Archibald on non-Petroleum topics to the non-Petroleum thread.
Thank you.
Jean Laherrere posts the following:
Dear Dennis
on the last post on China by Ron
there are these comments:
Ablokeimet says:
09/20/2016 at 9:34 am
There’s an interesting bit in the table in David’s article above concerning ultimate production in Chinese fields. Dagang is shown as having an estimated URR as 1.5 Gb, but cumulative production by 2050 of 1.6 Gb. Similarly, Liaohe has an URR of 5.0 Gb, but a cumulative production by 2050 of 5.1 Gb, while Zhongyuan has an URR of 1.3 Gb, but a cumulative production by 2050 of 1.5 Gb. Can anybody explain why the cumulative production by 2050 for these fields will go beyond their URR?
Dennis Coyne says:
09/20/2016 at 10:44 am
An obvious suggestion is that the URR estimate is too low or the output assumptions for output from 2008 to 2050 are too high. Often a URR based on the HL method results in a URR that is too low.
In 2005, many estimated World URR at 2000 Gb (ignoring extra heavy oil resources), today the estimate is about 2500 Gb, using the HL technique. In 2030, it may be 2800 Gb. There is good data for the US from 1859, if you play with the HL estimate you will find the URR estimate tends to increase over time.
So the short answer, nobody knows what the URR will be.
The best data on Daqing is from Xu Tang who estimates Daqing EUR at 24 Gb
http://dx.doi.org/10.1016/j.energy.2010.03.043
Forecast of Oil Reserves and Production in Daqing Oilfield of China
Xu Tang1* Baosheng Zhang Mikael Höök Lianyong Feng
This EUR is confirmed by the HL of oil production
best regards
jean
Thank you Jean,
Sometimes the HL does a good job, sometimes not. You may be able to tell in advance which will be correct, I cannot.
What’s your decline rate for tight oil wells? To me, it looks like you are using a (high) conventional rate of 6-8% where they see rates in the double digits in the first year and leveling off after 2 years at around 10% of initial production.
https://uu.diva-portal.org/smash/get/diva2:762320/FULLTEXT01.pdf
Thoughts?
Hi Mad,
For the Eagle Ford, I fit a hyperbolic to the average well data and after month 148 assume exponential decline at 10%/year.
q= 19489.01468
b= 0.731075821
d= 0.23539873
data used in fit (in barrels per month) from month 1
6305.727648
14,222
12,617
10,461
8,898
7,830
6,951
6,132
5,666
5,183
4,753
4,451
4,038
3,844
3,612
3,341
3,083
2,869
2,651
2,545
2,382
2,224
2,173
2,130
2,045
2,014
1,888
1,854
1,825
Data is the 2013 to 2015 average Eagle Ford well (natural gas is ignored) this is crude only output as reported by the RRC (condensate is excluded).
EUR is 199 kb assuming well is shut in at 10 b/d.
For Bakken I do a similar hyperbolic fit to data and when the hyperbolic reaches an 8%/year decline rate I switch to exponential decline of the tail (after about 15 years of hyperbolic decline where the decline rate is steep at first and gradually flattens as you are well aware.)
So other than people who have an obvious reason to fib a little, such a reason being to make some money or support their industry friends, who believes oil production will not peak within the next few years?
I don’t put much stock at all in government agency predictions about such matters beyond one or two years. My belief is that such agencies have a strong tendency to find out what the rest of the government wants, and serve it up, in making long term predictions.
Hi Oldfarmermac,
I think Ron may have nailed the intitial peak in 2015, but I expect we will remain on an undulating plateau (maybe from 77 to 81 Mb/d) until 2022, possibly 2025 at the latest (though 2020 is my best guess), after that the rate of decline will depend on how much reserve growth there is from higher oil prices (which are likely to be up to $150/b by 2025). Jean Laherrere’s recent estimate for C+C URR is 3000 Gb (which includes 500 Gb of oil sands), if we have some reserve growth, it might be 3300 Gb (same estimate for oil sands, but 2800 Gb of C+C less extra heavy oil rather than 2500 Gb). Higher URR may mean the annual decline rate is smaller in magnitude. At reasonable levels for the extraction rate from developed reserves, the annual rate of decline will remain under 2.5%/year.
It is not clear if the World economy will be able to cope with the high oil prices that result from this rate of decline, it will depend on quickly we develop alternatives for liquid fossil fuel for transportation (EVs, plugin hybrids, rail, light, rail buses on overhead wires in cities, more bike paths, better urban and suburban city design so people can walk more and drive less.)
I doubt this will be enough and expect an economic crisis to start in 2030+/-5 years.
At that point Leviathan may get to work solving problems.
Interesting concept,
TRUMP’S PLAN TO SEIZE IRAQ’S OIL: ‘IT’S NOT STEALING, WE’RE REIMBURSING OURSELVES’
https://www.theguardian.com/us-news/2016/sep/21/donald-trump-iraq-war-oil-strategy-seizure-isis
From your link:
He added: “One of the benefits we would have had if we taken the oil is Isis would not have been able to take oil and use that oil to fuel themselves.”
What an idiot. If we had taken the oil, he thinks it would be gone now because we took it. So now, as they have taken over the land over the reservoir, there would now be no oil there because we took it all.
It is astonishing that millions of people will vote for this stupid idiot. Well, I guess he is not that stupid. He has managed to con millions of people out of their money. Perhaps he is just a smart psychopath with little knowledge outside his chosen field, conning other people out of their money.
Hi Ron,
Given that you are a self described capital D liberal Democrat, you ought to be thanking your lucky star for Trump.
He may very well be the only R that Clinton can beat. 😉
I think she will win, and my brain is telling me she is almost certain to win. But I don’t have my usual deep gut feeling about who will win this close to election time.
Major surprises are still possible, and if they favor Trump, he might win.
Don’t care much. Starvation is non partisan.
But of all that has unfolded the most outrageous item was the medical report. The hugging of the child had to be dealt with, so they inserted “non contagious” in front of pneumonia.
Not credible to imagine that document didn’t get triply reviewed by everyone.
And yet there it is. If it’s non contagious she could not have caught it.
Isn’t that oil currently being drilled by nuclear armed countries?
Is trump going to take it from Petrochina or Roseneft?
And produce it with what?
I really wonder some days if Trump isn’t in collusion with HRC and WANTS to lose the election.
( The sarcasm light is ON. But maybe it ought not be?)
One of the major news organizations, I forget which, says Clinton is outspending him on TV by fifty to one in Florida.
If the old saying about a fool and his money soon being separated holds true, Trump can’t possibly be as stupid as he acts, as a political candidate.
Of course hard core liberals will blame it on the electorate if he actually wins, but it is well known that people in crowds tend towards acting irrationally.
I will blame it on the D party for allowing itself to be owned and operated as a personal fiefdom by the worst D candidate within living memory and arguably the worst one ever.
But at least this one thing can be said for Clinton, she ain’t Trump.
Companies drilling in Iraq. I can’t imagine it would be good for international relations if Trump booted all these guys out and “took” the oil.
If that happened we could send Mike, Fernando and ShallowSand in there to get “our” oil.
We certainly wouldn’t get much help from the companies below.
Bashneft
•BP
•China National Offshore Oil Corporation (CNOOC)
•China National Petroleum Corporation (CNPC)
•Dragon Oil
•Egyptian General Petroleum Corporation (EGPC)
•Eni
•ExxonMobil
•Gazprom
•Inpex
•Japan Petroleum Exploration Company (Japex)
•Kogas (Korea Gas Corporation)
•Kuwait Energy (KEC)
•Lukoil
•Occidental Petroleum
•Pakistan Petroleum
•Petronas
•Premier Oil
•Shell
•Total
•Türkiye Petrolleri Anonim Ortaklığı (TPAO)
The Shell Cheshire well in the Shelburne basin offshore Nova Scotia has been declared non commercial. They have one more well, Monterey Jack, to drill in the $1 billion exploration lease with the SeaDrill IceMax drillship. There was a major lost time incident in the program when the marine riser assembly broke off during a storm and had to be retrieved from the sea bed. The well probably cost more than $500 million in the end (just a guess by me). Previously Marathon drilled in the area and had a major failure as well, which was probably much closer to a big loss of containment and possible explosion than the Shell one. BP have also a $1 billion bid on another exploration lease in the area but in the last year or so seem to be pulling back from actually spending the money. This might be another frontier territory that is becoming non-prospective.
Any reason for the huge drop in inventory today?
Probably because net imports were down almost 1.5 million barrels per day.
a lesson in life. There are those that spend their time doing and make a decent living and there are those who spend their time “bitchin” and are deservingly left behind never we-re’s. The history of man’s innovation at its best and those that do not have the grey matter to connect the dots.
http://www.oilandgas360.com/trending-in-the-utica-and-marcellus-superlaterals/
http://www.thecountrycaller.com/53966-bp-plc-adr-bp-to-acquire-assets-in-argentina-shale-oil-fields/
Fairly new. less than a week. BP and Exxon sending money to the Vaca Muerta.
Very profitable to drill there. Especially when the government says so… via the official price of oil.
US crude output rose 0,41% weekly to 8.512 mln b/d
mmmm…
the crush is finished?
Things are getting more desperate by the day in Venezuela.
http://www.ibtimes.co.uk/no-referendum-against-nicolas-maduro-this-year-venezuelan-electoral-board-says-1582703
It’s not out of the question that the people will get to the point they shut down the oil industry via sabotage or a general strike.
I can’t remember having seen this Wood Mackenzie piece from July commented on here before. But even if it was maybe after the last couple of posts it should be looked at again.
https://www.woodmac.com/analysis/preFID-oil-projects
“Based on our latest Macro Oils market analysis, over 20 million b/d needs to be developed by 2025 to offset production declines from existing fields and meet future demand growth. Pre-FID projects and future drilling in the US Lower 48 form a critical part of filling this gap, accounting for around 13 million b/d by 2025.
“Of the 13 million b/d available, 9 million b/d is commercial at US$60/bbl Brent. That’s more volume than we’ve seen since 2009 and 1.5 million b/d more than a year ago. New US tight oil drilling picks up the slack, accounting for 60% of the volumes which are commercial at US$60/bbl. Productivity improvements and cost deflation have made tight oil production more economically viable in the key growth plays. Key plays such as Eagle Ford and Wolfcamp dominate the lower end of the cost curve, the latter averaging under US$40/bbl.
“In contrast, the majority of conventional pre-FID projects are not commercial at US$60/bbl. Deepwater and ultra-deepwater projects are still required to meet demand growth, but higher prices or significant additional cost reductions are needed for many to be commercial.”
A number of things strike me. The obvious is the reliance on LTO in USA not only to reverse current declines but to increase peak flow by 6 mmbpd over previous highs. I think most here doubt this is possible.
Second break even price is quoted as if it would be a key consideration, and also is well understood. I think there are different definitions used (e.g. including overheads, operating cost only etc.) However investment decisions are made on NPV, IRR, payback times etc. Companies don’t exist to break even but really to make many for the owners, be they public, private or governments. Most oil companies are now becoming effectively owned by their creditors who are going to start expecting to get repaid between now and 2025.
Third 20mmbpd new production seems to be low. I think this number cannot include projects already in progress, which would be in addition. Even then they must be assuming low natural decline rates and a low growth, or a very high number for post-FID production to come on line. For example, assume C&C only, 4% decline rate, 1 mmbpd per year growth, would require 35 mmbpd new production or 15 mmbdp already in progress. I think there is likely only around 7 to 8 mmbpd greenfield, but maybe more smaller brownfield projects.
Fourth the paper would seem to indicate 7 mmbpd needs to come from new discoveries. Typically that production would require about 50 Gb of 2P reserves. At the moment we would only find 15 Gb (assuming this year’s rate holds) down to about 6 Gb (assuming a continuing down trend. Most of these ill be in the most expensive deep and ultra deep categories (i.e. the last to be developed) and would give only 1 to 2 mmbpd additions.
Fifth the number of pre-FID projects outside USA LTO is really small at only 7 mmbpd. Again this implies only about 50 Gb – this is the 2P yet to be developed reserve, and compares to 500 Gb given by Rystad. I think this number is maybe a bit low, especially for Canadian Tar Sands, and there may be a few not so good projects around that have been seriously considered.
Overall, assuming: natural decline of 5.5% (per recent Rystad numbers), include LTO declines at this rate as well rather than growing, 1 mmbpd per year growth needed to maintain oil based BAU, 8 mmpbd from existing projects, 7 mmbpd from pre-FID and 1 mmbpd from new discoveries, gives a shortfall of 29 mmbpd by 2025. Even another 10 mmbpd from hidden projects or brownfield is not enough to make a big difference. But even assuming say the deficit is reduced to 15 mmbpd, most of that comes out of exports, so importing countries find themselves 20 to 30% short from what they need for current BAU, that is beyond depression and into the beginnings of societal collapse.
I find it increasingly difficult to reconcile predicted URR numbers with what is actually happening in decline rates, discoveries, and development activity, and the mantra that higher prices will fix everything doesn’t quite jibe.
Will the world turn out better for most people (let’s exclude hedge fund managers, high cost business consulting firms with nice ties, and oil CEOs from that) by assuming W-M are correct and behaving accordingly or by assuming the figures I give are? And is it best at the moment to concentrate on minimizing the downside risk even if things turns out better than expected in the long run, or maximizing the upside profits, no matter what?
Hi George,
On a yearly basis, at 5.5%, we would see 4.4Mb/d of natural decline for C+C output, I will assume that oil prices will rise enough to keep demand flat at 80 b/d of C+C. If the World cannot manage bringing on 4.4 Mb/d of new output from newly drilled oil wells each year, then oil prices will need to rise more to reduce oil consumed more. This is the reason that I believe oil prices will rise, when oil becomes scarce, oil prices rise. Imagine oil prices at $100/b or higher within 12 months, do you believe that oil output will not at least flatten at 79 Mb/d, at least for a couple of years (until 2020 maybe?) I expect it may rise a bit to about the previous peak annual rate of roughly 80 Mb/d if oil Brent prices get back to $110/b (in 2014$.)
Most people think that the World cannot afford oil at $100/b or more, I believe those people are incorrect. The World economy did not do that poorly from Jan 2011 to Sept 2014 (3.75 years) when the average Brent spot price (monthly data) was $110/b on average. The fall in oil prices was not due to falling demand, it was due to oversupply of oil.
“Most people think that the World cannot afford oil at $100/b or more, I believe those people are incorrect. The World economy did not do that poorly from Jan 2011 to Sept 2014 (3.75 years) when the average Brent spot price (monthly data) was $110/b on average. The fall in oil prices was not due to falling demand, it was due to oversupply of oil.”
I am with you on this point.
It is reasonable to assume the high price of oil from 2011 until 2014 created a substantial drag on the economy of course.
In the short term, meaning four or five years or less, it’s hard for people as individuals and businesses to cut back a whole lot on oil consumption, collectively.
But in four or five years, or any longer time frame, there is plenty of room to make changes allowing reduced oil consumption without reducing economic output.
Those folks who have just bought new gas hog vehicles with sixty month payment books are in a spot to trade for something that gets better fuel economy, airlines are able to retire some older jets, and even new construction and farm machinery gets noticeably better fuel economy.
Given a long time frame, say ten to twenty years, I can’t see any reason we can’t collectively deal with oil at TWO hundred bucks a barrel so long as the price increases gradually and stays up.
It’s the dips that kill us, leading people to buy supersized cars and trucks, do a lot more flying, etc.
Ten dollar a gallon diesel fuel will result in it costing another seven or eight thousand bucks ( not even an envelope used ! ) round trip per truck cross country, but that will add only a few cents to small items hauled by the tens of thousands per load,such as cans of beer, lol. Add five bucks apiece to the price of a couple of thousand laptops, which won’t more than half fill a trailer, once the cost of transportation results in their being packaged in the smallest possible boxes.
Those of us who are still driving will be driving plug in hybrids or pure electrics, and won’t be spending much if anything at all on gasoline.
A ten to fifteen percent farm gate price increase on average will probably cover farmers increased costs if diesel goes thru the roof to ten bucks. We may have manure on our boots, but we also have sharp pencils, and find lots of ways to cut back on more expensive inputs, lol, over time. Ten percent will result in no more than two or three percent higher retail prices at supermarkets as the result of wholesale food prices going up. A four dollar loaf of bread has anywhere from a nickel to a quarters worth of actual grain in it, depending on the recipe and the grain market. The finest apples seldom sell for more than fifty cents out the door of the packing house- the same apples that sell at retail for a buck and a half and up.
Hi Old Farmer Mac,
I agree with everything except the assumption that higher oil prices created a drag on the economy. If we consider World Real GDP, the slowdown in the real GDP growth rate was minor from 2011 to 2014. Of course many factors affect World real GDP, the correlation between real oil prices and real GDP is not very strong.
EDIT:
Looking at the data the 2011 to 2015 rate of real GDP growth was about 2.5%/year, so there was a drag, (decrease from 1990-2015 trend of 2.9%/year), but it was a small drag that might have been caused by factors other than the oil price.
Ten dollar a gallon diesel fuel will result in it costing another seven or eight thousand bucks ( not even an envelope used ! ) round trip per truck cross country
And, would push truck manufacturers to increase fuel efficiency by at least 50%. Heck, the current EPA regulations mandate a 25% increase in the near term. Manufacturers have demonstrated increases of 100% in concept vehicles.
And, if that fails, shippers could switch to rail. With coal declining, there will be a lot of rail capacity opening up (coal takes about 40% of rail capacity at the moment, and LTO takes up some more).
http://www.bnsf.com/about-bnsf/financial-information/weekly-carload-reports/
Coal railcars were at 41,000 plus last week at BNSF. An increase of about 9000 over previous week loadings. Winter is coming. Coal ain’t gonna go away.
Petroleum railcars were at 7879 in week 37, down about 2000 from week 37 of 2015.
Hi Nick,
I agree, there is plenty of reason to believe the truck of the future will be at least twice as fuel efficient as current model brand new trucks.
And if the rules involving weight limits, speed limits, and the use of double or even triple trailers are changed, additional improvements in fuel efficiency will be realized.
Just slowing down can improve fuel economy substantially. Trucks that are built to run at lower speeds will be able to haul larger loads as a percentage of the gross weight.
Rail is going to destroy the long distance trucking industry but I doubt a whole lot of new rail lines will be built within the next couple of decades so there will still be plenty of work for truckers for a long time to come.
I don’t know about the trucking jobs.
Autonomous driving is easier to implement for highways, and trucks log a lot of miles: trucks will probably be automated before passenger vehicles.
That will reduce the cost of truck shipping dramatically. I don’t know where the truckers will go for work, but freight will get to it’s destination, and probably at lower cost than today regardless of fuel prices.
“Imagine oil prices at $100/b or higher within 12 months, do you believe that oil output will not at least flatten at 79 Mb/d, at least for a couple of years (until 2020 maybe?)”
– I think where we differ most fundamentally is in the speed with which things happen. The oil industry does not and cannot move quickly. There is no spare capacity that can be quickly brought on line, Saudi says they have some, but I doubt it is real, I think Ron agrees. Oil companies are not in the business of caring for the world, they are there purely for their own good. They will not suddenly start developing oil unless it meets their internal project criteria. The main integrated companies will not take a risk on something just because there is a 50-50 case of them winning big, they always protect the downside (those in the LTO business might be different). They cannot develop oil that isn’t there. They cannot add more in fill wells to a saturated field. They cannot suddenly deem that a plant designed for 150,000 bpd is now suddenly going to process 200,000. They cannot suddenly fill reservoir traps on wildcat projects with oil when they actually only contain water. They cannot speed up projects however they try – they rely on suppliers, contractors and regulators, and most times they try, it fails and costs more on overruns and schedule delays (and failed careers – hence they always tend to go conservative). Assuming the oil is found then tie backs take 2 years, tar ands take 4 to 6 years, deep water takes 5 to 7 years for a hub. The price doesn’t change anything I have said above. LTO happened reasonably fast – I think that was a one off due to a particular set of economic, political and geological conditions – and for many investors and not a few workers is turning into a complete bust.
Hi George,
I agree the industry does not move quickly, would you also agree that oil at $100/b or more might eventually lead to higher output?
I imagine there are places in the World where more infill wells can be drilled and where there might be excess capacity in the plant due to natural decline.
In addition I think there is more room for growth in LTO for a few years at higher price levels. If supply responds very sluggishly, oil prices will be higher, and there is some oil in storage that takes care of some of the shortfall (maybe 9 months if we are 1 Mb/d short on supply relative to demand).
Projects were being cancelled in 2014 at $110 per barrel. The good ones from then have been done. There haven’t been many high quality discoveries since then – the ones that there have been are being fast tracked already (Lis(z)a, gas in Egypt, a couple in GoM). So really we are worse off than then in terms of prospects. Things are cheaper only because all the hard stuff has been stopped and service and supply companies have cut prices just to survive. If activity increases even by half of whats been cut the industry doesn’t have capacity and prices will balloon again. Decline rates have increased so actually increasingly more new development is needed just to stay even, let alone get back what we’re losing in this hiatus. So I’m not sure if we could ever get ahead again, but certainly not at $100 (assuming development costs go back only to 2014 levels, I think they might shoot straight past).
It’s new plants that have spare capacity usually – mature plants are limited by water or gas handling or utilities.
In fill drilling is a cost benefit analysis, and mostly only is going to make a big difference on good sized onshore fields, I think it pretty much shot it’s bolt for marginal gains in the 2010 to 2014 boom.
I have said all I have to say on LTO.
Thanks George,
So I would assume Jean Laherrere’s most recent scenario would seem too optimistic to you. Chart below from page 16 of
http://aspofrance.org/files/reservesUS_SA_%20Ru_UK-JL2016.pdf
The Green line is his C+C scenario with a URR of 3000 Gb, similar to my low scenario posted up thread, one difference between the C+C scenarios from Laherrere and Coyne is that my scenario assumes extra heavy oil is developed more slowly than Laherrere’s scenario.
Analyst touts industry’s cost reductions in U.S. shale plays
HOUSTON — Recent analysis and statistical research have shown that break-even prices for oil production in the major U.S. shale plays have fallen, on average, at least $30/bbl for WTI. Speaking to a recent monthly meeting of the National Oil-equipment Manufacturers and Delegates Society (NOMADS) in Houston, IHS Markit’s associate director for Plays and Basins, Reed Olmstead, said that the drop can be attributed to a combination of four factors.
http://www.worldoil.com/news/2016/9/22/analyst-touts-industry-s-cost-reductions-in-us-shale-plays
Seems to be opex at $30/bbl. Just add transportation, capex, interests, taxes, what is the result? If $30/bbl was the norm (all included), we would have a lot of shale oil companies with profits and increasing production. Facts seem different.
I suppose “facts” are in the eye of the beholder. I have posted numerous articles from independent analysis from Wood Mackenzie, RYSTAD ENERGY, and the above article from IHS Markit, these companies have tremendous capabilities and research departments with a world wide footprints who sell at a profit, independent research. All of which shows the trend as highlighted in the article. That is, the cost per BOE of LTO has come down very significantly. Those reason given are the same reason cost have come down in past bust cycles. They are real, they will continue as long and market forces require cost containment to be continued. I suppose those who are paying for this research could just come here and read this blog for free. But in the real world you get what you pay for.
Those who do not understand or refuse to except that US domestic oil and gas exploration industry has forever been changed, will go the way of the dodo bird.
Moores law can be applied to oil and gas drilling and completion technology. More production less cost…just the facts!
TT
Although Eclipse’s Purple Hayes well received well earned recognition for the 18,000’+ lateral and 124 stages, the cost reduction versus recoverable resource seemed completely overlooked amidst all the technical hoopla.
Specifically, this well had a 30% lower cost per lateral foot than comparable Utica wells.
That’s huge.
As this was the first of three Utica ‘superlaterals’ from Eclipse (the others are planned 19,000’/20,000′), cost may drop further as familiarity takes hold.
The Permian and Niobrara operators may continue to extend the length of their laterals also if results continue to be positive.
In addition to the speed of the drilling process – mile a day drilling is becoming routine in the Appalachian Basin, control of the fracture process via divertors, slickwater, sand, and – increasingly – real time microseismic measurements, is enabling much higher production from just two years ago.
Eclipse installed hardware for gas lift for long term recovery optimization.
In the Bakken, Continental (I believe), just spudded three wells with 15,000′ laterals under Lake Sakakawea.
The ongoing innovation continues apace.
Hi Coffeeguyz,
We don’t know if the overall EUR will increase, until there is more data.
Increases in new well EUR for Bakken and Eagle Ford are not very impressive, usually a better metric is cost per barrel recovered over first 24 or 36 months, cost per foot doesn’t tell us much, especially if it is only drilled cost and not the total cost of the well per foot including all the fracking and proppant.
Bottom line is most important, how were last quarter’s profits (or losses) for Eclipse and Continental?
For the most recent 3 months Eclipse lost 33 cents per share (or 73 million dollars) total revenue was only 47 million, so this performance is not impressive. In 2015 they lost 42 million for the year and had total revenues of 74.4 million for all of 2015. For first 6 months of 2016 losses were 114 million dollars and revenue was $96.7 million. Maybe if they produce less they will lose less?
http://ir.eclipseresources.com/sec-filings
Continental lost $318 million in first 6 months of 2016 and total revenue was $904 million.
http://investors.clr.com/phoenix.zhtml?c=197380&p=irol-sec
It seems these companies need costs to drop quite a bit more as the goal is positive net income (as I understand the oil business).
Hi Texas Tea,
You don’t concern yourself with net income?
Dennis
Kudos to you for your ongoing efforts in keeping this site active.
Addressing some of your points …
I never put much emphasis on EUR as it is both a contentious topic and completely ‘unprovable’ in the near term. People will tend to believe what they wish to be true.
However, just yesterday, Lynn Helms did say recent Bakken wells’ EURs have increased about 25%.
The indisputable increase in output from new wells will accelerate the revenue, no small fact when ATW in ND runs about $33/bbl.
On March 14, 2011, armor from KSA raced across the causeway and rescued the Al-Khalif regime in Bahrain from protestors, thus enabling the continuation of the incarceration, torture, and executions of several dissidents.
This is partly what is at stake here, Dennis.
When people accurately point out the very low lifting cost of KSA oil, that is both accurate and woefully beside the point in the bigger picture of things.
KSA has demonstrably hemorrhaged hundreds of billions of dollars in the past 24 months and is increasingly showing signs of societal discontent.
The stakes are literally life and death.
Regarding costs per foot, the Appalachian Basin operators need that metric as no pre-defined drilling spacing units exist.
Not only the size, but also the shape of designated production units – approved by state regulators – can vary wildly.
By any standards, a 30% reduction in cost, especially if repeatable and applicable in other basins, is a big deal.
Regarding the financials of the operators, my often stated view of not immersing myself in what is clearly a highly distressed situation, still holds … but …
Didja see the most recent free cash flow graphic from Rune? With all the overwhelming financial negativity coming out of the Bakken, last few months were cash flow positive?
Ongoing drama with the highest stakes involved for all of us.
To repeat TT’s above comment, the O&G industry has fundamentally changed forever.
Coffee
Just my 2 cents. I have seen first hand the DOMESTIC Oil and Gas Industry change forever, so I agree. I want to give a little background so you know where I am coming from. I am a small producer. I work closely with an operator and we put conventional Oil and Gas deals together all over the gulf coast. MS, LA and Texas. There is not a single resource play that has better economics than what I sell. I drill conventional deals. 4 way closures, pinchouts across a nose, reservoirs trapped up against a fault, etc. I use 2D and 3D and subsurface geology. I have a great geologist and geophysicist and we work on a shoestring. Selling deals I have seen the change. PE backed and Publicly traded companies will not drill conventional deals anymore. I had a discussion with a large publicly traded independent (VP of Land) about this and he admitted such. They get punished by the markets for drilling Exploration deals, regardless of how much money they lose in resource plays. These companies are mining companies. Nothing more. They tell themselves they are risk free, they just do not appreciate that they are shifting risk. From up front drill money to risk in commodity pricing. My wells are economical at much less than what they are. It is painfully clear.
My issue is the change and the complete lack of understanding of what we are facing. The money these companies spend every quarter without regard to the bottom line is staggering, and the bill will come due. That is an indisputable fact. Rig efficiency, increased Estimated (it is an estimate) UR and high IP’s have yet to make these companies profitable. When this bill comes due, this industry will have to eat a giant s&*! sandwich for the havoc it has reaked. and the destruction it has caused . And it is 100% on us as an industry.
The only number that counts is the bottom line and without a rebound in pricing, it will only get worse and the rebound will be that much harder
I say this for the same reason Mike and SS do. This is market distortion at its finest, and it when it corrects, EVERYONE, from producers to consumers (everyone in this country) will feel it. This will not end well.
Hi Reno Hightower,
Do you share Mike Shellman’s perspective that the oil price (let’s say WTI) is likely to remain under $60/b for 3 years? If your answer is yes, do you believe oil demand growth will match oil supply growth. I expect oil demand will grow by at least 1% per year (at World level) and World oil output is likely to decrease slightly if the price of oil remains below $60/b. I agree LTO will be in big trouble unless oil prices rise to over $80/b (that’s Mike’s estimate I think or maybe shallow sand.)
Not necessarily, but there are way too many variables with too many unknowns. I base my economics on current prices. And being conservative is a good thing when it comes to pricing.
These shale companies are being propped up by private equity and Tens of billions of dollars chasing billions of dollars of properties. They have a clear MO and it has nothing to do with long term. A high stakes musical chairs for these companies. Just better dump those properties before the money stops flowing in.
Thanks Reno,
Conservative is probably best, I just don’t see oil prices remaining under $60/b until 2019, eventually demand will outrun supply at that price in my view.
I don’t own any of these companies, I am simply an interested observer.
Reno, great post.
I have been blasted several times by the LTO proponents. To the point that I question why I keep posting sometimes.
Oil producers sell oil. It is very difficult for any oil producers to be profitable if oil prices are low, don’t care what we are told about “new tech”.
LTO producers send so many “low price” signals to the markets, and have now for 2 years.
It is a true race to the bottom. It will not stop until the easy money runs out.
I think LTO has convinced traders there should be a ceiling of $50 WTI, and that, until all LTO fields are pretty well drilled up, that ceiling holds.
The only hope, outside a major supply shock, is an OPEC cut. Secretly, LTO producers are hoping for this, just like the little conventional guys.
Unfortunately, OPEC likely will not get its act together. Merely cutting enough to lower exports to OECD about 1.5-2 million bopd for a few months would break the $50 ceiling.
Hello Reno,
I enjoyed your post. The description of your business model could very well define our company, and I would not be surprised to find out we may have crossed paths at some point. We also have production in Texas, Louisiana, Mississippi, Oklahoma, Kansas, New Mexico and Alabama. As I have noted before due to our production mix we have continued to turn a profit each quarter during the last two years. I can say for a fact while we continue to screen deals, I have NO better drilling opportunities, risk weighed, than what I have in Oklahoma drilling our minerals in the Woodford and Springer trends. The pace of the advancement in drilling and completion technology has made the opportunities even better despite the low prices. Since we work the same area, you no doubt have interest in tight gas reservoirs. Cotton Valley sand or lime, Travis peak, Wilcox etc. You know the production profiles of those tight gas sands that often require fracing. Think for a monument rather than fracing a 20′ sand you are fracing a 10,000′ sand. Yes the upfront cost are high, But the production profile should be similar. I believe I have noted our oldest well, now with 5 years production history has made over 5BCFG and 300,000BL and continues to produce at a rate of 2000MCFD and 100BLPD with almost NO decline over the last 12 months. We, those of us in the oil business, give our left nut to drill this type of wells. That type of well now cost less than $6,000,000 to drill and complete. They are money makers….pure and simple?
TT.
How do you fund the CAPEX for the big frac hz wells?
SS, we do it the old fashion way, we pay cash. We do not borrow money to drill and/or complete wells. (Fools errand) We have routinely used a line of credit to fund lease acquisition or buying production/minerals/royalty (during periods of relative price stability) like now where we believe there is a greater chance of higher prices rather than lower prices over the medium and long term. I am prepared for the EOTHWAWKIT as one can be, but that is not how we run our business. My best.
Hi Coffeeguyz,
Did you actually read Rune Likvern’s post?
I would highly recommend it to those who have not seen it.
It is excellent as usual.
The recent wells are only cash flow positive because the cash flow chart ignores some of the costs, it is a rough approximation, Rune provides a link to an earlier post which covers all the details.
He also says:
The estimates below make a cut off at 2040 and are for the wells started as from Jan-08 and per Jun-16.
Nominally to retire all debts (reach payout) would take an (average) future oil price close to $65/bo (WTI) for all the wells in operation as of end June – 16. This is without making any profit.
In the range of $85-90/bo (WTI) the Bakken (looking at it as one entity) would return about 7%.
The longer that oil prices remain low, the higher the future oil price will need to be for a return of 7%.
Rune explains what happens if the oil price remains at $45/b until June 2017 as follows:
For the wells in production as per Jun-16, the total extraction of these will decline about 40% by Jun-17, and depletes their remaining reserves with about 20%. By assuming the operations remain cash flow neutral, total debt remains at $36 B in Jun-17.
As from Jul-17 this would now require an average oil price of about $73/bo (WTI) for these wells to nominally retire all debts (reach payout). Additional wells will add to what price is required to retire the total debt.
To now reach a return of 7% takes an average future oil price of $110/bo (WTI).
The longer the oil price remains low, the higher the oil price becomes for these wells to even reach payout.
If Mike Shellman’s oil price expectations are correct, Bakken LTO will be in big trouble before long.
Hi all,
The link to Rune Likvern’s post at his blog Fractional Flow that I quoted above is below
https://fractionalflow.com/2016/08/21/the-bakken-a-little-about-eur-and-rp/
I intended to put the link in my comment but failed to do it. My apologies.
Hello Dennis,
yes I do concern my self with net income….My own? With your permission I took a post of yours that had a the 48 month average production for eagle ford wells(6480 wells with a 350KBO EUR) and I am adding additional columns with a well I have an WI in the Woodford oil window(our first). I hope to be able to post the comparisons in the next couple of months. But I can say at month 13, we are running at 40% increase in daily oil production compared the averages presented in your post which I have not independently verified. In addition, our well produces over 2000MCDG per day with the associated NGL. I can say with very little doubt, even with the low commodity prices we have endured since the well was turned to sales, this well is going to pay out and make a decent return.
I will make one other point, Amazon went more than a decade without making a net profit. There is NO doubt that early forays into the horizontal drilling resulted in huge debt levels and noncommercial results in certain if not most plays or trends. That is more normal than not in the oil patch, it’s the second rat that gets the cheese ?
IN addition to Argentina now this “obsolete, noncommercial, drilling methodology is going to Mexico. They must be math challenged also (sarc)
http://fuelfix.com/blog/2016/09/23/mexico-could-open-shale-fields-to-u-s-drillers-next-year/
Hi Texas tea,
I don’t think I ever had eagle ford at an EUR of 350 kb, it was about 210 kb. I often get 350 kb for Bakken wells though.
Yes there will be individual wells that make money, to find out if the industry is profitable one needs to look at averages. If only one out of a 100 wells is profitable, it is more like gambling than a business.
Dennis, I can’t believe you are overlooking this and still commenting to this fella, who by the way is an embarrassment to me as a Texan and as an oilman. I hope people do not believe all Texans behave this way; they absolutely do not. One should always be willing to defend statements they make with as much factual evidence as possible. He is as we say in Texas, all hat and no cattle:
texas tea says:
09/25/2016 at 5:42 pm
Lloyd,
There is very little discussion going on here. There is nothing here short of a Green socialist party line agenda, i.e. bullshit. While it is certainly a freedom for people to spend their productive time doing wholly unproductive things, like routinely posting financials of pub co, they appear to no interest in, or otherwise running down those individuals and companies who are developing technologies that can and will bring new energy to an energy staved (big picture) world, I would agree, bullshit is the perfect word. Back in the day we all learned….there are those that do(and profit) and those that lick up the bullshit like ice cream and wonder why their lives got so far of track. You and others remind me of my birddogs, they find some dead stinking and rotting shit and roll around in it making it their own. So Lloyd roll away…..and just like my dogs you will be no better off….you just stink like shit
Reply
Hi Mike,
I didn’t see that thanks.
I guess some people post when they have been drinking a few. 🙂
Hi TT,
Where are the profits? Are there any major LTO players with positive net income in 2016 or 2015? Could you name a few, Continental is not very good. EOG lost $756 million in the 1st half of 2016 on net revenue of $1,813 million.
Occidental (one of the largest players in the Permian basin) lost $61 million on the first half of 2016 on net revenue of $4,839 million, in 2015 losses were $42 million on $6,610 million in net revenue. Lower losses for Occidental as a percentage of net revenue relative to Continental and EOG (mostly an Eagle Ford focus).
These companies are not doing well with low oil prices, at least $60/b is needed for many to earn a profit, though perhaps Occidental, might squeak by with $50/b. The average WTI in the first 6 months of 2016 was about $39/b and realized oil price was $35/b for Occidental.
Hello Dennis,
Really you are asking me for investment advice. Ok here goes. I have said numerous times and it is obvious to most everyone, that sub $50 oil was/is a disaster to all those companies/individuals that made investment decisions counting of $80+ oil. That includes, conventional as well as non conventional, onshore vs off shore, domestic vs international. VERY FEW are going to make TONS of money on investments made in the oil patch during times where cost were extraordinarily high, but are now selling product in an environment of relative low prices. This is not about the past Dennis, money is made looking forward.
From a domestic small producer point of view, I think an appropriate analogy maybe the rollout of the mega walmart stores back in the 70 and 80’s. Where small business’s, hardware, pharmacies, toy stores up and down main street USA faced a similar circumstance. One can deny what is coming, one can stand and piss into the wind at one’s own pearl, but the train is on track and it is rolling over anyone whose fiscal house is not in order.
Just look at the rig count survey. Directional and horizontal rigs 442 vs conventional vertical rigs 64. It should be obvious that those companies and individuals who are paying for the 88% of the rigs running know just a bit about what they are doing. The presumption that it is only those who are paying for the 12% of total rigs running on shore USA, have the engineering, geologic and accounting acumen to make sound investment decisions, is on it’s face, ridiculous. Please do not leap to the conclusion that I am saying all investments currently being made in the oil patch will yield a return they may not, but those posters here that regularly and routinely try to condemn 100% of what is now close to 90% of domestic activity to be non commercial, unwise and irresponsible is, “at best” disingenuous and uninformed.
Texas Tea.
I am scratching my head, trying to figure out how you pay cash for the high volume frac Hz wells. Those cost several million each.
I was under the impression only public companies have the ability to do that, or maybe a few big private equity.
The Yates family couldn’t do it, so they sold out to EOG. Last I knew the Yates’ were worth billions. But their company was hemorrhaging cash.
I understand all this stuff is being drilled on multi well pads. How did you come by $60-80 million to drill one of these?
SS,
I had assumed you understood most oil wells are owned by a number of owners(fractional interest). We are non op fractional owners. We make decisions based on a number of factors not the least of which is who will be the operator. Sometime that becomes a legal battle at least in OKLA. Personally, if for instance Joe Blow Oil proposed a well on our minerals, and I did not have confidence in their technical ability I would just lease. We lease for a 1/4 royalty, we also have little staff, small overhead, and always maintain a greater NRI above our WI, we pay NO royalty. When we participate with a WI, we obviously have normal drilling risk and well as price risk. As I have stated before, I run a business, my only job is to make money…honestly??
But here is the deal, and I think you and other smaller operators can fully appreciate this. IN the life time of any singular oil and gas small operator my age, how many 5,000,000 oil fields or 50BGF gas fields will they discover or participate in. Most will honestly say none. A few will say they found 1. Next to NO ONE will, say 2 or more.
A single unit in the Scoop Woodford/Springer trend can realistically can make 5,ooo,000+BO and 50BCFG. These reserves are going to be developed.
Texas Tea
I follow what you are doing.
Do you just own stuff in Springer, SCOOP, STACK?
I guess if you sold all your other stuff prior to late 2014, you did good there.
I get blasted often for being critical. I hope you understand that I am backing stuff up with numbers, and I am pulling those from reliable sources.
Maybe I am weird in that I like to calculate payouts of stuff I don’t own. Don’t see why that is a problem.
As you may know, awhile back there was a small WI in CLR’s Poteet Unit for sale on the auction. It was very interesting to me that guys with just 40 acres in a 1280 unit could get hit with over $4 million of JIB CAPEX in about 6 months time. That personally would totally scare the crap out of our little company if we found ourselves in such a situation.
I have followed those Poteet wells, and I don’t see any way that unit will come near paying back the WI owners.
Maybe Poteet is an underperformer?
Assuming 12 wells in your example unit, I do not see anything on my subscription site that comes close to your example. There are very few Hz wells in OK that have hit 5 million mcf. About 1/4 of one percent, thus far is what I see. There have been over 13,000 Hz wells total in OK so far. The very best producers appear to be Des Moines wells operated by CHK.
I am aware of two private companies, Templar Energy, LLC and Chaparral, that have defaulted on debt this year while drilling Hz wells in OK, including Woodford. I just think it is very hard for private companies to succeed in shale, given the huge upfront CAPEX requirements. I also think being a non-op would be tough, as you have no control over when those costs are incurred. You are just sent bill each month, and have to pay in 30 days.
I think I’ll stop this here, hats off to you, you are the only independent I have ran across happy about the current state of affairs in the industry.
Keep in mind, however, when you say us guys are just going to go the way of Main Street America, you are talking about a lot of small businesses going under, with lots of job losses.
So…you’ve got some kind of secret sauce that you can’t tell us about.
Well… until you can tell us about it (preferably with a balance sheet showing payout and profit, or even projected profit at given price points) you should keep it secret.
Because it doesn’t add to the discussion and sounds like bullshit.
-Lloyd
Lloyd,
There is very little discussion going on here. There is nothing here short of a Green socialist party line agenda, i.e. bullshit. While it is certainly a freedom for people to spend their productive time doing wholly unproductive things, like routinely posting financials of pub co, they appear to no interest in, or otherwise running down those individuals and companies who are developing technologies that can and will bring new energy to an energy staved (big picture) world, I would agree, bullshit is the perfect word. Back in the day we all learned….there are those that do(and profit) and those that lick up the bullshit like ice cream and wonder why their lives got so far of track. You and others remind me of my birddogs, they find some dead stinking and rotting shit and roll around in it making it their own. So Lloyd roll away…..and just like my dogs you will be no better off….you just stink like shit?
You don’t seem to get that there is no magic.
Increases in LTO well output since 2011 is because the wells are not what they were. Stage count — the length of the horizontal wells — rose to 30 and more stages. They were fewer before and so less oil was coming out. More per well now, and celebrated as a miracle of technology, but it’s not. It’s just longer length requiring more time to drill, more proppant shipped to the site, more water shipped to the site, all funded with borrowed money. No tech advance. Just more borrowed money.
Cost reductions celebrated are of a similar sort. The producers got their suppliers to cut what they were charging. Halliburton and Schlumberger agreed to space out the billing to future years — in order to keep the industry alive. They fund that revenue extension the same way — borrowed money at 0 interest rates. No marvelous new technology. Just 0% interest rates. This is one of the corruptions talked of in society created by ZIRP and NIRP. People *should* go bankrupt, but ZIRP dodges that.
Repeat it to yourself now and then. Inventions don’t arrive when quarterly reports are due to face the music. They don’t correlate to that event. They may correlate to other events, like some new external technology that gets applied to a problem, but not when the timing is thus. When you see claims that new know-how arrived just as the guys had to come out and brief analysts, be confident that you’re hearing lies and subterfuge. That’s what keeps bonuses flowing. Nothing else.
Hey TT,
I’ve seen the LTO quarterly results and I know how to read them. And I think they’re using creative accounting even with the vast losses they’re reporting.
What are you seeing that I’m not?
El no ve nada, HR. You and I both know that the shale oil industry is woefully unprofitable and therefore not sustainable. Anybody with an ounce of sense knows this. Making predictions about the price of oil, and the role shale oil will have in our energy future, without regard for costs, and debt, is foolish. Deseo a este amigo tomaría el Texas fuera de su nombre. Su embarazosa. I am sorry for my bad Spanish.
I hope you are hanging in there…our task now, guys like you and me, is to make it work at 50 dollars a barrel. We can do that. We have to.
Saludos, mi amigo.
Mike
Mike: “our task now, guys like you and me, is to make it work at 50 dollars a barrel. We can do that. We have to. ”
What does this mean? That the price of oil is never going back over $50 for long stretches of time? Why?
Mike:”our task now, guys like you and me, is to make it work at 50 dollars a barrel. We can do that. We have to. ”
How can you do it and how much time can you survive before prices must go above $50? Or do you expect prices to stay below $50 for a long time?
Actually conventional oil producers are OK at 50 dollars a barrel. Baring increased regulatory compliance costs, my biggest fear (most of which is caused directly by the shale industry), we can actually drill wells to slow the rate of natural decline and make a living at 50 dollars. Its not as much fun as if prices were 85, but it’s doable.
The shale oil industry, however, cannot function much longer at 50 dollars and manage its massive legacy debt. It cannot function without credit so even if the 200 billion dollars, or so, of debt it owes were forgiven, it would not be long before it was back in the same boat its in now. Shale oil is too expensive, and declines to quickly; it is too dependent on outside capital and I do not believe it is sustainable at oil prices of less than 80-90 dollars a barrel. Honestly, in my oily opinion the shale oil industry will only play a significant role in our energy future if the government helps pay for it, like crop subsidies.
Personally, I do not believe prices will rise much above 55 dollars for several years. Regardless, because of the short investment cycle of shale oil, spud to production in the tanks, we are now in an era of extreme price volatility and “experts” that don’t know much about the oil business discount that entirely in their rush to predictions about the future. The oil business needs price stability more than anything and the shale oil phenomena has blown that to hell and gone.
Keep in mind that despite $50 being quoted by many, the actual price received in the field for 2016 has been far less, for most probably in the mid $30s for 2016.
That is for oil. Not BOE.
BOE for LTO producers varies, but for the first 3 quarters I think most will realize sub $30.
For example, a producer who has a 50/50 product mix with realized gas prices of $2.00 per mcf in 2016 and realized oil prices of $38 per bbl in 2016 has realized just $25 per BOE.
I personally have stated many times that we would do very well with WTI at a steady price between $55-$65.
Mike is correct regarding regulatory concerns. The “leave it in the ground” proponents scored a major victory (in their view) concerning the methane emissions rules for new and modified oil and gas sources. In particular, they were overjoyed that EPA at the last moment included low volume wells.
EPA is now working on rules for existing sources. There is presently litigation initiated by oil producing states and others regarding the rules passed in May, 2016.
Lots of uncertainty out there.
Hi Mike,
What makes you think oil prices will remain under $60/b for the next 3 years or so? Do you expect that demand for oil will decrease and/or that oil supply will increase at an oil price of $60/b?
Ron thinks, and I agree with him that oil supply is likely to decline “slightly” at oil prices under $60/b, (I believe the decline will be 1% to 3% at those prices at minimum). The IEA believes oil consumption will increase at about 1.2%/year for 2016 and 2017 (but the IEA believes oil supply will increase to match the increased demand).
I agree with the IEA demand forecast and Ron’s supply forecast, I doubt that a World oil price under $60/b will result in a balance between oil consumption and oil supply.
What am I missing?
Dennis, you keep asking me that. If I told you what I thought it would not matter; you would argue it. The Permian has now changed the LTO decline scheme dramatically, at least until Wall Street figures out how unprofitable IT is, which I believe could take 2-3 years. I just came from W. Texas; they are going nuts out there. We are full up with lousy light tight condensate we can’t get rid of and there is more coming. I am also very concerned about recessionary events on the world horizon and the affect that will have on demand. Otherwise, ignore me with regards to oil prices; I am not in the guessing business. I’ll be the first to congratulate on you being right, me wrong.
And please remember that oil price “volatility” is more important than simply reaching 80 dollars a barrel and then it falling back to 40 again…if your predictions were right I assure you that majors, minors, and little guys like Shallow and I would not be slashing CAPEX and projects, as is exactly what is occurring in the oil business around the world. If for instance Exxon thought like you did, they would be going wide open with exploration budgets. They are not. Nobody is. Except the shale oil business and it is because they are using OPM, which Trump says stands for other peoples money. His buddy, Harold, uses OPM also and that is why he would be named DOE, Lord he’p us.
I applaud you for questioning some of the ridiculous comments about shale oil technology. It is not a game, producing oil; it is a business. The shale oil business is failing, miserably. I would not be too quick to assume the role of shale oil will have in our future without considering it’s financial condition. As I’ve said, the only way I see it sustainable as if it gets crop subsidies from the government.
Lastly, before my families heritage gets attacked again, you will kindly notice that the shale oil cheerleading squad essentially has only 3 cheers: one is technology will always save the day, two is higher EUR’s will save the day and three, lower costs will now save the day. They ignore income, quarterly losses, debt, unprofitability and actual realized production data completely. That makes cheerleading about the shale oil industry and little like bragging about an airplane that won’t fly.
Lower costs don’t have a thing to do with the shale oil industry itself, it is entirely a function of an overbuilt service industry that itself is in dire straits. It slashed costs to the bone to keep from drowning. I work in the middle of the largest shale oil play in America and I have not seen costs lowered by 30-40%. They came down a little (20% at the most), and now are actually inching back up. Lower costs will not last long. Because the service industry has been cut to the bone there is now enough pressure on remaining services that costs will soon be going up, actually. More development activity in any oil play historically ALWAYS caused costs to go up, not down; good grief. We just witnessed that less than 2 years ago. Now it’s changed? Holy schnikes; that’s dumb.
Lower costs is another bunch of hooey the shale oil industry is touting to make itself look better than it actually is. For instance, the $2.50 per incremental barrel lift costs Sheffield puffed up about recently…that is ridiculous. It costs him that much just to buy frac water and dispose of produced-flow back water in W. Texas. It amazes me how easily people buy into that dribble. If its on the internet, it must be true; you can’t lie on the internet, right?
Adios, Dennis. Keep a bind on it.
Mike Shellman
PS: Reno Hightower knows his stuff like Shallow does; listen to what he has to say.
Thanks Mike,
I am only trying to learn from the pros. No doubt it is you who is correct. Note that part of the explanation is that you seem to be expecting supply to increase (contrary to what Ron Patterson thinks) based on what you are seeing in Texas and you expect that demand will decrease rather than increase, so low oil prices make perfect sense given your expectations of future supply and demand.
Clearly I don’t know what future supply and demand will be (and it is likely I know far less than you), but I expect the opposite, I think Ron P is right about World supply (a slight decline is likely without an increase in prices above about $55/b) and I also am skeptical of arguments that a recession is likely in the near term, so I expect the IEA’s demand predictions for oil will be roughly correct.
Time will tell.
I agree LTO is a bust at any oil price less than $85/b.
Also not that all the cutbacks by the industry is likely to lead to lower supply, I doubt the increased output that might come from the Permian will be enough to offset decline from the rest of the World.
“I also am skeptical of arguments that a recession is likely in the near term”
Dennis,
I appreciate the work you do here and I am impressed with your analytic skill, the quality of your work and your honesty about your positions.
USA Medicare/Medicaid spending is 1.3 trillion and compounding at 9%.
This will be Trump or Hillary’s problem in the next election cycle ( do the math!)
The Medical industry is 20% of GDP.
The only way to stop that exponential curve is to enforce legislation to eliminate monopolistic pricing practices that will collapse the medical industry.
400 dollar aspirins will become 1 dollar aspirins like they should be.
Either the government blows up or the medical industry. Pick your poison.
And the oil industry looks troublesome too.
The government has 100 trillion dollars of liabilities and 20 trillion of debt.
How can you not see a recession coming?
Hi Satan’s Best Friend,
By recession, I mean negative annual World Real GDP growth at market exchange rates.
This happened only in 2009 and not in any other year from 1960 to 2015. Sometimes a value of less than 1% World real GDP growth is chosen as a “recessionary” level, if that is the proper benchmark (which is not clear), then we would add 1975(0.9%) and 1982(0.51%) to the list. So in 55 years there has been either 1 World recession or 3.
Dennis,
FWIW, my best guess is that we’ll have a recession in the next 3 years, maybe roughly starting about 12 months from now – so, maybe 15 months from now plus or minus 6 months.
We have not eliminated the business cycle, and it’s been an unusually long time since the last recession. That’s probably due to the credit-squeeze that was the primary underlying cause of the last GFC, which caused an unusually slow recovery. That unusually slow recovery, in turn, extended the length of the recovery. But…the Fed is tightening, and that can only end in tears.
If a recession happens just as oil supply & demand start to balance, it could slow down demand and therefore slow down the speed with which oil prices rise.
Just a thought.
Hi Nick,
I am talking about a World recession on an annual basis, where real GDP drops, these happen very infrequently, based on IMF data since 1980 this has happened in one year (2009).
So I disagree. A drop in annual real World GDP at either market exchange rates or on a PPP basis is unlikely until 2030 in my view.
The debt issue is overblown, World debt levels have risen, but not to levels that are of concern.
Dennis says
“I agree LTO is a bust at any oil price less than $85/b.”
Wrong. Legacy LTO may well be “a bust” at less than $85, new production ….not so much?
At $85 and $4.00 nat gas there is going to be a lot of money made… at least by me?
Texas Tea
Have you heard of Templar Energy, LLC and Le Norman Operating, LLC?
How did you avoid what you call legacy LTO?
Hi Texas Tea,
I have noticed when I suggest that many of the major LTO players are in the red, you remain silent.
HR.
What creative accounting are you seeing?
The one I noticed, that few have commented on, were large cuts to future production cost estimates from 2014 to 2015. For example, CLR’s dropped 60%.
Those cuts kept SEC PV10 above long term debt.
As it appears SEC WTI will be several $ per barrel less in 2016 than 2015, and because HH likewise looks to be quite a bit lower, look for these costs to be cut steeply again in the 10K estimates of future cash flows.
Also, have to keep in mind that to the shale proponents, this is not about $$ and cents.
For those not suffering due to very low oil and gas prices, shale is about knocking OPEC and Russia on their heels, American ingenuity, capitalism, and other patriotic stuff. Stuff, by the way, that I acknowledge as being very important.
I do not know anyone who actually owns oil production who has been happy with sub $50 WTI, which will soon enter month 23. I highly suspect that includes all LTO producers.
First, almost all LTO producers have a considerable amount of conventional/stripper well production from years gone by, that is taking it in the chin. PXD is operating over 6000 vertical Spraberry wells, for example.
Second, all continue to have little to no earnings. I can’t see how any are enjoying that.
Lots of talk in the US media that OPEC is dead, irrelevant.
While this talk is out in the open, all US producers are praying OPEC and Russia save the day with a cut.
http://finance.yahoo.com/quote/CLR/financials?p=CLR
That’s Continental Resources. 2015, loss applicable to common $354 million.
That was even with their hedges of early last year.
http://finance.yahoo.com/quote/CLR?p=CLR That’s up to date. The P/E is -32.74. That means loss ongoing. Work out the magnitude as the spirit moves.
Whiting is the big kahuna in the Bakken. Here’s what technology has done for them:
https://www.google.com/finance?q=NYSE%3AWLL&ei=fKbkV9mjMK2GiQL-hoi4CA
Earnings -$11.79/share
Harold Hamm for US Energy Secretary? WTF .. One could not possibly make this Stuff Up! Redefines “Looser” … Certainly we must do Better..
http://oilprice.com/Energy/Energy-General/Trump-Considers-Continental-Resources-Harold-Hamm-for-DOE-Pick.html
Donald, you never told me your political party affiliation but I gathered from your silence that you were a republican, knowing my democratic leanings of course.
But such stupid decisions like this, Hamm for DOE Secretary, is just par for the course for Trump.
Just wondering, is Trump your man?
Past recent Democrat secy’s of energy:
William B Richardson, Governor of New Mexico, bachelors degree in French and PoliSci, masters in Intl Affairs. No Physics or Engineering.
Frederico Pena, Colorado Rep, degrees BA and JD from Univ of Texas. No physics. No engineering.
Hamm would seem to have more energy credentials than those two. He has no bachelors degree (nor does Bill Gates). Didn’t look too hard, he may have some honorary degs from . . . maybe Oklahoma, where he is a donor. Ditto Bill Gates, probably has an honorary or two.
Watcher, surely you just. Being qualified for Secretary of Energy does not mean you need know a lot about physics. That is an administrative position, not an engineering position. Being a Governor of Colorado is qualification enough for any cabinet position. So would be a member of the U.S. Congress. Of course having knowledge of our current energy situation would help a lot. And Hamm knows fracking, no doubt. But I am not sure he knows much more about the U.S. Energy situation.
I gather from your being upset of my criticism of Trump that you are one of his supporters.
I am writing myself in.
Trump not my Man, but HRC not my Women. We can do better. As a business owner ( Fla Solar Contractor ) , I’m most uncomfortable with too many Lawyers as Law makers!, Both the Oil and PV Business is essential. Buzz @ SPI2016 – Bloomberg on continuing PV buildout ( 70GW-2016) will keep Regional NG prices from spiking as the shortage eazes. Have decades of experience with the Clinton machine, it’s rools over People. Perhaps my most surreal experience was inside the Capital Hotel for both Clinton election nights. Perhaps the key voting issue is our relationship with Russia. Sure impacts the Oil Biz. The world needs stability and Sanity. Over centralization of Power is unhealthy, especially in the Energy Business. Utilities are Killing DSM & DG. *Plug: If you Vote in Florida Vote NO in NOVEMBER for Smart Solar. https://www.youtube.com/watch?v=tPODcT3cckI
Hi Shallow sand,
For Continental year to date non-acquisition capital expenditures (ignoring asset sales and acquisitions) fell to $529 million in 2016 compared to $1,570 million in the first 6 months of 2015 while the BOE produced only fell by 4%, total revenue fell by 32% due to a 35% decrease in average realized commodity prices in first half of 2016 vs the first 6 months of 2015. Low prices are definitely hurting the bottom line.
As far as costs per well, in 2016 it has been $15.5 million per net well completed in the first half and for the comparable period in 2015 it was $8.5 million per net well. So much for the reduced costs, the capital expenditure per net well almost doubled (82% increase) from 2015 to 2016. Did the EUR of the average well also increase by 82%?
I am skeptical that new well productivity rose over the first 36 months by even as much as 10% (but we won’t know that for a couple of years). In the past we have seen an increase in output of perhaps 10% to 15% over the first 12 months and then output is similar to earlier wells over year 2 and 3 and beyond (sometimes it is lower).
At some point investors will realize that the optimistic forward projections of these companies should be ignored or reduced by a factor of 4 to 8.
Dennis:
With CLR keep in mind that most of their well completion activity is now in OK, where the wells produce a much higher percentage of gas to total BOE, as opposed to the Bakken, which is the most “oily” resource play in the lower 48.
From my review of OK well production statistics, there are some very prolific wells drilled in these plays on a total BOE basis, but most, if not all, of the BOE is gas and natural gas liquids, especially after the first 12 months or so that wells are online.
If I recall correctly, CLR’s product mix has moved from 70% oil to 60% oil in less than two years. That is a pretty big move for a company of its size (200,000+ BOEPD).
I wish someone smarter than me would look at CLR’s estimate of future cash flows, located near the back of their 10K, for both 2014 and 2015. A 60% reduction in estimated future production costs is extremely steep, especially as proved reserve BOE dropped just 9%.
There has to be some explanation for this, I just have not figured out what it is. Many other LTO companies also had steep drops in estimated future production costs from 2014 to 2015, without a significant drop in proved reserves.
XOM, on the other hand, had both estimated future production costs falling in the 20+% range, along with proved reserves also dropping in a similar 20+% range.
So, why would LTO companies be able to slash production costs so much more? Note, XOM, through its subsidiary, XTO, is a major player in almost all of the LTO basins in the lower 48, so interesting this does not show up in their 10K?
To add to Mike’s comments regarding oil prices, for many reasons, oil prices do not move in any kind of symmetry with supply and demand. I agree that over very long periods of time, supply and demand matters. However, supply and demand does not explain entirely, at least IMO, why we sold oil for June, 2014 for $99 per barrel and sold our oil in February, 2016 for $23 per barrel, or just 1/4 the price of less than two years prior.
As we have discussed, there have been periods of extreme price volatility over the past 20 years. We have discussed the reasons why many times. I am sure Mike is giving you what is, in part, a gut feeling, that he has given his decades in the oil and gas industry.
My feeling is that, without an OPEC cut, or other supply shock, a price recovery will not come for quite awhile. For much of the late 1980s and almost all of the 1990s, prices were low. US onshore exploration was not very common. Just look at the rig count statistics during that time, 200 “oil” rigs was not uncommon.
Large “funds” trade commodities. This is currently a commodity bear market, not just for energy, but for many metals and grains as well. Traders take cues from supply and demand statistics and changes are much greater.
Also, keep in mind we are living in the “real time” internet world. This, IMO, adds to volatility in all markets.
Thanks shallow sand,
The times where the prices were low was due to supply being able to meet demand at that low price (I mean at the World level). From 2014 to 1Q2016 there was excess supply which drove oil prices lower, based on IEA data by 2Q2016, supply and demand were close to being balanced (only 300 kb/d excess supply out of a World supply of 96,000 kb/d).
My argument is simple: at WTI $50/b supply is unlikely to grow (in fact I expect it to decline slightly), but demand will continue to grow and eventually (maybe within 3 to 6 months) this will put upward pressure on oil prices.
You guys follow this much more closely and for much longer than I have, but I just don’t see how oil prices remain low for 3 years if supply is less than demand. In fact supply and demand tend to match in the long term and price is what makes it happen. Consumers will bid up the price of oil until the quantity demanded decreases to match supply. Then eventually (maybe this takes a couple of years) supply starts to increase in response to higher oil prices, or maybe it just declines more slowly than it would have at a lower oil price.
No doubt there is something basic about the oil market that I am missing. I understand the supply response can be very slow and demand response is also not instantaneous, there is the buffer of oil and products in storage, but these don’t last forever so sooner or later something has to give if there is a supply and demand imbalance.
Mostly the traders are trading paper, people need fuel to put in their tanks.
Dennis.
I may be all wrong, but I have followed commodity markets for a long time.
Right now the price of corn at Midwest US grain elevators is hovering around $3. This is less than the cost of production. This has been caused by oversupply, as 2013-2016 have been favorable weather years in most of the Midwest, with moderate temperatures and plenty of rain.
Further, advances in farming have helped increase yields.
In 2012, there was a drought, corn at local elevators was $8. Prior to that, corn had been $5-6 for a considerable period of time.
I suspect, however, that if you look at beginning and ending stocks for the years 2007-2016, you would not find so much variation as would seem to justify such price swings.
Listen to or read some grain commodity news. Constantly, there is discussion about what the “funds” are doing.
Just observations on my part, but commodity markets are not volatile strictly due to supply and demand.
With zero, or near zero interest rates, money has poured into other investments besides bank deposits. Commodities are no different. One can buy all kinds of commodity ETF shares.
Eventually, you are correct. If prices stay too low for too long, there will be a shortage and prices will rocket up. But that could take several years.
Furthermore, low commodity prices are deflationary, and cause feedback loops in the world economy. Exporters have reduced income, which decreases exporter spending, which lowers demand.
Increases in both energy and grain demand seem to be more about population growth than price.
I think the commodity markets suffer from some “recent bias” also. I hear traders talk about prices “rocketing up” from February lows having gone up too fast, too soon, even though $40s still causes losses for most US based oil companies.
OTOH when oil would breach $80 just 2+ years ago, traders would say oil was “oversold” even though we were still making very strong profits at $75-$80 WTI.
Hi Shallow sand,
Supply has remained above demand even with low oil prices from 3Q2014 until 2Q2016. Yes the commodity derivatives markets can have some influence, but when supply eventually falls short of demand, prices will increase regardless of the price in the futures market (thought he front month futures price is also likely to increase.
On low prices hurting oil exporters, that is correct, but it also helps those nations that are net importers of oil, on balance at the World level it is probably a wash as far as how the oil price affects total demand for oil, the demend for oil correlates best with World real GDP, though population is pretty good as well.
Hi Shallow Sand,
Oil Prices have been pretty low for a while already, the monthly spot price for WTI has been under $50/b for 15 of the last 18 months and the average monthly WTO spot price has been $45.47/b from Jan 2015 to August 2016.
Prices have already been low for 18 months, so my guess is another 6 months will get us to your “couple of years” and the scarce oil supply will start to kick in, it might take another 12 months at most in my view, but 36 months?
I doubt it.
I agree with your view on supply (flat in the short term, decline unless price increase) but I´m a bit more sceptical when it comes to demand growth. Look at what happened in 2008 – demand dropped. We may end up with flat demand or a drop in 2017.
Hi Jeff,
If you remember, oil prices reached an all time high (to that date) in 2008, and the housing bubble started to sink the economy. Currently oil prices are pretty low (relative to 2011-2014 and in 2016 $ or real oil prices adjusted for inflation). Possibly if we see oil prices rise to 2008 levels in real terms we might see demand drop, if we add a housing bubble it would be worse, it’s not clear we are in a housing bubble at present.
For the US, the average imported crude price in 2008 (2015$) was $102/b.
http://www.eia.gov/forecasts/steo/realprices/
If demand falls at the same rate as supply, oil prices will remain low. That requires the IMF, IEA, and EIA to be wrong on oil demand, we will have to wait and see, they are wrong fairly often, but more on the supply predictions and the oil price.
IMF, IEA, and EIA extrapolate trends – they will never forecast a trend brake/recession etc.
Take a look at the latest JODI data. China’s oil production is down, their imports are down but their oil products export continues to increase. In other words, their domestic use of transport fuels is probably flat or decreasing. That is not the sign of an economcy growing at 6-7%.
The biggest joker is, however, what the FED will do. Higher interest rates reduce demand and strengthen the US dollar which reduces the price of oil (in dollar that is). Also, remember the Triffin dilemma and take a look at global capital flows – money is now flowing back to the US. Emerging markets will find themselves in severe difficulties if the FED choses to hike the rate. Winter is coming.
Hi Jeff,
There are those that forecast a recession every year, eventually they will be right, my guess is about 2030. Emerging economies can pay off their dollar denominated debt and switch to debt issued in Euros, if the FED ever raises rates significantly. It will depend on the country in question, some EMEs are struggling others are doing well.
Perhaps a recession will come sooner, very few predict them in advance (except those that always say there will be a recession next year.) Then we would have to look how often they predict recessions correctly.
World recessions do not happen very often.
The mark to market is pretty obvious, but I couldn’t figure out how they arrived where they did with certain figures. I don’t and didn’t have the time to really work on it. Our problems are mounting and I don’t have the energy to worry about anybody else. Equipment breaks down, need parts, need to replace equipment outright, cash flow sucks. I’ve gotten awfully creative this last year or so and I worry a lot about major equipment problems. Cause then what? You know the deal man. But we’re still here. Fuck’em all. There’s always duct tape and super glue. And I’ve already hit the super glue a couple of times.
Cheers
That was for shallow.
Heads up on . . .not the Fed and what they tell lenders about shale loans. Rather, the BoJ.
The BOJ announced this week that they aren’t just going to define their Fed Funds rate (short term rate). They announced, for the first time ever, that they will buy JGBs to arrange a 0% interest rate on . . . not 1 year, not 2 year and not 5 year paper. 10 years. They are targeting 0% on their 10 year instrument. This haha was hawkish, because it had been about 6 basis points negative. Ten year paper that you pay to own.
It can’t be long before Whiting starts pitching for proppant loans in Tokyo. Why pay high yield paper numbers of 12% if you can pay 0?
A cold, or even normal winter could be interesting. https://zzn.mymailsrvr.com/a/webmail.php?wsid=45ccab5f88351666976e80c07d4b475ad741e28c
I just finished a post on horizontal well production in the Niobrara basin in Wyoming.
No fat tails there I think. Nice bell curves, specially the number of wells. I’d say rig count will be zero or one within eighteen months if it follows the Barnett model.
The number of gas wells is the same as the number of oil wells – does that mean all gas is associated? In April to June there were 12 rigs minimum (up to 16 now) but they only spudded 2 to 4 wells per month – does that sound reasonable?
George,
I don’t distinguish between oil and gas wells, and report the total oil and gas production and number, of both types, in each of the basins. That’s why you will not see the number of wells change when you switch between oil and gas.
Note that I report here until May, maybe the DUCs were not completely up-to-date for Q2, as that number is indeed very low.
Mike Shellman
Cheers to you amigo. Your Spanish is better than mine and I’ve got half my operation in Mexico. I always travel with a translator which I think has already saved my life twice. I’m a good old boy gringo and I’d rather make money than learn another language anyway.
We’ve had to go to a continuous flow VGO Distillation unit and going to build another. Sulfur ppm crap limits us to off road but I’d rather do business with the farmers anyway. That’s our survival plan. Plus I always hated the refineries anyway.
Don’t take a bullet for the team unless the money is good. Cheers and best of luck
Expectations fade for more gains in Iraqi oil output
09/23/2016
http://www.ogj.com/articles/2016/09/expectations-fade-for-more-gains-in-iraqi-oil-output.html
Expectations for further gains in Iraqi oil production have fallen victim to the country’s deteriorating finances and struggle with Islamic State militancy.
In a January report anticipating new financial assistance, the International Monetary Fund projected Iraqi oil output in 2020 at 5.7 million b/d.
A follow-up report in July put the number at 4.4 million b/d–only 200,000 b/d above the average rate it expects this year.
“Increasing oil production as previously envisaged would require a doubling of oil investment, which the [Iraqi] authorities recognize is infeasible given the fiscal outlook,” IMF explained.
Jean Laherrere just posted me the below astonishing graph. It shows a absolute correlation between private storage and the price of oil. He says:
When the oil price is low people store it hoping to sell it higher later.
It looks like the people storing the oil are betting on higher oil prices.
Looks like the opposite. I thought storing oil costs money. It seems they are trying everything to keep the price of oil artificially low including losing gobs of money on LTO.
I don’t understand your logic.
Why would you pay money to store oil unless you believed you could sell the oil at a profit at a later date — i.e., at a higher price?
And buying oil and then storing it keeps this oil off the market, which keeps the price oil artificially high.
“It seems they are trying everything to keep the price of oil artificially low including losing gobs of money on LTO.”
“Artificial”
made or produced by human beings rather than occurring naturally, typically as a copy of something natural.
Money is man made. Nothing involved in paying it for something is natural.
Gravity is natural. Mass is natural. F=ma is natural. Nothing about money is so there is no implication possible that anything involving money is a mere copy of something natural.
From the Miriam-Webster Dictionary:
Full Definition of artificial
1
: humanly contrived often on a natural model : man-made
2
a : having existence in legal, economic, or political theory b : caused or produced by a human and especially social or political agency
-Lloyd
Mine was from some dictionary, didn’t put quotes around it
“When the oil price is low people store it hoping to sell it higher later.”
The price of oil is low compared to the marginal cost of new production. Also, the cost of money is at a historical low rate. Making the financial cost to store it small. If the capital infrastructure is already in place. Isn’t it a no brainier to be expected ?
I always thought that a “normal” market is in “contango.” Think of contango as a normal “full carry.” That is, if it costs you $5 to store for a certain period of time, the futures market will let you sell the oil for at least the $5 more than current prices. So, if the carry costs are $5 and you can recover, e.g., twice that in the futures market, you store the oil. Think of it as the market does not want/need your oil now, so it will pay you to keep it off of the market. Hence lower prices.
On the other hand, a “backwardated” market is when the current prices are higher than the future prices + the cost of carry. So if you want to store the oil for a certain period at a cost of $5, the market says: You will lose money since the futures price is lower than your total costs. The market is telling you that it needs/wants the oil NOW so we will pay you enough to keep the oil out of storage and put into the market now. Hence, rising prices.
When you see the market go into backwardation, or at least to the point where you cannot recover storage costs, you will know that the glut is over.
And that is why storage going up correlates with prices going down; and why storage going down correlates with prices going up. Not astounding in my mind.
Texas numbers are out for a few days now. Shame that this is no longer discussed here (I know that data is incomplete and there are way too many discussions about deans models), but I think this is an important puzzle piece.
Daily production(initial estimate) was 2.75 mmbpd, so looks to stay pretty flat/increase somewhat.
Hi Daniel,
There will be a post Monday or Tuesday on Texas Oil and Natural Gas.
For some years I have seen the wind turbines when flying over Texas from Dallas or Houston or when landing in Amarillo. Windmills were ubiquitous on farms and ranches during my youth. https://www.google.com/search?q=stanley+marsh+toad+hall&tbm=isch&tbo=u&source=univ&sa=X&ved=0ahUKEwi2tcXQ0anPAhUH7mMKHZ3nCd0QsAQIJQ&biw=1654&bih=876#q=stanley%20marsh%20toad%20hall%20bowtie&tbm=isch&tbs=rimg%3ACTHCxy4t5X3uIjgyYmsPHm-q93B_1-SnnsoVavjlbFiQaV7nDxNEUhWr4wFXRCutdA9L3fp0-AOYR-KRw0SIFSSbFVioSCTJiaw8eb6r3EfIo_14w3SxQfKhIJcH_15KeeyhVoR8ij_1jDdLFB8qEgm-OVsWJBpXuREziHy3YTl9TSoSCcPE0RSFavjAEWmR9wAqkIlxKhIJVdEK610D0vcR3GSkn8T2wFUqEgl-nT4A5hH4pBHyei4-KArdlSoSCXDRIgVJJsVWEeNGT_1bfPwZ4 The Permian Basin is also interesting from the air. The original Pickens Plan stressed wind. https://www.youtube.com/watch?v=pAVARYFA4Fw
ERROR Please move above post to open thread or delete. Thanks RW
Hi,
We talked a little about decline rates and EUR in the last Bakken post. I decided to look into it a bit more and I did some really interesting findings I wanted to share with you. First a look at cumulative oil production for different years based on the production profile. After 5 years 2008, 2010 and 2011 have produced about 200k barrels. 2012 and 2009 is bellow that. 2013 had a good start but has had higher decline rate and currently follows the 2012 production profile. It will probably be slightly bellow 200k barrels after 5 years. 2014 is quite similar to 2013 but with a bit higher initial production but also a bit higher decline rate.
Based on that my guess is that average cumulative production for wells put on production in the 2008-2014 time frame will be about 190k barrels after 5 years. It´s too early to say anything about 2015 and 2016 so I will leave those out from the analysis.
Now to the interesting part. Bellow is a graph showing average yearly decline rates. It´s based on the production graph I shared in the latest Bakken post. Hughes´s EUR for Bakken wells were 378k barrels in Drilling Deeper. He used a terminal decline rate of 13% to get that number. In the graph bellow we can see that 2010 and 2009 indeed declined by 10%-15% for a while but 2009 has since the last 6 month or so seen accelerated decline rates. 2011 hit 15% but has since then seen increasing decline rates. 2010 is still in the 10%-15% area, but in the last half of 2015 production did not decline much. So for 2010 not to see increased decline rates for the rest of the year, decline rates need to be low, which the probably will not. So 2010 will probably also see increasing decline rates the coming months. 2008 had a big bump in the production in 2014, so hard to draw any conclusions from that year.
So why are decline rates accelerating? I can think of two reasons. First a result of increasing GOR. If you pump up the oil faster there will be less oil for later and that means higher decline rates later. Increased GOR also has other negative impacts like pressure depletion and oil production supression which results in a reduced ultimate recovery. The second reason could be because of down spacing. The well density in parts of the core areas are quite high now, more than 3 wells per square mile which should result in reduced ultimate recovery.
What impact will it have on ultimate recovery? The data are quite new. So it will be interesting to see what will happen to decline rates over the next 6-12 months. But we can have look at some scenarios. If we assume 190k cumulative production after 5 years, we have an average decline rate after that of lets say 13%, 17% and 20% and the wells are abandoned when they reach 4 bopd production and the average production is 53 bopd after 5 years, then we get these numbers:
Terminal decline rate EUR
13% 327,6k barrels
17% 291,1k barrels
20% 279,4k barrels
Either way, it looks like Hughes was too optimistic in his estimates. Not to mention the industry which claims EURs of 700k barrels.
Profoundly important stuff. EURs at that level should have shut off the lending spigot years ago, in a capitalism world. In a national security world, of course not.
The final graph is really hard to understand. + and – for a parameter “decline rate” is tricky.
190,000 barrels of oil in 60 months
$35 per barrel
10% severance
20% royalty.
$7 per barrel LOE
$3 per barrel G & A.
$7 million CAPEX, including surface and down hole equipment
1/2 of well cost borrowed at 5% interest, no principal reduction over 60 months
190,000 x .8 = 152,000 net barrels
152,000 x $35 = $5,320,000
Subtract:
Severance taxes $532,000
LOE and G & A $1,520,000
Interest $875,000
Pre Income tax net after 60 months. $2,393,000
Deficit to well cost after 60 months $4,607,000
Note, the above example does not include natural gas income.
As I have said before, the guys running those companies are criminals in my eyes. They probably have a really good salary at the same time as people lose money because they believe in what those companies are claiming.
5% eh?
OTOH it’s all profit if the loan is never repaid, with impunity.
Freddy, useful if you re-quote the source of this data. “Average decline rates” that define such EURs are narrative crushing stuff and best we have the defense ready.
Just throwing out numbers in close proximity to those in 2015 10K’s of major players up there such as Whiting and Oasis.
Feel free to alter the inputs, I think I am catching all the costs except for things like seismic, land, leasing, gathering and transport.
The Permian wells must be much stronger given the up to $60,000 per acre being paid there.
Say we drop that to $20K per acre, slam 12 wells into a 1280 acre drilling unit.
$20,000 x 1280 = $25,600,000/12 = $2,133,333.33 per well in land costs.
BTW, that is drilling on 440′ spacing. We must drill our 1000′ wells on 660′ spacing.
Watcher, maybe a bit hard to see but there is a text in the graph saying “Based on NDIC data, July 2016”. Or did I misunderstand you?
Nope, that’s it.
Increasing decline rates are right there on the graph. Now that’s actual data, not projections, so we can actually pay attention to this rather than ignore it.
Why would out-year decline rates worsen? How about a greater quantity of plug and abandon as the worst have to be shut down –taking them to zero and dragging the avg decline rate worse?
Do we have a P&A count in NoDak?
Hi Watcher,
possibly a good point on decline rates, I do put zeroes in for the well once it has been abandoned, not sure how FreddyW does it. This avoids survivor bias, but may overstate the decline of wells that do not get abandoned. Another problem is that some wells get refracked and get a boost when that happens, that is probably the case for some of the 2008 wells after 5 years or so.
Very good point Watcher. I do include the wells that are not producing with 0 production just like Dennis. But I also track how many are not producing. In general I can say that P&A is not the reason for the increase decline rates. The percentage of producing wells for 2009 has slowly decreased over the years and is currently 91%. There was a drop by 2%-3% during the spring when the oil price dropped, but is back to normal in July. About the same for 2010. There was drop in the spring but is back to about 93%. For 2011 there was no noticable reduction during the spring and in 2016 there has actually been more wells in production than in 2014-2015, currently at 96%. Note that if a well is not producing it does not automatically mean that it is P&A. It can also be because of maintanence or other reasons.
Actually there was no noticable drop in producing wells for 2009 during the spring. I looked at the 2008 curve by misstake. 91% producing wells was correct though, same as 2008. Producing wells were at 94% though one year ago for 2009. So that could explain a few percentage of the drop to 20% decline rate.
Good verify.
Hi Shallow sand,
Let’s say a company has a DUC, that they have drilled for $3 million and can frack and complete for another $4 million, let’s also say they finance using cash flow. Using all your numbers and deducting the interest, they almost pay the 4 million after 60 months, if oil prices remain low for 5 years. The money spent on the initial drilling is money lost if the well is never completed so maybe the wells continue to be completed to keep the lights on. It is not clear why new wells are being drilled, unless the company is convince the well will be much better than average (probably drilled in the core area and probably why in 2014 an 2015 the average new well had higher output in the first 12 months than earlier wells).
The Average Bakken/TF well does not make any money until WTI is about $85/b.
Watcher, positive values means production is growing, negative declining.
Hi Freddy W,
We would expect decline rates of about 13% at 60 months for the average Bakken/TF well from 2008 to 2015. Based on the data we don’t know what the decline rates will be after about 60 months, perhaps Hughes estimate is too high, my estimate is an EUR of about 350 kb if the wells are shut in at 15 b/d, if it is 20 kb/d for well abandonment the average well’s EUR would be 33o kb (oil only, natural gas is not included in these estimates). This assumes 8.6%/year terminal decline starting at 7.8 years, prior to that the decline is hyperbolic fitting roughly a hyperbolic with qi=16,024, b=1.4, and Di=0.29. See equation 1 at link below.
http://petrowiki.org/Production_forecasting_decline_curve_analysis
We do have some data what the decline rates are after 60 months. Look at the 2009 and 2010 curves. If your model were correct then we should have seen a close to 2% decrease per year in decline rates. We don´t see that at all. Instead it´s increasing for 2009. Also the 2011 wells are roughly 5 years old and currently see 17% decline rates. From were did you get the 8,6% terminal decline rate? There are currently no indications that the decline rates are moving to that number.
Hi FreddyW,
The decline rates for 2008 and 2009 are pretty low, in later months (though refracking makes it difficult to draw conclusions.
Fernando as suggested a terminal decline of 7.5%,the NDIC uses about 7%, I chose 8.6% arbitrarily, we need data further out in time that eliminates refracks to get a better idea on future decline rates.
You cannot really know the future decline rate in advance.
I looked at active Bakken wells from 2009-2010 (1176 wells total, 400 wells or more at the tail (Jan to Nov 2009 wells.) The natural log of monthly output is plotted against year from first output. The annual decline rate is about 9.1%.
If we use Jan to Nov 2009 wells only the rate is a little higher at about 10%, but we are using less data (about one third) for the period considered (4.5 to 6.75 years). The decline rate could flatten out more with time, we don’t really know.
I assume you are using the production profiles where the wells in each month are of the same age. Then my data is different from yours. I have around 7,45 for 4,5 years and 7,3 for 5,5 years. The data for 2010 is in that case incomplete for 5,5 years and older and unreliable. I only know how I got my data so I can not comment on yours.
I had a look at Enno´s production profiles and they are very similar to my. So there is something wrong with the data you have used.
FW – This seems a very important finding, the curves actually seem to hit a minimum decline rate around -10 to -20% (not 2008) and then may be increasing again, which supports the theory that late behaviour might be very different from the early years due to changes in fracture conditions as the pressure declines and/or water/gas increases. If the decline goes back up to -40% over another few years what does that do to recoveries and economics? The peak point looks to be getting earlier with newer wells as well. I guess we’ll have to wait another year for clearer picture with newer wells and with a bigger sample on some of the older years. More than a few people must be tuning their reservoir/well bore models against these results and getting a bit worried.
Freddy
This is always great work that you provide and I thank you for doing it.
In addition to increasing GOR and overall pressure decrease playing roles in decline rates, the closing of fractures (loss of conductivity) plays a very significant role also.
Proppant crushing, embedment, proppant degradation over time due to heat/pressure, fluid contact as well as subtle matrix shifting due to resource removal all occur to restrict hydrocarbon movement to the wellbore.
These events are most noticeable in the smallest, most distant fractures.
This is a big reason why these so called mega fracs/high density fractures are so significant.
By design, they are intended to remain within 300 feet or so from the wellbore (down from 1,000’/1,5000′ years ago).
In addition, these massive injections of sand, especially the smaller sizes that include diverting agents, rubbelize far more effectively the formation than earlier designs, causing larger, closer to the wellbore fissures than can be propped open with large amounts of bigger sized proppant (either sand or the more durable ceramics).
As far as the effects of downsizing, these closer to the wellbore stimulations not only enable closer proximity of laterals, the increased formation pressure temporarily provided by new, nearby fracs has consistently INCREASED output from the earlier wells.
Freddy, you and Enno have already seen this.
I am willing to post on this site a half dozen, a dozen ND permit numbers along with precise dates that increased output – along with huge jumps in produced water – have occurred, sometimes repetitively, coincident with new, nearby fracs (the permit numbers of which I can also provide).
This whole unconventional development may be a lot more dynamic, a lot more variable than its brief history may suggest when looking forward.
Are you willing to post on this site a half dozen ND permit numbers along with precise dates that did not increase output?
Watcher
I’ve actually encountered maybe 20 that fits that criteria. Still trying to identify patterns, such as different formations (MB versus TF, amount of water used in new frac, actual distance between wells, etc.).
Takes time to go through well files and, frankly, I am interested but not THAT willing to devote the time/effort when over 100 have clearly shown dramatic increase.
Still, this is a very significant aspect that has been given almost no attention.
Yah, great, what’s the average?
Watcher
I have not precisely targeted the numbers, but I just scan through production histories (fast/easy to do with the subscription), of older wells that are closely surrounded by new ones (easily seen on the Gis map).
If output jumps by 50% to 1,000% – most common range is double to quadruple – I then check to see if artificial lift hardware or re-frac might be the cause (AL frequently is, only to be followed later on by ‘halo effect’).
If no apparent reason exists for big production jump in oil AND
produced water, I then check frac dates for closest wells.
In over 100 wells, output increases simultaneous to nearby fracs.
The elevated production immediately resumes it’s customary decline, returning to pre-frac levels in 6 to 8 months time.
Some wells have experienced this multiple times.
I don’t think we know what you’re talking about. This little sub-thread is about Fred’s findings of recent increasing avg decline rates by year. How is that relevant to this 1000% increase in oil production?
Thanks Coffeeguyzz. I also appreciate your posts even though I think you sometimes listen to the shale oil companies too much. Yes perhaps closing of fractures could also affect decline rates. But it sounds more like a slow process that happens over many years. Or it can have more of an immediate effect also?
I can see the logic that closer to the wellbore stimulations will allow for closer laterals. The question is how well this can be accomplished. I guess time will tell.
A legendary investor thinks electric cars will raise the price of oil
http://finance.yahoo.com/news/legendary-investor-thinks-driverless-cars-215335705.html
a lot here to think about
http://oilprice.com/Energy/Energy-General/Why-Oil-Prices-Will-Rise-More-And-Sooner-Than-Most-Believe.html
9% depletion ratea predicted? I don’t think that’s correct, we wouldn’t have any more oil in about 20 years. I think he means decline rates for mature fields, and even then 9% is the highest I’ve seen by a long way, although it has been going up steadily (I think 6.2% was a recent IEA number).
Hi George,
Actually the 9% depletion rate number sounds right to me. Remember this is the amount extracted from proved producing reserves. We do not have good data on the World level for proved producing reserves, using Webhubbletelescope’s Oil Shock model, my estimate for C+C less extra heavy (oil sands) oil producing reserves is 334 Gb at the end of 2014 and about 28.2 Gb of oil produced (extracted) in 2015. The depletion rate from producing reserves was 28.2/334 or 8.4% using a model which assumes the URR of C+C-XH is 2800 Gb (for a 2500 Gb model depletion rate is 8.8%).
Maybe the IEA is using an Oil Shock model. 🙂
Oh and remember we would still have more oil in 20 years because more reserves are added to producing reserves every year (as field are developed) and also because output will decrease over time. We might see zero output in 50 to 70 years, if the price of alternatives falls faster than the fall in oil supply so that oil prices decrease, this is unlikely in the next 30 years in my view.
Except reading it again he does mean decline because he calculates the needed additional production at just over 8 mmbpd.
Often people get depletion and decline rates mixed up. The IEA maybe not. They have suggested 6.5% decline rates for declining mature fields, and I assume the IEA knows what a depletion rate is. I was simply trying to reconcile an IEA 9% depletion rate estimate. It makes sense if the denominator is producing reserves.
Dennis, were the reserves reduced when the price of oil fell?
Hi Gonefishing,
No. The model doesn’t use any prices. Also a well that is producing is typically not shut in when prices fall (except low volume wells), so although proved reserves might decrease as prices fall, proved producing reserves are not affected very much.
OT, but petroleum-based. Over the weekend Rockman posted a great series of messages at peakoil.com re-iterating his perspective on the 2010 Macondo blowout. It brought back memories of his compelling real-time daily technical analysis on TOD in the midst of the disaster. It deserves a read by anyone interested in the oil/gas industry and not already intimately familiar with the technical details of that blowout or of underground drilling in general.
http://peakoil.com/forums/deepwater-horizon-oil-spill-capped-three-years-ago-t68495.html