The EIA’s Monthly Energy Review just came out. They have the U.S. production numbers through December along with World, OPEC C+C, Non-OPEC and selected Non-OPEC nations through October. All EIA data is in thousand barrels per day.
Notice: When I use the term “peaked” below, I am referring to the most recent peak, not the all time peak and not necessarily the final peak.
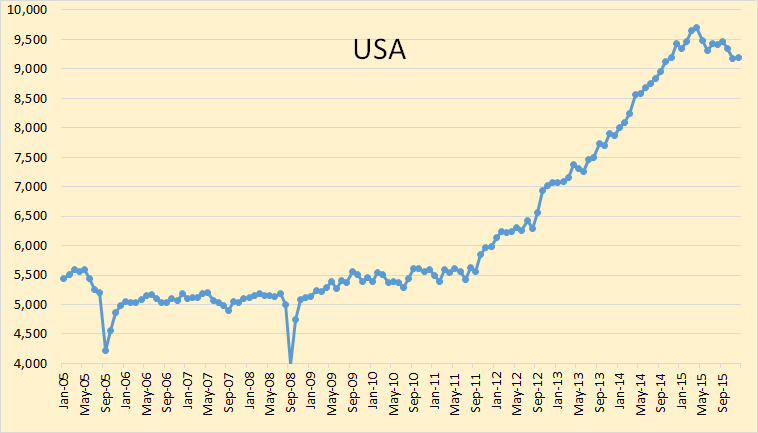
United States C+C production peaked in April at 9,694,000 bpd and has dropped half a million barrels per day by December to 9,191,000 bpd.
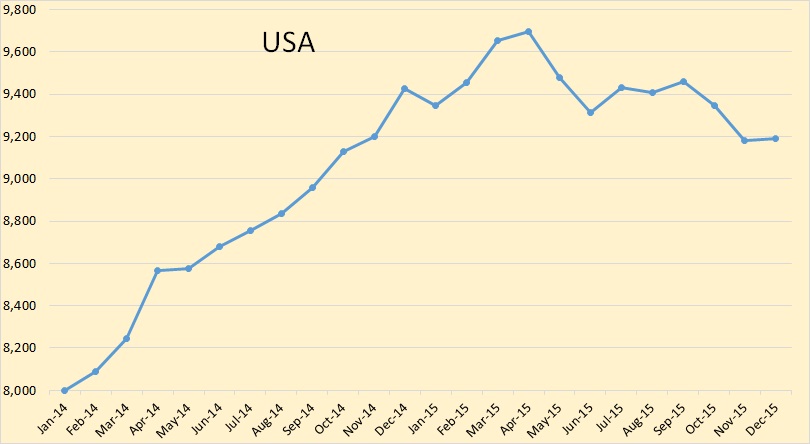
Here is a 2 year chart of US production that gives an amplified look at what is happening. November and December production is now below November 2014 production.
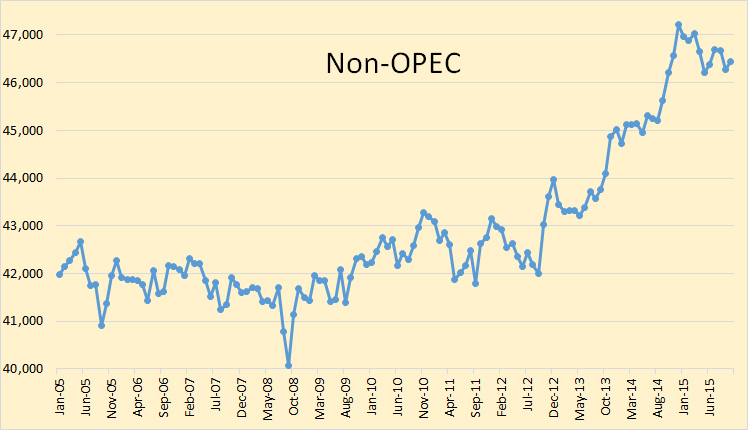
Non-OPEC C+C peaked in December at 47,207,000 bpd and dropped 763,000 bpd to 46,444,000 bpd by October. The above chart, I believe, clearly shows that Non-OPEC production is in a downward trend. There is little doubt that this trend will continue for the next year or so. The question is how far will it drop before an increase in prices brings back enough upstream investment to turn production back around? And how long will that take?
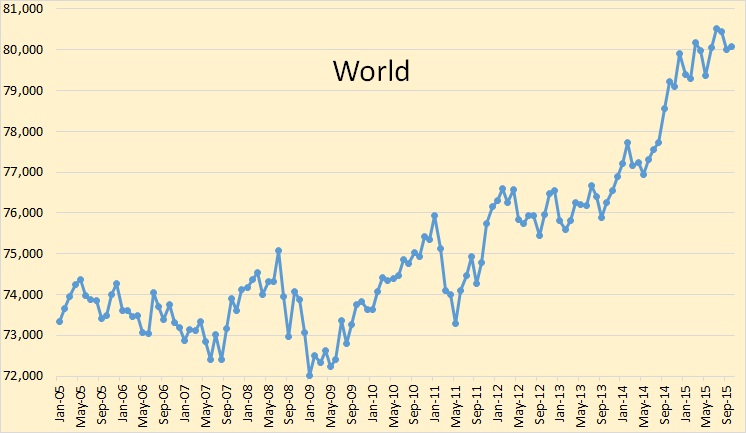
World C+C production peaked in July at 80,531,000 and by October had dropped 461,000 bpd to 80,070,000 bpd.
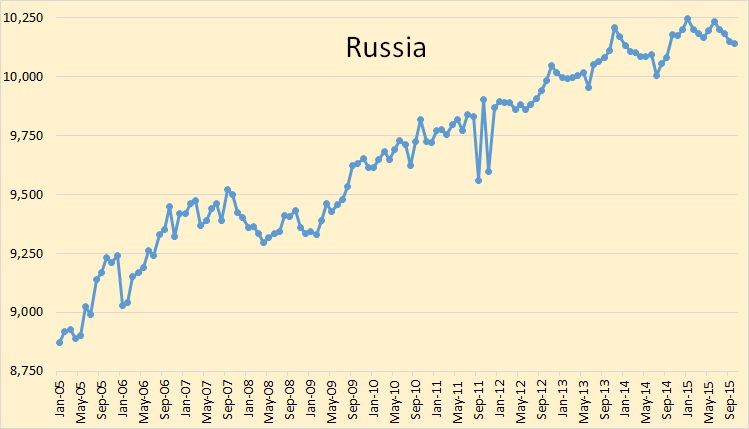
Russia peaked in January at 10,246,000 bpd and in Octber was down 106,000 bpd to 10,140,000 bpd. Russia appears to be on a plateau, likely before a slow decline that begins in 2016.
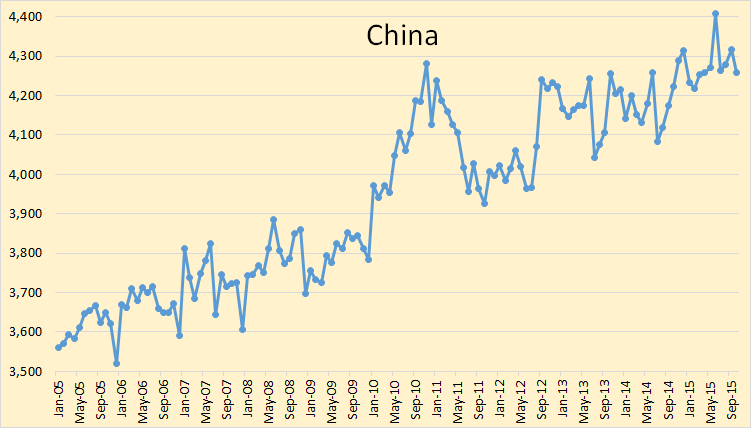
China peaked in June at 4,408,000 bpd and production in October stood at 4,259,000 bpd.
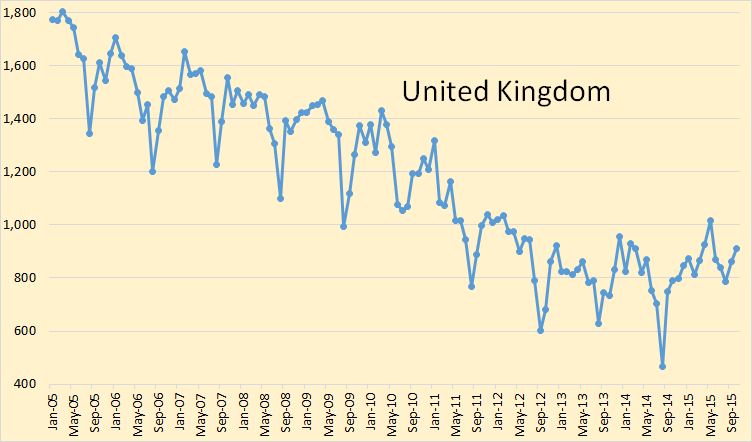
The United Kingdom has been on a plateau of about 800,000 bpd for about three and one half years but in October had production up to 912,000 bpd.
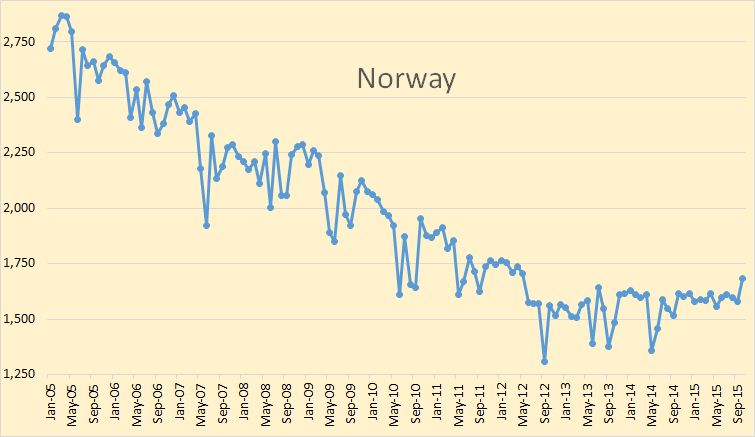
Norway, like the UK, managed to halt its decline about three and one half years ago and has been on a plateau of around 1,600,000 bpd since then. They had a gain of 104,000 bpd in October to 1,685,000 bpd.
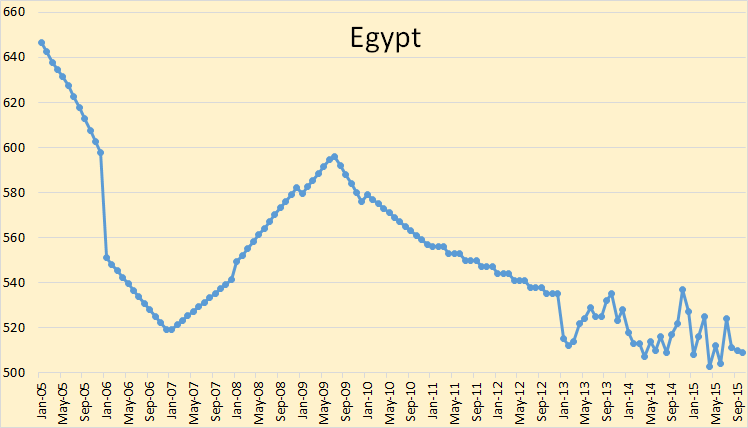
Egypt is in steady decline. In October their C+C production stood at 509,000 bpd.
For Canada I am using the data from Canada’s National Energy Board. Their numbers are through December and were upgraded just a couple of days ago. The data below is in barrels per day.
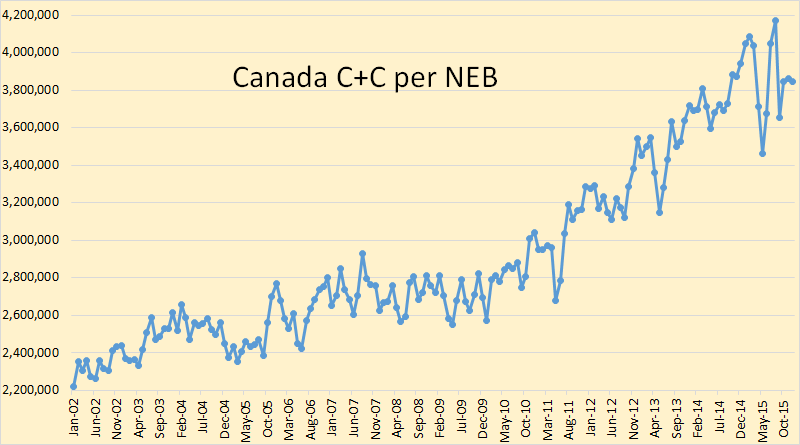
Canadian production peaked in August but things have not gone so well since then. The decline in April, May and June is something that happens almost every year but the decline in September was an anomaly.
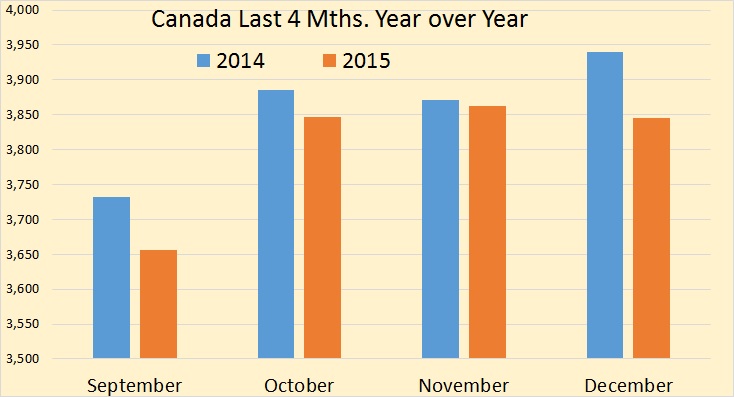
Canada, for the last four months, has declined in year over year production. And since they had record production in January, February and March, that trend will continue for at least for three more months. The data in the chart above is in thousand barrels per day.
Ambrose Evans-Pritchard and Daniel Yergin come to some startling conclusions. Bold mine.
Wealthy predators eye US shale firms
The question is whether even US shale can ever be big enough to compensate for coming shortage of oil as global investment collapses.
“There has been a US$1.8 trillion reduction in spending planned for 2015 to 2020 compared to what was expected in 2014,” said Yergin.
Yet oil demand is still growing briskly. The world economy will need seven million more barrels a day by 2020. Natural depletion on existing fields implies a loss of a further 13 million barrels a day by then.
Adding to the witches’ brew, global spare capacity is at wafer-thin levels – perhaps as low as 1.5 million barrels a day – as the Saudis, Russians and others produce at full tilt.
Yergin said those hoping for a quick rescue from Opec were likely to be disappointed.
I am of the firm opinion that the vast majority of oil production prognosticators are under estimating the effect of natural depletion of existing fields. Even countries that are increasing production, or are on a production plateau, like Saudi Arabia, Iraq, the UAE, Iran, Russia and others, all have serious depletion problems. Failing to account for this decline when you make your prediction will likely cause a serious error.
Gail Tverberg’s blog, Our Finite World, published the following chart last week. But the chart was originally created in 2014 by Alliance Bernstein and may not reflect today’s cost as some costs have dropped in the last year. The term “breakeven cost” refers to the cost to produce a barrel of oil and has nothing to do with a country’s budget.

I do not understand why they thought US conventional was so expensive. However it is interesting to note that Canadian Oil Sands is the most expensive oil in the world.
Nevertheless there is reason to believe that this chart just has production costs way too high. Eyeballing the chart it looks like they have Nigerian cost per barrel at over $60. But this article has a different figure: Oil crash: Nigeria producing at $5 per barrel loss.
LAGOS — As oil prices continue on the downward slide, Nigerian oil firms may be producing at up to $5/barrel loss, as average production costs for independent and marginal field producers is between $30 and $35/barrel.
399 responses to “Is Non-OPEC Beginning Serious Decline?”
Oilsands firms may be forced to cut production as danger of negative bitumen prices looms
The danger for oilsands companies is the price of bitumen falling below the price of diluent, “so your costs exceed your revenues from selling the blend,”
http://business.financialpost.com/news/energy/oilsands-firms-may-be-forced-to-cut-production-as-danger-of-negative-bitumen-prices-looms?__lsa=509c-f4ce
LOL
http://www.thebeerstore.ca/beers/moosehead-lager
The real existential risk is the price of oil falling below the price of a case of Moosehead. 😀
http://bedstuybeer.com/Bed-Stuy-Beer-wholesale-prices.pdf
http://www.wine-searcher.com/merchant/2713?wine_id_F=4796374
Note that the price for a case of Lonestar beer is $23-$26. So, don’t be surprised if WTI falls to that price range (absent a world war and resumption of QEternity^2). 😀
Well, the oil price seems to be creeping back up, so we won’t have to brew/distill our own just yet, but it might be prudent to give it some consideration.
Meow Mix
Part of the decline for Canada in September and October was a Maintenance shutdown at the Hibernia offshore platform.
http://www.cnlopb.ca/pdfs/graph_hib.pdf
Canada might have further reduction this year because of the tragedy at Nexen’s SAGD facility which means about 50,000 bpd is off line indefinitely.
Note also – not shown in the charts – but Mexico has started declining again after a plateau period and Brazil might be falling short of expectations given the economic, corruption and labour problems at PetroBras.
Also Syncrude was totally shut down for due to a pipe burst at the end of August. That took 320 kb/d off line for all of September.
“Russia peaked in January at 10,246,000 bpd and in Octber was down 106,000 bpd to 10,140,000 bpd. Russia appears to be on a plateau, likely before a slow decline that begins in 2016.”
Oh yes, the EIA doesn’t know exactly how much oil is produced in the U.S., but they surely know better than the Russian Energy Ministry what are production volumes in Russia.
As regards the future, I agree that Russia is on a plateau, with potential +/- 1-2% annual fluctuations around 2014-2015 average levels.
Russian crude and condensate production (mb/d)
source: Russian Energy Ministry
Alex, the EIA depends entirely on other sources for its Russian oil production reports. This is very similar to OPEC’s “Secondary Sources”. The EIA and JODI, for the last three years or so, are extremely close with their Russian production numbers. They both report numbers well below what the Russian Oil Minister reports. And they both often report a monthly decline in production when the official Russian numbers report an increase in production.
Is it possible that there is some political bias in those reports by the Russian Oil Minister?
Just asking.
Hi Ron,
Not any more likely than political bias by the EIA or NEB, imo. I think EIA numbers for the US are pretty good, NEB’s numbers for Canada are best and the Russian Energy Ministry numbers for Russia would be best.
Dennis, I do appreciate your input but sometimes you just try way too hard to be fair. 😉 What motive would the EIA or the NEB have for fudging the numbers? And which way would they fudge them if they did?
A perfect example: If you go to OPEC’s MOMR and check the production numbers for each OPEC nation, you will find two different sets of numbers. One set will be from “Secondary Sources” and the other set will be from “Direct Communication”. The direct communication numbers, for several countries, is always off by several hundred barrels per day. For others the two sets of numbers are relatively close. The difference is some have a motive for fudging the numbers, others do not. And also, secondary sources, such as Platts and others, is almost always more accurate than the numbers produced by direct communication with the country itself.
Also Dennis, I must ask, and this is very important, does the EIA or NEB have a reputation of producing propaganda? Does the Russian Government have a reputation of producing propaganda?
Now I do fault the EIA in some of their numbers. But they do not fudge the numbers deliberately. But due to budget restraints or lack of a good data source they sometimes just seem to insert a number. But there is no malicious intent here. They don’t have a good number so they just use the last good number they had… again.
As to those Russian numbers. JODI, when they reduced Russia’s numbers significantly a few years ago, was highly criticized for doing so. (They just brought them into line with what the EIA was already reporting.) They said they had several sources for those numbers and stood by them. Now the JODI numbers and the EIA numbers still vary but not by any significant amount. Prior to that adjustment JODI had been using Russia’s direct communication numbers.
Bottom line, I trust the EIA’s and JODI’s “Secondary Sources” far more than I trust Russia’s “Direct Communication”.
Hi Ron,
You may not have noticed, but the Soviet Union no longer exists. 🙂
AlexS is very sharp, if the Russian Energy ministry was fudging its numbers he would be aware.
I have no evidence that the Russian Energy ministry is fudging any numbers and to assume otherwise is a mistake in my opinion.
I agree the OPEC numbers based on direct communication may be fudged, there is no auditing of OPEC data.
The Russians report in metric tonnes rather than barrels or cubic meters so the output numbers depend on the appropriate average density of the oil.
The difference between US and Russian data may be a matter of how C5 is reported, in the US C5 produced in the field is counted with crude and C5 produced in a natural gas processing plant is considered NGL.
This is a strange distinction unique to the United States. In Canada all pentanes and pentanes plus are grouped together regardless of where they are produced, perhaps Russia does the same.
If so, it is the US EIA which is not accounting for C+C properly rather than the Russians, so I am being both fair and logical if my guess is correct.
I don’t know Russian so I cannot read the Russian Energy Ministry website. Perhaps AlexS can comment on how pentanes( and C5+) from natural gas processing plants in Russia are reported. Are they included in C+C output numbers (similar to the way Canada reports its data)?
Dennis, the difference is far more than just pentanes from natural gas wells. The EIA shows Russian production declining in August, September and October of 2015. Alex’s chart shows Russian production increasing sharply in August, September and October of 2015. There is no way pentanes from natural gas wells could account for that.
When one agency says production is increasing sharply and another says it is declining, then…..??? Well, you tell me. And please don’t tell me it is all caused by C5 from natural gas wells.
And the difference, in October, is about 600,000 barrels per day, up from about 450,000 bpd just a couple of months earlier.
Hi Ron,
It might explain some of the difference, but for the same reason you would trust Canada’s NEB to know Canadian output better than the EIA, I would trust Russia’s Energy Ministry to know Russia’s output better than the EIA.
As in most things the truth is unknown.
but for the same reason you would trust Canada’s NEB to know Canadian output better than the EIA,
Dennis, the EIA uses the NEB data. That’s where they get their Canada data. The EIA Canada data tracks the NEB exactly, but slightly below it. There is something that the NEB is counting but the EIA is not. I have not figured out what that is but any rate the difference is too small to be concerned with. I only use the NEB because they have two months more data, (December), than the EIA, (October).
I would trust Russia’s Energy Ministry to know Russia’s output better than the EIA.
Oh, of course he does. I have never questioned what the Russian Energy Minister knows. I only question what he reports.
Denis, as we discussed I’m researching the inputs for a spreadsheet I’m preparing to estimate a pretty rough forecast.
Based on what I see it could be possible for the USA to return to the previous crude plus condensate peak production, but the main us potential seems to be very light crude and NGL. Since I’m not going to account for NGL I may be a bit off.
The only other long term sources I can see are the Canada and Venezuela heavy oils, the Brazil deep water, Iraq, and some shale production in the Former Soviet Union.
The Tverberg Venezuela costs are understated if the crude is to be produced to recover more than say 6 % recovery factor. Once they develop the fields to have their target 20 % the costs skyrocket because they have to generate steam and add butane to it.
Anyway, I’ll keep on researching and playing around with the spreadsheet. Will let you know what I see in a few weeks.
Fernando,
Thanks. I look forward to it.
Hey Fernando,
Hopefully you’ll share your forecast with the rest of us 🙂
Many posts ago you mentioned you could see the world getting to 100 million barrels per day if we had $200 a barrel oil.
Would love to see you model that scenario to see where that 200 oil is coming from.
On another note, as Ron says, you should try to be one of the 1 billion survivors after overshoot.
Based on Fernando’s long term projections it looks like the Americas are the place to be with Canada (IMO the best spot to be), Venezuela and Brazil having the best long term oil prospects.
Also, USA has the best coal reserves if it gets to CTL.
There will be hard times everywhere, but in Canada you’ll atleast be able to drive to the liquor store and have lots of food to eat.
If the AMOC (Atlantic meridional overturning circulation) continues slowing down, you won’t want your grandchildren to be on the east coast..LOL!
thanks!
Ron,
Is it possible that there is some political bias in those reports by the EIA and JODI?
Just joking.
In fact, I try to avoid conspiracy theories if there are simpler explanations.
In this case a do not see political bias from any side. Rather, there are different definitions and methodologies.
I had several times commented on Russian oil production in the past months, but as you are raising this issue again and again I probably have to set up somewhere a FAQ section.
In brief:
It seems that the EIA and JODI are classifying most of Russia’s gas condensate production as NGLs.
This is because only lease condensate is included by the EIA in C+C output, while most of condensate in Russia is processed at gas and condensate processing plants (GPPs), where acid and sulfur components are removed, lighter hydrocarbons (ethane, propane, butane) are separated, condensate is stabilized and processed. Most of these plants distil petroleum products (gasoline, jet fuel and diesel) directly from condensate, while part of stabilized condensate is supplied to conventional oil refineries, petrochemical plants and for exports. As such, I do not understand why a product which consists of C5+ hydrocarbons and is liquid at standard pressure and temperature is defined as NGLs rather than condensate just because it is treated at gas processing plants. But this is the EIA’s methodology and JODI apparently follows its classification.
IEA has a different definition of condensate and NGLs. Thus, according to JODI, Russian average NGL production in January-November 2015 was 727 kb/d; and according to the EIA it averaged 757 kb/d in January-October. For comparison, the IEA numbers show Russian NGL production at only 340 kb/d in 2015.
The IEA oil production statistics include C+C+NGLs, however in their recent monthly Oil Market Reports (from May 2015) the IEA is also mentioning C+C production for Russia. These numbers are very close to the data provided by the Russian Energy Ministry. Note that the IEA works closely with Russia and they know the situation in Russian energy sector better than the EIA or JODI.
Estimates of Russian petroleum liquids output (mb/d)
The IEA’s C+C numbers (from the text of the Oil Market Report) are roughly the same as Russia’s Energy Ministry’s.
They use the 7.33 barrels/ton ratio for the Russian oil, similarly to several other western sources
JODI data almost perfectly follows the trend of the Energy Ministry’s numbers
We can find the EIA data for Russian petroleum liquids in:
– Short-Term Energy Outlook, January 2016: total liquids production. The numbers for November and December 2015 are forecasts, for earlier months – estimates.
– Monthly Energy Review: crude + lease condensate production. Estimates to October 2015.
– International Energy Statistics [http://www.eia.gov/cfapps/ipdbproject/IEDIndex3.cfm?tid=50&pid=53&aid=1]
Here we can find a detailed breakdown: crude + lease condensate; NGPLs; other liquids (none in the case of Russia);
refinery processing gains and total liquids supply.
C+C numbers are the same as in the Monthly Energy Review;
Total liquids production data is the same as in the STEO.
But all the numbers are only up to June 2015.
I have tried to “model” the EIA numbers for the whole period to December 2015.
We have the EIA forecast for total liquids supply to December;
Refinery processing gains are assumed to remain at 20 kb/d, as in the past 2 years;
NGPL production is assumed at the same levels as in the August-October (755 kb/d)
Then we can calculate the C+C numbers for November and December.
As we can see, up until July the trends in the EIA numbers and Russian official numbers coincide, but from August
they go in opposite directions. I think the EIA is just late to update their estimates, compared with the other agencies.
EIA petroleum liquids estimates for Russia vs. Russian Energy Ministry C+C production data
Alex, I am not a conspiracy theorists either. I do not believe there is any conspiracy concerning Russian oil production. Also, I do understand that there are different definitions of exactly what crude plus condensate consist of.
Alex, I have no problem with any of this shit. What I do have a problem with is this, you wrote:
I had several times commented on Russian oil production in the past months, but as you are raising this issue again and again I probably have to set up somewhere a FAQ section.
I did not raise the issue Alex, you raised the issue! First, in your comment you quoted me:
“Russia peaked in January at 10,246,000 bpd and in Octber was down 106,000 bpd to 10,140,000 bpd. Russia appears to be on a plateau, likely before a slow decline that begins in 2016.”
Then you replied:
Oh yes, the EIA doesn’t know exactly how much oil is produced in the U.S., but they surely know better than the Russian Energy Ministry what are production volumes in Russia.
So obviously Alex, it was you who questioned the difference between what the EIA reports and what the Russian Energy Ministry reports. Nothing, absolutely nothing in my posts even mentions the Russian Energy Minister, or CDU TEK, or anything else reported by Russia. I would have been completely satisfied with completely leaving their estimates out of the picture. And that would have been that had not you brought up the subject.
So please don’t accuse me of “raising this issue again and again” because I did not do that, you did.
And I can promise you, I will not raise the issue in the future either.
Hi Ron,
I believe AlexS has shown fairly conclusively that the EIA data for Russia and that of JODI as well suffer from exactly the problem I brought up.
This has been discussed several times in the comments, you have chosen to ignore it. Note that the difference between the EIA and NEB numbers are also explained by the different way that the EIA and many other nations report pentanes and pentanes plus.
The difference between the EIA and Russian Energy ministry data is that the EIA is reporting crude only for Russia and not C+C, the data from the IEA Monthly Oil Market report shows this rather definitively.
A more accurate data set would use the Russian data in place of the EIA data for Russia for C+C, in my opinion.
Dennis, I did not choose to ignore anything. I did not bring the subject up of the difference between the EIA and the Russian data for Russian production in this thread. Alex did that!
I have no desire to further discuss the difference between the EIA data and the data presented by the Russian Energy Minister. We have beat that dead horse until there is nothing left but a greasy spot on the ground.
For my data and charts I present on this site I will continue to use the EIA, NEB, JODI and the OPEC MOMR. I don’t have access to any other Russian data other than the daily CDU TEK site. But that is a daily input that sometimes skips a week or more with their reporting. I tried tracking it for awhile but it was just too erratic. So I just gave up.
So on this site we have the EIA, JODI, NEB and MOMR. That is it. If that is not enough then I am just really damn sorry. When I report Russian production it will be either the EIA numbers or the JODI numbers. If you don’t choose to believe those numbers then please feel free to find some numbers that you like better.
Hi Ron,
Well if you wanted a better estimate for Russia you could use:
http://minenergo.gov.ru/en/activity/statistic
You would simply substitute the better numbers for Russian output, just as you substitute the NEB data for Canada.
I did this below for Jan 2013 to Oct 2015 as I only have data for Russia back to Jan 2013.
Hi AlexS. It would be nice to have a link to the source of that data. Looking at the discrepancy to other datasets I work with, I would guess it is not reporting exactly the same products. The EIA C+C dataset is pretty restrictive (as it should be), for instance, it only includes fossil products that are stable in liquid state at the surface.
Cheers.
Luís,
The source of data is Russia’s energy ministry’s website:
http://minenergo.gov.ru/en/activity/statistic
The numbers are in tons per months. I am using 7.3 barrels/ton ratio to convert into b/d.
Condensate is included, but not NGLs.
More detailed data by each company and by each subsidiary of large vertically integrated companies is available in the CDU TEK (a Russian analogue of the EIA) website, but it’s not free.
http://www.riatec.ru/en/catalog/operative_data/section.php?SECTION_ID=117
These detailed numbers are republished in a number of Russian oil&gas industry journals (also not free).
Detailed monthly and annual averages in kb/d are also published by Energy Intelligence (paid site)
http://www.energyintel.com/pages/login.aspx?fid=art&DocId=913740
But they are using 7.33 conversion ratio, so their numbers in kb/d are slightly higher than mine.
The notion that any western government, agency or corporation can be trusted with any sort of claim regarding anything Russia-related is absurd. This is especially so in the case of the most strategic commodity on the planet.
Hi AlexS,
If we substitute the Russian Energy Ministry data for the EIA Russian data, and use the NEB data for Canada, we get the following chart. The red dashed line is the centered 12 month moving average.
Interesting that takeovers thus far seem focused on unconventional….Suncor bought COS and talk of shale…can conventional producers be far behind?
Gail’s chart on Canadian costs are off:
They vary all over the map as to capital financing and age of plant.
Syncrude pegs losses at up to $10/barrel as oil prices collapse
Canada’s largest synthetic crude project is not likely to shut down operations, its biggest owner said on Wednesday, even as a company…
Oil sands defaults to increase: Portfolio manager
Canada’s largest synthetic crude project is not likely to shut down operations, its biggest owner said on Wednesday, even as a company presentation showed it is losing about $10 for every barrel it produces.
Syncrude Canada Ltd, a joint venture project in northern Alberta at which mined oil sands bitumen is upgraded into refinery-ready synthetic crude has a break-even production costs of $46 US a barrel, according to a presentation from Siren Fisekci, vice president of investor and corporate relations.
Meanwhile, the cost to produce Syncrude’s fully upgraded oil is even steeper at $50 US a barrel once interest payments, administration, insurance and other costs are added in, according to the presentation at the EnerCom Oil and Gas conference in Denver, Colorado.
http://www.bnn.ca/News/2015/8/20/Top-Canada-oil-sands-project-unlikely-to-close-even-if-its-losing-6-a-barrel.aspx
I have started a website in which I would like to provide an interactive presentation of US shale oil production : shaleprofile.com
It just got launched, and is very basic, but the interactivity may make it interesting to those interested in the Bakken.
Interesting site Enno.
It would great to see charts of production per well over time. My own analysis has shown Bakken per well productivity has been dropping for a good few years. More wells to produce the same amount of oil is not a good sign.
Thank you Andrew.
Note that when you click on the 3rd analysis (well quality over the years), you can change the 4 filters to zoom into the well production over time for small sub groups (e.g. the production profile of wells of a single company in specific counties/fields/formations) . I do aim to include individual wells as well as an analysis in a future update.
Enno, I looked over production for several companies. Interesting to see how they approached 2015 differently. I suspect if all had taken EOG’s approach in the Bakken, prices would not be so low now?
Shallow,
Probably it would have made some impact yes. But they had the cash, they got rich drilling fast, and they had many incentives not to let production drop, unlike actual owners..
Thank you, Enno,
I’ll be a frequent visitor to your website
Meanwhile, here are excerpts from an article in Platts’:
“When North Dakota oil production broke above 1 million b/d for the first time in April 2014, many expected that the 2 million b/d threshold would be breached in relatively short order.
Now, rather than striving for 2 million b/d, state officials are hoping to maintain production above 1 million b/d.
And there are indications that a significant drop in Bakken supply may already be underway.
While Lynn Helms, the state’s top oil regulator, called recent production numbers “quite a surprise” amidst market shifts largely unsupportive of domestic production, he indicated the relative success would be short lived.
While North Dakota supply has remained steady amid falling prices, it’s unclear what has happened since the end of November as prices began their steady dip below $40/b and, eventually, $30/b, a pricing environment where Helms believes the majority of Bakken producers cannot survive.
“We cannot sustain production at sub-$30/b prices,” Helms told reporters following the release of the latest state supply data.
Helms believes that WTI spot prices will need to average roughly $50/b in order for current production to be maintained. If prices return to the $30-$40/b range, production will likely stay above 1 million b/d, but will likely stay just above that level and will fall steadily, by about 10,000 b/d each month, if prices do not climb above $40/b in the near term, Helms said.”
http://blogs.platts.com/2016/01/26/north-dakota-oil-supply-crash/
Thanks Alex,
You are one of the most informed (and unbiased) commenters on this board, and I highly appreciate your feedback.
Currently, with sub-50 rigs drilling in ND, less than 70 wells per month can be drilled. As we have seen no proof so far that wells are significantly better than before, I belief it is highly likely that we are on a long-term trend towards a lower production level in ND (I estimate roughly 900 kbo/d based on 65 wells/m), until prices significantly move up again. It’s a slow process that will play out over 2-3 years, although I expect the biggest impact in 2016. This is only based on currently available info, and this outlook should of course be constantly adjusted with the rapidly changing rig count, oil prices, operating conditions, new well performance and lag times.
A potential major factor may still be how fast DUCs will be depleted, but as of yet there are no signs of that having an impact. I guess that sheer momentum will spread most of its impact out over many months.
Enno
Congratulations and best wishes with your new website.
If the annual (eventual) subscription fee is, say, current WTI, I’d sign up. You put in a lot of time with this stuff and I certainly appreciate the effort.
Re the 2016 DUCs … I just double checked Continental’s 2016 capex projections, released the other day, and they plan on Bakken DUCs INCREASING from current 135 to 195 at end of 2016.
Go figger. Oklahoma DOCs, presently 35, are projected to be 50/at year end.
Lottsa variables and rationals (sp?) with this stuff.
dclonghorn
You are justified, I think, to be skeptical of the high EURs.
All these guys seem to post high to very high EUR numbers.
One example, Continental just projected 1.8MMboe EURs for some of their Oklahoma wells. Outside of numerous Appalachian Basin natgas wells, I’d never seen oil-waited wells even remotely expected to produce that high.
Thanks Coffeeguy, you will be most welcome.
Amazing site. I can’t imagine the amounts of data entered to build it. Thanks for allowing access.
You’re welcome dclonghorn.
Enno, Your site is truly amazing. It allows me to do a little fact checking when I see a producer make a claim that seems doubtful. For instance, CLR has just come out with a press release where they have decided to cut their 2016 drilling budget by about two thirds. They imply that they are being conservative and don’t really have to make the cut now because their Bakken EUR’s are around 850,000 boe. Such BOE would also include some gas volumes, but my understanding is its primarily oil. The well quality over the years button shows that 2011 has the best cumulative curve of any year so far, with about 200,000 bbl cumulative average through 5 years with production down to 20, 428 year (56BOPD) in the last 12 months. It obviously not even in the same ballpark as a 850,000 BOE EUR. Thanks again.
Exactly dclonghorn, and thank you. This is exactly how I was hoping the site will be used for.
And I belief it is even worse than is indicated, because:
– in this data the refracked wells are still included
– as Ciaran has shown in his projections, the cash flow is starting to become negative (with oil around $60, and other reasonable assumptions) at about 12 years on production or so, for the average well.
I understand there was some Canadian production that was interrupted by massive forest fires in western Canada during spring 2015. Perhaps that played a role in the Canadian decreases at that time. I believe Cenovus Foster Creek was evacuated, as was probably other area operators like CNRL.
I saw Gail’s chart on her site and qdoubted the numbers there. Perhaps she is including Alaska and Gulf in the column “US Conventional”.
Several years ago, on the Oil Drum some folks were doing very detailed analyses of KSA fields, particularly Ghawar. Is anyone looking at Ghawar these days or was all of that data a one time thing. What was said at the time, and I think is still true, is that if that field ever falters there will be panic everywhere.
Okay, it is not Gail’s chart. The chart was originally created in 2014 by Alliance Bernstein and may not reflect today’s cost as some costs have dropped in the last year. I clearly stated that in the text of my post.
Yes, the chart is wrong. That was my point in posting it. Costs have come down, in some cases rather dramatically. I would estimate at approximately half those reflected in the chart. But that is just a wild ass guess.
You would think that KSA would be concerned about getting every dime out of dwindling Ghawar…only way to do that is to collaborate with Russia and Iraq on cuts. Iran will need time to ramp up and cannot be expected to hold back…but may have a hard time finding money for infrastructure.
KSA looking to do a deal with Russia smells like capitulation.
That chart with Canadian oil sands cost at over $100 is way off.
One of, if not, the biggest players here is Suncor. As of Q3 2015, their operating cost per barrel is $27.
(source:http://www.suncor.com/pdf/2015-Q3_Suncor_QuarterlyReport_English.pdf)
Oil sands operations have been steadily decreasing their costs, and they still have room for further improvements.
But to be fair, the above example is only operating cost and doesn’t look at capital expenditure.
For that let’s look at Fort Hills – this is the major project currently under construction. The capital costs, capacity and project life is all publicly available information via google. I have to estimate some numbers, but I’ll try to error on the conservative side.
Total estimated construction cost: $13.5 billion (wow that’s a lot!)
Daily capacity: 180,000 barrels
Annual capacity: 60 million barrels (these plants run 24/7/365, but I rounded down by 5.7M to account for down time)
Estimated life of the project: 50 years
Total barrels produced over it’s life: ~ 3 Billion
Let’s say that oil stays at $70 for the next 50 years just to keep things really simple.
Let’s also say that their operating cost is $30 per barrel and stays there, although that’s probably a bit high.
That leaves $40 profit on every barrel produced (less any transportation costs, exchange rate, etc.)
3 billion barrels x $40 profit = $120 B profit – $13.5 capex = $106.5 BILLION NET PROFIT on this project.
And remember, this is assuming oil stays at only $70!
Canada is going to be a major player going forward. They have the 3rd largest deposit (the largest of any stable first world democratic country). One of the worlds largest oil companies is very bullish on Canada (http://business.financialpost.com/news/energy/exxon-mobil-corps-defiant-outlook-predicts-canadian-and-venezuelan-oilsands-output-will-quadruple-over-next-24-years?__lsa=47f4-3f1a)
“He said shale companies had put up a much tougher fight than expected and were only now succumbing to the violence of the oil price crash, 15 months after Saudi Arabia and the Gulf states began to flood the global market to flush out rivals.”
With regards to the above, this is BS. Saudi Arabia didn’t flood the market, the US did. Saudi Arabia just maintained production. So many media commentators fail to understand this. Look at the data.
And Saudi net exports (total petroleum liquids + other liquids) fell from 9.5 million bpd in 2005 to 8.4 million bpd in 2014 (EIA data except for 2014 BP consumption data).
Yergin is clearly a shill for shale. He’s smart enough to know when what he is saying is wrong.
Fair enough, but just what is he saying that is wrong? You failed to point that out. Please do.
Ron,
As per Andrews statement and quote of Yergin from above comment.
“Saudi Arabia didn’t flood the market, the US did. Saudi Arabia just maintained production.”
I feel D Yergin wishes to construe the information so as to paint US LTO as a victim of ‘violent’ Saudi market maneuvers. His choice of words is clear. He does not wish to inform. He wishes to unfurl moral exhortations and to sell stories to hopefull investors i.e. The valiant US LTO is under attack from violent Saudis. But not to worry. We shall over come.
As Jeff points out, Saudi exports are decreasing.
He’s a shill. He’s pumping up the investors.That’s my take on him anyway.
For what it’s worth; I think KSA knows they’re peaking. They saw it coming. This price plunge is a psychological operation, so to speak, to strike fear into any future investors who might wish to invest in KSAs competitors.
While it is true that I am a Hard-Crash Peak Oil Doomer I find his 13 million barrels a day decrease from existing production by 2020 a little rich. If KSA, Iraq and a few others (Brazil, Venezuela?) fall off a cliff, and I’m not ruling that out entirely, then yes, perhaps.
Really now? I think you are being overly dramatic. I believe Yergin is just telling it like it is, or like he thinks it is anyway. He may have it wrong but if he does it is just because he is mistaken. I do not attribute any malicious intent in his prognostications.
If you notice the quotation marks in the article you should notice that the 13 million barrel per day decline is not his projection but that of Ambrose Evans-Pritchard. And I think it is spot on. Hell, it could be even more, closer to 15 million barrels per day by the end of 2010 anyway.
Perhaps I am overly dramatic. Yes, I’m certain I am. Yergin just seems suspicious to me. Thanks for clarifying the source of the 13 million prediction.
Minus 15000000 by the end of 2020!
Buckle your chin straps!!
Ron, Jimmy,
I share the suspicions about Yergin as he has a strong agenda to support shale. The big disadvantage of shale is the high decline rate which is at least 5 times higher than conventional and the low economics of scale (production per well) which is 100 times lower than wells in Saudi-Arabia. It is also nonsense to buy assets from shale as the assets (producing wells) of shale companies become close to worthless over a very short time span due to the high decline rate of existing wells. The Quicksilver bankruptcy has shown that investors just got 12 cents on the invested dollar. So, the challenge for shale is to find enough dumb money, which is ready to loose everything all over again. This is the only way how shale can maintain its production level. However, the recent huge collapse of the bond market for shale companies shows that investors are smarter than many believe.
Whether it is malicious or not, Yergin is terrible on shale. The graph is quite right and Yergin is wrong – it is shale’s overproduction (due to capital misallocation by Wall Street thanks to zero interest rates) that has caused the supply overshoot.
Yergin is also wrong about ‘resilience’ – he’s one of the main cheerleaders for the ‘technological innovation’ meme. Never mind that the data shows that they are just accelerating production (and even Harold Hamm has said this recently, though it passed mostly without comment in the media). Never mind that shale cos lost money at $100. Never mind that the reason North Dakota production grew in Oct and Nov 15 was that WLL and CLR opened the chokes on their old wells, proving their desperation for cashflow.
He could just be wrong on this, but the thing that makes me suspect an agenda is that he is one of those people along with Ed Morse of Citi (Citi has some shale bonds on its books) who calls it a ‘swing producer’. I mean, even Wikipedia knows that a swing producer is low cost and produces at will. Art Berman has conclusively refuted this nonsense elsewhere.
This is a guy that won a Pulitzer writing about oil and he apparently doesn’t even know the basic definitions of his trade? Doesn’t seem likely – so adds some weight to the idea he might be purposefully talking it up.
I do find this “Saudi Arabia flooding the market” narrative highly annoying when, according to the graph SA production doesn’t appear to have varied as much as plus or minus a million barrels per day, while the US has increased production almost 6 mbpd and spent a small fortune doing it to boot.
The US has increased oil production by 4.7 mb/d from 2008 average to April 2015.
Saudi Arabia has increased production by 950 kb/d between November 2014 (when OPEC decided not to cut production) and June 2015.
It is clear that LTO was a game-changer for the global oil market, but Saudi Arabian production undoubtedly contributed to the oil glut in 2015.
That said, the US and Saudi production have been on decline since May and July 2015, respectively
Hi AlexS,
If we add US and Canadian production increases from mid 2008 to May 2015 (using centered 12 month averages), it is about a 5.7 Mb/d increase, the World increase in C+C (using EIA data) was about 6 Mb/d, so only 300 kb/d came from the rest of the World. This estimate would be a little different if we used Russian and Canadian data, but I haven’t done that calculation.
Dennis,
From 2005 to 2014, all of the growth in global C+C output came from North American unconventional sources: LTO and oil sands.
Apparently, in 2015 the contribution of conventionals was bigger thanks mainly to additional supply from Iraq and Saudi Arabia and slower growth in LTO and oil sands
Alex – nice chart.
What’s the data source(s)?
sunnnv,
EIA Annual Energy Outlook 2015;
EIA International Energy Statistics;
Canadian Association of Petroleum Producers. Statistical Handbook for Canada’s Upstream Petroleum Industry
I posted this some months ago along with the graph (included below).
I am dying to see how high the oil price rebounds.
The chart is dated November 2014 and is based on data collected several months before that.
Since then, most of those countries have cut their budget spending and some of them have devalued local currencies, which has significantly reduced the oil price needed to balance the budget.
It is clear however that at $30, $40 and $50 all of them run fiscal deficits.
Thanks for the clarification, AlexS. Indeed, it is imagined they have.
My prediction, $65 average price over the next 12 months, doesn’t look like crazy if we look at that chart.
Hi Fernando,
You have made that prediction twice, so I am assuming you are serious.
One big strike against that forecast is I agree (and I usually miss badly on oil price forecasts). For example last year around this time I claimed that oil would be about $75/b or higher by Jan 2016, so I am now being a little more conservative and suggesting $65/b by Dec 2016 ($65/b for the year might be unlikely). The simple scenario below would need oil prices to rise to $96/b for the Dec 2016 average price, just to reach a $63/b 2016 average oil price. So for me $52/b for the 2016 average price and $74/b by December 2016 (average price) seems more reasonable. In the chart below I show the higher ($63/b average 2016 oil price) scenario.
You take ~$30 what it is and ~$100 what it was per barrel and you average those two to get ~$65 what it will be.
Hi Caelan,
Yes that’s right, I just don’t think $100/b in Dec 2016 is very realistic, but I am probably wrong again. Fernando knows the oil industry, I do not.
I am being a little facetious of course, but not too much.
“I am dying to see how high the oil price rebounds.”
Caelan, please don’t…you won’t be able to see…
Joking, of course.
Be well,
Petro
Well then I’ll leave it to you and you can tell me how high it went once you, yourself, cross the threshold.
Anyway, I might still be around for Fernando’s $65/b year-average forecast.
But for some other things, I think hell will have to freeze over first.
There is a ,000 missing on the World Chart
It is missing from all the charts. The data is in thousand barrels per day. I thought that was a given. At any rate I have made that clear in the text of the post.
Typo ? “World C+C production peaked in July at 80,531,000 and by October had dropped 461,000 bpd to 80,070 bpd.”
Hi Robert Wilson,
Thanks, I noticed that as well and have e-mailed Ron, he will correct it when he gets a chance. The 80,070 bpd for World C+C in Oct 2015 clearly is missing three zeroes and should be 80,070,000 bpd.
Here is a link to an indepth analysis of the Venezuelan oil industry.
http://www.eia.gov/beta/international/analysis.cfm?iso=VEN
It will take a while to read it, but worth it.
Transparency International has Venezuela down as the most corrupt country in the western hemisphere, and one of the worst in the world.
I doubt the Maduro regime is going to be able to keep the oil flowing much longer, assuming Maduro and company remain in power.
It is probably not possible to make even a good educated guess as to how long it will be before Venezuela settles down, and capital and people to restore the oil industry begin to flow into the country again, but it seems doubtful to me that Venezuela can even hold production more or less steady much longer. And getting production up again might take years.
That info is a bit outdated in part, some of it is wrong. For example, Total wasn’t forcibly taken over. Total’s Jusepin block was expropriated, because Total didn’t wish to take a 40. % interest in the proposed joint venture, they wanted 49 %. Pdvsa was adamant and simply nationalized.
Total kept the 40 % in the heavy oil block, and is one of the most supine foreign partners.
Look at this blog post about the number of ships coming into Venezuela’s ports
http://devilexcrement.com/2016/01/28/introducing-the-puerto-cabello-non-baltic-index-pcni/
Hess Corp. announced Fourth quarter 2015 production today.
BOEPD increased from 362K in Q4 2014 to 368K in 2015.
HOWEVER.
All of the below are in terms of BOEPD for Q4, 2014 and 2015
Crude oil in 2014 was 241K. In 2015 DROPPED to 233K.
Natural gas liquids was 32K in 2014. INCREASED to 40K in 2015.
Natural gas was 89K in 2014, INCREASED to 95K in 2015
Furthermore, there was a substantial drop in US crude oil production Q3 to Q 4. 152K to 141K. That is a big quarter over quarter drop. Can someone with better math skills than I annualize that one?
I think these numbers should be of particular interest to Jeffrey J. Brown, who is constantly pilloried by the CC crowd, as he has dubbed them.
Further, there are many others here who I am sure will take note of the increasing GOR (Rune, are you still out there?)
I further note that the product mix for Continental Resources was 70% oil 30 gas and NGLs for 2014. It went 65/35 in 2015 and company guidance for 2016 is 60/40.
Will be interesting to see what other companies report in the next 30 or so days.
“The world economy will need seven million more barrels a day by 2020. Natural depletion on existing fields implies a loss of a further 13 million barrels a day by then.”
The current price crisis has just made sure we do not get those extra 20 million barrels in 5 years. The shit is going to hit the fan real soon. We will not make it to 2020 without a global crisis that will make the Great Financial Crisis of 2008 look like a picnic. I just can’t see any way renewable energies can prevent it.
“I just can’t see any way renewable energies can prevent it.”
Nor do I, although I am strongly in favor of building out renewables as fast as we can.
Anybody who owns oil in the ground imo stands an excellent chance of getting a VERY high price for it within a decade, if he can hold on to it that long.
I also favor a serious build up of renewables, but in a non-centralized way. And we should build installations capable of lasting for a very long time with very little maintenance and independently from the grid. People should understand that these are palliative measures, as there is no cure for the energy tsunami that is about to hit us in a short time.
We might see high oil prices temporarily, but as our economy gets destroyed by imbalances, our capacity to pay for goods or resources is going to be seriously compromised.
Couldn’t agree more, sadly.
I agree with you, but I sure wish I had photovoltaics all over my roof when things get ugly.
Unfortunately for me, I get quite a big dose of afternoon shade from a big forested hillside.
Build a Barn or a PV Carport.
If one is sufficiently convinced that collapse is immanent, one strategy might be to sign a PPA with SolarCity or Vivant or similar. Your roof, their panels, add on some storage and a grid cut off. When the global economy collapses, unlikely they will come around to pick up their hardware. Free power!
Doesn’t help with the mountain of shade problem though.
Javier…wow!
…did I read you before more “optimistically” than I should have, or did you recently have an “epiphany”?!
In any event…”welcome” to reality.
Be well,
Petro
Hi Petro,
I have been of this opinion regarding resources for a very long time, but I became conscious about the immediacy of the approaching energy tsunami due to Peak Oil in September 2014, when the oil price crisis started to develop and I saw the painting on the wall. At that time I was walking the Camino de Santiago, 750 km by foot in less than a month on my own. I had plenty of time to think things thoroughly all the way to the damning inevitable conclusion. It was fitting that I ended the trip at the arches of the Portal of Glory of Santiago’s cathedral were the apocalypse and the last judgement are represented.
I am very optimistic about the climate, and deeply concerned about the ecology. We are going to need to rely a lot more on biological resources and they are in quite bad shape.
On the economical and energy issues I find that I agree with you almost completely. I think I am quite misunderstood because I don’t buy the climate scaremongering that has become so popular lately and is a hot political issue that blinds a lot of people into partisan postures at both sides, suspending their critical reasoning.
I look forward to your posts, specially when they are not too cryptic 😉
I’d appreciate it more if you could elaborate on your theory Javier. What approaching tsunami? Do you mean surplus energy or a restriction of energy?
Hi Dave,
My view is that Peak Oil has taken place in 2015 and future production is going to be seriously compromised by current oil price crisis. A new global recession within the next 5 years (probably as early as this year) is going to worsen the situation. As a result a feedback will be stablished that will contract the economy and reduce its energy needs, while creating an affordability problem. Our oil usage will decrease, our electricity usage will decrease, the energy transition to renewables will not proceed adequately, and our civilization will start a simplification process that will be extremely painful. The cheap plentiful oil that we are currently enjoying is equivalent to the sea retreating before a tsunami. It makes people feel safer and advance in the sea while they should be running to a more elevated position.
Well said Javier, and I fully concur.
“will start a simplification process that will be extremely painful.”
10 words that say 7 billion things.
Hi Javier,
Electricity consumption may decrease, due to slower growth and/or greater efficiency, but lower oil supply won’t have that much of an effect because very little electricity is produced with oil.
Oil output will not decrease so quickly that maintenance of the electric power system cannot be continued, the lower oil supply will mostly reduce the oil used for personal transportation, eventually the oil market will adjust so that the oil price reflects the marginal cost of production at whatever level World demand for oil settles at where the supply matches demand.
Whether natural gas and coal can provide enough electricity to power society is unknown. Society may well simplify rapidly , or the demographic transition will allow a slower transition to a simpler lifestyle.
Hi Dennis,
I see you still don’t get Peak Oil, Dennis. It is not only less oil that we get. The entire economy goes into contraction, so it uses less energy, it needs less energy, and that includes less electricity. Obviously this has all type of nasty side effects. This also means no new renewables, something that almost nobody is capable of seeing despite it is taking place just in front of everybody’s eyes.
Spain is not the World.
Spain is above the average of the world and had the protection of being inside the EU.
The world is going to do worse, not better, when the time to reduce its global primary energy consumption arrives.
Hi Javier,
The reason for the decline in primary energy consumption is the decline of Spain’s economy.
For the World, there has been no problem up to 2014, based on data from the Statistical Review of World Energy.
Exactly. Peak Oil is manifested through economic decline. Now you are starting to get it.
Hi Javier,
First not all energy is in the form of oil, so if you mean peak energy, that is not yet upon us.
And you have cause and effect reversed, economic decline is the cause, less energy use the effect. If Spain had the ability to control its own economic policy like the UK, Switzerland, and Norway, it would not have taken so long to recover from the GFC.
Joining the Eurozone was only a good idea when economic times were good.
Hi Javier,
Part of the reason for declining Primary Energy use is declining real GDP, but there has also been a decrease in energy intensity (energy per unit real GDP) especially since 2004. See 2 charts below.
Spain’s Energy intensity has decreased by 17% from 2004 to 2014. Energy is being used more efficiently so that more is being produced with each unit of energy. Energy intensity is MJ of primary energy per GDP in constant 2000 Euros.
Andrew Bacevich: Six National Security Questions Hillary, Donald, Ted, Marco, etc., Don’t Want to Answer and Won’t Even Be Asks
http://www.tomdispatch.com/blog/176095/
== quote ==
Energy Security: Given the availability of abundant oil and natural gas reserves in the Western Hemisphere and the potential future abundance of alternative energy systems, why should the Persian Gulf continue to qualify as a vital U.S. national security interest?
Back in 1980, two factors prompted President Jimmy Carter to announce that the United States viewed the Persian Gulf as worth fighting for. The first was a growing U.S. dependence on foreign oil and a belief that American consumers were guzzling gas at a rate that would rapidly deplete domestic reserves. The second was a concern that, having just invaded Afghanistan, the Soviet Union might next have an appetite for going after those giant gas stations in the Gulf, Iran, or even Saudi Arabia.
Today we know that the Western Hemisphere contains more than ample supplies of oil and natural gas to sustain the American way of life (while also heating up the planet). As for the Soviet Union, it no longer exists — a decade spent chewing on Afghanistan having produced a fatal case of indigestion.
No doubt ensuring U.S. energy security should remain a major priority. Yet in that regard, protecting Canada, Mexico, and Venezuela is far more relevant to the nation’s well-being than protecting Saudi Arabia, Kuwait, and Iraq, while being far easier and cheaper to accomplish. So who will be the first presidential candidate to call for abrogating the Carter Doctrine?
Show of hands, please?
Why bother? US Middle East foreign policy is being scripted by the Israel Lobby. The USA is on its way to being a quasi colony.
Funny (but not too bright)
Drilling forecast chopped for 2016 under ‘lower for longer’ price scenario
The report comes at what would normally be the busiest time of the year in the Canadian oilpatch as frozen ground allows heavy equipment access into swampy backcountry leases. However, after an extended break for rig crews at Christmastime and a less than robust winter ramp-up, the rig count has actually been declining.
Hi Ron,
“I am of the firm opinion that the vast majority of oil production prognosticators are under estimating the effect of natural depletion of existing fields. Even countries that are increasing production, or are on a production plateau, like Saudi Arabia, Iraq, the UAE, Iran, Russia and others, all have serious depletion problems. Failing to account for this decline when you make your prediction will likely cause a serious error.”
This is a very important point. Thank you !
Even assuming 5% decline on average that’s additional 5Mb/d that somehow need to be found and then extracted to keep world oil production flat (other things equal). And “oil glut” adherents are salivating non-stop about possible injection of 0.3 Mb/d from Iran in mid 2016. We are probably slowly approaching a very interesting times, when “peak oil” will show its ugly face again and this time without any compensating factors like the US shale boom.
But there is an additional important factor: now after learning the current lesson all oil producing counties will double or triple efforts to create own refineries and chemical plans that use oil as an input. That will eventually take some oil from world market. http://abarrelfull.wikidot.com/refinery-projects-to-be-completed-in-2016
– Saudis are already doing that (http://www.wsj.com/articles/new-mideast-oil-refineries-could-stir-up-fuel-market-dynamics-1423431483 )
– Iran probably will be next to Saudis in the level of investments in refining facilities. Talks have been held so far with Japanese and Korean firms to invest in Iran’s renovation and improvement of oil processing facilities. Isfahan and Bandar Abbas refineries will get $1.2 billion each to upgrade and enhance products.
Managing director of National Iranian Oil Refining and Distribution Co. (NIORDC), stated that despite the declining oil price, the construction of oil and condensate refineries in Iran will not come to a halt … (http://www.iranoilgas.com/news/details?id=15328&title=Iran+will+not+halt+building+refineries+). Iran & Spain also plan joint oil refinery at Gibraltar (http://theiranproject.com/blog/2016/01/19/iran-spain-plan-joint-oil-refinery-at-gibraltar/ )
In Russia Bashneft plans to launch sulfur production line at the Ufa Oil Refinery by 2017. Volgograd Oil Refinery, one of the four major refineries operated by LUKOIL, is undergoing expansion and upgrades to increase its production capacity, while meeting the Russian Government’s recently tightened fuel specifications. Russia Rosneft also plans to increase refining capacity soon. Russia will also built build the first oil refinery in Uganda https://www.rt.com/business/233159-russia-uganda-oil-tender/. Russia is dependent on the West for catalysts, refining equipment and gas turbine parts, meaning refinery modernization needs the access to Western expertise.
– Iraq set a goal of increasing refining capacity to 1.5 million bbl/d. Iraq has plans for four new refineries as well as plans for expanding the existing Daura and Basrah refineries (EIA, http://www.eia.gov/beta/international/analysis.cfm?iso=IRQ)
If we assume about 80 Mb/d for output then 5% decline would be about 4 Mb/d each year.
There will be some continued investment in drilling new wells, an assumption of zero investment in the oil industry is not a good one, so realistically decline might be 2 Mb/d. There are also long term projects that already have huge sunk costs which will go forward even at low oil prices, so decline in 2016 is more likely to be 1 Mb/d than 2 Mb/d. When oil supply becomes short, oil investment will gradually ramp back up and stem any further decline and may eventually increase output by 1 to 3 Mb/d above 2015 average oil output levels.
Three different scenarios are presented below, based on a URR of 3400 Gb (production through 2300) with cumulative output of 2900 Gb by 2100. Note that through Dec 2015, estimated C+C cumulative output is about 1280 Gb, clearly beyond 2015 we do not know future output as it will depend on the world economy and oil prices in the future which are unknown. The low and medium scenarios are consistent with a 2015 peak in oil output and the low scenario has annual decline rates of less than 2% per year through 2100. The high scenario peaks in 2023 at 83 Mb/d and the peak annual decline rate is 2.02% in 2090 and falls to 2% in 2100 and 1.67% in 2150.
Dennis,
“There will be some continued investment in drilling new wells, an assumption of zero investment in the oil industry is not a good one, so realistically decline might be 2 Mb/d. There are also long term projects that already have huge sunk costs which will go forward even at low oil prices, so decline in 2016 is more likely to be 1 Mb/d than 2 Mb/d.”
I agree. Actually the decline of production might be even smaller due to “Great Condensate Con” (GCC). But my point is that the reduction of capex now create qualitatively new environment: “un-creative destruction” environment for “raw” oil exports so to speak.
With money becoming tight for oil industry (at current oil price level) and redirection of capex on creation of new refineries and chemical plants as well as increased domestic consumption in Asia, I think that the decline in oil exports (not production, but exports) in 2016 will be larger then the decline in oil production and larger then EIA forecast. That’s about it, as for my forecasting capabilities 😉
In view of this effect there a secondary phenomena that can happen: rumpling up investment in case oil prices became “more normal” might well occur with the usual lag of around 18 months and exports remain declining for a longer period then production, while the demand for transportation and internal consumption by chemical industries in oil producing countries and Asia stimulated by low oil prices will continue to increase continually.
So with an appropriate trigger event during the those hypothetical 18 months there can be an oil price spike. Quite violent price spike because the system a whole (aka neoliberal economy) is not stable and move of oil prices up might well be amplified by Wall Street in the same manner as the current move down.
In other words, certain preconditions now were created for an oil price spike far above usual “fair” $70-$80 level and may be for setting a new record. Whether it materialize remains to be seen.
The GCC is a nothing burger like the ELM.
I am not convinced that the oil exporters will increase their consumption a lot as their economies will be hurt by lower oil prices, less GDP growth will result in less oil consumption growth. So the decline in net exports will not change markedly from what it has been since 2005, with the possible exception of Canada and Norway, but this might be offset by increases by Iran and Iraq.
I wouldn’t count on a new build refinery in Gibraltar. That’s Spanish territory stolen by imperialist englishmen. The long term plan is to have two million Limeys move to Andalucia and use them as hostages to help the Gibraltar takeover. Once Gibraltar is dealt with we can expand its territory by adding 200 km2 and converting it into Western Hong Kong. ?
Funny (but not too bright)
Shallow sand,
Looks like about a 28% annualized decline for HES U.S. oil production. Applied to the entire U.S. that will put us under 7 million by next january. Wow!! And HES just reduced capex another 25% I believe.
Kellyb,
I share your view about a decline of shale production. As the year over year growth rate has been an excellent forecaster for the production increase in Texas, it predicts now a massive decline over the next months (see below chart). The recent collapse of the bond market for shale companies certainly will accelerate this trend.
Hi Heinrich,
Dean’s estimates for Texas output are much better than the RRC estimates for the most recent 18 months, the right had side of your chart (after May 2014) should be ignored.
Dennis,
Only time will tell what will be happening over the next months. We are all human beings (including yours truly) and nobody can ignore something in advance. A significant reduction of US supply is necessary for a turnaround in the oil price. Any resistance towards a supply reduction will just increase the pain and damage to producers and the US economy.
Hi Heinrich,
I agree, US output needs to fall.
I also agree it will fall, but not quite as quickly as implied by the Texas RRC chart (the incomplete data gives an inaccurate picture). US output might fall as much as 2 Mb/d from the April 2015 peak, hopefully that will be enough to bring the market back into balance (along with decline in Canada).
I also agree the future is hard to predict, but so far your oil price predictions have been much better than mine. What do you think of recent EIA price predictions (in the Jan 2016 STEO)? Too high, too low, or just right?
Dennis,
EIA oil price predictions have been and are too linear. The oil price will be in my opinion much more volatile than predicted in the STEO2016. Depending on the consequences of the recent bond market crash, it is important to observe the reaction of the companies. BHP has for instance canceled any rig in Fayetteville and Haynesville. I guess the production cuts are coming now very quickly. As soon as the year over year decline (in my above chart) turns around, prices will go up again. I expect huge swings in the oil price as the leverage in the oil market is now enormous (very low net exports are now available). The next price rise could be ferocious and could go up in a very short time period. The oil bull is just eliminating the weak hands until the run starts again. It is a much better strategy to get out of the way now and start investing again later.
Heinrich,
Very interesting. Thank you !
I came to similar conclusions. See http://peakoilbarrel.com/is-non-opec-beginning-serious-decline/#comment-557682
likbez,
What is in my view important is that the time of a stable long term price band width as we have seen it over decades, is over. There is simply too much leverage in the system – on the downside as well as the upside. As consumption of oil influences very much global current account balances – and thus changes capital flows and currencies in a huge way – the system is unstable. The shale boom stabilized somewhat currencies, yet created a massive imbalance in the bond market. So oil will go down as long as something breaks (in this case it is in my view the US high yield bond market) and then it will go up in the other direction again. So, no – we will not get a stable ‘fair price’ of oil of around 60 USD/barrel for a long time. As soon as the market turns around we will shoot up way above 60 USD/barrel. Shale changed the oil market for sure, but it created also volatility.
Increased volatility in price is surely coming; as unsustainable lows [for producers] reduce forward supply and push up price only to hit a weak demand response. Sure we’ve seen some steady demand return in US and continue in China, but given the price signal that looks fairly muted, and will prove, under price stress, to be weak. So I suggest that recent marginal consumption rise will be able to be shed fairly quickly in times of higher price.
Marginal demand in mature economies [and China is maturing fast] looks to be ‘induced’ by supply availability at a lower price; if we are around peak supply, we are clearly around peak demand too. The recent bounce in US consumption [or ‘demand’ if you must] followed lower price, so it isn’t some quantity without which western civilisation will fall. Please note I am talking about recent increases in consumption, not the bulk 90%.
All price action indeed takes place at the margins; of supply and consumption.
Gonna be messy, with many competing theories in MSM. And price volatility is a difficult environment for attracting investment.
Hi PatrickR,
At some point OPEC will realize that the price volatility does not serve them well. Hopefully high cost producers will be cautious about thinking that OPEC will bail them out if they overproduce in the future and a little more discipline will be shown in the oil industry. Lenders might also be a little less willing to lend in the future after they have lost their shirts.
I agree however that volatility is the most likely scenario with oil swinging from $50 to $150 and back in annual cycles(or less), not a great investment climate (as the cycles will be highly irregular).
Hi Kellyb,
The decline rate is steep at first and then moderates, there are a lot of DUCs that are still waiting on completion so a 500 to 700 kb decline over the next 12 months is about all we will see, even if the average oil price remains between $40 and $50 per barrel for 2016 (average price for the year).
If we see the annual decline you suggest, oil prices will not remain under $50/b for the year and the higher oil prices may slow the decline rate as investment will increase at higher oil prices.
I have a couple of questions for any of you’ll oil men:
1. What happens when all these shale wells drilled over the last 6 years decline down to stripper well status? Are they more likely to get sold or recompleted? Do any of you’ll own shale stripper wells?
2. Is the gas decline in a shale well proportional to the oil decline? Say you have a shale well that on IP produced 65% oil and 35% gas. Seven to 10 years later when that well is down to stripper well status will the gas output still be the same proportion or do the oil and gas decline at different rates?
Great Question. Well or deposit a Red Head, Blond or Brunette?
Your second question makes no sense. 65% and 35% proportion of what? Boe?
If you go back to previous Bakken Ronposts, the comments usually have some oil and water production analysis, but not much gas numbers. By the way, the oil/water ratio is a better question, since water disposal expense can define shutdown date.
To clarify let’s say when new the well produces 100 BOE per day 65 bbl oil and 35 boe gas. 65/35. Does the ratio stay relatively steady over the life of the well or does gas decline at a different rate?
Don’t think anyone is focused on it, mostly because until recently the gas was often flared rather than captured.
The contrasting scenario would be the gas well funded by NGL production from it. NGL funds the operation and it will shut down when the NGL revenue can’t fund extraction of the gas.
The gas to oil ratio increases over time (because the crude “boils” in the reservoir and that gas moves better than a de gassed crude). The ability to produce the well will depend on the completion tubulars and other equipment, the reservoir, and prices. I bet they’ll be shut in to repressurize and then get produced 3-4 days a month.
Natural re-pressure recovery or from Pumps ?
so much for if you build it, they will ride….
“For almost a decade, transit ridership has declined across Southern California despite enormous and costly efforts by top transportation officials to entice people out of their cars and onto buses and trains.
The Los Angeles County Metropolitan Transportation Authority, the region’s largest carrier, lost more than 10% of its boardings from 2006 to 2015, a decline that appears to be accelerating. Despite a $9-billion investment in new light rail and subway lines, Metro now has fewer boardings than it did three decades ago, when buses were the county’s only transit option.
Most other agencies fare no better. In Orange County, bus ridership plummeted 30% in the last seven years, while some smaller bus operators across the region have experienced declines approaching 25%. In the last two years alone, a Metro study found that 16 transit providers in Los Angeles County saw average quarterly declines of 4% to 5%.”
http://www.latimes.com/local/california/la-me-ridership-slump-20160127-story.html
To be fair, why would people ride PT when:
– Gas is cheap.
– Negative social stigma and cultural conditioning against PT.
– Advertising and infrastructure encouraging mass car use.
Now if oil prices increased and gas became expensive… Remember, people are inherently lazy so you’d have to make catching a bus easier than driving to work to see a significant shift. In the current price environment the motivation to change is not there. It will happen eventually though when necessity starts to dictate it for more and more people.
The worse times get, the more society goes downhill, the greater the incentive for ( excuse my elitist language and attitude ) respectable people to avoid mass transit.
I am very much a large, somewhat menacing looking white guy, occasionally mistaken for an undercover cop, or out of uniform cop, in times gone by, and it never bothered me much to ride a bus, once in a while, with the riff raff.
But my ( second) wife would rather have walked to work than ride the bus- and she was and remains a life long card carrying liberal democrat, although she is no longer my wife.
Mass transit can help a hell of a lot, and I am in favor of building it, but it is not going to solve our social troubles. The ONLY WAY people such as the members of this forum will live in an urban environment is if it is a wealthy enough environment to keep the REAL lower class out.
I attribute fifty percent of STARBUCKS success to the fact that the riff raff can’t afford to buy anything at Starbuck’s prices, and thus don’t stop in.
Incidentally I KNOW about riff raff due to living in close proximity and am occasionally mistaken for riff raff myself since I am apt to go to town wearing throw away clothes ( saved for one time wear doing a nasty job ) and do not hesitate to use the motherxxxxxx word freely when I run into one of my many acquaintances among the real riff raff. Otoh, I have also been mistaken for a minister when visiting sick friends at a hospital. LOL
Mass transit will be widely adopted in this country only at such a time as it is forced on us by the steel toed boot of necessity in our collective backside.
In the city of Richmond, a small house a long way from a bus line is apt to sell for MORE than one ON a bus line, everything else comparable.
I leave it as homework for the reader to come up with the explanation.
There are extraordinarily powerful forces at work that will in my opinion drive the decentralization of business of all sorts away from downtown environments, and out where businesses and residences are in better geographic balance. A lot of former business space is apt to be converted to residential space, thus solving the transportation problem nicely for a person who lives up,and works down, in a city center.
Autonomous electric cars and wind and solar electricity , backed up with gas, will enable the ones of us who have decent incomes, to continue to commute either alone or with a couple of compatible fellow citizens.
Buses suck. Rail, is amazing and no, it isn’t just “riffraff” who find light rail appealing. Rail is also electric. And fast. And punctual. Ever been to NY? Chicago? Tell me only riffraff rides the El to Wrigley. It is a pretty interesting story how General Motors and the IC industry collectively conspired to choke commuter rail in thirties and forties and replace it with buses in this country. A story that was actually proven in court and resulted in damages but of course it was too late to affect the outcome. The problem as you point out, is buses, not public transport.
Two Starbucks that I know of have suddenly closed down and I’m betting it won’t be long before a third one in mind, essentially in the middle of a parking lot, follows suit.
Their prices are so ridiculous– especially if you remove their drinks’ stabilizers, syrups and ices (not much left of the drink)– that their model seems to depend on the frivolity that surrounds the ‘Oil Party’ that will never come again.
People in the future will wonder and wonder about this time, about how strange, dreamlike, contradictory and bizarre it seemed, yet that many of the time took for granted, for normal; such as grabbing overpriced fluid concoctions for the privilege of hanging out in a seating arrangement or patio overlooking living-rooms-on-wheels and strips and acres asphalt.
Meanwhile, ” ‘Zombie Ships’ – Why Global Shipping Is Even Worse Than The Baltic Dry Suggests”
“What was life really like back then, Great-Grandpa? …Why, at the edges of towns and cities, are there all those strange large-and-boxy empty buildings surrounded by some kind of thin tar-and-stone amalgam surface? Were these artifacts of some sort of religious importance?”
Apparently investing large amounts of money into public transport and then doing major service cuts is a great method to reduce ridership. If the service will not take a person to the place they need to go, when they need to go and at a reasonable price, the person will find alternative methods or just move away.
The major problem with buses is they deal with the same traffic problem as cars, so ridesharing and car ownership is a no brainer if the service becomes problematic. Trains have the problem of only going to certain places and then the buses must take over from there. If bus schedules are reduced, the chain is broken.
I used buses and trains quite often many years ago, but usually only when time was not a factor and walking up to two miles to get home was not a problem. The promised commuter line near me was supposed to be built 10 years ago, but only about 2 miles of track were laid and they are not in use. When one state had the money, the other state didn’t. Now the other state says it has the money but the first state railroad is not interested anymore since it is involved in huge costly projects in a very dense population region.
The economics and efficiency of passenger rail is poor outside of densely populated areas, meaning there is little real incentive to implement major projects in those areas. Improving the car will have to do for now in most areas of the US.
China consumption:
Diesel down 3%. Gasoline up 7%. 2015 numbers. Overall crude numbers not out yet. Will likely be north of 10.5 mbpd. Relentless 2-3%.
“Officials from the International Monetary Fund and the World Bank are heading to Azerbaijan to discuss a possible $4bn emergency loan package in what risks becoming the first of a series of bailouts stemming from the tumbling oil price. The fund and the bank have also been monitoring developments in other oil-producing countries”
http://www.ft.com/cms/s/0/9759f42a-c51b-11e5-b3b1-7b2481276e45.html#axzz3yWDvV55d
Thank you Ron for this prompt digest of the EIA data – which I regard as the most reliable petroleum database these days.
Regarding the supply curve from Alliance Bernstein, it clearly states those are marginal prices, not average prices. Nor would it be correct to present a supply curve based on average prices. Considering other marginal cost estimates around, this supply curve should not be that far off. The suspicious aspect about it is the implied excess capacity at 7 Mb/d. The “other” slot in particular is fatter than it actually is.
Cheers.
Hi Luis (sorry I don’t know how to do the accent),
Are you Luis de Sousa of Oil Drum fame?
In any case thanks for your perspective, I agree the marginal costs are what is important and will be very different from average costs.
Many people for get this very basic economic concept that prices in the long run are determined by marginal cost.
I do not know if the chart represents marginal costs today, they have fallen by some degree due to the current oil bust, I don’t know how much they have fallen.
I believe Shallow sand has suggested about a 10% or so decrease of total OPEX since the drilling frenzy in the US, but I may not be remembering correctly.
Hi Luis,
I clicked on the link, great to see you here!
Cool. TOD revisited 🙂
Hi there, yes it is the same character, just a few years older. I read almost everything Ron puts out, but I rarely muster the time to reply.
Marginal costs do not change with market price (equilibrium). I have no idea why some folk claim so, it is one more of those things that is postulated without any proof. They do change if investment or running costs change, but in the case of these “shale” resources so far the impact has not been relevant, as far as I know.
Cheers.
Hi Luis,
Thanks for the reply.
I believe when people suggest that costs have decreased, they mean that the lower oil prices result in less demand for drilling services so that rig rates and the cost of other services may fall as the drilling frenzy wanes.
Shallow sand has mentioned that some costs for his operations have fallen (but I think this might only be around 10%). He has mentioned some numbers but I can’t recall exactly.
Everyone should check out Luis de Sousa’s blog
http://attheedgeoftime.blogspot.com/
He has many interests, but for those focused on Energy the Energy section is well worth a visit imo.
https://www.rt.com/business/330414-saudi-arabia-oil-prices/
My humble offering. Saudi looking to cut production (atleast according to this article).
https://www.rt.com/business/328895-transneft-russia-oil-exports/
Russia looking to cut exports ( I assume this is voluntary).
In North Dakota, abandoned wells not plugged and the landscape not restored, equipment remaining at the site, not producing paying production, the well is forfeited to the state. No longer property of the producer, there it was gone. The State of North Dakota has rules, you must abide by them or lose your assets.
Drilling is probably going to go to zero as soon as all leases expire. Just a hunch, nothing else.
2017 is the best guess when it will all come to a screeching halt.
http://seekingalpha.com/instablog/35944485-dginnd/3835536-north-dakota-abandoned-well-law-bakken-fracklog-killer
Page 12: N.D.C.C. 38-08-04.1L – The placing of wells in abandoned-well status which have not produced oil or natural gas in paying quantities for one year. A well in abandoned-well status must be promptly returned to production in paying quantities, approved by the commission for temporarily abandoned status, or plugged and reclaimed within six months. If none of the three preceding conditions are met, the industrial commission may require the well to be placed immediately on a single-well bond in an amount equal to the cost of plugging the well and reclaiming the well site. In setting the bond amount, the commission shall use information from recent plugging and reclamation operations. After a well has been in abandoned-well status for one year, the well’s equipment, all well-related equipment at the well site, and salable oil at the well site are subject to forfeiture by the commission. If the commission exercises this authority, section 38-08-04.9 applies. After a well has been in abandoned-well status for one year, the single-well bond referred to above, or any other bond covering the well if the single-well bond has not been obtained, is subject to forfeiture by the commission.
http://seekingalpha.com/instablog/35944485-dginnd/3835536-north-dakota-abandoned-well-law-bakken-fracklog-killer
2017 is the best guess when it will all come to a screeching halt.
Not likely. Prices are already starting to rise and by 2017 they will likely be high enough for activity to continue. I would not venture a guess as to what that price may be however, or just how much activity will continue.
As I previously noted, the 2008 oil price decline was, compared to this one, a micro-decline. If we define the price slump as the number of months since an average monthly price of $100–before seeing a sustained price increase–prices only fell for four months in 2008, before starting a sustained price increase (monthly Brent prices).
Based on same metric, we are at 17 months and counting.
Note that it took about two years for the US total rig count to return to prior levels, after the “V” shaped 2008 oil price decline (even with the benefit of very easy financing).
And as I have also previously noted, I suspect that the US needs to put on line around 1.5 million bpd of new C+C production and around 17 BCF/day of new dry gas production this year, just to offset declines from existing wells, with a total rig count that is currently in the low 600’s versus 1,700 to 2,000 in recent years.
I believe the price of oil will be up substantially within a year, and back up towards a hundred within a couple of years, max, unless Old Man Business As Usual has to give up his cane for a wheelchair.
In the meantime, we are in a very real race between depletion of fossil fuels, and the scaling up of the renewables industries and improving energy efficiency.We are getting four and a half percent of our electricity in the USA from wind now, and will imo be getting ten percent within another six or seven years. Wind is going to look damned good to utilities located where they can hook up without too much expense when the price of gas skyrockets due to depletion and lack of upstream investment.
Our hands on guys need not worry about wind and solar cutting into their markets very much, not for the rest of their own working careers at least. Depletion will keep them busy, if they can find new spots to drill.
The folks who say renewables won’t work because the grid can’t be adapted to high penetrations of wind and solar power haven’t had much to say lately about the fact that the Texas grid has been over forty percent wind, and close to half wind,on many occasions recently , without “generating” any headlines about the grid failing due to the wind power.
And solar is coming on strong too. We may never succeed in transitioning successfully to a renewables based economy, but it is now obvious to me at least that renewables at the very least have the potential to stretch out our depleting supplies of fossil fuel sufficiently to allow at least another decade or two of business as usual, in respect to oil and gas.
http://www.startribune.com/wind-power-industry-surges-and-expects-steady-growth/366788331/
You cannot make this up.
I was listening on XM radio to CNBC’s “Fast Money” panel show (on daily from 4 pm to 5 pm central time). The last 10 minutes, they had on a chartist, praised highly by the panel as being one of the most knowledgeable in the world. He had charts (I could not see) going back to the 1980’s that he described as showing that the current price of oil was back to where it was then in relationship to the S&P 500 – where it should be as far as he was concerned. So, he said if oil rose from here, he would be looking to short it. The panel all agreed how good his analysis was, and one guy stated: “Oil will never, ever, ever, ever go over $50.” Yes, 3 evers, and then said it was because oil companies had gotten so efficient and cut their costs so much.
I guess that I will not laugh, since these guys are all above any pay grade that I achieved. But, I can sure say that I believe that they are going to be totally wrong, and find that out sooner rather than later.
I think that those shale drillers did a hell of a good job selling their “story.”
The S&P changes its constituent parts frequently. Can’t make any sense comparing oil’s price (in Fed whimsically created dollars) to a parameter as or more meaningless.
So Chevron and Hess having massive Q4 losses on E & P is an anomaly?
How hard would it be for these pundits to read company earnings releases?
Shallow sand,
We will know more results in the next 2-3 weeks, but it is already clear that 4Q15 was the worst quarter in many years not only for the E&Ps, but for the oil majors as well. There was a sharp decline in underlying upstream earnings exacerbated by significant writedowns. The refining and marketing didn’t help much.
1Q16 will be even worse. They are sharply cutting capex plans.
From WSJ:
“Analysts estimate that combined [fourth-quarter] profits at the four biggest publicly traded Western oil companies (Exxon, Chevron, BP, RD Shell) will be about $22 billion, the weakest results since 1998, according to S&P Capital IQ.”
http://www.wsj.com/articles/oil-slump-sets-scene-for-mergers-1454019289?tesla=y
a chart from WSJ
I do think it is important to point out that Gail does touch on the fact that break-even isn’t so much the issue.
Virtually every facet of the economy was built on, and relies on the surplus generated by cheap almost free FFs. Surplus revenue AND surplus energy
High price removes surplus – low price also removes surplus. Pee Coil!
Virtually every corner of the world economy is attempting to refute that physical fact by conjuring up faux surplus through money creation with the belief that that will overcome any constraints but it isn’t working. It only creates further overshoot.
Oil production prognosticators and many on this forum act as if this is a non issue and only price determines everything. Gails analysis is very important imo.
This concept also explains why “renewables” are not a solution.
This concept also explains why “renewables” are not a solution.
If by that you mean, that renewables can not sustain a BAU economy then I agree! On the other hand renewables are the only option going forward on which to build a completely new system. Hint the current world population of 7.3+ billion is not going to grow to 9 or 10 billion as is often suggested by imbecils in the MSM, it is going to be reduced in a major way. So for whatever portion of humanity makes it through the coming bottleneck, renewables are: THE ONLY SOLUTION!
Hi Jef,
The decision to produce or consume oil, natural gas, or coal is not decided based on EROEI, which is not very well measured, and estimates of EROEI vary a lot.
The EROEI concept applies to the economy as a whole for all energy resources. As long as the net energy of all energy used by the economic system is adequate to keep the system functioning then various types of energy will be produced as long as it can be done profitably (in money terms).
As net energy becomes scarce, energy in general will become more expensive and those types of energy with higher EROEI will become cheaper than low EROEI types of energy and society will move towards those types of energy.
In addition as energy becomes more expensive it will be used more efficiently.
The transition will be difficult, maybe not possible, but we will do the best we can.
On your “low price removes surplus”, not really.
Low prices removes the highest cost energy, which has the lowest surplus energy, so very little surplus energy is removed by low prices.
If we look at the average amount of surplus energy per unit energy in the energy produced when energy prices are low, we would find that the surplus energy per unit energy produced had increased as the high cost (low surplus energy) production was shut down due to low energy prices.
Coyne – You are sounding more and more like a computer generated entity. Your response is no response at all. You dismiss all of what I said with a wave of your mouse.
I said energy AND revenue… you can’t make a coherent argument by just considering one and then make another argument considering the other. Also trying to dismiss EROEI by stating that it is “not very well measured” is getting very old and is specious at best, EROEI does matter no matter what you say.
“As long as the net energy of all energy used by the economic system is adequate to keep the system functioning”.
Well how well is the global economic system functioning? My Point AGAIN is it is obviously not functioning and to any degree that it is not out right collapsing is purely a function of financial/monetary policy and intervention which AGAIN is not news to anyone with a brain but has nothing to do with physical reality.
Hi Jef,
I thoroughly disagree. You sound a lot more like a man who has made his mind up,for good, and is unwilling to consider that he might not be in sole possession of the truth, the whole truth, and nothing but the truth, than Dennis Coyne.
EROEI is indeed not well measured, and estimates DO vary all over the place, especially when renewables are concerned.
I am not in the energy business, but for sure low prices tend to remove any excess production from any commodity market.
No doubt the world wide economy would be functioning BETTER if energy were cheaper, but there are MANY reasons it is not functioning too well these days, and there is no reason in particular, that I have seen that is clearly elucidated, to think THE KEY to current economic problems is the cost of energy.
I do agree that the cost of energy, and EROEI is A key to understanding economic issues and problems.
At one time, a few years back, I was sure the world would go to hell in a hand basket rather suddenly, with little warning, as the result of running short of various depleting natural resources, and still believe this MIGHT happen.
But while the fossil fuel age is going to be over in an eyeblink, in terms of history, it is still going to last out the next couple of generations of men, at the very least.
The amount of adaptation men are capable of in just ONE generation is almost beyond belief, when necessity puts the steel toed boot to the collective backside of a society.
EROEI is definitely important, but it is not a limit we are bumping up against, yet. Oil is still a bargain, in terms of the utility of it. The tar sands industry can BURN IT’S OWN feedstock, if necessary, and still deliver millions of barrels a day to market, at a good profit, when oil goes back up to seventy or eighty bucks.
Renewable wind and solar power may actually scale up to the point that ENERGY IN hardly matters at all, because the “IN “will be free and non depleting.
I usually find it necessary to open a couple of windows in our sun room on sunny winter days even when it is only around freezing outside, or else it gets uncomfortably hot.
It’s FREE energy, you see, and it costs NOTHING to waste it.;-)
As oil and gas prices double, we will eventually adapt and use oil and gas twice as efficiently, unless something upsets the Business As Usual apple cart before we have time enough to adapt. Dennis sees it, I see it, and just about anybody with an open mind sees it. Of course at some point, we will have to not only use energy more efficiently, we are simply going to have to use a LOT less all the way around, unless we hit the renewables jackpot………….
If I were young, I would be installing solar panels, and buying a used Volt or Leaf, and damned near free myself of the necessity of buying gasoline for personal purposes. I have already fixed up the old farmhouse to get by with a quarter of the energy we used to use to heat it, maybe less.
I don’t think we need to measure EROEI, because I am of the opinion that EROEI is reflected quite well in the cost of production. For example Canadian synthoil has a very low EROEI, and that is reflected in its high input costs that give it a high break-even cost.
Similarly renewables that require heavy subsidizing to be installed are reflecting between other things a low EROEI.
So if we assume that true cost of production is a good proxy for EROEI the matter simplifies itself quite a lot. The true cost of production is a lot easier to calculate.
Well said,Javier
You expressed my thoughts about money and EROEI better than I did.
The only real hole in the argument of using money cost as a proxy is that sometimes one form of fossil fuel energy is a LOT cheaper than another, for instance the energy in natural gas sells for a lot less than the energy in oil.
This is because gas is not as useful as oil, for running cars and trucks, etc, but still relevant.
A product made using a lot of gas can sell cheaply enough that a lot of gas gets used up for trivial purposes, and gas gets burnt here in the USA, wasting most of it, heating poorly insulated houses and businesses.
Hi Old Farmer Mac,
Javier’s observation might still be correct.
The natural gas may be cheaper because there is more of an energy surplus, or it may be that much of the natural gas is a byproduct of oil production (the associated gas) and that even natural gas wells have some liquids production that makes them more profitable so it may be less straightforward than a simple costs reflects EROEI type of analysis. For coal vs natural gas we have two relatively unrelated industries competing to produce power and which fuel has higher EROEI might not be reflected in production cost when coal and natural gas are compared.
“I don’t think we need to measure EROEI, because I am of the opinion that EROEI is reflected quite well in the cost of production.”
In most instantaneous ERoEI can not be accurately measured. There are two many unidentifiable inputs, and outputs to make anything but very rough estimates. To be precise enough to serve any practical purposes it must be calculated from well established physical properties of the material in question. Here we have done the calculations based on the physical properties of conventional crude. Those include specific exergy (е), entropy production (σ), density (ρ), specific heat (с), and temperature (°R).
The cost of production is reflected well in ERoEI. This would be expected as petroleum serves primarily as an energy source.
http://www.thehillsgroup.org/depletion2_009.htm
http://www.thehillsgroup.org/
Hi Jef,
The physical reality is that economic output continues to increase. My claim is not that EROEI does not matter, it is that we don’t know what it is.
Let’s say EROEI has decreased (I believe it has, but don’t think we know the magnitude), if that is the case, the economy has learned to function with a smaller amount of surplus energy.
The World economy is functioning just fine. Economic growth has slowed because population growth has slowed and as more of the World becomes developed both population growth and economic growth will slow down even more. The system will have to adjust to this new reality and Japan has been dealing with that problem for the past 25 years and Europe may be starting to feel the effects of this transition.
Chart below uses data from FRED for World real GDP per capita, plotting the natural log to show the linear trend (exponential on an x-y plot) at a growth rate of 1.4% per year. The collapse you refer to in not apparent.
Link below to FRED data.
https://research.stlouisfed.org/fred2/graph/?g=3hLG
The World economy is functioning just fine
I’m afraid you are a victim of delusion. Of the four biggest economies, Japan is in almost permanent recession and deflation. EU has abysmal growth and is almost in deflation. US has slow growth and is undergoing a massive deflation in the energy sector while stuck in near zero interest rates, and China is having its slowest growth in 25 years. International trade is showing its smallest growth in decades and the KOF index shows that economical globalization never recovered the level of 2007 so we are in effect deglobalizing. If we move to the emergents the picture is even worse. Many of them are entering recession.
In this Universe, the world is at the brink of a new global recession. So no, the world economy is not fine. I wonder where you get your economical information, probably at the FMI, World Bank, and those places where you are looking at the rear view mirror. 9 months after we are in recession, they will certify it and so you will know.
Not forgetting South America. In Dec. Fitch became the second of the credit-rating agencies to downgrade Brazil’s debt to junk. Levy, the finance minister appointed by Dilma Rousseff to stabilize public finances, quit after less than a year in the job. Now Brazil’s economy is predicted to shrink by 2.5-3% in 2016, not unlike 2015. Argentina, as everyone knows, is in crisis mode. Even Norwegians are complaining about the economy; I went there at Christmas to get cheered up and it didn’t work.
Hi Doug,
That is surprising, I thought there was a lot of construction to completed for the World Cup and the Olympics which would tend to boost the economy.
Maybe Fred can comment as he is much more familiar with Brazil than me.
Norway may be suffering due to low oil prices.
I have no idea what is going on in Argentina.
After very fast growth from 1960 to 1989, Japanese growth has been slow since 1990, but there is still growth in real GDP per capita on average over the 1990 to 2014 period. The rate of growth in per capita GDP was about 0.7% per year, about half the World rate.
https://research.stlouisfed.org/fred2/series/NYGDPPCAPKDJPN
Maybe Fred can comment as he is much more familiar with Brazil than me.
Well, for what it is worth, I’ve canceled my return trip to Brazil and have decided to stay in South Florida for the time being. Things are not too good right now in Brazil…
I could get into more detailed but I’ve been a bit more depressed than usual about the situation there lately…
Hi Javier,
Yes I am basing it on what has happened from 1975 to 2014.
Absolutely there will be recessions in the future. In the past 55 years we have had one year (2009) where real GDP per capita for the World was negative for the year. You seem convinced that this will occur again before 2020, I think between 2030 and 2040 is more likely. Simply a difference of opinion.
The IMF is forecasting about 2.5% growth for the World in 2016, if you are suggesting this might be a little lower, I would agree (maybe 1.5% at worst). If you believe average real GDP in 2016 will fall below the average 2015 level, I would not agree.
Neither of us knows the future, though it looks like the recent trend in your chart is up (from the third to fourth quarters of 2015).
Yes I am basing it on what has happened from 1975 to 2014.
That explains why you are very likely to be wrong. You are not recognizing that the debt and oil crisis that converged on 2008 are a game changer. You do not see that the unprecedented experiment carried out by the main central banks indicate that we live in a completely different economic world than pre-2008.
But some things have not changed, IMF has never predicted a recession, so its forecasts are of no value.
Not knowing the future doesn’t mean not knowing about the future. But we are discussing the present, and the global economy of the present is not fine. Leading indicators actually show that it is quite bad wether there is recession or not this year.
Hi Javier,
Well you are probably correct that the IMF has never predicted that World real GDP per capita would decrease on an annual basis (real GDP per capita average for the year is less than the previous year’s average).
The IMF has been correct about no recession for 53 out of the last 54 years, so the odds are pretty good.
You are predicting a recession for some year or years from 2016 to 2020. I agree there will be a World recession in the future, I just think it will happen after peak fossil fuels between 2029 and 2033.
We will just have to wait to see who is correct.
No doubt we will both be wrong as it is simply a guessing game.
Hi Javier,
The thing about those leading indicators is at the current level, about 9 recessions have been predicted, but only one has occurred.
Note that the 2001 recession happened at a much lower level of those leading indicators. We could throw that in and we would have 2 out of 9, so this gets it correct about 22% of the time with a lot of false positives.
Leading indicators tell us very little.
You are sidetracking the discussion, Dennis. Let me remind you:
“The World economy is functioning just fine”
Predicting recessions is no doubt tricky, but leading indicators as well as coincident indicators paint a picture of the state of the economy. Those leading indicators in the figure above are not predicting a recession yet, but they are showing very clearly that the US economy has been worsening since 2013. We know that that is also the case for China’s economy, and that Japan and EU have not been able to grow significantly, and that several emerging countries like Brazil are entering recession now.
So no, the World economy is not functioning fine.
And by the way the FMI has never been able to predict a US recession either, so its record on that respect is abysmal, and its probability of predicting a global recession is probably zero. It is possible that its personnel is not allowed to make fundamentally bad predictions.
Hi Javier,
The World economy through 2015 was doing ok, taken as a whole. We will just have to leave it at that, we don’t know how the World economy is doing in real time and I believe we can agree that we cannot accurately predict the future (or I can’t, you seem a little more bold).
As far as sidetracking the discussion, I will remind you that I am not the one who posted a chart of leading indicators (as if it was important).
Dennis,
“As long as the net energy of all energy used by the economic system is adequate to keep the system functioning then various types of energy will be produced as long as it can be done profitably (in money terms).”
Profitability is not enough. At some point quantity (price/EROEI) turns into quality (“secular stagnation”). Estimates vary but there is some evidence that EROEI in single digits is an invitation to troubles. Some researchers suggest that a minimum EROEI of 7 (average for all sources of energy used; individual sources can probably be lower if high EROEI sources are present in the mix) is necessary for avoiding “secular stagnation”.
I site this from the comment to the article http://www.scientificamerican.com/article/eroi-behind-numbers-energy-return-investment/
This comment refers to the old 2013 paper that compared electrical power generations alternatives (Weißbach et al. “Energy Intensities, EROIs (energy Returned on Invested), and Energy Payback Times of Electricity Generating Power Plants.” Energy 52 (April 1, 2013): 210–221. doi:10.1016/j.energy.2013.01.029).
the paper is behind pay wall but the link to the spreadsheet with result exists:
https://docs.google.com/spreadsheets/d/1lBK3pntKdd3bo8oAAvjnpQvYaLZp1G-ieuS5GA5NGV4/edit?pref=2&pli=1#gid=0
== quote ==
The key they have found is to normalize not just across power quantity, but also quality. A key aspect of quality is “usability,” which is the degree to which the supply of power matches the real-time demand. Intermittent and invariable baseload power sources must be adjusted for the amount of buffering necessary to match their output to the real world of variable demand. The study authors did this by requiring each source to have the overcapacity and storage necessary to be compatible with a large international European grid scenario, and they used pumped-hydro power storage parameters since it is today’s most cost-effective option for storage and buffering. The study is behind a paywall…
In their analysis, they found that a minimum EROI of 7:1 was necessary for economic viability. With that in mind, here are their results:
PV solar 2.3:1
Biomass Boiler: 3.5:1
Onshore Wind: 3.9:1
CSP Solar : 9.6:1
Natural Gas: 28:1
Coal: 30:1
Run-of-River Hydro: 35:1
PWR Nuclear: 75:1
== end of quote ==
BTW EROEI of ethanol is around 2 and oil sands below 7 which puts them at the bottom for liquid fuels
https://en.wikipedia.org/wiki/Oil_sands
== quote ==
Approximately 1.0–1.25 gigajoules (280–350 kWh) of energy is needed to extract a barrel of bitumen and upgrade it to synthetic crude. As of 2006, most of this is produced by burning natural gas.[57] Since a barrel of oil equivalent is about 6.117 gigajoules (1,699 kWh), its EROEI is 5–6. That means this extracts about 5 or 6 times as much energy as is consumed. Energy efficiency is expected to improve to average of 900 cubic feet (25 m3) of natural gas or 0.945 gigajoules (262 kWh) of energy per barrel by 2015, giving an EROEI of about 6.5.[58]
I don’t agree with such an analysis. You have to look at the energy system, different types of energy can back each other up if tied together by the grid.
One study looked at a large area of the United States (Northeastern) and tried to minimize system costs while using as much renewable energy as possible. Solutions exist which can provide 90% to 99% of load hours with wind and solar power with some battery backup at levelized costs similar to costs at the time of the study (2012). The remaining hours can easily be provided by existing peaking natural gas combustion power plants. The grid is already in place. See
http://www.sciencedirect.com/science/article/pii/S0378775312014759
Also see work by Jacobson and Delucchi at link below.
http://web.stanford.edu/group/efmh/jacobson/Articles/I/WWS-50-USState-plans.html
especially the first paper listed.
This concept also explains why “renewables” are not a solution.
Not a solution to what exactly, BAU? If that’s the the question then you are correct.
On the other hand, renewables are the only long term solution for whatever civilization Homo sapiens manage to cobble together after the dieoff that will occur when the population self corrects after Peak Oil hits.
renewables are the only long term solution for whatever civilization Homo sapiens manage to cobble together
That is a given. We were fully renewable in the Paleolithic.
Javier,
“That is a given. We were fully renewable in the Paleolithic.”
You have a point 😉
The energy footprint of the current civilization can be considerably reduced. For example, in the USA the consumption of oil by personal vehicles can probably be cut in half. All you need are sustained high gas prices and adaptation process, albeit very painful will start in full force. I remember how quickly people switched to smaller cars when gas was above $4 per gallon. I suspect gas prices around $8 per gallon (EU prices) can do wonders in changing the composition of the USA personal car fleet ;-).
But under neoliberalism high oil prices destabilize the financial system (because they depress profits and slow down the GDP growth) and eventually produce an economic crash. I wonder if neoliberalism is sustainable with low or negative GDP growth. There also some connections of global dollar system and oil(“petrodollar”), there is a hypothesis that low EROEI inevitably leads to “secular stagnation”, may be low oil prices are necessary to support neoliberal globalization and feed growing top 1% excesses at the expense of lower 99% and at the same time prevent lower 99% from the revolt.
But my impression is that neoliberalism artificially accelerates oil consumption (via “overproduction of junk” and redistribution of wealth up) and now needs depressed oil prices for survival. As currently this is a dominant social system, that probably will drive us from the cliff.
I wonder if neoliberalism is sustainable with low or negative GDP growth.
I think we all know the answer to this question. No.
But under neoliberalism high oil prices destabilize the financial system…
Oh good grief! Neoliberalism? The New Liberals? How about neofascism, the New Fascists. We have a whole passel of them running for president right now.
The liberals are not driving up oil prices one damn bit more than the right wingers are.
As currently this is a dominant social system, that probably will drive us from the cliff.
I mean, wow! That is really stretching things, blaming the coming collapse on liberals. I mean I dislike all those right wing nutcase every bit as much as you dislike liberals, but I would never dream of trying to blame the coming drive over the cliff on them.
This is an old story. Choose your devil then blame every bad thing that has happened, or is likely to happen, on your chosen devil. And your devil is neoliberalism.
Neoliberal economics Ron. Not liberal as in political view.
https://en.m.wikipedia.org/wiki/Neoliberalism
Oh sorry, my mistake.
Augusto Pinochet was a neoliberal? Goog grief, when a right wing fascist dictator can be called a liberal, neo or otherwise, the world has turned upside down.
Question, just why did they not call it “neofascism”? That would be a far better name if Pinochet was one. And if they had I would not have been so damn confused. 😉
Nevertheless, no political movement is responsible for the current predicament the human race finds itself in. That is simply the natural result of our overwhelming evolutionary success.
> “Neoliberalism? The New Liberals?
> How about neofascism, the New Fascists.
> We have a whole passel of them running for president right now.”
There is a strong connection between neoliberalism and neofascism: both are forms of corporatism. See
http://www.softpanorama.org/Skeptics/Political_skeptic/Neoliberalism/index.shtml
As far as secular stagnation, high oil prices won’t necessarily cause this.
In fact it may increase demand for different vehicle types and spur demand for public transportation. The economy will adjust as investment moves to other types of investment such as better built homes and urban redesign (to make more walkable and bikeable cities). Investment can also move to wind, solar, and HVDC grids.
The “problem” of increased worker productivity with greater automation can be solved with shorter work weeks (maybe 35 hours instead of 40) and higher hourly pay.
> As far as secular stagnation, high oil prices won’t necessarily cause this.
Secular stagnation — “a condition of negligible or no economic growth in a market-based economy” — is a change of fundamental dynamics of GDP growth. In this regime GDP growth is permanently low, interest rates even lower and returns on equity is also low. This is the world of low returns. Due to it extraordinary policy measures following the 2007–2008 crisis merely led to the stabilization of a lethargic, if not comatose, US economy.
End of cheap oil is just one explanation. Substantial increase of price of oil acts as a fundamental limiting factor for economic growth as in many sectors of economics oil is irreplaceable. This idea is advanced, for example by James Hamilton as the key cause of 2008 Great Recession:
http://www.voxeu.org/article/did-rising-oil-prices-trigger-current-recession
== quote ==
The implication that almost all of the downturn of 2008 could be attributed to the oil shock is a stronger conclusion than emerged from any of the other models surveyed in my Brookings paper, and it is a conclusion that I don’t fully believe myself. Unquestionably, there were other very important shocks hitting the economy in 2007-08, most notably the problems in the housing sector. But housing had already been subtracting 0.94% from the average annual GDP growth rate over 2006:Q4-2007:Q3, when the economy did not appear to be in a recession. And housing subtracted only 0.89% over 2007:Q4-2008:Q3, when we now say that the economy was in recession. Something in addition to housing began to drag the economy down over the later period, and all the calculations in the paper support the conclusion that oil prices were an important factor in turning that slowdown into a recession.
== end of quote ==
As Heinrich Leopold recently noted, in a highly levered world when something gets out of whack in terms of the oil price, then you see propagation of this shock wave everywhere.
Also it was shale boom that helped to lift the US out of Great Recession into low growth regime. Here is what Steven Kopits wrote in August 2014 about stimulation role of US “shale boom” on GDP and the US economy performance:
http://econbrowser.com/archives/2014/08/guest-contribution-the-cause-of-secular-stagnation-relative-prices-trade-and-the-peoples-republic-of-china#comment-184567
== quote ==
August 28, 2014 at 7:58 am
Remember, oil production is, in a very material way, “manufacturing”, in that all–all–of increased US oil production is import substitution, that is, all of US shale oil production functionally has been, in fact, net exports.
Hi likbez,
I look at this from a World perspective. For the World real GDP per capita has risen at an average rate of 1.4% per year from 1975 to 2014. Note that Hamilton’s work focuses on the United States. I think the high oil prices in 2008 might have been a factor in the Global Financial crisis, but I think it was not the main cause, the housing bubble in the US and Europe was the main factor.
Oil prices varied from high to low with very little effect on real GDP growth per capita (with the exception of the GFC) over this 39 year period.
That is a given. We were fully renewable in the Paleolithic.
Except for the minor and inconvenient fact, that anthropologists classify Paleolithic and Neolithic societies as pre-civilized as opposed to civilized and being hunter-gatherers they had a linear consumptive extractive model of resource use. They were mostly responsible for causing the extinction of large mammals or ‘Peak Mammoths’… So no, they were not renewable! 🙂
Then we might become postcivilized in the future. 🙂
I dispute that the megafauna extinction is a signal that humanity was not renewable. The megafauna extinction did not take place in Africa which was the continent were humanity originated. In my opinion, it was a consequence of human expansion to other continents where the megafauna did not have time to adapt to its superpredatory status. I defend that until the advent of agriculture humanity was fully renewable and most people would agree with me because almost everybody considers modern hunter-gatherer tribes as renewable.
Would you dispute the fact that most African megafauna is currently being driven into extinction?
No, but we were talking about the Paleolithic.
Modern hunter-gatherer tribes are renewable?!
ROFLMAO!!
Javier, I know English is not your first language but that is just too funny! Tks, for the laugh!
Let me rephrase that, then,
Modern human hunter-gatherers are considered by most to live a life on renewable resources without depleting the environment.
API: US December, 2015 Petroleum Demand Highest in Five Years
http://www.ogj.com/articles/2016/01/api-us-december-petroleum-demand-highest-in-5-years.html?cmpid=EnlDailyJanuary282016&eid=291006698&bid=1295150
EIA Annual Energy Review data complete for 2015 (subject to revision):
http://www.eia.gov/totalenergy/data/monthly/pdf/sec3_3.pdf
Based on foregoing, annual 2015 US net total liquids imports were still down in 2015, versus 2014, but US net total liquids imports rose from 4.5 million bpd in December, 2014 to 5.1 million bpd in December, 2015.
Note that US C+C inventories rose by 100 million barrels from late 2014 to late 2015. So, as we saw a 100 million barrel increase in US C+C inventories, US net total liquids were up by 13%, from 12/14 to 12/15? Almost makes one think that most, if not all, of the C+C build consists of something besides actual crude oil.
(As usual, there appear to be some discrepancies between the EIA Weekly Supply data and the Annual Energy Review data in regard to total liquids net imports. In any case, the four week running average data show that US net crude oil imports rose from 6.9 million bpd in December, 2014 to 7.3 million bpd in December, 2015. Net crude oil imports are not broken down separately in Annual Energy Review.)
Someone mentioned the other day that Mexico is coming off a production plateau (I assume because of declining production from KMZ).
Edit:
Based on Pemex data, it looks like Mexico’s total petroleum liquids production was 2.6 million bpd in 2015 (I had been guessing 2.4 to 2.5). Assuming flat consumption at 2.0 million bpd, 2015 net exports were down to about 0.6 million bpd in 2015.
2014 total liquids + other liquids production was 2.8, with consumption of 2.0, so net exports of 0.8 million bpd.
Year over year (2014 to 2015) exponential rates of decline in production and net exports would be 7.4%/year and 29%/year respectively (assuming flat consumption).
2004 to 2015 exponential rates of decline in production and net exports would be 3.4%/year and 10%/year respectively.
Based on the 2004 to 2015 (11 year) rate of decline in their ECI Ratio (ratio of production to consumption), Mexico would approach zero net exports in about six years.
This is yet another indirect confirmation of “Great Condensate Con” hypothesis.
Hess, Anadarko, Murphy, Conoco and Occidental are expected to announce combined losses of $14 billion for last year over the coming days. Hess already announced and their loss was a bit higher than expected in this report:
http://www.worldoil.com/news/2016/01/27/us-oil-explorers-seen-reporting-14-billion-in-2015-losses
[…] Read full post at peakoilbarrel.com […]
“This concept also explains why “renewables” are not a solution.”
This is a partial truth at best, and not at all a solid argument, except from opinion, for a number of reasons.
The amount of Energy returned per unit of energy invested does need to be satisfactory, nobody argues this. I have seen various figures put forth my people with plenty of brains, and relevant professional expertise, to the effect that a minimum return of around four or five to one is high enough. Some other folks believe a higher return is necessary, maybe ten to one or better.
I am unable to evaluate these arguments for myself, because doing so requires substantial expertise in accounting, engineering, physics, computer programming, economics, and maybe a couple of other fields, meaning we ordinary folks will be taking the word of folks who have all these skills, and time and money to study the question.
But the return of energy on the energy invested in building wind and solar farms does appear, so far as I can tell, to be well over the five to one level.
Furthermore, at least half of all the energy we use now is utterly wasted, after one fashion or another. This means we have PLENTY of fossil fuel energy that can be devoted to building out renewables to a VERY substantial extent, if we choose to do so.
The renewables naysayers never stop to think about one tractor trailer after another barrelling down the highways of the world, each one of them using a hundred or more gallons of diesel PER DAY, or hundreds of aircraft departing a large air port, daily, each one loaded with five THOUSAND or more gallons of jet fuel.
Money may never give us a GOOD measure of energy returned on energy invested, but I believe it can be used to put a fairly decent upper limit on the amount of energy embedded in a given product.
If the entire cost of a wind farm went strictly to energy, as measured in dollars, so many dollars per ton of coal, so many dollars per gallon of diesel fuel, etc, then the solar farm generates enough electricity, at the going rate, to pay for itself, well before it is worn out.
Some apparently honest people with expertise tell us a wind turbine returns the embedded energy content in as little as six months. Wind turbines are going to last at least twenty years, on average, and most of the materials in them can be recycled.
So far as I can see, there is NO reason to believe that with the cost of renewable energy falling like a rock, and the wind and solar industries growing like crabgrass in hot wet weather, that renewables CAN’T carry the load, as a POTENTIAL matter.
Now whether the wind and solar industries WILL be scaled up sufficiently, in time to shoulder the load, as fossil fuels deplete, is another question altogether.
I believe renewables are growing fast enough that we won’t run TOO SHORT of fossil fuels for a good while yet.
Let’s not worry about twenty or thirty or a hundred years down the road.
Sufficient unto the day are the problems thereof.
a few pieces on micro-grids and HVDC transmission…
Microgrids Paving the Way for Distributed Energy
http://www.shareable.net/blog/microgrids-paving-the-way-for-distributed-energy
An interstate for renewable energy
January 25, 2016 • Institutes, Cooperative Institute for Research in Environmental Science (CIRES)
http://www.colorado.edu/news/features/interstate-renewable-energy
some news wrt distributed rooftop solar in California
http://www.latimes.com/business/la-fi-rooftop-solar-power-20160128-story.html
http://www.businesswire.com/news/home/20160128006492/en/California-Public-Utilities-Commission-Expands-Solar-Net
powerful documentary from American Experience / PBS on coal mining in West Virginia during the early 1900’s.
http://www.pbs.org/wgbh/americanexperience/films/theminewars/
Who Owns The Sun?
Warren Buffett controls Nevada’s legacy utility. Elon Musk is behind the solar company that’s upending the market. Let the fun begi
By Noah Buhayar | January 28, 2016, From Bloomberg Businessweek
I have spent a few pleasant moments daydreaming about what will happen in Nevada the next time a company such as TESLA is choosing the location for a new manufacturing plant that will employ thousands of people and pay megabucks in local taxes,after the sweetheart come hither incentives expire.
In the end, the utility will make bigger profits in the short term, but lose the respect and confidence of the public over the long term. Oh, well,,,,,,,,,,,,,, they can just change the name of it, and all will be forgotten.
Utilities do need to be paid for what they do, and there are going to be knock down, drag out fights about who pays, from now on out.
In the end, the solution suddenly seems perfectly obvious to me, like the light bulb going on over a cartoon figures head. Either the wind and solar farmers buy out the utilities, or the utilities buy out the wind and solar farmers. Once ownership is under one roof, this will solve the problem of who pays for what, in the case of large scale renewable electricity.
Homeowners with domestic pv systems will continue to be jerked around until such time as so many people own systems of their own that they have political clout sufficient to put a stop to it.
In ten years , Nevada is going to look like the anus of the sunny states, in terms of having a thriving pv industry supporting large numbers of local jobs, with lots and lots of homeowners paying taxes on their personal pv systems.
My analysis shows society loses money when $48000 was spent this way. Giving them subsidies to meet an arbitrary renewables goal was stupid. Since costs are dropping, it’s better to wait 5 to 10 years, build integrated systems if competitive. And it doesn’t make much sense unless the panels are USA made.
HI Fernando,
I for one do appreciate your hard core engineer’s attitude that what you build must pay its own way if you expect to stay in business. I have not invested yet in a personal pv system for the very reason that the costs of such systems is falling and will continue to fall, and my money is much better spent, for now, on improving the EFFICIENCY of my energy use.
but somebody has to go first, and sometimes it is a country or society as a whole that has to go first.
We built schools and universities to educate kids ten or twenty years before the kids would become workers. We built highways before they were actually needed, in a lot of cases, and we built a lot of hydro electric capacity before there was actually much need of the electricity, in the expectation the market would be there, once the electricity was there.
Now everybody is free to come to his own conclusions, here are mine.
Fossil fuels are going to be in short supply, and very expensive, within the easily foreseeable future, due to depletion, and increasing costs of extraction, resource nationalism, growing population, etc etc.
We are at high risk of economic recession, economic depression, and even outright economic collapse, as the result of fossil fuel depletion, not within the next few years, maybe not within the next decade or two, but definitely withing the next two, three or four decades. Wars hot and cold may well result, and imo, WILL result, as one consequence of depleting, expensive oil, gas and coal supplies.
There are only two things, in general terms, we can do, as practical matter, to deal with this grave problem, due to the nature of politics and the behavior of naked apes.
We can push as hard as we can, for higher efficiency standards, and we can push as hard as we can to force the growth of the renewable energy industries.
It is going to take quite a while to manage a transition from depending on depleting fossil fuels, to producing enough renewable energy to keep the economy at least hobbling along, without collapsing, as fossil fuels deplete.
As for the cost of subsidizing the renewables industries, well, I just can’t see any other prudent option, given the risks involved, and the time spans involved.
If we wait, expecting the Wonderful, Wonderful Market, and the Invincible Invisible Hand to solve the problem for us we are at very high risk of finding our selves in the position of a country that has invested very little in it’s military, while a nearby aggressive neighbor has been getting ready to fight an offensive war.
It’s TOO LATE to talk about building a tank factory, and training men to operate them, when the enemy tanks are rolling across your borders.
And for what it is worth, there is a silver lining in every black cloud, if you look for it.
In the case of wind and solar power, it has a powerful effect impact already, in terms of reducing demand for fossil fuels. We are using at least five percent LESS coal and natural gas here in the USA, already, because we now have a lot of wind and solar capacity.
It is hard to quantify, but this reduction in consumption results in a substantial additional savings, across the board, for everybody (EXCEPTING the fossil fuel industry ) due to LOWER energy prices.
As a matter of fact, I personally think we will actually SAVE money, maybe even over the fairly short term, by spending MORE on renewables subsidies, by way of holding down the prices of oil and gas.
In ten years we can be driving ENOUGH cars, such as the Chevy VOLT, and the Nissan Leaf, to significantly impact the price of gasoline, in a country such as the USA.
In a crisis situation, when you need industrial capacity and trained men, the difference between having one or two percent enough, and ten or twenty percent enough, can be profound, and critical.
ONE percent enough means expanding a hundred fold, in terms of men and machine.
Twenty percent enough means expanding five fold. A five fold expansion may be possible, depending on the time frame, but a hundred fold expansion is almost out of the question.
I simply do not KNOW how long it will be before we are at each others throats over oil and gas, and even coal. My opinion is that within twenty years, we will be fighting hot resource wars.
Your opinion will be worth more than mine, since you are an energy professional. Let’s hear it.
Its better to build nuclear power plants.
Its better to build nuclear power plants.
No it absolutely isn’t! People with weak and stunted imaginations need to go to a creativity gym and exercise some out of the box thinking muscles.
https://goo.gl/URc95d
Can you imagine a world in which most jobs are obsolete?
If not, you are most likely in for a rude awakening in the coming decades of radical shifts in employment. This is particularly true for new parents propelling the next generation of workers into an adulthood that many economists and futurists predict to be the first ever “post-work” society.
Though the idea of a jobless world may seem radical, the prediction is based on the natural trajectory of ‘creative destruction’ — that classic economic principle by which established industries are decimated when made irrelevant by new technologies.
Creativity is not a gift | Dustin Timbrook | TEDxHuntsville
https://goo.gl/VGTvlB
Yep, just ask the residents of Fukishima. 🙂
If you add the insurance subsidy and the cost of storing the nuclear waste, nuclear does not look like such aa great deal.
The cost of full private insurance for the Nuclear power plants would be quite high, though estimates vary.
See
https://en.wikipedia.org/wiki/Price%E2%80%93Anderson_Nuclear_Industries_Indemnity_Ac
Hi Old Farmer Mac,
I would agree with your take on this, sometimes subsidies are needed and save money in the long run if done correctly (as an incentive to make the investment competitive, without creating too much of a windfall for early adopters).
n.b. the bio of the new chairman of the Nevada PUC is interesting: (my bolding)
http://puc.nv.gov/About/Commission/Commissioners/
“Chairman Paul A. Thomsen
Paul A. Thomsen became Chairman of the Public Utilities Commission of Nevada on Oct. 1, 2015. Gov. Brian Sandoval appointed Chairman Thomsen to replace outgoing Commissioner Rebecca Wagner.
Previously, Chairman Thomsen served as Gov. Sandoval’s appointee as the Director of the Governor’s Office of Energy. He was selected for that position in September 2013.
Prior to his service as the Director of the Governor’s Office of Energy, Chairman Thomsen was the Director of Policy and Business Development for Ormat Technologies, a leading vertically integrated global provider of a diverse range of renewable energy solutions, headquartered in Reno. He has also worked for the law firm of Lionel Sawyer and Collins, U.S. Sen. Harry Reid, and U.S. Sen. Richard Bryan.
In addition, he was President of the Board of Directors of the Geothermal Energy Association, Chairman of the U.S. Clean Heat and Power Association, President of the Nevada Geothermal Council, and industry expert for the U.S. Department of Energy Geothermal Technologies Program Blue Ribbon Panel. …”
Ormat is essentially all geothermal, with a few concentrating solar thermal plants.
I.E. It’s in Ormat’s interest to get NV Energy to buy utility scale plants, instead of allowing distributed energy, especially rooftop solar.
WSJ: Oil Slump Sets Scene for Mergers
With U.S. shale producers losing more than $2 billion a week, some may be forced to find a buyer this year
http://www.wsj.com/articles/oil-slump-sets-scene-for-mergers-1454019289?tesla=y
Of course, changing the ownership of proven producing properties does not materially change remaining recoverable reserves (the only positive effect might be that the acquiring party has more money to put into enhancing existing production).
In round numbers, I suspect that the annual loss of US C+C production from existing wells has skyrocketed, from about 0.25 million bpd in 2008 to probably around 1.5 million bpd this year, and I don’t think that changing the ownership of proven producing properties will have a material impact.
Large companies can purchase those shale skeletons and add reserves when prices go up. I expect some big deals any time now.
By drilling new wells is what I assume you meant, but my point is that I don’t expect to see changes in ownership having a material impact on the remaining recoverable reserves from existing producing wells.
And as production falls, and as the overall decline rate from existing wells presumably moderates, the estimated annual loss from existing wells will slow, say down to perhaps 0.7 to 1.0 million bpd per year, but that would still be significantly more challenging than what the industry faced in 2008 (probably about 0.25 million bpd per year).
Fernando,
In my view there is little value in the shells of shale companies due to the high decline rate of shale wells. There is also significant risk of environmental liabilities (earth quakes …..). So, big companies have very little incentive to buy shale companies. We will see.
Same thing occurred to me. Usually, majors are not in a big hurry to buy thousands of quickly declining oil wells with a median production of less than 100 bpd. However, where there is a reasonable amount of proven undeveloped acreage, the calculation changes, but I suspect that in many case the leases covering a lot of the proven undeveloped areas have expired, or will be expiring.
It may be that the most attractive shale properties are proven producing gas wells, given what I assume are lower operating costs, plus the potential for higher natural gas prices next winter.
Jeffrey,
It might be of interest for big companies to buy proven undeveloped acreage, yet they can do so by buying it from the receiver and they do not have to buy the whole company. However, the best is to do it when oil and gas prices are in the first phase of rising prices. This is still a few months away.
Years ago at the Oil Drum, one article posted a chart that predicted Norway would decline, then halt for a while around 2014, then after a few years begin declining again.
So far, the prediction seems to hold.
That may have been a post by Rune Likvern, who does excellent work.
Google – WSJ bank rip up oil forecast
Excerpt from a missive I sent to some industry guys (I swiped and used a constant dollar oil price chart that Alex prepared):
Some of you may recall the Economist Magazine cover story, published in early 1999, which predicted–because of advances in technology and productivity gains (sound familiar?)–that we were looking at an extended long term period with oil prices in the $5 to $10 range. While I suppose it’s possible that this time the conventional wisdom is right, i.e., that we are looking at perpetually low oil prices, my bet is that the laws of physics will prevail, especially in regard to the high, and rising, rates of decline in existing US oil & gas production.
In any case, here is an excerpt from the March, 1999 Economist Magazine cover story on oil prices:
Enclosed is a chart showing constant dollar monthly WTI Crude oil prices, in 2016 dollars. Note that the March, 1999 Economist Magazine article corresponded pretty much to the all time record low constant dollar oil price for the past 40 years.
And as I noted, I think that I have made a strong case that the trillions of dollars spent on upstream global oil & gas capex since 2005 have only been sufficient to keep us on an undulating plateau in actual global crude oil production (45 API Gravity and lower crude oil), and because of the large and ongoing declines in global upstream capex, even the Wall Street Journal is expressing concerns about a future oil price spike, as supply falls.
The Cornucopian Crowd, basically making the same argument as the Economist Magazine writer in 1999, is arguing that advances in technology have indefinitely postponed any kind of production peak to the far distant future.
I think that the reality is much more prosaic.
In my opinion, the reality is that global crude oil production has probably effectively peaked, while global natural gas production and associated liquids (condensate and natural gas liquids) have so far continued to increase. Furthermore, I suspect that all, or virtually all, of the large build in US (and probably global) C+C inventories in 2015 consists of condensate.
Jeffrey,
Forecasting prices means to understand the ultimative reason for price movements. Is it interest rates, the dollar, demand, supply…..? For instance the US dollar is not a reason for price movements of the oil price. It is the other way around: the oil price moves the US dollar as a higher oil price leaves countries like China with less dollars to buy Treasuries from their account surplus.
Compare with (May 19, 2015)
http://blogs.wsj.com/moneybeat/2015/05/19/oil-prices-where-next-here-are-the-forecasts/
Looks like everybody got it wrong.
Ron,
You cannot say everybody got it wrong as I have predicted in many discussions lower oil prices the whole year. As a proof just one comment about 5 months ago :
Heinrich Leopold says:
09/21/2015 at 2:12 am
Greenbub,
For oil at 85 USD per barrel for the end of the year, the USD must drop substantially. In addition, there is a large inventory overhang, which must be cleared and there is also Iran preparing for production. It is very unrealistic to expect a 60% oil price increase over the next three months. It is a policy to convince investors not to panic and keep their investments or even buy more.
………….
I know I have also two other scenarios ( much higher natgas prices and much lower US production) which came not yet through. Yet in my opinion this is just a matter of time.
Heinrich, I didn’t mean you, I meant everyone in the chart I posted.
Sorry.
Hi Heinrich,
In the comment you quote, you say oil prices will not rise to $85/b, I didn’t read anything there suggesting $30/b or lower.
Could you find one of those quotes? 🙂
Dennis,
During the same time I wrote also a comment to you:…. the year end prices are closer to 30 USD/barrel than 80 USD/barrel, which was your guess.
I do not have the exact quote as this will cost me a lot of time to find it. However, you will probably remember as well.
Hi Heinrich,
I could not remember your prediction, at the time you said $30/b in Sept 2015, I was suggesting $60/b in Dec 2015.
Early in the year I was suggesting higher prices as I thought the low prices of January would reduce US LTO output rather quickly as breakeven oil prices were about $75/b for the average LTO well at the time.
I have said on many occasions that you guessed much better than me. I was wrong on my expectation of LTO output (it was much higher than I expected), so I was wrong on oil prices (as high oil supply kept oil prices low).
It seems you expect the oil price to rebound very quickly when the supply finally starts to fall (and again you expect a strong move down in supply at some point).
Care to guess when this might occur and how high oil prices might go when if finally does?
Are you thinking oil prices might jump to above $100/b between Dec 2016 and Dec 2017 (not a linear move but a spike in the oil price)?
Heinrich Leopold says:
09/09/2015 at 2:03 pm
Dennis,
My pessimism during spring about oil prices has been confirmed this fall. Not very much has changed since then. I think it can get very nasty over the next three months. Something has to break before we get an uptrend. Oil just down 1.74 USD to 44.20 USD per barrel today. Oil at 30 USD per barrel is more likely than 60 USD per barrel for December.
http://peakoilbarrel.com/open-thread-oil-and-natural-gas/#comment-537195
Thanks for sending me the quote. It is a lesson for me to store all my own comments.
Hi Heinrich,
That was a very good call, but note that the average WTI spot price in December 2015 was $37/b and the lowest weekly average price was $36/b. You have been very reluctant to make any further calls on oil.
Just the bond market will determine things and the price will be volatile.
In that comment you were willing to guess essentially $30/b to $50/b for December 2015.
Could you give us a guess for April? It can be as big a range as you are comfortable with.
My guess would be $30 to $50 per barrel for April 2016 average WTI spot price.
Dennis,
Oil is very unlikely to go over 45 USD/barrel and equally unlikely to go under 25USD/barrel until April 2016. Very much could happen by then. http://www.zerohedge.com/news/2016-01-30/another-nail-us-empire-coffin-collapse-shale-gas-production-has-begun. The bond market for shale has collapsed. The FED could probably do some quantitative easing buying shale bonds, yet I do not think this will happen over the next four months. However, the next few months could lay the foundations for a substantial rise of oil by the end of 2016.
Thanks Heinrich,
We are roughly in the same ballpark (within $5/b).
For a substantial rise in oil price by December 2016 (monthly average), how does $60/b to $90/b sound for a rough guess (or you could go wider and say $50 to $100/b)?
Mr. Leopold (and anyone interested in natgas supply)
You may find of interest the news release that Consol Energy put out a few hours ago. I’m not adept at getting the little blue letters on the screen, but googling should pull it up.
The lengthy report mentioned the results of their latest Deep Utica well, the GH 9, – at 13,400′, the deepest yet.
It flowed 61.9 MMcf IP, over 8,300 psi, which is becoming routine for these wells.
The report mentions the four Switz wells in Ohio, as well as the MND 6H in West Virginia, another 61 MMcf IP.
For you specifically, Mr. Leopold, and all those who repeat the “rapid decline” phrase, please observe how, in fact, these Deep Utica wells are producing over the past year.
Almost without exception, there has been littltle to NO decline as these wells are individually producing billions of cubic feet of gas every month or so.
An absolutely staggering resource is unfolding before our eyes.
coffeeguyzz,
If you really believe in it, why not bet the farm on it? I wish you good luck. My own accountant left his job five years ago to concentrate on shale investments. Now he has to come back to his job. He lost it all. I have warned him five years ago that this will end up in tears. He did not believe me. I can only warn you as well. The shale hype has already ruined many lives. Is it really necessary to increase the damage even further?
Shallow
As usual, I think we are more in sync than you might suspect, and your own data may verify this.
Instead of identifying dogs on a well by well basis – financially speaking – one could save a lot of time by simply pointing at a map of Ohio, Pennsylvania, West Virginia, and say they all suck. Mr. Leopold would concur.
However, one big reason for the dismal finances (oil as well as natgas) is the huge oversupply of product relative to demand.
Your numbers above display this (if no typos) when you point out 5/6 year old wells still producing a million cubic feet a day (1,000 mcfd).
That is exactly the point I was attempting to make to Mr. Leopold.
The Marcellus has an extremely large amount of gas.
The deeper, thicker, larger Utica is continuing to show that it actually has MORE gas than the Marcellus.
I am not saying anything stinks. I am also sure that large companies have outstanding wells. Maybe these aren’t bad. The problem is terrible price = low profitability.
We operate over 200 shallow stripper wells. The best one still produces almost 3 bopd like clock work, costs about $5 per barrel to operate.
So we are on the same page, 6 mcf = 1 BOE.
More Chevron package information:
For 2015, net gas sold after royalties from the 13 wells was 3,721,645 mcf which generated gross revenue o $3,833,938.81 or $1.03 per mcf, with OPEX of $1,332,516.54, net income of $2,501,427.27.
So, the wells generated an average net BOE of 130.72 per day per well at $6.18 per BOE. OPEX per BOE is very low, $2.15. The problem is the price, plus the fact that 16 of the 29 wells are shut in.
I agree, ton of gas. However, $1.03 per unit sold is killing them. Economics stinks. Maybe completions will cease up there for a few months?
Coffee, I dont think we disagree on anything other than what is most important. To you, it is monster flow rates. To me it is economics.
I suppose monster wells = terrible economics. The East Texas field suffered the same fate. No one remembers the conservation lessons, which are older than dirt.
That is great news but I would really like to see that resource husbanded and used as the premier heating fuel that it is now and will be for posterity. And by posterity I mean hundreds of years into the future. We used to think in those terms. About the well being of generations to come. Today, not so much. But when natural gas declines, what are folks going to do to heat their homes in the future? They will be forced to turn back to coal, with devastating consequences. Using natural gas for any purpose other than as a heating fuel amounts to generational warfare. We have the ability right now to make any incremental new electrical power generation needed with renewables and efficiency gains. If we were responsible we would use the gas for heating and make sure that it will always be there in the future at reasonable prices.
Coffee.
As you know, for each shale gusher, there are multiple dogs.
Check out the 29 well package Chevron has for sale on the Energy net auction. Marcellus.
Only 13 of the wells are producing. One has been plugged and one lease with a non producing well bore has expired.
Last 12 month’s average net is $208,000 per month. So $2.5 million annual net on 29 wells that cost at least $180 million, probably over $200 million?
The wells are 2011-13 vintage. They are producing gross gas of around 1000 mcfpd average per well. The shut in wells have huge shut in royalty provisions, close to $500 K annually.
Go check it out yourself. BTW, this is Chevron, for crying out loud. The same one that just lost $2 billion in 92 days in Q4 on North American upstream. That was with an average realized oil price of $37, which will be about $24 for January, 2016.
I encourage all to look at that package. It is reality, not slick company presentation.
Note the “Survivor bias” in the 1,000 MCFPD per well average number, with only 13 of the 29 wells currently producing.
I have observed that if I exclude the dry holes I drilled, I have had a 100% exploratory success rate.
All this talk, talk, talk about oil price. Not a word about the Paris agreement to CUT use of FF’s, and its implication of carbon tax. Why not??? Collective head in sand? Overwhelming desire to deny the painfully obvious?
I say again and have said and again, and again. The rise of competitive renewables is FAR faster than people here seem to think, its just the nature of any new tech, and the carbon tax, certain in my view, will be a huge booster to that liftoff.
Don’t believe me. And don’t bother calling me names. I’m not worth the powder and shot. Just go read Stanford and other renewables reports, and exchange broadsides with them.
I’ll be out in the shop doing something renewable.
wimbi,
We need technical progress and break through ideas for renewable technology. Electric cars, batteries, solar, wind, hydrolysis…. all these technologies are from their concept at least 100 years old and experienced just cosmetic improvements and economies of scale in manufacturing, yet no real technological advancement. They can only compete with fossil fuels over subsidies. If there is real technical progress, renewable technology will make it, yet it will not work with a top down political process over subsidies.
Hi Heinrich,
The subsidies are needed so that the industry scales up. Fossil fuel prices will rise within 10 years (especially oil) and this will make EVs and plug-in hybrids more competitive.
Wind and power plant scale PV in good locations are already competitive with coal and natural gas without subsidies. For wind I am thinking the Great Plains in the US, and for power plant scale solar I am thinking the Southwest US, Northern Africa, Central and South America, Australia, and the Middle East.
The cost of Wind and PV has decreased substantially in the past 20 years and will continue to decrease as the price of coal and natural gas rise due to depletion.
http://web.stanford.edu/group/efmh/jacobson/Articles/I/WWS-50-USState-plans.html
So as the inputs for wind and pv rise the price will go down? How do you figure?
Hi Jef,
It is relative price that matters. Also fossil fuel energy prices have been rising in general over the 2000 to 2013 period, but the cost of Wind and solar have been falling due to technical innovation.
Input costs have risen while the cost of the product has fallen.
This is a pretty common occurrence as technology develops.
Renewables, specifically wind and solar power, it is true, are not YET competitive in strict terms of dollars and cents, compared to fossil fuels, in most places. In an increasing number of places, they ARE competitive today, and will get to be more competitive every year.
But a strict dollars and cents comparision between renewables is ONLY ONE WAY to make the comparision, and for it to come out in favor of fossil fuels, it is NECESSARY for a fossil fuel partisan to DELIBERATELY OVERLOOK the ” off the books” costs of fossil fuels. These costs include, but are not limited to, direct environmental destruction from mining and drilling. They include the costs of millions of people suffering from various respiratory diseases, costing megabucks to treat, and megabucks more in lost productivity. They include the costs of maintaining larger than otherwise necessary military establishments, and actually sending men and machines to fight. They include the cost of paying the owners of fossil fuel companies profits which are sometimes absurdly high ( not recently ! ) and the lives of a lot of men killed and crippled by black lung disease etc.
AND THE WHOLE POINT of subsidizing renewable energy is to help the renewables industries grow BIG ENOUGH SOONER so as to displace fossil fuels faster.
The wind and sun vary greatly from one day to the next, but they NEVER DEPLETE, and the price of them will never go up. Neither we nor any other country needs to invade a neighbor country to obtain wind and sun , at least none among the countries with good wind and solar resources.
It is going to take a very long time for the renewables industries to scale up to the point that we can quit worrying about fossil fuel depletion, never mind the environmental consequences of depletion.
If we don’t help the renewables industries NOW, they will almost for sure not be big enough to matter, a decade or two down the road, when depletion is really starting to take a big bite out of the world economies ass.
No, renewables will NOT support business as usual, as we know BAU today. But renewables will EXTEND the life of todays BAU, and buy us a good bit of precious time, time we can use to improve energy efficiency substantially, and change our energy hog ways.
Renewables probably can support a new generation of BAU, a BAU LITE, for quite some time, by EXTENDING the useful life of depleting fossil fuel supplies.
I believe in the MARKET, and I believe in the INVISIBLE HAND.
But the market and the hand need time to do their work. If we wait until the price signal is there, waiting for the market to take care of scaling up renewables, it will be TOO LATE.
The consequences, if we make that mistake, are almost too awful to think about.
And no success is not assured, renewables may never giterdone, even in terms of a bau lite.
But FAILURE IS GUARANTEED if we just go our merry way, and burn thru the rest of the affordable oil and gas, and try to run the world on coal.
We won’t need a BIBLICAL HELL in that case, it will be hot enough people will not be able to live in the tropics at all anymore.
Heinrich. Thanks for the response. I didn’t expect any at all.
Yes, wind and solar and EV’s and all that are indeed very old. So is the IC engine, gas turbine, rocket and its guidance system. But look at a rocket of 1930 and one of today! Or an IC engine of that time and one today. Same old idea, hugely better implementation, for all the reasons all of us could name.
I was personally involved in the development of the ICBM from the days they routinely went boom on the launch pad to the days when my very capable grad school roommate phoned me “I have worked myself outta my job, I can hit a dime from half a planet away.”
His booster looked very much like the one I worked on in 1950.
My first PV had 12% efficiency and cost a ton of money. Latest purchase had 18% and cost 70c/watt. And they get better fast. Same basic idea, better details, string of minor improvements, bigger market.
My Leaf EV is ok for daily use,; it could easily be made far better by lots of obvious detail improvements.
I have worked on engineering R&D a long time and have seen astoundingly fast and clever development in all I have been involved with. After all, all we need to know is basic science, which we know very well, and all we need is will to get it done, and support to do it.
That last part is the hard one
ICBM. Purchase, or subsidy? EV?
dennis, oldfarmermac, wimbi,
Thanks for the reply. I am very much for renewables as I think as well it will be the future. However, wind and solar have its fundamental weakness, which cannot be overcome by incremental improvements. Most wind turbines have a capacity utilization of just 10%, for solar pv it is in many cases not much better, especially in the north. Even if costs come down, wind and solar pv can probably cover 10% of the total energy market as they need supplementary energy supply working as a stand by. This makes wind and solar quite expensive, even if unit costs come down. Solar cells have for instance also the disadvantage to work better at low temperature and lose productivity at higher temperature, which makes them less efficient in sunny states where they are most favorable to be implemented. I could list many more reasons. The most disappointing fact is that the research establishment concentrates most on political subsidies and not on technical progress.
I have no idea where you come up with the idea that most wind turbines have a capacity utilization of just ten percent. This is a complete and total bullshit misrepresentation of the capacity factor of a modern wind farm. Thirty percent or better is more like it.
It is true that a lot of solar pv has been installed in places where the capacity factor is not much better than ten percent, but this is not due to any inherent shortcoming in the technology itself. Properly sited pv generally gets closer to twenty percent.
A hell of a lot of capacity that is lightly utilized exists in many many industries, and we get along ok dealing with this light utilization. The average school bus for instance is used only about twenty hours a week, the school building itself only about fifty hours a week, the average highway is really busy only a few hours out of the day, I could go on about this for a week.I haven’t started a tractor this entire month, except to pull a neighbor out of a ditch due to his truck getting away from him on the icy road.
Will renewables support business as usual as we know it today?
NO. But renewables can and are gradually assuming a larger share of the burden, and as the renewables industries expand, costs WILL BE coming down, and sharply. We are just now getting to the point that a large number of relevant patents are expiring, and to the point that large scale LOW COST manufacture of wind and solar equipment is truly taking off.
Only a person who is poorly informed, or naively optimistic about the prospects for renewables, believes we are in for easy sailing and happy camping.
Times are going to be rough indeed, and we are going to learn how to get by on a minor fraction of the energy per capita we use today.
Most of the energy we use now , or to express it better, the energy we MISUSE today is wasted, after one fashion or another. THAT will change. The handwriting is on the wall in so far as the three ton beer fetcher is concerned, and so far as gallivanting about in airliners just for the fun of it is concerned.
It is true that renewables are expensive, but considering what fossil fuels are going to sell for, somewhere not far down the road, as depletion bites, and the population grows, renewables are going to be CHEAP by comparision.
Talk about renewables being able to handle only ten percent of the load is bullshit, on several levels.
First off, if you burn coal, to generate electricity, you lose at least fifty percent of the energy in the coal, getting the juice to the consumer. The figure is higher, actually, because getting the coal to the power plant costs a good bit of energy as well, etc.
Juice produced by a solar panel, on site, or nearby, is usefully utilized at close to a hundred percent rate.
A solar farm providing juice to recharge electric cars means energy efficiency from double to five times or better the energy efficiency of cars burning gasoline, depending on who you ask.
Fossil fuels are going to be PRECIOUS assets going forward, not to be wasted, when renewables can be substituted. Energy efficiency is going to be improved ENORMOUSLY, the process being driven by the steel toed boot of necessity impacting our collective backside, vigorously and often.
Nobody knows with any degree of certainty what will happen. Personally I believe more than half of the population , world wide, will perish as the result of overshoot, within this century, and that the rest of us are going to be living in very straightened circumstances.
But the amount of money pissed away on just one average new car here in the USA is enough to refurbish a typical house with lots of extra insulation, new windows and doors, and energy efficient appliances, with money left over for a high efficiency heat pump.
In the future we will be damned glad to drive super small low speed short range electric vehicles, rather than walk, or give up the sunk investment in suburbia. Forty miles range will get damned near every commuter in America to work and home again, and the ones who have farther to go will just have to either move or find new jobs.
The day of the retail clerk driving across town to work is finished. I know a woman a who has worked a fast food restaurant job for a decade, who tells me she will NEVER quit, for any reason, because the job is within walking distance of her home. This sort of thing is going to be our new reality, IF we are lucky.
Sure, renewable electricity needs backup. The backup capacity already exists, it is providing ninety five percent of our juice in the USA right this minute. We will be TEARING DOWN fossil fuel generating capacity, rather than building it, in terms of the big picture. Some new fossil fuel capacity will be needed of course, to replace obsolete or worn out existing capacity,and some will be needed that is better designed to accomodate fast ramping up and down, without wasting fuel.
But in terms of the big picture, the back up capacity argument is more or less pure bullshit, it already exists, and we are already paying many millons of dollars PER HOUR to supply it with fuel, hour after hour, day after day, week after week, year after year, until………….. well, until the fuel is no longer available.
Most wind turbines have a capacity utilization of just 10%, for solar pv it is in many cases not much better, especially in the north.
From the graph produced from data from the EIA’s Electric Power Monthly, it would appear that utility scale wind is averaging maybe 30% and never goes below 20%. Utility scale solar PV also appears to do better than 20% most of the time and approaches the mid thirties during the middle of summer. Of course, as Fernando so often points out, it would be foolish to site utility scale PV facilities where they do not get the highest capacity factors possible to maximize ROI.
Sez different
http://reneweconomy.com.au/2016/india-energy-minister-says-solar-power-now-cheaper-coal-29756
Also
http://phys.org/news/2016-01-rapid-energy.html
The main suggestion raised in this article is the build-out of a nationwide-
“specifically a new, high-voltage direct-current transmission grid (HVDC) to supplement the current electrical grid”
That’s one place I’d be all for my tax dollars going.
Right. Would be fun to compare HVDC to F35.
Cost/benefit. Time.
What is F35?
What is F35
A lot of taxpayer dollars…
http://www.cnbc.com/2014/07/31/how-dods-15-trillion-f-35-broke-the-air-force.html
The F-35 Joint Strike Fighter is the most expensive, and possible the most error ridden, project in the history of the United States military. But DOD has sunk so much money into the F-35 — which is expected to cost $1.5 trillion over the 55-year life of the program — that the Pentagon deemed it “too big to fail” in 2010.
The Baker Hughes Rig Count is out. US rigs down 18, oil rigs down 12, gas rigs down 6. Texas down 13. Canadan rigs down when they should be going up. They usually peak in February.
trouble with renewables in Mexico….
http://www.truth-out.org/news/item/34623-the-dark-side-of-clean-energy-in-mexico
This points to one of the main reasons I don’t like the push for “renewable” energy. It simply allows industrial civilization to continue along without actually cutting emissions. The goal is to allow things to keep going on as they are, growth to keep happening when everything is pointing at the fact that that simply can no longer happen if we want to survive.
Everyone is trying to save business as usual for the human race. Renewables will save us they say. No one is trying to save any of the other animals. They are all doomed. And none of the renewable crowd seems to give a damn.
No one is trying to save any of the other animals. They are all doomed. And none of the renewable crowd seems to give a damn.
To be fair I don’t hear much concern for saving the animals and the planet from the fossil fuel crowd either…
BTW, I’m not sure who everyone is, but I have repeatedly made the point that at best renewables might be part of a new lower energy consumption paradigm for a relatively small portion of humanity who make it through the bottleneck.
As for concern about the other animals, without them this will be a very sad planet indeed. I have personally witnessed declines in rain forests and coral reef ecosystems during the course of my life. Unfortunately you are right , we are without a doubt in the sixth extinction and most large mammals are probably already doomed.
To be fair I don’t hear much concern for saving the animals and the planet from the fossil fuel crowd either…
Well, that’s certainly very true. I did not mean to imply that the renewable crowd were the only ones who were anthropocentric. Hell, almost everyone is.
That’s just the point. We are Homo sapiens and to Homo sapiens, Homo sapiens is the only animal that really matters. I know, not everyone feels that way, only about 99 percent of the population feels that way.Heaven forbid, I did not intend to impugn everyone.
But understand I am not blaming everyone or anyone. Hell, how can you possibly blame all humanity for the plight of all humanity? It is just how evolution has molded us.
But why bring up such concerns at all, when talking about renewable energy?
If I buy a sandwich, I don’t expect it to cure my cold. If I buy a tractor, I don’t expect it to fly.
Why talk about wind farms, which are supposed to produce energy, and ask why they don’t save all the other animals??
What a stupid comment!
All solutions are by definition SOLVING for something.
What are “renewables” solving for…nothing that is relevant to the overlying constraints facing humanity and in fact I would argue they exacerbate the problem. Humanity has and uses an over abundance of energy. The real solution is how do we survive and prosper using just a fraction of it. Thats a tough nut.
A sandwich solves your hunger and that is all, no one proposes otherwise. Although put some hot peppers in it and it will help you cold. Get well soon.
What are “renewables” solving for
It’s solving for energy that doesn’t emit CO2 and other pollutants. No more, and no less.
A sandwich solves your hunger and that is all, no one proposes otherwise
Exactly. Wind solves for pollution and depletion and that is all, no one proposes otherwise. It doesn’t cure cancer (except, of course, cancer caused by fossil fuel pollution), and it doesn’t restore wildlife habitat (except, of course, wildlife habitat used for energy production – e.g., the very large amount of land used for oil wells, coal mines, hydroelectric dams, etc.).
The real solution is how do we survive and prosper using just a fraction of it.
Why do we need to use just a fraction of it, if it’s non-polluting and non-depleting?
Because it is about contextual/holistic/systems/multidisciplinary thinking Nick G.
Your sandwich may not cure your cold, but eating poorly– say, sandwiches with little nutritional value in them– will likely risk a cold.
We need to bring renewables– and assorted technology– into the larger picture, and often, if not usually, we simply don’t.
Anyway, I hope you are feeling and eating well.
The media fixated on the doom and gloom.
In the long run we cannot survive living the fossil fuel based business as usual economic system we use today, that is absolutely certain.
It is also certain that damned few of us would survive, if we were to suddenly be derprived of industrial civilization, excepting of course the peasants in rural India, who might not notice much change at all.
We have no choice but to push renewables and efficiency as hard as we can, and pray to the Sky Daddy of our choice for good luck.
What the world really needs is not a good five cent cigar. What we need is a disease, highly contagious, fast mutating, air borne, impossible to stop, that renders women infertile after having just one child. ( One man can keep twenty women pregnant, the solution must therefore primarily involve women if we want to bring about a managed population crash. )
Hi Old Farmer Mac,
You are looking at it from a male perspective. The disease (or perhaps vaccination) would be more effective if it rendered men infertile after fathering one child.
The man who has fathered one child should be given a free vasectomy and pay heavy fines for more than 2 children. In any case better education for women will result in less unwanted pregnancies as birth control when used properly is quite effective.
Free birth control for men and women is of course a no brainer (for me at least).
Ridiculous,
Birth control has to be done over women. Germany had 11 million military casualties in World War II (6 million wounded, 5 million dead). This is 75% of the army and 46% of the male population in 1939. Yet if we look at Germany’s population, we will be hard pressed to see a significant effect.
And unless you are planning on universal parenting tests, it is impossible to know from whose father is a child. Best available data indicates that about 3.7% of children are being cuckoed. With those rates, it doesn’t make much sense to take your family tree too far.
How well does paternity confidence match actual paternity?
Hi Jef,
Or perhaps many of the intelligent people here realize that growth cannot continue and that we need to transition to a no growth economy. This will undoubtedly be difficult and will not proceed smoothly, this is asserted without proof, but seems a reasonable assumption.
Population growth rates have been slowing down since 1970 or so and World population grew at a linear rate of increase rather than an exponential rate from 1970 to 2010. Total fertility ratios have been cut in half in the past 45 years and if they continue to decrease at half the rate achieved over the past 45 years for the next 35 years, then World population will peak in 2050 at about 8.5 billion and will start to decline. This will not be business as usual, it will be very different. Human population could decline quite rapidly if World total fertility ratios fall to the levels attained in Japan and South Korea, this will relieve pressure on animal habitats and on water, soil, and most other resources.
A key to population reduction is better education as data shows that better educated women have fewer children.
All of what you say is absolute common knowledge and has been known for decades which again makes me believe you are a computer.
None of what you say has any meaning as nothing has gotten better over those decades and in fact the race to destruction has only increased exponentially.
We are way past what you express in your comment being relevant. Earth to Coyne??????
Those things are junk. It is always possible to totally screw up a potentially excellent project by stupid or criminal decisions.
Sorry to say, I have seen several Spanish solar/wind projects of that sort. One of them cost me a huge opportunity.
BTW. I for one am voting for the animals. Best strategy, seems to me, is for lots of humans to be sacrificed for the animals to be enjoyed by the surviving humans.
I don’t have any life left, so I’m personally safe saying stuff like that.
” Best strategy, seems to me, is for lots of humans to be sacrificed for the animals to be enjoyed by the surviving humans.”
Wimbi, you need to vent your tool shed a little better, the fumes are getting to you.
Better watch it, bub, I think I still gotta few ICBM’s lying around in there somewhere.
Are they recyclable?
Yep. That old Atlas was just a thin pressurized ss can, ideal for storing the wood gas I’m cooking up these days. But does look sorta ominous lying there beside the shop.
Maybe should take off the fins, or at least the warhead.
Atlas #1 didn’t have fins.
Jeez, yer right, jj. So what IS that thing lying out there?, something we drug back from Peenemunde?
It’s a classic problem in lots of countries: poor people have no property rights, so they get no benefits from projects like these. So they make a big stink out of any problems (even if they’re relatively small, like most of those mentioned in this article), in order to try to get some kind of benefit out of them.
It’s a big reason why LTO works in the US, and not in other countries: Americans mostly own their mineral and air rights.
I don’t see that as an advantage. Fracking is terrible for the environment. In most modern countries mineral rights belong to the state, and the state is made by everybody (in democracies), so people have the right to oppose to fracking because the environmental bill is left for all to pay.
Personally, I am not worried about environmental damage 1 1/2 miles or more underground where fracking occurs.
You really chose your handle well!
Rockman always says it’s not the fracking that’s the problem, it’s the disposal of the waste water.
You should be concerned by the contamination of about 50 billion liters of water every year.
This would be unacceptable in my country.
How does that happen with fracking???
Fracking and water consumption
Fracking and water pollution
I’m not an advocate of solving our PO problems on the supply side, but I find it frustrating for people to not have a clear sense of the magnitude of our various problems. In particular, fracking water consumption is simply not a big problem. For instance, your 1st source says:
[t]he amount of water needed to drill and fracture a horizontal shale gas well generally ranges from about 2 million to 4 million gallons, depending on the basin and formation characteristics.
Well, 2-4M gallons is only about 50-100k barrels of water. That’s roughly half the oil that’s likely to be produced. So, we’re exchanging water that costs maybe a penny per barrel for oil that goes for $30-$100 per barrel. The fact that we’re paying a premium for the water because it has to be trucked in doesn’t change that: water is very, very cheap and is far more valuable for oil production than it is for it’s major competing use, agriculture. For instance, one pound of beef takes about 45 barrels of water. So, what’s more valuable: 90 barrels of oil, or one pound of beef??
————————————————
I know this is going to set off people’s alarm bells about water scarcity, so I’ll add this:
“Most water problems are readily addressed with innovation,” said David G. Victor of the University of California, San Diego. “Getting the water price right to signal scarcity is crucially important.”
The signals today are way off. Water is far too cheap across most American cities and towns. But what’s worse is the way the United States quenches the thirst of farmers, who account for 80 percent of the nation’s water consumption and for whom water costs virtually nothing.
Adding to the challenges are the obstacles placed in the way of water trading. “Markets are essential to ensuring that water, when it’s scarce, can go to the most valuable uses,” said Barton H. Thompson, an expert on environmental resources at Stanford Law School. Without them, “the allocation of water is certainly arbitrary.”
There is enough water; we can live within our means,” said Jim Lochhead, chief executive of Denver Water. “But the systems we have in place simply do not have enough flexibility to move water to the places where it is most needed.”
The price of water going into Americans’ homes often does not even cover the cost of delivering it, let alone the depreciation of utilities’ infrastructure or their R&D. It certainly doesn’t account for other costs imposed by water use — on, say, fisheries or the environment — caused by taking water out of rivers or lakes.
Consumers have little incentive to conserve. Despite California’s distress, about half of the homes in the capital, Sacramento, still don’t have water meters, paying a flat fee no matter how much water they consume.
Some utilities do worse: charging decreasing rates the more water is consumed. Utilities, of course, have little incentive to discourage consumption: The more they did that the more their revenues would decline.
Their water rights are primarily subject to state law. In the West, they have been allocated by a method that closely resembles “first come first served.” The first farm that drew water had a right to whatever it needed pretty much forever. Junior users — who arrived later — had to stand in line.
Farmers pay if the government brings the water to the farm, say via an aqueduct from the Colorado River. But the fees are minimal. Farmers in California’s Imperial Irrigation District pay $20 per acre-foot, less than a tenth of what it can cost in San Diego. And the government has often subsidized farmers via things like interest-free loans to cover upfront investments. (An acre-foot is the amount it takes to cover one acre of land a foot deep in water.)
This kind of arrangement helps explain why about half the 60 million acres of irrigated land in the United States use flood irrigation, just flooding the fields with water, which is about as wasteful a method as there is. It also helps explain why underground water reserves declined by 53 million acre-feet between 2003 and 2014, about twice the volume of Lake Mead.
This is hardly the only obstacle to conservation. A farm that doesn’t use its full allotment of water risks forfeiting it for not putting it to “beneficial use.” And any water saved automatically flows to other farmers with junior rights.
markets must play their part. “Without prices or trade,” said Robert Glennon, an expert on water at Arizona University’s College of Law, “we will just get more diversion of rivers, more dams and more wells.” And nothing will be fixed.
http://www.nytimes.com/2014/10/15/business/economy/the-price-of-water-is-too-low.html
I know this is going to set off people’s alarms about water scarcity, so I’ll add this:
“Most water problems are readily addressed with innovation,” said David G. Victor of the University of California, San Diego. “Getting the water price right to signal scarcity is crucially important.”
The signals today are way off. Water is far too cheap across most American cities and towns. But what’s worse is the way the United States quenches the thirst of farmers, who account for 80 percent of the nation’s water consumption and for whom water costs virtually nothing.
Adding to the challenges are the obstacles placed in the way of water trading. “Markets are essential to ensuring that water, when it’s scarce, can go to the most valuable uses,” said Barton H. Thompson, an expert on environmental resources at Stanford Law School. Without them, “the allocation of water is certainly arbitrary.”
There is enough water; we can live within our means,” said Jim Lochhead, chief executive of Denver Water. “But the systems we have in place simply do not have enough flexibility to move water to the places where it is most needed.”
The price of water going into Americans’ homes often does not even cover the cost of delivering it, let alone the depreciation of utilities’ infrastructure or their R&D. It certainly doesn’t account for other costs imposed by water use — on, say, fisheries or the environment — caused by taking water out of rivers or lakes.
Consumers have little incentive to conserve. Despite California’s distress, about half of the homes in the capital, Sacramento, still don’t have water meters, paying a flat fee no matter how much water they consume.
Some utilities do worse: charging decreasing rates the more water is consumed. Utilities, of course, have little incentive to discourage consumption: The more they did that the more their revenues would decline.
Their water rights are primarily subject to state law. In the West, they have been allocated by a method that closely resembles “first come first served.” The first farm that drew water had a right to whatever it needed pretty much forever. Junior users — who arrived later — had to stand in line.
Farmers pay if the government brings the water to the farm, say via an aqueduct from the Colorado River. But the fees are minimal. Farmers in California’s Imperial Irrigation District pay $20 per acre-foot, less than a tenth of what it can cost in San Diego. And the government has often subsidized farmers via things like interest-free loans to cover upfront investments. (An acre-foot is the amount it takes to cover one acre of land a foot deep in water.)
This kind of arrangement helps explain why about half the 60 million acres of irrigated land in the United States use flood irrigation, just flooding the fields with water, which is about as wasteful a method as there is. It also helps explain why underground water reserves declined by 53 million acre-feet between 2003 and 2014, about twice the volume of Lake Mead.
This is hardly the only obstacle to conservation. A farm that doesn’t use its full allotment of water risks forfeiting it for not putting it to “beneficial use.” And any water saved automatically flows to other farmers with junior rights.
markets must play their part. “Without prices or trade,” said Robert Glennon, an expert on water at Arizona University’s College of Law, “we will just get more diversion of rivers, more dams and more wells.” And nothing will be fixed.
I’m not an advocate of solving our PO problems on the supply side, but I find it frustrating for people to not have a clear sense of the magnitude of our various problems. In particular, fracking water consumption is simply not a big problem. For instance, your 1st source says:
[t]he amount of water needed to drill and fracture a horizontal shale gas well generally ranges from about 2 million to 4 million gallons, depending on the basin and formation characteristics.
Well, 2-4M gallons is only about 50-100k barrels of water. That’s roughly half the oil that’s likely to be produced. So, we’re exchanging water that costs maybe a penny per barrel for oil that goes for $30-$100 per barrel. The fact that we’re paying a premium for the water because it has to be trucked in doesn’t change that: water is very, very cheap and is far more valuable for oil production than it is for it’s major competing use, agriculture. For instance, one pound of beef takes about 45 barrels of water. So, what’s more valuable: 90 barrels of oil, or one pound of beef??
The price of water is not the issue being discussed. Water is a critical resource that is limited in many parts of the world. While agriculture returns the water to the atmosphere, the oceans and underground aquifers ready to be used again, fracking pollutes it and we actually have to make sure that it is not returned without proper treatment.
Many Americans are so self-centered that they fail to understand why the rest of the world has not bought on the fracking revolution. It is a scam. That oil is being obtained on massive amounts of debt and money expansion and has very serious environmental problems. The oil price crisis is putting an early end to it, but it was only a temporary solution as was always unsustainable. That it was only developed in the US was a big clue when it is quite common all over the world:
http://www.eia.gov/analysis/studies/worldshalegas/images/fig1map_large.jpg
The price of water is not the issue being discussed. Water is a critical resource that is limited in many parts of the world.
No, if it were priced properly, it would be much less limited.
Shortages are a classic sign of improper pricing.
we actually have to make sure that it is not returned without proper treatment.
Sure. That’s not hard to do. Fracking water can be recycled, quite easily.
…the fracking revolution…is a scam. …it was only a temporary solution as was always unsustainable.
Well, if we include externalities, that’s true of most oil production. We should kick the habit, ASAP.
That it was only developed in the US was a big clue when it is quite common all over the world:
No, it’s a sign of underdeveloped property rights in most of the world, combined with a much more sophisticated oil industry in the US.
“Most water problems are readily addressed with innovation,” said David G. Victor of the University of California, San Diego. “Getting the water price right to signal scarcity is crucially important.”
The signals today are way off. Water is far too cheap across most American cities and towns. But what’s worse is the way the United States quenches the thirst of farmers, who account for 80 percent of the nation’s water consumption and for whom water costs virtually nothing.
The global agriculture is very heavily subsidized in the developed world. It is very easy to see why it has to be so. I won’t insult your intelligence telling you why.
The global agriculture is very heavily subsidized in the developed world.
Actually, it’s heavily subsidized everywhere. Farmers don’t pay the real cost of their water, and they should.
It is very easy to see why it has to be so.
Well, no. It’s a terrible idea to give farmers free water. They should be charged a little. Just a little. But, enough so that we’re not growing rice in the desert.
That’s what it’s all about: misallocation of resources. Using 90 barrels of water to produce one pound of beef, when there are much better uses for water.
All of that contaminated water ended up in the Flint, Michigan municipal water system! Imagine that!
If you live in the US, don’t drink the water!
It is contaminated! Time to get a clue!
I know your lying eyes can’t believe it, but it is true!
Pay attention! Pay attention to the exclamation points!
You know how they lie all of the time!
Pre-FID and US Lower 48 future drilling cumulative production by breakeven prices to 2025
Source: Wood Mackenzie
http://www.woodmac.com/analysis/PreFID-oil-projects-global-breakeven-analysis
Summary of Woodmac analysis:
Half of oil production from future developments is uneconomic at US$60/bbl Brent. These comprise of conventional projects which have yet to receive final investment decision (pre-FID) and future drilling in US onshore Lower 48 plays; which are critical for future oil supply.
By 2025, production from pre-FID projects and US Lower 48 future drilling could be nearly 15 million b/d. Only 7.6 million b/d comes from projects which achieve commerciality at US$60/bbl, a likely screening criteria.
Production from most future developments is required to fill the supply gap between declining commercial fields and projected growth in demand.
Under our Macro Oils supply-demand outlook over 22 million b/d is needed from new developments by 2025 to meet demand. We expect the pre-FID pipeline to contribute around half of this. However, the number of deferred pre-FID projects is growing as the oil price remains low. Without significant structural cost deflation, the majority of these projects, are at risk of further delay or a major overhaul of development plans.
Prices need to support the development of the next tranche of supply. This breakeven analysis provides support for an oil price floor in the longer term of above US$70/bbl.
Deepwater and ultra-deepwater projects sit high on the cost curve and are at greatest risk of delay. Production from Angola, Nigeria, US Gulf of Mexico and Brazil is at risk due to weak project economics. Over 80%, or around 16 billion barrels, of deepwater and ultra-deepwater reserves are uneconomic at $60/bbl.
The economics are relatively robust within onshore, tight oil and shallow water projects. In fact US Lower 48 is now the key low cost area and by 2025 contributes 70% of volumes produced under $60/bbl.
Woodmac expects ~102 mb/d of global oil production capacity by 2025.
This is more optimistic than the IEA World Energy Outlook forecast, which projects similar number only by 2040
source: https://aleklett.wordpress.com/2016/01/20/is-the-world-drowning-in-oil/
And, finally, global liquids supply projections by Exxon
EIA Annual Energy Outlook 2015
Total global liquids supply in 2040: 136 mb/d,
or 133 mb/d excluding refinery processing gains.
or 129 mb/d ex. proc. gains and biofuels.
Note, that AEO 2015 was issued in early 2015 and apparently prepared in late 2014, when oil prices were significantly higher.
The AEO 2015 projects Brent price at $71 in 2016 gradually rising to $141 (in $2013) by 2040.
I expect AEO 2016 global liquids supply projections to be lower than last year’s issue.
Ooops, wrong numbers!
Below is the corrected chart and numbers:
EIA Annual Energy Outlook 2015
Total global liquids supply in 2040: 121.7 mb/d,
or 118,8 mb/d excluding refinery processing gains.
or 114.5 mb/d ex. proc. gains and biofuels.
Note, that AEO 2015 was issued in early 2015 and apparently prepared in late 2014, when oil prices were significantly higher.
The AEO 2015 projects Brent price at $71 in 2016 gradually rising to $141 (in $2013) by 2040.
I expect AEO 2016 global liquids supply projections to be lower than in last year’s issue.
Is Peak Oil also Peak Woodmac?
If they showed a chart with declining production would anyone use their services anymore?
Maybe that is why they are so “optimistic”.
The “Yet to be found” and “Yet to be developed” looks suspicious since it is exactly the amount needed to keep us on the same level as today for conventional production.
How can they predict we will find more oil 2040 than in 2025? Sounds fishy.
Sorry, I thought that was a WoodMac chart not an IEA chart.
Shows what I know.
Having worked for some consulting companies (not in oil), sales and billable hours trumps everything (except anything that risks legal claims against the owners /partners personal assets).
Otherwise you will go out of business and not exist.
If WoodMac is predicting a better scenario than that chart Alex posted, it is sales commissions and/or billable consultants.
Anyway…I should probably let the smart guys discuss…lol
Enhanced recovery don’t seem to get much credit here. 🙁
Notice that the IEA don’t have us reaching 80 mbd, C+C, until 2030, a point that the EIA says we are at today. They, the IEA, has us at about 75 million barrels per day today. My guess is that is about right.
Ron,
The IEA has conventional oil + tight oil+oil sands + GTL and CTL at ~75 mb/d and NGLs at @ 15 mb/d in 2014
Total (ex. biofuels and processing gains) ~ 90 mb
The EIA has conventional oil + tight oil+oil sands + GTL and CTL at ~79.4 mb/d and NGLs at @ 9.5 mb/d in 2014
Total (ex. biofuels and processing gains) ~ 89 mb
The IEA has included all OPEC NGLs and condensate in global NGLs number.
The EIA apparently classifies large part of OPEC NGLs and condensate as condensate (part of global conventional C+C).
(Total OPEC NGLs and condensate production in 2014 was 6.36mb/d)
Same condensate vs. NGLs shit 🙂
Hi AlexS,
Thanks for the clarification. Looks like about 4-5 Mb/d of condensate is produced in the World. As long as this can be easily blended into liquid fuels (such as gasoline) at refineries, it makes sense to call it “oil” as there is a wide range of stuff we are willing to call oil (such as bitumen).
We have been counting crude plus condensate for a long time, excluding C2, C3, and C4 makes sense to me, but excluding C5 does not. Just one person’s opinion.
Dennis,
the IEA is including only OPEC crude in global C+C numbers both in the monthly reports (OMR) and WEO.
NGLs and total OPEC condensate is classified as NGLs.
For other countries, the IEA includes condensate in C+C.
The EIA somehow separates “OPEC NGLs” into NGLs and lease condensate. The later is included in global C+C numbers.
The EIA puts US Lower 48 C+C production in excess of 45 API Gravity at about 2 million bpd in 2015 (so total US 45+ in 2015, inclusive of Alaska, was presumably a little in excess of 2 million bpd), and OPEC 12 Implied Condensate* was 2.5 million bpd in 2014.
The US and OPEC 12 combined accounted for 53% of global C+C production in 2014.
In any case, as I have previously said, the issue of crude versus condensate quality is something of a red herring.
My point is and has been is that the data strongly suggest that actual global crude oil production (45 API Gravity and lower) has been on an undulating plateau since 2005, while global gas and associated liquids, condensate and NGL, have so far continued to increase.
*EIA OPEC 12 C+C less OPEC 12 Crude Only, subject of course to usual caveats about data quality
Given that for the past five years oil discoveries have been getting steadily less (and I think this year so far there may not have been any really new ones – only a some gas and one oil confirmation find) and that reservoir growth has mostly been associated with large, conventional fields, of which there are no more, the “yet to find” wedges in all these charts might be a bit optimistic.
Why does the “yet to be developed” wedge expand continuously? This implies that discoveries we know about would be bought on line over the next 25 years and more and be able to compensate for decline in previous (new) developments plus add more capacity (i.e. they’d be growing in development size over time). It should surely look like a bulge with a taper to zero over time.
Presumably the NGL, oil sands and tight oil sections have their own components of development required, maybe a larger proportion than for the conventional oil as well. There’s a lot of development money needs to be spent to fill the gaps, and pretty much from a standing start where we are at the moment.
Why does the “yet to be developed” wedge expand continuously?
George, that is mostly OPEC “proven” but undeveloped reserves that the IEA assumes will be brought on line as needed.
OPEC claims 1.2 trillion barrels of reserves. And about two thirds of that is “yet to be developed”. And it will forever remain “yet to be developed” because it does not exist.
Why does OPEC lie about its oil reserves?
Hi Ron,
I disagree with the 2 out of 3 barrels missing and the 400 Gb OPEC reserve estimate.
Jean Laherrere estimates OPEC 2P reserves in 2010 at about 500 Gb for C+C less extra heavy (which leaves out Orinoco belt reserves in Venezuela) and that is a very conservative estimate.
Most astute observers realize the Orinoco reserves are overstated and indeed for these 220 Gb of claimed reserves, the 2 of 3 missing barrels may be apt.
For the C+C less extra heavy OPEC reserves in 2010, BP has 940 Gb. Based on Jean Laherrere’s estimate it would be roughly 1 out of 2 barrels are missing.
I agree OPEC overstates its reserves. I think that the 1 of 3 barrels is real graphic (which is cute) overstates the “missing barrels” case.
I disagree with the 2 out of 3 barrels missing and the 400 Gb OPEC reserve estimate.
I don’t. I think 400 Gb is likely an overestimate. That is, if OPEC’s estimate of Non-OPEC reserves of 286.9 billion barrels is anywhere close to being correct. Not counting bitumen or oil sands, OPEC does not have more reserves than Non-OPEC.
Every country in the world produces every barrel they possibly can. And the more oil they have to produce the more oil they do produce…. on average that is. According to the EIA, Non-OPEC produces 58% of the world’ C+C and OPEC produces 42%. To assume that OPEC has three times the proven reserves as Non-OPEC is truly absurd. How can anyone believe such shit?
Hi Ron and Dennis, I too am very skeptical of OPEC stated oil reserves. Any country that does not open its geological data to peer reviewed studies should be highly suspect.
I’d be very interested to see a future global oil production analysis as per Dennis’ previous methods but using a 400 Gb OPEC reserve and 286.9 billion barrels non OPEC.
Hi Jimmy,
See
http://oilpeakclimate.blogspot.com/2015/02/the-oil-shock-model-with-dispersive.html
Pessimistic scenario with 2200 Gb of C+C less extra heavy (oil sands) and 500 Gb of extra heavy oil (total C+C URR of 2700 Gb).
This scenario matches the URR of Jean Laherrere, and assumes extraction rates decline from 2025 to 2045 (due to war or GFC2). Annual decline rates are mostly between 3 and 4% over that period.
Hi Ron,
If OPEC countries have chosen not to develop all their reserves as quickly as non-OPEC nations to keep prices high, then we would expect the R/P ratios to be different in different nations.
I think I will go with Jean Laherrere on this one (except he ignores increases in reserves due to revised estimates [aka reserve growth] so his URR estimates tend to be on the low side).
If OPEC countries have chosen not to develop all their reserves as quickly as non-OPEC nations to keep prices high, then we would expect the R/P ratios to be different in different nations.
Dennis, did you even bother to research this before you made that silly statement. OPEC countries, on a few occasions, chose to choke back production but they have never chose not to develop resource to keep prices high. Most OPEC nations peaked well after OPEC was formed. They have increased development since OPEC became an organization.
If the Middle East OPEC nations had the same PE as the rest of the oil producing nations they would have four times the production they currently have, or one third the reserves. No amount of not developing reserves to keep prices high could possibly have made that kind of difference.
Dennis, honestly, sometimes ????
Hi Jimmy,
Another scenario with URR=2700 Gb (as before), but with extraction rates remaining constant after 2025 at 8.6% of proved producing reserves (extraction rate estimated at 7.3% in 2015).
Note that I believe that a URR of 2700 Gb for the World is too low by at least 400 Gb so output is likely to be higher than shown here
Annual decline rate remains under 2% until 2022 and rises to a maximum of 3% in 2029 and falls back to 2% in 2067. This is an optimistic scenario with no World War 3 or Great Depression 2, GDP growth slows, but the World finds a way to muddle through.
Ron – that makes sense, thanks. If I was country or region with 800 billion barrels of undeveloped reserves that’s what I’d be talking up. I wouldn’t be promoting tight gas and renewables to free up oil for export; or pre-salt, deep sea exploration to find new reserves (which is what Saudi and Kuwait have been doing), and we wouldn’t be seeing , what looks like, peaks for most of the OPEC members developing (if you assume a peak is at about 50% depletion they shouldn’t be peaking for a good few years yet if there are another 1.2 trillion barrels available).
For oil remaining now I think I’d go with Sadad al-Husseini from a few years ago (2010) who indicated there are maybe only 1.2 to 1.5 trillion barrels left (found and unfound). Since then we’ve produced about 150 billion and maybe 100 to 200 billion might not be there or can’t be developed (in Arctic and Deep Sea). So we may have only 850 to 1150 billion left now, which would put us well past 50% URR (although maybe condensate and NGL may be higher and compensate somewhat).
Assuming these cost numbers are in the ball park I maintain there is an alternative response to rising price leading to increasing supply; and that is rising price causing sluggish to negative demand growth.
Or more precisely rising price causing demand softening, restraining that price rise. This then feeding back to weaker investment and forward supply therefore [paradoxically] putting upward pressure on price, that in turn affects demand. In short: a tense and confused market exhibiting considerable volatility, for the foreseeable.
Add to this political,technological, and social changes; specifically Climate Change, EVs, and urbanisation, which will affect consumption, over time. Therefore I am much less confidant about the demand predictions above.
After all there is usually a good fit between supply and consumption; arguing that demand is exogenous to supply and price, is naive. Even given the well understood tight elasticities for energetic inputs.
So, suggesting:
lower price -> lower supply ->price response -> weaker demand response -> weaker price rise = volatile price + continued lower supply
Instead of:
lower price -> lower supply -> higher price + steady demand growth = steady higher price + higher supply + steady demand growth.
We are no longer in the 20th C. This time it will be different. High cost oil, I believe, will be left in the ground, or at least will be left in the ground for much much longer, and will not be squandered on the school and latte ICE powered SUV run. The questions, as ever are really around time scales, and the nature of the developing nations’ energetic development . The west is a mature market:
Patrick,
“High cost oil, I believe, will be left in the ground, or at least will be left in the ground for much much longer, and will not be squandered on the school and latte ICE powered SUV run”
US private cars fleet in the easiest target. Everything else (trucks, airplanes, boats, ships), are just wishful thinking. We need a technology breakthrough to change the current picture of oil consumption in those areas.
So what is the mechanism for cutting number of SUVs in the USA that you somehow envision, except $120 bbk oil price and above $4 per gallon gasoline ?
What mechanism?
The shift to EVs, lower per capita VKT, and more efficient ICE vehicles.
Planes, trains, ships, and trucks are a second order issue, in fact we can keep powering them on oil for a very long time if we stop pissing the stuff away on personal transport. Jet powered air travel is just so useful and unrivalled over longer distances and water that will be the last activity we hang on to. Trains and trucks offer no technical barriers to electrify, simply sunk cost in the current technology, they will transition, but both FF powered trains and ships are more efficient than trucking.
The timescale will be relatively long, and obviously the supply and price of existing inputs plays a vital role in the transition. The inevitable transition to EVs is taking longer than some hoped and those that say it isn’t, or more incredibly, can’t happen simply latch onto that phenomenon.
Air travel over long distances is cheap per passenger mile, true enough, but how much air travel is actually PRODUCTIVE of anything?
The average person either NEVER gets on a plane, or gets on a plane once every few years.
Methinks the air travel industry is going to get the living shit taxed out of it, eventually, when the twenty people who drive finally figure out that the airlines, and the one person who flies often, are getting over by not paying any fuel tax.
Of course I also believe that most people are not going to be driving, very much, if at all, eventually, and that the non drivers will have the clout to put a lot of tax on gasoline and diesel fuel even here in the USA. Not soon, but eventually.
Because of global warming all fuel should be taxed – including all of it used for farming and manufacturing.
Patrick,
I think that, with the continued decline in oil use per unit of GDP, $90-100/bbl by 2020-2025 should not have a significant negative impact on global economic growth and oil demand.
Demand growth is projected to slow down anyway, but not necessarily due to high oil prices.
Hi AlexS,
You may be correct that oil prices may not be the main reason for a reduction in demand, it will be a combination of slower population growth, maturing economies, and reduced oil intensity (oil use per unit of GDP). The oil price is simply the mechanism that allocates the oil to its most efficient uses (when externalities are properly taxed and the subsidies for oil use are minimized so the market is allowed to work.)
What happens to the price of oil depends on the change in the supply of oil relative to how demand for oil changes over time. How this plays out in the future is difficult to predict at best.
Hi PatrickR,
There will certainly be responses on both the supply and the demand side.
When the peak is reached, supply will either remain flat or decline regardless of the price of oil. The price of oil will affect mostly the rate of decline (high oil price will reduce the decline rate ceteris paribus). There will also be a demand response to high oil prices over the medium to long term (3 to 10 years), with higher oil prices (I am thinking $150/b or more in 2016$) leading to better urban design, more public transportation, goods shipped by rail, electrification of rail and water shipping, more plug-in hybrids and EVs in rural areas, possibly excess renewable energy used to produce hydrogen to power fuel cell vehicles in rural areas, along with the development of an HVDC grid.
These will be the types of responses to the cost of all fossil fuels rising as the peak in energy output from all fossil fuels might be in 2027. The scenario below is based on medium scenarios for oil (URR=510 Gtoe of C+C+NGL), coal (URR=510 Gtoe or 1050 Gt), and natural gas (URR=490 Gtoe or 19,000 TCF).
The total URR is about 1500 Gtoe (billions of tonnes of oil equivalent) or 63,000 EJ (exajoules=1E18 J). This is about the same as Steve Mohr’s medium (case 2) URR for all fossil fuels which was 61,000 EJ (1460 Gtoe). The scenario peaks in 2027 at 13.1 Gtoe/year and decline rates for all energy from fossil fuels remain under 1.5% per year until 2056 and remain below 1.9% until 2100. For comparison 2014 fossil fuel output was 11.5 Gtoe/year.
This scenario assumes demand for fossil fuels remains robust until 2070 and can be seen as the maximum possible output given the URR assumptions. A major World recession and/or a relatively fast transition to an increased use of wind, solar, geothermal, nuclear, and other types of non-fossil fuel energy would reduce the output of fossil fuels relative to this scenario.
Thanks, AlexS, but what a clunky graph.
Alarm bells on energy companies debt
From the International Business Times:
http://www.ibtimes.com/wave-corporate-defaults-could-be-coming-financial-watchdog-warns-2283019
== quote ==
A financial watchdog set off the alarm bells on corporate debt Wednesday in its annual report to Congress. With companies feeling growing pressure from painful exchange rates and energy prices, the U.S. is at a higher risk of seeing a wave of corporate defaults, the report said.
The report from the Office of Financial Research, a division of the Treasury Department, listed credit risk as one of the top three financial stability dangers facing the economy in 2016….
It’s not just oil companies that are exposed, however. Regional banks that lend to the energy industry could suffer as a result of a default wave, the OFR report noted, adding that “the ultimate magnitude of losses in these industries and regions is uncertain.”
== end of quote ==
Moody’s recently downgrading 175 energy-related companies. S&P downgraded Chesapeake Energy.
From OilPrice (http://oilprice.com/Finance/investing-and-trading-reports/Here-Are-175-Resource-Companies-On-The-Verge-Of-Financial-Upheaval.html )
== quote ==
S&P said Monday it has cut its 2016 and 2017 forecast for WTI crude by 20 percent. And also dropped its forecast price for Henry Hub natural gas by 15 percent for the next two years.
That prompted S&P to issue an immediate credit downgrade on one major oil and gas player: shale specialists Chesapeake Energy. A move that caused a single-day, 16 percent fall in Chesapeake’s share price….
The real pain will come when these firms need to refinance debt. Chesapeake, for example, has $2 billion in liabilities coming due in 2017 (against a current market capitalization of just $2.1 billion)…
Here is a chart, I made Jan 2015. (Oct 2014 production data)
County………………BPD …….. % production… #Rigs…% rigs
Dunn……………….182988…….16…………………. 27……..16
McKenzie ……… 378584…….34………………….60 ……..36
Mountrail………..258350……23…………………30………18
Williams………..160808……..14………………..37……….22
Divide…………… 41163……….4…………………. 5………….3
Here is the same chart Jan 2016 (Nov production numbers)
County………………BPD …….. % production… #Rigs…% rigs
Dunn……………….203132…….22…………………. 10……..17
McKenzie ……… 391710…….44………………….20……..33
Mountrail………..236998……11…………..………5………20
Williams………….182109……..13……….………..6……….15
Divide…………… 32862……….2.7……….……. 3………….3
Mountrail is the big looser, down from 23 to 11% of ND oil production, with not a big drop in rig count. Possible DUC season in Mountrail?
Dunn and McKenzie seem to be the gainers in percentage terms and total production.
It seems the last post Ron did on the individual counties was June last year. Maybe it is time for Ron to have another look on how the individual counties are performing?
Toolpush – at 4:17 am I am not fully awake either. But, if Mountrail’s 236,998 BPD is 11% of total ND oil production, then 100% of ND oil production computes to 2,154,527 BPD.
Clueless,
It was late at night here, lol. Now you see why I would like Ron to do his excellant wok to get the real numbers, lol
At least a few major papers are beginning to take notice of Venezuela.
Read this and weep , or laugh until you cry, considering the Three Stooges level of competence of the Maduro regime.
https://www.washingtonpost.com/news/wonk/wp/2016/01/29/venezuela-is-on-the-brink-of-a-complete-collapse/?tid=pm_pop_b
Venezuela’s net exports (total petroleum liquids + other liquids) were probably between 1.5 and 2.0 million bpd in 2015.
One would think that we may be seeing some very large migrations out of Venezuela this year, given the ongoing economic collapse.
http://www.usatoday.com/story/news/world/2016/01/29/venezuelas-capital-worlds-most-murderous-city/795085
http://www.france24.com/en/20160129-video-reporters-venezuela-chavism-its-way-out-chavez-maduro-opposition-electio
I think the whole region will soon be on foot.
South and Central America has a virtual monopoly on cities with the highest murder rates.
https://en.wikipedia.org/wiki/List_of_cities_by_murder_rate
http://www.insightcrime.org/news-analysis/central-america-gangs-are-more-dangerous-than-ever
Given other stresses like corruption, peak oil, crime/gangs, climate change etc etc. I think North America will soon experience its own wave of unregulated mass migration from failed states to its south.
1/2 My usual end of the month comparison b/t the latest EIA Texas data and my corrected RRC data: here is #crude+#condensate
2/2 … here is natural gas (gross withdrawals)
Thanks Dean,
It seems that the decline in C+C output decelerated from August or September.
Am I reading your chart correctly?
yes for C+C,
Dec 2014 Dean EIA
Jan 2015 3394190 3373000
Feb 2015 3483297 3462000
Mar 2015 3576088 3644000
Apr 2015 3527772 3589000
May 2015 3456171 3524000
Jun 2015 3421311 3460000
Jul 2015 3428596 3452000
Aug 2015 3396610 3413000
Sep 2015 3426804 3415000
Oct 2015 3406844 3398000
Nov 2015 3388846 3401000
while the opposite is true for natural gas:
Dean EIA
Jan 2015 23998587 23607000
Feb 2015 24349601 24039000
Mar 2015 24509658 24087000
Apr 2015 24656283 24210000
May 2015 24430995 23999000
Jun 2015 24408344 24975000
Jul 2015 24464501 24891000
Aug 2015 24403659 24325000
Sep 2015 24502127 24368000
Oct 2015 24205605 23796000
Nov 2015 23935607 23782000
Thanks.
So C+C output in Texas was flat from August to December, similarly to North Dakota for most of 2015.
Thanks Dean,
[Edit] Sorry, indeed Dean already reported daily output (not monthly).
He has already done that. Dean’s data is already in barrels per day.
Yes, it is the daily output for both C+C and natural gas
At times there are numerous comments questioning the reliability of oil production figures reported by various countries and by different outfits sucth as the IEA etc.
No doubt there are serious errors.
What I would like to know, is this.
How big do you guys who crunch a lot of numbers think the errors are ?
How much higher, or lower might the true total world wide production of C plus C be , if it were possible to know?
How big might the errors be in the worst case countries?
OFM,
The errors can be very big.
In the World Energy Outlook 2008, the IEA projected global total liquids demand at 106.4 mb/d by 2030.
In the latest WEO-2015, they are projecting 103.5 mb/d by 2040.
The trend in the past 10 years was towards lower medium and long-term supply and demand projections
Generally speaking, when dealing with massive amounts of data, the “errors” largely offset each other. That is, if almost every figure is subject to being either to high or too low, after adding them all up, the total is surprisingly close to what the “real” total should be. Obviously, if you could posit a situation in which every number is likely to be too high (or too low) that would not be the case. So, with an individual country, like say Venezuela, maybe it is off by a significant amount.
clueless,
As regards global oil (liquids) supply and demand projections, there were not just statistical errors, but very significant conceptual errors. All agencies have been significantly overestimating global demand and supply.
These are the most important data points on earth, and they are not known to high confidence.
This is what one would expect.
Countries strive for victory over their enemies. They have nothing to gain by providing accurate information.
If I were China, I’d make oil production a state secret, too.
Hi Watcher,
I doubt China is playing games with reported oil production capability. I had an office in Harbin for many years where most of my time was spend assessing reserves for NA oil companies who wanted access to Chinese oil. As such I was in contact with numerous local oilmen who freely gave me access to their reservoir data. The Chinese were duplicitous in one respect, in my opinion, by leading American companies into believing they were entertaining potential JV partners when, in fact, they simply wanted to massage business contacts in general. On China’s production I expect the following is accurate:
“… China’s crude oil output has stagnated for the past two years despite intense drilling activity on land and offshore. In late 2014, CNPC essentially threw in the towel on its workhorse field, Daqing, announcing that it would allow the field to essentially enter a phase of managed decline over the next five years. Under this new approach, the field’s oil production will fall from 800,000 barrels per day (kbd) in 2014 to 640 kbd by 2020: a 20 percent decrease. To highlight the importance of PetroChina’s decision, consider that Daqing currently accounts for approximately one in every five barrels of oil currently pumped in China – on par with the role Alaska’s massive Prudhoe Bay field has played in US oil production…”
http://thediplomat.com/2015/07/china-peak-oil-2015-is-the-year/
Good data. That does refer to only 20% of the total. If you were China and had zero incentive to be accurate, what would you tell the world?
If you were China and had zero incentive to be accurate, what would you tell the world?
The thing to remember is that Chinese provinces are a power unto themselves: not unlike the US in some ways. Beijing is out there, yes, but it’s not like Moscow determining what everyone in Siberia has for lunch. So, what Heilongjiang provincial geologists say is not really filtered through Beijing for some national ulterior motive; they are pretty straight shooting guys (at least on a one-on-one basis). Therefore, if you know your source info is mostly reliable. That’s my opinion anyway.
Thanks guys, but I did not mean to ask about PREDICTED oil production but rather about ACTUAL production, this year, and in past years.
If for instance Saudi Arabia says last years production was ten million barrels per day average, exactly, how far off do you think that might be, one tenth of a percent? two percent?
Some countries are going to be notorious liars of course, and their figures might be off by ten percent or more.
But even though the total reported world production might be wrong by a percent or more, in either direction, up or down, the TREND in reported production still ought to be accurate.
The trend in the reported quantity of oil available on international markets ought to be likewise accurate, even though the actual reported quantity of oil available on world markets might have been off by a percent or even two percent or more.
Historical demand and supply numbers are constantly revised, but in most cases revisions are not too big.
Revisions of the US oil production numbers were relatively big in 2015.
I would assume that EIA has error margin close or above 100,000 bbls/day. So the accuracy of EIA data is just two significant digits maximum. The fact that they provide more digits is just an attempt to be a better Catholic then Pope, if you wish ;-).
Generally they should have strong institutional bias toward lower oil prices and that bias can influence their oil production and consumption numbers. So it is rational to assume that they tend to overestimate the production and underestimate consumption growth. In other words they are predisposed to “revealing” oil glut even if it does not exists.
The margin or error is different for different types of oil with those areas that are served by pipelines more precise (offshore is one example here).
Some people like Steve Brown recommend reducing their production numbers by 100,000 bbl/day just in case 😉
http://oilprice.com/Energy/Energy-General/Is-The-EIA-Too-Optimistic-On-US-Oil-Output.html
The author of this article unbelievably incautious:
http://www.slate.com/articles/health_and_science/science/2016/01/zika_carrying_mosquitoes_are_a_global_scourge_and_must_be_stopped.html
I wonder if/when gene modification technology gets to the point where any person can mail-order some kit and self-teach what kinds of things will be released into the wild and what kinds of intended and unintended consequences might occur?
Frank,
Wonder no more! Welcome to the 21st century. You can already purchase such kits today! It’s a great way to teach your kids about the basics of genetic modification allowing you to create your own GMOs at home.
Check out this Canadian company in case you want to buy your own kit.
https://synbiota.com/welcome
Just as a heads up, Chevron is yielding 4.95%. Exxon 3.7%, Occidental 4.3%
The 10 yr US T note is at 1.92% and Chevron is at 4.95%. Let’s add !!!!!
(Japan 10 yr instrument 0.1% (5 yr instrument -0.06% [that’s a minus sign]. US 5 yr instrument 1.33%)
Germany 10 yr is at 0.3%. Germany 5 yr paper -0.31%.
The Euro oils Total 6%, BP 7.4%, RDS 8.6%. Euro oils usually yield more than US because they are slower to raise their divvies.
(sports fans, those negative interest rate means you have to pay the Japanese or German governments interest if you want to lend them money. They get money from you for borrowing. Come to think of it, that’s like borrowing money to drill shale wells and not repaying it.)
(sports fans, those negative interest rate means you have to pay the Japanese or German governments interest if you want to lend them money. They get money from you for borrowing. Come to think of it, that’s like borrowing money to drill shale wells and not repaying it.)
LOL! and there are still people out there who are worried about Communism! 🙂
I suddenly seem unable to add attachments to posts here. Shame as the GIF at this site is a great piece of data visualisation and shows just how dynamic big infrastructure really is. US electricity generation by type and State 1990-2014:
http://reneweconomy.com.au/2015/graph-of-the-day-watch-us-electricity-grid-evolve-before-your-eyes-30882
Yeah, that is a very cool animated GIF! The reason you can’t attached it to your post is because it is about 2 MB in size and the file size limit on Ron’s site is about 50 Kb max.
Patrick, try attachments that are under 50Kilobytes. That should work.
Of course the forecasts by WoodMac, IEA, EIA, etc are little more than posturing. Predictions, after all, are claims on the present, not information from the future. Whoever controls the image of the future controls resources now. Conservatives want you only to fear terrorism and not pollution, and Conservationists the reverse [I like those two words; they have the same root of course].
Here for example are driving predictions from English Department for Transport and Washington State DoT. Like every single Transportation Dept [read; road builders] they constantly predict more driving for ever and ever. No matter how many years they get this wrong, they’ve got to predict more because these predictions set their budgets for ever more fancy-arsed road projects.
Are WoodMac really going to say growth in the sector is over? Haha. And the alphabet institutions [EEEEEIIIIAAA] are extrapolationists, they’re never going to catch discontinuity.
Dang, won’t accept the attachments again; here’s the link:
http://transportblog.co.nz/2014/02/19/our-insane-traffic-projections/
I can offer only anecdotal evidence, and my seat of the pants impressions, but I live among mostly lower class working people,people who necessarily drive to work, because driving has historically been cheaper than living in town, all things considered, so long as they drive older cars, or buy new ones and drive them till the wheels fall off.
But in recent years, the cost of driving even an older car has gone up substantially, with insurance taxes, tags , repairs , and generally rising prices for used cars, etc, more than offsetting currently lower gasoline prices.
So -I think I see a trend towards people holding onto jobs close to home, and deliberately taking jobs closer to home, even if the pay is somewhat less than they could get driving farther. The folks I know that rent are definitely looking at driving costs when considering whether to stay or move.
In a lot of localities just the cost of liability insurance alone is enough nowadays to allow a family to pay a couple of hundred bucks more rent, and get by with one car, or two cars, instead of two cars, or three cars, with one person dropping off the other, or one taking mass transit, or finding a job very close to the rental housing.
And again,while I cannot prove it is having a serious influence on total driving, localities seem to have made a deliberate policy of robbing poor people given ANY sort of traffic offense ticket, for instance an expired local tag, in addition to the state tag, two or three hundred bucks, with a lot of people simply unable to pay fines running into four figures and simply having to give up driving as a result.
Two hundred bucks for failing to buckle a seat belt means an hour to a dentist or lawyer, but it means an ENTIRE WEEK take home pay for a minimum wage clerk.
This sort of thing disturbs me, because it FORCES poor people who are trying to be self supporting to take all sorts of additional chances, driving on a suspended license for instance, in order to keep their jobs. You can manufacture criminals out of thin air, playing hard core.
OFM – I guess that someone will put a contract on me for saying this. But, the “poor” have demanded so much more in government “services” that it is financially straining almost every governmental body. Free medical, free food stamps [that they sell (otherwise, WTF is with billions of $ having to be given to food banks, and all the money that schools spend feeding children for free – I mean, where do you think that their drug/alcohol money comes from)], free housing, free family services to protect abused children, free cell phones, free internet service, etc, etc. NOT AN INDICTMENT OF ALL, BUT OF MANY. So, you have unintended consequences, like a $200 seat belt fine. We could double taxes on EVERYONE to try to cover these costs, but it would just double the people that would now want those entitlements – I mean services, for free.
clueless, fer crimminie’s sake! Have you been living under a rock at back of some enormous cave for the last couple of decades?! Are you truly completely oblivious as to what has been happening in the world? Work and jobs are simply disappearing because of technological disruption and that will only increase at an accelerating rate!
Did you perchance read a link I posted on the consequences of driverless trucks on employment and the US economy?
Have you not been following what has been happening with AI?
Maybe read this essay by Derek Thompson
http://www.theatlantic.com/magazine/archive/2015/07/world-without-work/395294/
A World Without Work
For centuries, experts have predicted that machines would make workers obsolete. That moment may finally be arriving. Could that be a good thing?
“At this festive season of the year, Mr. Clueless, … it is more than usually desirable that we should make some slight provision for the Poor and destitute, who suffer greatly at the present time. Many thousands are in want of common necessaries; hundreds of thousands are in want of common comforts, sir.”
“Are there no prisons?”
“Plenty of prisons…”
“And the Union workhouses.” demanded Clueless. “Are they still in operation?”
“Both very busy, sir…”
“Those who are badly off must go there.”
“Many can’t go there; and many would rather die.”
“If they would rather die,” said Clueless, “they had better do it, and decrease the surplus population.”
——————-
“Business!” cried the Ghost, wringing its hands again. “Mankind was my business. The common welfare was my business; charity, mercy, forbearance, and benevolence were all my business. The dealings of my trade were but a drop of water in the comprehensive ocean of my business!”
——————–
Clueless,
After my Mother divorced my abusive, morally and financial bankrupt father, she took her high school education and became a dental assistant, unfortunately to a psychologically and occasionally physically abusive Dentist who shit all over his ‘girls’, except that one who was daughter of a local Mob Boss.
I benefited from Section 8 housing, Medicare, food tamps, and school lunches.
After our several years of hand-up, not hand-out, from society, my Mother secured a better job and worked 30 years in that hard (but non-abusive) job and earned a small but livable pension, and I have been working for some 40 years nearly continuously (starting when I was a young pup with a paper route making $50/week). My Bachelors of Science and Masters and all my other higher Education has been paid from Merit scholarships and out of my pocket. Today it is rather possible that I could buy and sell you. I never have complained about paying my taxes, and I have given generously to charity.
I guess I and my family should have just died, so you could have a couple more dimes in your pocket after the tax man came.
.
Hi Clueless,
I hear ya , loud and clear. The tendency of the welfare system to create dependence, and destroy self reliance, is the greatest single flaw , imo, of any socialist sort of governing philosophy.
Everyday of my life, I live and deal with people, not as a social worker, but as a neighbor, relative, friend, employer, victim, bystander, of people who have for the most part CHOSEN to live on welfare. This is to say, once they get on it, they find it so agreeable they choose to manipulate the system so as to STAY on it.Staying on is not nearly so hard as one might think. I know plenty, personally, of people who have the free cell phone, who would not take a job taste testing pie. It IS altogether possible to live for decades without ever holding a steady job, while having beer, cigarettes, cable tv, a cell phone, and sixty hours a week OFF rather than on, as was the case with my entire family, BACK WHEN PEOPLE WERE ASHAMED TO LIVE ON WELFARE.
Now I am ashamed to admit it, but I have relatives who do as much casual work as they can find, so long as it pays cash,and pays well, deal a little dope, spend months in the woods poaching deer, which is fine because there are WAY TOO MANY DEER here , and otherwise taking the rental assistance, the food stamps , the free school lunches, the free cell phone. They often drive a car registered to somebody else, more or less permanently.
So far, at least to the best of my knowledge, none of my relatives who are not ALREADY in jail are not committing armed robberies, although I know of a couple who make a good portion of their living in stolen goods. Anything to avoid that old TIME CLOCK”!
BUT, having been subjected to “REEDUCATOAN” , after the fashion of the modern left leaning socialist model prevailing in the social sciences, and ruling the roost in the university system, I know this is NOT THE FAULT of the people living this way, it’s the FAULT OF RICH REPUBLICANS!!!!!!!!!!!!!!!!!!!!!!!!!! Sarcasm light blazing!
My actual take , being a Darwinist, thru and thru, is that life expands to fill every available niche, and naked apes being uncommonly adaptable, very quickly learn to take advantage of this easy way of eating and sleeping in a warm place, out of the rain and snow. Playing cards, smoking a joint, a hit of meth, screwing and watching tv all day is a damned sight more pleasant than actually going someplace and fucking WORKING all day.
So, I do not BLAME these people at all, although you could not tell from my fiery prose up to this point. They are doing exactly what everybody else is doing, more or less, which is living as easily and as well as they can, taking things as they can, one day to the next. They didn’t write the rules, they are just playing by the rules.
Incidentally, I have played the game myself. Back in my working days, I used to go into a nuke and work maintenance shutdowns seven twelves for a couple of months, bringing home some very respectable money, and then take the unemployment compensation, for as long as I could get it, by applying only for jobs that paid as well as the temporary nuke work. There were none, of course, WITHIN COMMUTING DISTANCE, so I was perfectly legal, and used the extra money to extend my time in MY WOODS in MY CAMPER, reading,entertaining sexually liberated ladies who believed in sex without marriage, and indulging in various illegal habits I best not describe in detail !Some of the time I came home and worked on the farm. Some of the time I worked at building stuff for myself, which was also legal, because this did not generate any cash income. So I am keeping warm tonight with one of my custom made wood stoves I built while on welfare thirty years ago.
Now having said ALL THIS, I hear Fred Maygar just as loud, and just as clear!
I hear our new member ” Your Name IS Apt” just as loud, and just as clear, as I hear Fred.
I got my own degree in large part as the result of liberal government making it possible for a backwoods farm boy from a proud, self supporting but damned hard up family go to off to university, by way of scholarships and easy loans, even though I had no credit record.
Talking about a bumpkin that fell off the turnip wagon and down the rabbit hole into a strange new world! Wow!
I was the first, but for damned sure not the last, my baby sister is now a retired professor, my other surviving sister is number two in a large industrial organization, etc. A good many relatives are now but true professionals, of the medical, engineering, accounting, legal kinds. ( Only a couple known to me personally reside long term at the GRAYBAR HOTEL. ) Most got a helping hand on the way up, one way or another. The professor sister got her start as a private in the army, and retired as a commissioned officer. The other surviving sister got some basic training in bookkeeping and office procedures at that fine local educational establishment known as a community college, and has worked her way up without benefit of a four year degree.
My deceased brother never got out of junior high school, but he died reasonably well off, as the result of just playing “by the rules” working hard and smart and not wasting his money.
FRED is dead on , times are changing so that even when people are willing to work, finding work that pays enough to live is now impossible for millions and tens of millions of people.Finding any work at all is often an impossibility.
We are collectively in a hell of a spot, between the devil and the deep blue sea, between a rock and a hard place, put it any way you like.
We have a tiger by the tail, no way to turn it loose without it turning on us, and devouring us.
We are damned if we do, and we are damned if we don’t, in terms of supporting people who cannot find work , or who choose not to look for work, on welfare.
Where this will all end is anybody’s guess, but I am personally convinced it will end VERY badly, because I see it all as part and parcel of OVERSHOOT, economic and biological.
It all keeps me awake many a night, but being a Darwinist, it does not puzzle me, it does not leave me wondering WHY. Mother Nature never put any brakes on the evolutionary engine, except in cases where they are NEEDED.
No brakes have ever BEEN needed, until very recently, where humans are concerned. So we get EXCESSIVELY fat, since the fat storage mechanism has no brakes, when excessive quantities of high calorie food are available.
ENOUGH of us will survive to preserve our species, until one day none of us survive. In the GRAND SCHEME of things, the Earth will continue to orbit the sun, until the sun expands and vaporizes the Earth.
There is a slight chance a few of us might make it to the stars.
Now here is an astronomy question for DOUG.
How far out would a planet have to be to survive ? Pluto might look pretty decent one of these days, and apparently there is at least one full sized planet even farther out, not yet actually SEEN, but there.
Here for example are driving predictions from English Department for Transport
Is that like Shakespeare On The Road?
http://shakespeareontheroad.com/
Sorry couldn’t resist 🙂
Patrick,
“Of course the forecasts by WoodMac, IEA, EIA, etc are little more than posturing. Predictions, after all, are claims on the present, not information from the future. Whoever controls the image of the future controls resources now. ”
Well said. Thank you!
“Whoever controls the image of the future controls resources now. ”
That’s what propaganda is about. Agencies such as EIA and IEA are as much propaganda outlets as they are statistics gathering bodies. As we all know there are three types of lies: “Lies, damned lies, and statistics”.
As Watcher observed: “Countries strive for victory over their enemies. They have nothing to gain by providing accurate information.”
I read the other day that there are more solar indtsry jobs in the U.S. than oil industry jobs.
While I am a champion of increased solar and wind energy production, as well as increased energy efficiency, I also prefer to deal with facts. Fortunately, the internet has outlets offering facts as well as those offering lies.
http://www.politifact.com/new-hampshire/statements/2016/jan/29/hillary-clinton/hillary-clinton-claims-more-jobs-solar-oil/
To be fair, a comparison between solar jobs and oil jobs seems to miss the mark…since solar energy is output to society as electricity, perhaps it would be more appropriate to compare the number of solar industry jobs to the number of jobs in the coal industry, wind power industry, nuclear power industry, etc.
At any rate, having energy to power human society is a concern that stands by itself, without primary regard to how many jobs it entails…in other words, energy is the ‘master resource’ for all other societal endeavors, and not a jobs program. The necessity for and quest for ‘full employment’ and the related need for people to have the means to live are related but separate discussions.
Always the argument is between the trend and the status quo. BAUists will insist we look backwards by demanding data which of course can only be historical. This is an important corrective to theory but never shows the whole picture, because it always of course supports no change, or at most an extrapolation of the past. Never fundamental change.
Why won’t oil’s future follow where coal is now? I find this at least a highly plausible possibility. It is not unlikely that a combination of electric supply and climate policies will strand a great deal of oil at any price. How, economics of course:
http://www.huffingtonpost.com/entry/fossil-fuels-terrible-investment_us_56aa3463e4b05e4e37037321?ir=World§ion=us_world&utm_hp_ref=world&utm_content=bufferd6ac7&utm_medium=social&utm_source=twitter.com&utm_campaign=buffer
What is always less clear is how long this takes, if I have learnt anything following global change is that it usually both takes way longer than I first think, and then can also happen very suddenly: Straws do break camels’ backs.
“Why won’t oil’s future follow where coal is now?”
Because predictions are difficult, especially about the future. So far coal was partially replaced in the only role where new technologies are somewhat competitive — electrical power generation — and this happened not only because the rise of wind and solar, but also because the price of natural gas dropped so substantially. Without the last factor the situation might reverse itself. Not everywhere coal is replaced. High quality coal is indispensable in metallurgy.
Everything depends on technologies available. Actually the initial idea of diesel engine was to run it on coal powder. It failed. But now with the new level of technology achieved I wonder if something along those lines (“nanoparticles”) might be feasible at least for large ships.
At some level of oil prices coal might also be used to produce liquid fuels for transportation like Germany did during the WWII.
Natural gas is also well positioned to penetrate heavy truck and marine fuel markets if the price remains low.
Nah, you’re not really trying. Predictions are especially hard if you refuse to use your imagination.
Yes coal has been substituted by gas and renewables, that’s right, oil too has been substituted where possible by other Fossil Fuels, but why won’t that substitution continue through battery technology? I see no barriers. The cost curve will out. Over time, and not 100% anytime soon or even ever, but enough to deal with, or even cause, a decline in production.
I like Dennis and probably everyone else here assumed the mechanism of transition would be high oil price, but I can now see how low price can also have the similar effect, and perhaps quicker. It quite literally leaves the stuff in the ground, as we know ever rising production as predicted by WoodMac et al requires massive new investment, and low price kills that.
Or, what I now think is most likely, a volatile and uncertain price trajectory, demand drifting away at the hint of price rise, but supply shrinking on each price retreat. The kind of scene that will make it easier for fund managers to acquiesce to Climate pressure and disinvest in the sector….
Just a possible scenario.
> I can now see how low price can also have the similar effect, and perhaps quicker.
Looks like wishful thinking along the lines of proponents of “peak oil consumption” hypothesis. I think it was first voiced by Gail Tverberg. While oil consumption can really stagnate I strongly doubt that this will happen at prices below $200 per barrel. At least it did not happen at price over $100 per barrel. In other words there are not much facts that can support this hypothesis and it remains in the domain of wishful thinking.
One supporting fact is that Western Europe oil consumption is pretty stagnant, but price of gas is Western Europe is extremely high in comparison with the USA and as a result an average personal car is much smaller. Europe is also much smaller and trips are shorter. 60 miles (roundtrip) commute to work is unusual for Europe. So this is the price mechanism that limits consumption.
If current low oil price regime continues indefinitely in the USA and gas shortages arise, the rise of price is the most plausible solution. Otherwise people might well soon start killing each other to get a full trunk of gas instead of switching to hybrids or electrical cars. Also quick increase of the amount of electrical cars on the roads will kill the US grid, especially at summer when air conditioning is on.
I personally think that this hypothesis is wrong and the only way to limit consumption of hydrocarbon fuels is to raise oil prices dramatically (say, above $100 per barrel).
“why won’t that substitution continue through battery technology? I see no barriers. The cost curve will out.”
I am all for electrical cars but unfortunately technology is not here and hybrids will eat electrical cars for lunch for now. Repeat after me: pure electrical cars can’t compete with hybrids in the current car marketplace with the current level of technology. And it is not clear to me that they will ever be able to complete with hybrids.
Are you aware that there are serious scientific limitations of battery technology (amount of energy that can be stored chemically per kilogram of battery weight) that disallow battery storage of energy to become competitive with hydrocarbon fuels (ever). So outside limited applications like small personal cars with short range (less 200 miles per charge; currently twice less then that within $30K per car cost limit) this technology has little or no chances. Google is your friend.
Also battery powered cars are bad for winters as battery capacity falls when the temperature decrease; while the cost of electrical air conditioning dramatically increases cutting the range and creating health risks — think about Alaska climate and risk to be frozen is the snow when battery is out of juice ) , so they are more suitable for southern states. But for southern states the danger is battery fires, which is especially high for high capacity lithium based batteries that need to be air conditioned to decrease this risk.
This is an endless and fruitless discussion that can’t change mind of “red eye electrical car enthusiasts” and I kind of regret that I wrote this reply.
Real simple facts on the ground from a pragmatist and car non-enthusiast.
Our Leaf cost no more than average for that year – 2013.
It is far less expensive to run and takes near no maintenance.
It does almost all we have ever asked of a car, which isn’t much, and my wife thinks it’s the “best car we ever owned”. She likes the cushy feel, the sound system, the quiet, and most, that she never has to stand in the frigid windy snow filling the tank. She brags about all of that to her friends.
Today one of those friends bought an identical used one for 1/3 what I paid for mine. Looks to me like a bargain.
BTW, I use my somewhat oversized PV array to keep the Leaf full, so no load on the grid.
5 Scientific Studies That Prove Republicans Are Plain Stupid
Even though being conservative doesn’t make you stupid, there’s no doubt that being stupid makes you more likely to be conservative.
This article is obviously controversial.
great article. love this part. people don’t “choose” who they are. We are our brains and how they work.
Unfortunately for them, the study “Political Orientations Are Correlated with Brain Structure in Young Adults” was released. The researchers in this study performed MRI scans on participants. Just so you know, there’s no way to insert liberal bias into an MRI scan.
No, but one can certainly publish a load of junk science using fMRI. fMRI has extremely low resolution and specificity. Academic radiology has suffered from a rush to publish. http://blogs.scientificamerican.com/guest-blog/controversial-science-of-brain-imaging/ or google “junk science fMRI”
Robert Wilson MD Radiology ret.
I will defer to Robert on the fMRI.
However, I will go to my grave that humans are brains (created by genetics+environment), and we don’t actually choose anything.
Did this guy “choose” to have tree roots growing out of his hands?
http://www.dailymail.co.uk/news/article-3424150/Bangladeshi-man-suffers-rare-condition-causes-tree-like-roots-grow-hands-feet.html
I just farted. Not my choice!
I just love articles like that.
Homophobia Linked To Low Abstract Reasoning Skills
I couldn’t agree more.
As fuel crisis grips Nepal, solar industry eyes growth
http://goo.gl/xfhPIq
After enduring endless blackouts in Nepal’s months-long and ongoing national fuel crisis, management consultant Pankaj Shrestha finally splurged on a set of solar panels for his home in Kathmandu.
“First there was no cooking gas available, so we bought an electric cooker. But then there was no electricity, so how could we cook anything?” the 52-year-old asked.
With power outages lasting up to 15 hours a day and the price of diesel used to power generators soaring, the Himalayan nation’s solar industry is eyeing a boom in sales.
Looks like that immense oil glut isn’t evenly distributed around the world. When the shit hits the fan it is still better to have some energy as opposed to no energy…
“It is impossible to say when Nepal’s energy crisis will be resolved,” Shrestha told AFP.
“We have spent millions on diesel generators every year. Solar is not cheap, but at least it will be a one-time investment.”
This. The transition is accumulative as well as substitutive. Renewables and efficiency will grow to replace fossil fuels as sources of primary energy, but over time. And importantly they will all exist concurrently, particularly in our lifetimes. This is why I fail to convinced by Gail’s uber-doom model. Certainly much that we may consider permanent will change. but it isn’t a zero sum game:
http://www.zerohedge.com/news/2016-01-30/another-nail-us-empire-coffin-collapse-shale-gas-production-has-begun
Zerohedge calls collapse of US shale. I realize zerohedge business strategy is shock and awe, but this articles has heaps of charts and stuff that might be enjoyed by some on here.
https://www.yahoo.com/news/stone-age-horror-pit-filled-severed-limbs-uncovered-140419878.html
” The people who met such violent deaths were likely farmers who also herded animals and lived in villages, Chenal said. While in the past, archaeologists painted a picture of Neolithic life as idyllic and egalitarian, newer finds paint a far darker picture.
“Neolithic societies are stratified societies and ‘war’ (armed conflicts) were probably very common,” Chenal said. “Furthermore, we have other clear evidence of violence for the time, when the limbs and bodies were deposited.”
Another article from Mark Harrison over at Oilpro.
http://oilpro.com/post/21938/let-contagion-begin?utm_source=DailyNewsletter&utm_medium=email&utm_campaign=newsletter&utm_term=2016-01-29&utm_content=Article_2_txt
Let The Contagion Begin!
What is most important is that Lease Operating Expenses (LOE’s) are bloated to $15-$40 per barrel. Yes, LOE’s alone. Add finding costs for proven undeveloped reserves (PUDs) and those reserves become written off almost immediately. If one deducts from the above WTI benchmark of $31.50 even a modest $4.00 per barrel quality and basis differential, the margin squeeze (if there is any) because of high LOEs and field price differentials becomes catastrophic.
“What is most important is that Lease Operating Expenses (LOE’s) are bloated to $15-$40 per barrel. Yes, LOE’s alone.”
Where these numbers come from????
Oasis last week reported preliminary 4Q operational results.
WTI (NYMEX) $42.07
Realized Price for Oil (ex hedges) $37.67 – $37.87
Oil Differential 10.0% – 10.5%
Natural Gas ($ per mcf) $1.85 – $2.10
LOE (per boe):
4Q15: $6.80 to $7.00
2015: $7.80 to $7.90
http://oasispetroleum.investorroom.com/2016-01-28-Oasis-Petroleum-Inc-Announces-Select-Operational-Results-Preliminary-Financial-Results-and-Reserve-Information-for-2015-and-Its-Preliminary-2016-Outlook
I just finished creating a basic interactive presentation that shows the oil production from the Niobrara shale, in Weld county (CO).
https://www.rt.com/business/332159-us-shale-oil/
Nothing new here. But you have Totals CEO and Igor Sechin now on record.
“The price of oil is unstable right now; it can stand at $40 a barrel today and reach $80 a barrel tomorrow…,” said Total’s CEO.
The price of shale oil on the US market has fallen by two-thirds while production by 15 percent, according to the head of Russia’s Rosneft Igor Sechin. “Shale oil production in the United States will decline in the long-term and reach bottom by 2020,” Sechin said.
[…] Source link […]