The Baker Hughes International Rig Count is out.
The rig count data in all charts below is through February 2016.
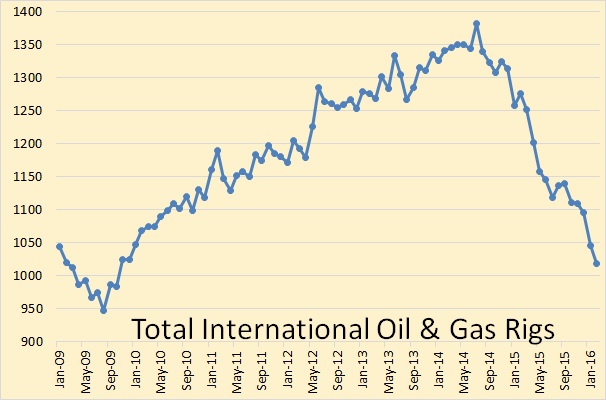
The Baker Hughes International Rig Count does not include the US, Canada, any of the FSU countries or inland China. It does include offshore China. That rig count peaked in July 2014 at 1,382 rigs and in February stood at 1,018, down 364 rigs from the peak.
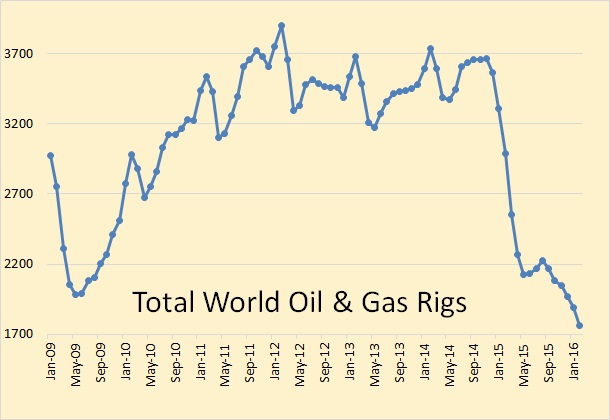
The Baker Hughes total world rig count does include US and Canada but not the FSU or inland China. That total oil & gas rig count stood at 1761 in February, down 52% since December of 2014.
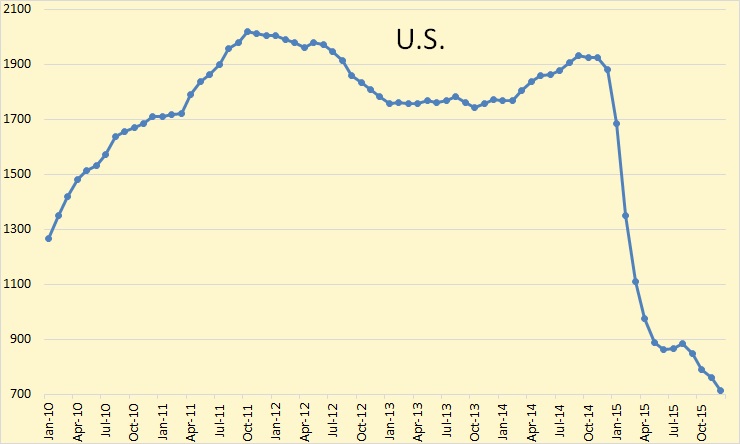
The US monthly total rig count stood at 532 in February, down 72% from November 2014.
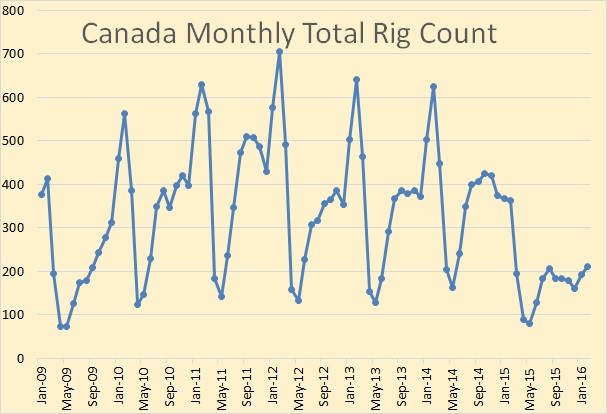
The Canadian total rig count usually peaks in February. It did not in 2015 but stood at 211 this February which will likely be the peak for 2016. That count is down from 626 rigs in February 2014, down over 66%. That was the last pre-price crash February peak.
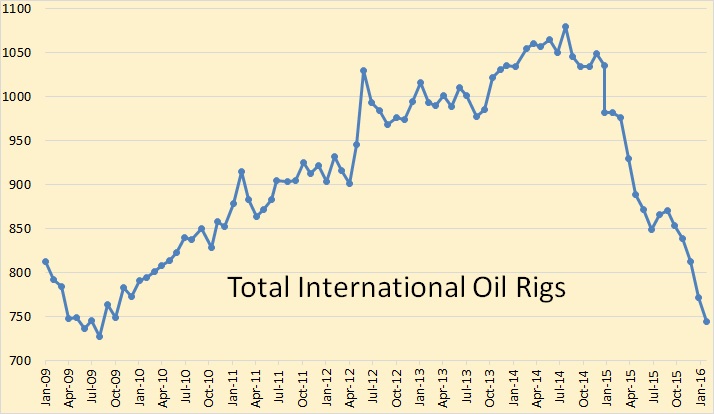
Looking at oil rigs only, total international oil rigs dropped another 28 rigs in February to 744 rigs. That is down 336 rigs or 32% since the July 2014 peak.
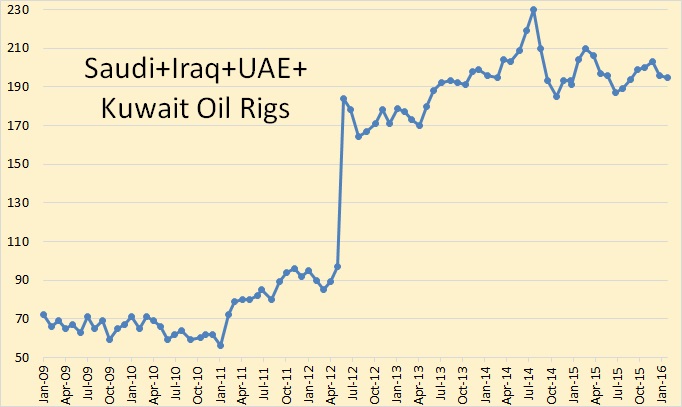
Four nations where the rig count has not collapsed is Saudi Arabia, the UAE and Kuwait and Iraq. The huge jump you see in June 2012 was due to Iraq going from 0 rigs to 78 rigs.
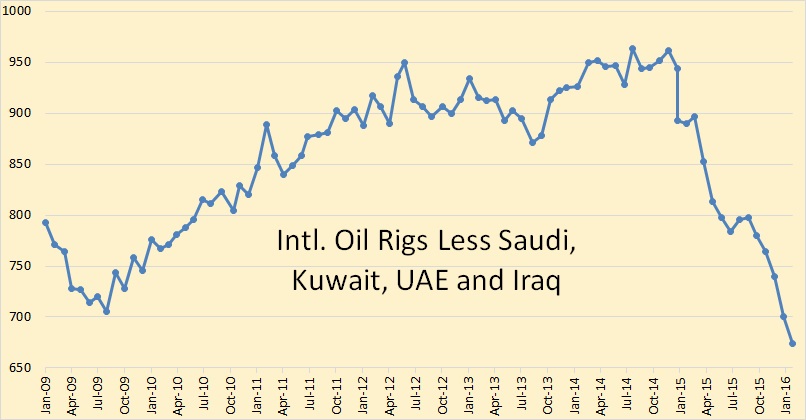
International oil rigs, less Saudi, UAE, Kuwait and Iraq peaked in July 2014 and have declined 30% since that date.
But what has all this done for production… so far.
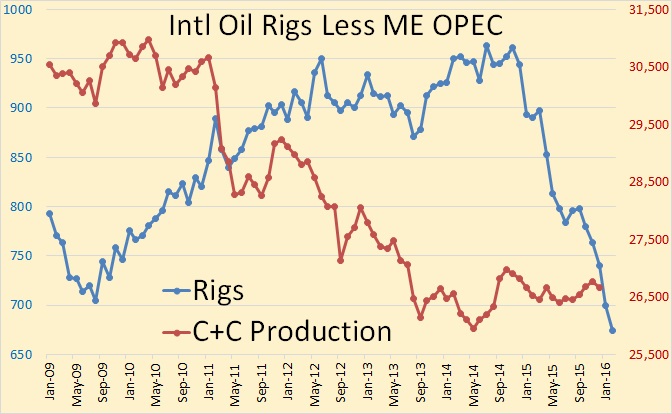
The production data, right axis, in the above chart is only through December while the rig data, left axis, is through February. Production fell all through the rise in rig count then began to plateau in mid 2013. The rising rig count did not increase production but the falling rig count will almost certainly cause it to decline… after a delay of one to two years of course.
Again, the above oil rig only charts does not include the US, Canada, any FSU nation or China.
299 responses to “International Rig Count Still Falling”
Here we go…
Not to worry, once oil goes to $500 we will have oil coming out our ears.
At $500.00 a barrel demand destruction would rule the day and people would be very happy to ride in EVs. At that price I think oil will be done! Sure there will always be niche markets for it. However there is no economy any where in the world that can afford to maintain it’s current way of being at that price.
at $500 a barrel there’ll be world famine. People would be happy to have a enough food to eat and not have to fight to the death for it.
https://gailtheactuary.files.wordpress.com/2011/08/food-price-index-vs-brent-oil-price-june-2011.png
In the image below the red lines are protests/food riots.’
http://blogs-images.forbes.com/williampentland/files/2012/07/food-riots-graphic1.jpg
Hi Jimmy,
People won’t drive their cars very much at $9/gallon for gasoline, there will be plenty of fuel for tractors and less natural gas will be used for home heating as natural gas prices rise so there will be natural gas for fertilizer, when there isn’t enough natural gas, sewer sludge can be processed into fertilizer.
In addition population will peak by 2050 and will begin to decline, the famine scenario is another unlikely scenario, though climate change might have some impacts, fossil fuel decline will also mitigate the climate problem to some extent.
When the UN Food Price Index hits about 220 it seems that people in less developed parts of the world (that’s most of it) get a little uppity and start protests and riots. This is documented in 2008 and again in 2011, when it rose to just under 240 and coincided with an event that became known as The Arab Spring (I recommend we rename it The MENA Fall). It appears there is a strong correlation between oil price and food price, as well as one between food price and political upheaval. It seems to me that it doesn’t matter what people in USA do with their oil (drive or not drive for example) that creates this condition, but that it is the high price condition that impacts the food price, and the food price impacts the behaviour. If petrol hits $9 a gallon in USA driving around will perhaps be the least of our worries. Any anthropologist will tell you that people steal before they starve. Willing to die trying I bet. And as recent events have shown in Europe, people, when properly motivated, can walk a lot further than we might have at first thought likely. Population will be going down much before 2050 I’m sure.
http://www.worldbank.org/en/topic/poverty/food-price-crisis-observatory
http://blogs.scientificamerican.com/primate-diaries/files/2011/08/Food-Price-Index-and-Riot.jpg.jpg
Further to last…. here is an interesting article about Egypt and it’s current financial predicament. Food price features prominent. Matt Mushalik has had some great articles about Egypt also.
https://www.stratfor.com/analysis/dollar-crisis-threatens-egypts-economy?id=be1ddd5371&uuid=df2222e4-b074-4521-8ab5-aeb19f6404fb
http://crudeoilpeak.info/category/egypt
Hi Jef,
I believe you are kidding. Even optimists don’t think the oil price will rise above $200/b by 2025 without crashing the economy and thereby driving oil prices lower.
There is likely to be more oil produced at $200/b than at $40/b, but a peak will occur no matter the price of oil (or it has already occurred in 2015 and higher oil prices may not result in a new annual peak in C+C output).
http://www.marketwatch.com/story/eia-us-shale-oil-output-to-fall-106000-barrels-a-day-in-april-2016-03-07
“Oil production from seven major U.S. shale plays is expected to fall by 106,000 barrels a day in April from March to total 4.871 million barrels a day”
Surprisingly few rigs in Angola (8) and Nigeria (6) given that there are a number of deep sea developments due to start over the next two years.
A large number of indian rigs (99) for their relatively low total production – are these onshore or offshore, oil or gas?
Iran is not included that I can see – is this because of sanctions in the past?
Are there any numbers for FSU available elsewhere – e.g. Azerbaijan connection through BP?
No entries for Uganda but I think there have been recent finds announced there, similarly the Falkland Islands.
UK offshore in death throws at only 7.
Venezuela seems to be doing OK at 69 (cf 71 in June 2014) despite the economic problems there.
Overall not looking good for exploration, development or in-field drilling over the next 3 to 5 years except for the core OPEC countries.
Iran was never included in BHI rig count
What happens to these rigs pulled out of service? What are the financial implications for the companies owning them? How quickly can they be put back to work if oil prices should go up again sufficiently?
“What happens to these rigs pulled out of service?”
They remain idle. What’s worse, newbuild offshore rigs are entering an already oversupplied market.
A recent article on the offshore drilling market:
The downward spiral
Tuesday, 01 March 2016
http://www.oedigital.com/vessels/item/11764-the-downward-spiral
“What are the financial implications for the companies owning them?”
Negative:
Moody’s slashes drillers’ ratings
Wednesday, 02 March 2016
http://www.oedigital.com/vessels/item/11799-moody-s-slashes-drillers-ratings
“How quickly can they be put back to work if oil prices should go up again sufficiently?”
Offshore projects are operated by large companies, which are not as flexible as the US E&Ps in general, and shale players, in particular.
If oil prices rise substantially, these large companies should approve higher upstream budgets and take investment decisions on new projects, which usually takes time.
Then they need to sign contracts with offshore drillers.
Then the rig should be moved to the place where it is needed.
All together, that may take up to 2-3 years.
Hi AlexS,
Due to project cancellations in 2015 and 2016, wouldn’t you expect a shortage of oil in 2018 or 2019 due to a gap in big new projects that may be difficult to turn around quickly. If that happens I would expect a spike in oil prices to over $100/b, it is not clear that LTO output or new conventional drilling will be able to fill this gap. Eventually (maybe by 2020) more output might cause a gradual drop in prices as supply recovers (though this is a big question, it is not clear whether output will return to 2015 levels).
Thoughts? Does that seem a somewhat reasonable scenario from your perspective?
Does $90/b in 2019 seem possible. Assume 2% or higher World Real GDP growth from 2016 to 2019.
When the oil price tanked the Canadian dollar dropped as low as $.70 high 60s. It now seems to have decoupled from the world oil price and lately has hovered around 74 cents. With the change in Govt it also appears to be more and more accepted, (tone of the press and news reports), that our domestic supply and limited exports are acceptable, but that there will be no huge ramping up of Oil Sands development projects regardless of increased oil prices. There is an ongoing discusssion about a Federal Carbon Tax, in addition to what already exists in BC and Ontario. There is also a push for the Energy East pipeline to intercept imports for eastern refineries. Opposition by Quebec seems to be narrow and political in focus, with the population in favour of it by a slim majority. The rest of the country is for it, if news reports are correct.
The drill count is certainly down, and now the Alberta anger seems to be morphing into resignation of a new paradigm and different lifestyle. News reports are about people retraining rather than just waiting for the wages and jobs to ramp back up. Energy production is certainly very important and vital to our needs and lifestyle in Canada, but it is no longer accepted as the be and end all of economic development and progress. Even in my home Province of BC, the blather about LNG export terminals seems to be fading away as a new election cycle beckons.
It’s been interesting to see this and I would be interested if any other Canadians on this forum concur? Is the tone changing in Alberta?
As for climate change awareness, the concensus is that this summer will be a massive fire season in Alberta and Saskatchewan. There is virtually no snow on the ground. My helicopter buddies are being approached for fire contracts on mediums, the mainstay of suppression. Of course we have the El Nino going on big time, with almost unending rain and storms on the west coast. (Today is beautiful, though…warm and springlike). Big storm coming again, tomorrow. The snowpack is excellent this year in the mountains as opposed to last year. At 4500 feet, it is around 15′ in my area. Higher, it is obviously much deeper. Last year we had almost no snow pack and many ski hills shut down. Our river almost stopped flowing by Sept.
Change is good.
regards
Paulo,
A weird complacency has set in. It’s not unexpected, the honeymoon after the surge of effort to see that Harper wasn’t re-elected has left those who otherwise would have been active on the sidelines while they get their wind back.
As I run through the scenarios, I find myself coming to the realization that Canada is hooped, politically and economically.
In Alberta, Rachel Notley is making ultimatums to force B.C. to allow oil pipelines through. In Saskatchewan, Brad Wall plays the East-West card, while touting his local CCS example as climate action when it’s really just a subsidy to the oil industry in the form of CO2 EOR.
Weirdly in the East, it seems Wynne and Couillard don’t seem to have a problem with having the natural gas Mainline that brings Western gas to Eastern Canada repurposed into a dilbit/syncrude pipeline, Energy East. They seem to be oblivious to the implications of having a major supply route for gas removed as an option, and what impact this might have on gas prices at peak winter demand. All those homes and buildings from Windsor to Quebec City, will be largely dependent on North Eastern U.S. Shale production… with it’s inherent rapid production declines.
Trudeau, Wynne and Couillard will find themselves unelectable if they allow Energy East, and after it’s built a sudden spike in natural gas prices occurs because there is no longer a diversity of gas supply. Pissed off households with high heating bills might not forget that at the polling station.
Now that it’s clear that the loonie is a petro dollar. With all the cancelled and delayed projects, idled and stacked rigs, and the relentless decline of existing oil production, the price of oil has a reasonable chance of spiking. And the loonie will spike with it, killing off the recent growth in the Canadian economy that isn’t related to petroleum. Trudeau’s talk of the need to diversify the economy federally, or Notley’s speechifying in Alberta, will be blown to pieces. Nothing kills off the growth of a non-petroleum based export economy faster than a high, rising and volatile currency.
Canada can’t have it both ways. Trudeau and the premiers, for all their speeches to the contrary, can’t change the fact that further growth in Alberta’s bitumen production is bad for the Canadian economy in the medium term, and bad for the most populated provinces in the short term.
Justin should politely ask Barack to introduce economic sanctions to Canada. Economy would be transformed from open mining pit/corporate rentier type to something more diversified and sustainable in a hurry. But it was the Russians that got lucky with sanctions.
Apologies if I’m slightly off topic, but Something interesting from Ugo Bardi:
“The projections that had been circulating during the past few months turned out to be correct. Now, it is official: the global carbon dioxide (CO2) emissions peaked in 2014 and went down in 2015. And this could be a momentous change.”
http://cassandralegacy.blogspot.co.uk/2016/03/an-epochal-change-have-co2-emissions.html
This would roughly tie in with Ron’s estimate of an all liquid peak in 2015. Sadly I don’t think this is much cause for optimism although I have always thought that resource depletion is our most urgent near term threat. He continues:
“The decline might not follow a Hubbert curve but, rather, a Seneca curve. That is, emissions may decline much faster than they grew in the past. That implies, of course, a parallel crash of fossil fuel production and of the world GDP. The resulting economic collapse might keep us within the “safe” climate limits.”
The Seneca Cliff is not a likely scenario.
Why will fossil fuel output rapidly decline?
The economy will crash.
Why will that occur?
Due to the decline in fossil fuel output.
Circular reasoning at its finest.
Many use the debt issue as the cause of the economic crash, but this is less of a problem than many realize.
Who is the money owed to, aliens?
For the planet the assets and liabilities match.
Well he’s hardly the only one theorise about about the occurrence of a Seneca Cliff or a sharks fin curve type decline. Why would it occur? Because after all the low hanging fruit has been picked the unconventional sources generally have high initial production, but high decline rates and god knows what will happen to the super giant fields when infill drilling has run it’s course. Why will the economy crash? Because of the intimate relationship between energy use and all economic activity. If energy rapidly declines so will the economy. I don’t think it will be due to debt that can and will be defaulted on in one form or the other. You know Dennis I think you would make a good sell side analyst. Obviously I hope you are right & I am wrong.
Does not look like Dennis C’s writing style.
Hi Marcus,
Note that I expect a peak and decline. Reasonable estimates of C+C URR of 3000 Gb minimum, based on an HL estimate (which tend to be on the low side) and a conservative estimate of oil sands reserves (in both Canada and Venezuela) of 500 Gb. Note that infill drilling has been happening in the US for a very long time, no Seneca cliff, just moderate decline (until shale boom). Yes we can see sharp declines in offshore areas and eventually in the LTO plays, but this is a small part of total output and the declines will not be synchronized.
The chances of a Seneca cliff in fossil fuel output World wide, in the absence of an economic crash for other reasons, is infinitesimally small.
Chart below with a scenario with C+C URR=3000 Gb using Oil Shock Model.
I notice that many refer to this as a “Hubbert” decline, this is not a Hubbert model based on a logistic equation. The oil shock model is based on discovery data (from Jean Lahererre) and a model of those discoveries being converted to producing reserves over time. Each year new producing reserves are added (from existing discovered resources) and oil is “extracted” from total producing reserves. The historical extraction rate (annual production divided by total producing reserves at the beginning of the year) is found by looking at output and the “producing reserves”.
Based on past extraction rates I guess at future extraction rates (which are obviously not known).
See http://peakoilbarrel.com/oil-shock-model-dispersive-discovery-simplified/
I modified the scenario slightly to account for more recent estimates of 2014 and 2015 C+C output, remember that the URR is very conservative, based on a Hubbert Linearization of World C+C less extra heavy oil (oil sands from Canada and Venezuela).
Fernando agrees that a 2800 Gb for C+C less XH oil is reasonable, here I use 2500 Gb plus 500 Gb of XH oil (3000 Gb total), note that Fernando may think the XH URR estimate is too high, 500 Gb is Jean Laherrere’s estimate. Chart below shows extraction rate and annual decline rate for a scenario with a 2015 peak, consistent with Ron Patterson’s prediction of a 2015 peak. My belief is that this scenario will be too low.
Dennis Coyne “Many use the debt issue as the cause of the economic crash, but this is less of a problem than many realize. Who is the money owed to, aliens?”
The money is ‘owed’ by future generations. The problem is that debt needs to be repaid with interest. Hence growth is necessary. I believe that in the current economic system growth requires oil production to expand. If Peak Oil has already occurred there may well be a Seneca Cliff type event when people realise the consequences. But I do not believe it will happen soon. I think the current low oil price is a White Swan event that is extremely beneficial to the Global system. Beneficial not because it is creating a boom but because it is preventing the forthcoming recession from being a Seneca cliff event. Yes low prices hurt the producers, but their loss is the consumers gain. In national terms Saudi Arabia, Venezuela and Canada are hurting but countries such as Japan, South Korea and Germany have gained. The US has probably come out even. Oil Producers are down but Car Production is up. But the biggest factor in the White Swan nature of low oil prices is that it completely obscures the reason why oil production must fall. I do not believe that Ron was ‘lucky’ in making his prediction of Peak Oil before the price fall.
“obscures the reason why production must fall.” Exactly. “Seneca Cliff type event when people realize the consequences”. I think you meant the cliff will occur when no one realizes what is happening (AKA wiley coyote). D
Hi Jeju-islander,
The money is owed to and owed by those future generations. Interest is simply the pride paid for borrowing. Currently real interest rates (nominal rate minus the rate of inflation) are close to zero so the cost to borrow is very low.
In fact for those with good credit scores auto loans are often at zero nominal rates in the US which is essentially a negative real rate of interest.
For governments that are not encumbered by outside forces (such a those who are members of the EU),it makes good sense to use fiscal policy to boost economic output as the borrowing cost is very low for many nations.
In the case of private debt, the money is owed and borrowed mostly between the wealthy. When there are defaults wealth is transferred from the lenders to the borrowers, the interest payments are in part to cover this risk.
When oil prices are high at peak output the “peak” will be more believable.
Wrote “pride”, but meant price of borrowing
Dennis,
Here’s an interesting thing that’s now becoming clear to economists: oil shocks aren’t primarily bad because of resource limits, they’re primarily bad because they confuse the economy. Suddenly investors (whether they’re oil investors or individuals considering a car purchase) don’t know what to do, and they defer investment, which hurts the economy. Suddenly previous investments (oil rigs, or SUVs) lose value, and the economy appears to be badly misallocated. Suddenly people (and assets) are unemployed, as the economy attempts to reallocate towards a new normal.
For the same reason, the current oil price crash is harmful to the economy. Economists expected low prices to help oil importing countries and oil consumers, but the “friction” of reallocation in the economy has hurt as least as much as new-found oil savings have helped.
One implication, which is supported by real research (I can point you to Prof Hamilton’s article on this, if you like): a *gradual* rise in oil prices won’t hurt the world economy much. If it’s part of a long-term change in public policy away from FF and towards EVs and renewables, the economy will be just fine, as the transition will be understood by investors and the changes won’t scare anyone into deferring investments (much of which will go towards the new tech, replacing traditionally massive investment in old FF tech).
Hi Nick,
The link to the Hamilton article would be nice, he does great work.
“For the planet the assets and liabilities match.”
That would be true only if a large part of those assets wasn’t imaginary. As it is. Trillions have been loaned globally on assets which have no value and sometimes don’t even exist at all.
Hi Strummer,
The books will match. When default occurs both asset and liability are reset for that loan. Asset values always change sometimes up and sometimes down, that is part of the reason for interest payments, to cover risk.
Dennis,
Dennis, I am surprised that since you make models on oil production, you haven’t thought deeply on what type of factors are likely to produce a Seneca decline versus a Hubbert decline:
1. Lack of enough cheap abundant energy to carry out the extraction to the end. Hubbert thought that it was going to be nuclear. As ERoEI declines energy issues will accelerate the oil decline curve.
2. Lack of economical and financial stability. A good economy and finance are required to carry out the extraction to the end. However they are very likely to be negatively affected by the reduction in oil.
3. Lack of international cooperation. International cooperation and fair play is required so everybody assumes part of the decline, otherwise parts of the world collapse bringing down the global economy.
4. Lack of peace in producing areas. Any conflict affecting production would accelerate the decline.
5. Increase of extraction cost to the economy. If the economy needs to dedicate a bigger part of its output to extraction, demand will reduce and decline in production will accelerate.
6. Other peaks as consequence of peak oil. Any limitation in any material or resource will likely accelerate the decline.
7. Lack of technological and production improvements. As they bring forward future production, they enhance the future decline producing a Seneca curve.
8. Lack of export land model. If producers don’t drastically cut their consumption, exports will collapse, and importer countries will be brought down, dragging the global economy.
These are only the issues that I can think that clearly will negatively affect oil production when we are past Peak Oil. There are probably more that I cannot think.
I am afraid that a Seneca decline in oil production after Peak Oil is a certainty that you are leaving out of your models. If you want to know what is going to happen when we do not have enough of something on what we completely depend you need to think outside the box.
Hi Javier,
Energy can be used more efficiently.
Oil is not the only source of energy, there are other fossil fuels, nuclear, hydro, wind, solar, and geothermal power.
As fossil fuels peak they will become more expensive, the relative price of other forms of energy will be lower than fossil fuels and society will transition to alternatives and because energy will be more expensive less will be used per unit of GDP produced.
In addition, World Population will peak (between 20150 and 2070) so GDP growth will slow down as this occurs.
All of the problems you suggest have been with us for a long time, humans will deal with those problems as they arise.
So if you are saying that another Great Depression or World War may occur in the future, I agree.
I cannot predict in advance when those may occur, in the case of a nuclear holocaust a decline in oil output will be pretty low on the priority list.
In any case the point is that without such events there will be no Seneca cliff.
EROEI has to be considered on a societal level for all sources of energy, the EROEI of any individual product is not important because high EROEI sources can make up for the lower EROEI sources.
Rune Likvern used the Red Queen analogy to great effect.
If we think about the oil industry on a treadmill running faster and faster just to stay in place, a gradual decline in oil output might occur as the speed of the treadmill was gradually lessened over time.
A Seneca cliff occurs if someone unplugs the treadmill, and takes a hammer to it so that plugging it back in does nothing.
A World war or Great depression would surely drop all energy output severely,
but in the absence of some large shock to the system, I think it unlikely the plug will be pulled.
I believe a Seneca Cliff oil crash is possible, if we are unlucky and any several unhappy scenarios come to pass.
BUT if we are reasonably lucky, there is an excellent possibility we can adapt to gradually declining oil production, and gradually rising oil prices, assuming we have the presence of mind to do so.
There is room to cut consumption by close to half, just by building more efficient cars and trucks, using rail instead of trucks, etc. Beyond that, there are too many lifestyle changes we can make to easily count them- changes which will leave us on the whole living as well or better than we live now.
People lived just fine before plane tickets got cheap enough for working stiffs to fly the family cross country to visit Grandma, and we will continue to live ok without the sky being crisscrossed with as many as eight to ten airliners simultaneously visible from my farm out in the boonies on any given clear night. Grandma might have to move if she wants to see the grandchildren, that’s tough, but it’s not the end of the world.
ONE factor involving peak oil that REALLY matters is that we mostly avoid seriously discussing oil consumption in newly prosperous Asia.
My personal take is that China , India, etc, are never going to have full fledged western highway systems and two cars parked at every peasant’s hut.
They will probably manage to get to the point they have mostly decent highways and truck transportation for essential goods, if they are lucky.
And if they are REALLY lucky, they might get to the point that every third or fourth hut has a micro mini pure electric or plug in hybrid, most likely with a smallish battery providing a rather limited range.
People who have lived their entire lives in a neighborhood, except when traveling occasionally by bus or train, are not going to suddenly be able to move out to far flung suburbs, the way we do in the USA. Stores and services will continue to exist in combination with residential space in such countries.
We were able to separate living spaces and business spaces because we did it when oil and land were plentiful and cheap. India and China don’t really have that option.
Bottom line, most of the oil produced in the future will continue to be used in the countries using it now. The exceptions will be in countries that are importing on credit, with no way to repay the loans. India and China will get THAT share.
I am with Dennis when he says we owe the giant debts , collectively, to ourselves.
Hence we will not NECESSARILY suffer a major or complete economic disaster as the result of these debts, any more than you will NECESSARILY have a bad accident due to having a few brews and driving home.
The risk of a truly big time economic crash due to the collective debt load is pretty high, no doubt about it.
But history tells us that debts can be written off, in all or in part, thus avoiding some or most of the consequences of failure to pay them.
The REAL issue is how much capital the world really has, in terms of natural resources, manpower, ingenuity, and ecosystem services provided “free” by nature.
Up until a few years ago, I owned a house built cookie cutter style right after the Korean war, that sold for 5,500 bucks turn key, water sewer electrical, lot and all in 1956. It is still in excellent condition, having been upgraded with new windows, new roof , extra insulation, heat pump within the last few years, and with care will last another hundred years easily.
With a declining population now apparently safely in the cards, future generations will inherit awesome amounts of infrastructure that contrary to the pronouncements of gloom and doomers, will be in excellent condition, presuming it is reasonably well maintained.
It costs maybe ten percent on average to repave a highway, repair the culverts and gaurd rails and bridges, etc, compared to building new from scratch.
I may be entirely wrong, but I think maybe housewives will only visit supermarkets in order to enjoy the shopping experience and get out of the house twenty years from now. They will shop online, and a driverless car will pull up with the groceries at the desired delivery time.
Twenty such driverless hired cars will probably take the place of fifty to a hundred personal automobiles. If electricity is gets to be expensive enough, the supermarket will give a discount to shoppers willing to delay delivery while the wind is brisk, and or the sun is bright, so as to charge up the delivery car with renewable power.
Peak oil does not mean the shipwreck of civilization. I once believed it did, but now I believe renewables are coming on fast enough that between improving efficiency and changing lifestyles, we MIGHT manage the peak oil problem successfully.
Just one car in ten being a pure electric is enough to offset the amount of gasoline needed by close to ten percent. We can easily get to the point that ten percent of the cars on the road are pure electrics or plug in hybrids
An oil price spike is probably at least as likely as the recent price crash, and within the next few years, if the economy holds on.
In five years there will be plug in hybrid and pure electric cars at just about every major make dealership, world wide. In five years a lot of poor people will have had the opportunity to own a cheap older electric or plug in car, and the word will be getting around about how cheap they are to own and drive.
Electric cars just aren’t going to sell until they are IN STOCK at dealers stores, and advertised, and people know more about them. Sinking six or eight hundred in a phone is one thing, putting twenty thousand or more in a questinable purchase is something else altogether. Most folks will not buy an electric auto until they get to be common on the road.
If it weren’t for the internet, I wouldn’t know a soul who owns a LEAF or a VOLT or a TESLA.
But the Prius is common enough now, and well enough thought of, that I know four people who own one, three of whom bought theirs used.
And I know a couple of people who are keeping an eye out for a cheap Volt.They are figuring on saving five or six bucks a day on gasoline, if they can find one, getting to and from work. Being gearhead types, they figure the car will run just about forever, since most of the mileage will be on the battery rather than the engine. So when the battery is eventually wears out, they still expect to have a thirty five mpg commuter with a relatively new engine.
Hi Old Farmer Mac,
The point that I did not make clear is that in the absence of a severe shock (total economic meltdown or WW3) a Seneca Cliff is very unlikely.
I agree that many bad things are possible and in the next 35 years it is likely that we will have a major recession (or depression), but I don’t pretend to be able to foresee when that will occur.
I have suggested on several occasions that if someone wants to guess when such an event might occur, I could attempt to model it. I even did a couple of such scenarios in the past see
http://peakoilbarrel.com/oil-shock-models-with-different-ultimately-recoverable-resources-of-crude-plus-condensate-3100-gb-to-3700-gb/
particularly the “pessimistic scenario”
A different Seneca cliff scenario is shown below.
Annual decline rates remain above 2% from 2036 to 2050 in this scenario consistent with a major World Depression over that period, maybe with a major oil war thrown in. Clearly nobody knows when or if such an event will occur, I agree such an event is possible, perhaps humans have learned from previous mistakes. Though based on the history of the last 50 years we have not learned much, so I can understand pessimistic viewpoints.
Dennis,
“The point that I did not make clear is that in the absence of a severe shock (total economic meltdown or WW3) a Seneca Cliff is very unlikely.”
That point is only correct for a resource that:
a) Can be completely substituted without significant loss, or
b) It is not critically necessary.
Otherwise the Seneca cliff is the default pathway as the loss of the resource creates a negative feedback loop on the production of the resource.
I understand that you assume oil is in one or both of those cases. I think you are going to be very surprised by future developments.
Hi Javier,
There will be both positive and negative feedbacks to less oil output, you only consider the negative feedbacks, I consider both. In places where there are already high fuel taxes the impacts will be lower as there is good public transportation and liquid fuels are used very efficiently, higher fuel prices will lead to even more efficiency.
In places like the US the impact will be greater and there will be a quicker transition to more fuel efficient vehicles and a build out of the public transportation network, these transitions increase economic activity and employment which can be positive for a struggling economy. High oil prices will lead to the allocation of a scarce resource to its most important uses.
It is you who will be surprised at how adaptable a market economy can be when the government doesn’t interfere by trying to control prices (as the Nixon administration did in the 1973/74 oil crisis.
Over time high oil prices will both increase output (relative to output at lower prices) and reduce demand in the long run. It will also make EVs, plug-in hybrids and public transportation more attractive which will tend to reduce fuel demand.
Eventually if the economy is unable to adjust there may be an economic crisis. This may lead to positive public policies that will help with the transition (as in the US during the Great Depression, there could be significant changes in public policy).
“There will be both positive and negative feedbacks to less oil output,…”
The negative impacts are a 100 times more than any benefits.
Hundreds of millions will lose their jobs and begin to starve. Whether or not the diesel and NG are there in order to grow food enough to feed the population has never been the issue in the industrial civilization, it is always about being able to afford food.
When people no longer see a future where they can provide for themselves and their families thats when it will all come unraveled.
I would argue that the only reason that that has not happened already is because the world threw trillions at the problem believing that their are no limitations that can’t be overcome with enough money.
This has obviously failed and we are starting to see a crack forming.
By the way this experiment all but guarantees a very steep or at least steeper downside.
Hi Jef,
Why will hundreds of millions lose their jobs and starve? There is much that can be done by governments in the face of high unemployment, building a hvdc grid, building more public transportation, bikepaths, sidewalks, improving homes to make them more energy efficient, installing heat pumps. In the private sector there may be demand for more energy efficient vehicles and appliances and PV solar, people are needed to build all this stuff. There will be demand for all this because energy prices will eventually rise as fossil fuel markets get back into balance between supply and demand.
A lot has been learned about economics since the great depression thanks to Keynes and others. The government response to a second great depression will reduce its severity relative to 1930 to 1939, in fact the GFC would likely have been Great Depression 2, if governments handled the 2008 crisis as poorly as the 29 crash was dealt with from 1929 to 1933.
I do agree there will be negative consequences, this may set into motion positive changes that in the long run may outweigh those negative consequences.
If the economic crash occurs before it is clear that peak oil has been reached (prior to 2030), positive changes in the energy sector may not occur or may happen too slowly.
The best case would be that high oil prices cause a new peak by 2020 and that output remains on plateau until 2025 and then declines at 1 to 2% per year while oil prices remain high (close to $160/b by 2029), perhaps people may be convinced that peak oil has arrived after 5 years of decline in output with oil prices between $125/b and $160/b.
Then an economic crash may cause people to rethink energy policy and we might see some positive things result (along with the negative consequences of a deep recession).
An economic crash before an oil peak at high oil prices would be a disaster, and there is no reason this would not occur, financial crises are not easy to predict in advance.
Sorry Dennis, you did not understand.
Once you enter terminal decline in production after peak oil, there can only be negative [actually positive as they accelerate the decay, but a lot of people don’t get the meaning so let’s refer to the effect] feedback loops that increase the rate of decay and reduce oil production. There can not be any positive feedback loops that increase oil production because we will be in terminal decay, so nothing can change that.
Many of the things that you comment like higher oil efficiency and substitution will likely reduce oil production giving place to a Seneca cliff type of decay.
As you are using your arguments in the opposite way as they should act on oil production, you reaffirm me in my idea that you have not thought very well about these issues.
Hi Javier,
Yes you are correct a positive feedback will accentuate the effect. However in my response to Jef, he was talking about negative consequences rather than feed back loops.
In fact , my comment responding to you I pointed out that there are negative and positive feedbacks, without identifying which is which. So you are taking comments out of context.
So let’s think about what happens as oil output declines.
You claim that there will only be positive feedback loops so that oil output will fall faster and faster eventually dropping vertically to zero output, as that is how a positive feedback loop would manifest.
Is that your model? How about if you present it in a chart? As clearly you have thought this through very carefully.
Eventually oil output will drop rather quickly as substitutes become more attractive economically.
Are there other sources of energy besides oil?
Yes there are.
The critical thing that the economy needs is energy and as the relative prices of different types of energy change over time the economy chooses the types that work best at that set of prices.
My expectation is that it will take time for the economy to transition to lower oil use and that oil prices will increase as the supply of oil falls below demand at lower oil prices.
You assume the economy cannot adjust to the higher oil prices, but it is not clear why based on the experience of 2011 to mid 2014. The higher oil prices will reduce the rate of oil decline, possibly to zero, this price effect would be a negative feedback. They will also lead to greater efficiency of oil use which would reduce the demand for oil (a positive feedback). In a market economy these two opposing forces tend to balance each other so that a market equilibrium is reached.
This equilibrium will be dynamic rather than static, with supply gradually falling and demand gradually falling due to a combination of depletion on the supply side and substitution and efficiency on the demand side.
So again you may not think I understand, but I understand both physics and economics quite well.
In addition I have a physical model that suggests if extraction rates remain near historic levels the decline in oil output will be manageable (less than 2% per year), even with a very conservative estimate of World C+C URR of 3000 Gb, the USGS estimates about 4000 Gb.
Historically the Hubbert Linearization technique has resulted in URR estimates that have been too low, over time I expect the HL estimate of 2500 Gb for C+C less extra heavy(XH) oil will be too low by 300 Gb (USGS estimate is about 3100 Gb).
Hi Javier,
My apologies, you are correct.
I used negative feedback when I should have said positive feed back in my original response to you.
However I believe you first said there would be a negative feedback loop which would lead to a Seneca cliff.
You said:
Otherwise the Seneca cliff is the default pathway as the loss of the resource creates a negative feedback loop on the production of the resource.
Also a negative feed back could reduce the rate of decline, even if it does not cause output to increase, just as a positive feedback would tend to increase the rate of decline.
I agree that at some point a transition to EVs, plugin hybrids, hybrids, and more efficient ICEV along with greater use of public transportation, more telecommuting, and migration to more walkable and bike friendly communities will act as a positive feedback potentially leading to a Seneca cliff as oil prices may fall due to lack of demand. I do not expect the transition will reach that point until 2040 at the earliest, prior to that the fall in demand will roughly match the fall in supply due to depletion and oil prices will remain relatively high, about $125/b or more.
OldFarmer,
Disruptions happening among the disrupters. New grapheme batteries to be produced that should have several times the charge density of lithium types. That will push the range of electric cars to the 300 to 600 mile range. Depending on price point, which should fall with increased production, this could be severe competition for lithium batteries. It also has no tendency to explode.
http://nextbigfuture.com/2016/03/spanish-company-graphenano-claims.html
Yes, they like to claim this and that. If it were true then things will work out. But we hear about these vaporware technologies all the time. Thus far there’s nothing.
I doubt very much this is a hoax.
Cynics do not contribute, skeptics do not create, doubters do not achieve.
That Spanish company, Graphenano, is a scam, GoneFishing. It has been created by Martin Martínez Rovira, a guy that was part of the Board of Bio Fuel Systems, another Spanish company created in 2006 by French Bernard Stroïazzo-Mougin former international gun dealer that provided guns to Chechen rebels. Bio Fuel Systems with a Spanish University professor claimed that it could produce oil from algae at commercial rates at about 7 barrels per acre and day. They got 30 million euros from Italian Investment group Enalg and private investors and built the first oil from algae producing plant in the world. They got 9 more million euros from the Madeira Electric Utility Company to build a plant there. They also got quite a lot of money from Spanish administrations.
In 2013 they suspended payments without having produced a single barrel of oil, they have suits filed against them in Portugal and Spain, and a trial for tax fraud.
Now one of the guys involved comes back with graphene batteries and he is again getting a lot of money from technoptimists that can’t google.
Technoptimists are a gullible bunch. They seem to believe in unicorns and they can be sold one without seeing it.
Luckily, most of the creators and inventors of the world are far too busy to pay attention to your naysaying. Even if this Spanish company is not fully successful, someone else will be.
Just as with the airplane, the radio, vaccines, and millions of other things; the pioneers just keep working, and they ignore the doubters and naysayers. So should we. Otherwise it’s the Dark Ages again or worse.
Funny. I live in a sort of similar appalachian place, and the number of leafs has tripled in the last year, and I know people with volts and even 3 with teslas.
What’s the diff? Maybe, maybe, because I and and a couple of other rather loud people here have pushed out lots of op-eds to the effect that EV/solar makes sense several ways, and we run around with big solar signs on ours and get lots of questions.
Another one. My wife got a call from a Nissan dealer urging her to trade in her 3 yr old leaf for a new one, and she, typically, responded that she liked what she had, it suited her usage just fine, and she saw no reason to change.
The guy then came clean and said he was just looking at his possibility of making money, since “I’m all of a sudden getting lotsa calls for used leafs”.
Local Nissan has put in a fast charger at the shopping center, under a big PV array, not at the dealer.
That’s why I keep saying there’s an EV explosion just ignited, and oil people better take notice, since cars are where they live.
After all, as every ICE guy knows, big explosions start with little sparks.
ANd for every Leaf sold there were more than a hundred trucks and suvs sold too.
Electric car sales worldwide have doubled every year for three years. At that rate they will outnumber ICE cars in less than a decade.
Do you have any data on that assertion. I can’t find much other than this. 50% by 2040.
https://en.m.wikipedia.org/wiki/Electric_car_use_by_country
See references (6) and (27)
Hi Jimmy,
Using sales data from
http://www.gbm.scotiabank.com/English/bns_econ/bns_auto.pdf
and
http://insideevs.com/monthly-plug-in-sales-scorecard/
and assuming the 2015 plugin sales of 0.55 million vehicles continues to double every year and that the 2013 to 2016 (forecast) trend of total passenger vehicle sales continues until 2022, I get to 50% plugin vehicles between 2021 to 2022.
You may suggest the assumptions are not realistic (doubling every year), I would agree with that criticism. Chart below is too small sorry.
Hi Gonefishing,
To be clear, the plugin sales would outnumber ICEV sales in less than a decade, the doubling every year assumption is not very realistic however once we reach about 10 million in plugin sales per year.
Growth rates would probably slow to about a 20% increase per year.
That model (somewhat more realistic) get to 50% plugin sales by 2029. Chart posted further down thread.
Hi Gone fishing,
The “realistic” plugin sales model below.
20% sales increase after 2019, where initially I assumed a doubling of plugin sales every year.
Hi Jimmy,
For passenger vehicle chart I talked about earlier I am reposting chart here so it is larger.
Dennis, of course the EV market and production will reach saturation at some point but the point behind the point is the tremendous decrease in gasoline use that may occur within the next decade.
It takes about 8 million bpd of oil to produce gasoline for the passenger cars in the US. The growth of EV and higher mpg ICE could cut that in half or less, reducing the need for a large chunk of oil production. If it goes all EV we are talking eliminating most of the need for 8 million bpd in the US. Since both locomotives and heavy trucks are getting more efficient, knock off another million bpd or more.
One way or another, the oil industry is going to shrink in the future.
History of auto production
◦At the start of the twentieth century there were only about 8,000 cars in the United States and possibly not more than 25,000 worldwide.
◦Most cars in the early 1900s were located in either the United States or Europe. In 1908, for example, there were only about 20 cars in Tokyo, Japan.
◦There were 300 cars in the United States in 1895, 78,000 in 1905, 459,00 in 1910 and 1.7 million in 1914.
◦In 1903 just under 63,000 cars were built in the world of which about half were produced in France.
◦By 1910 there were 100,000 cars in Great Britain.
◦By 1968 the worldwide figure had increased to 170 million; a figure that had more than doubled to 375 million by 1985.
◦In 2002 there were 530 million cars worldwide, of which about 25% (130 million) were in the United States.
Now there are about 1.2 billion motor vehicles in the world (not counting construction equipment).
From a few thousand to 1.2 billion in 116 years, that is growth. It could not have happened without the growth of highway and road infrastructure.
There are about 90 million new vehicles produced every year so that would be the upper boundary of EV production.
Very soon there will be 1 million EV’s running around in the world. If people drove like they do in the US, that would reduce the use of gasoline by about 1.5 million gallons a day.
If you look at my comment above you will see that cars in the US ( a new high tech machine) went from 300 in 1895 to 1.7 million by 1914. That is a 5666 times gain in less than 20 years.
So why would anyone be surprised if electric cars did a 1000 times gain in that amount of time? The major competition at the time was the horse and the railroad/electric trolley. Considering the roads at the time and the lack of reliability of the new motor car, both of those had a severe advantage over the automobile in several key areas. Yet the change still happened.
People decided that this was the way they were going to travel and that was that. They put up with the noise and the foibles of the machine. Not many people would want to run a 1905 or 1910 car down muddy dirt roads for more than a fun run today. Even down city streets. They were uncomfortable, noisy, broke down a lot, had no synchronous shifting, no good heating, nothing we are used to today. They were expensive. Maybe slightly more convenient or faster than a horse and buggy, but not as reliable and getting fuel was no easy matter.
But I think businessmen saw the writing on the wall and started building purpose built filling pumps and stations. Better than buying a can of gasoline or hand pouring it.
http://aoghs.org/transportation/first-gas-pump-and-service-stations/
Now they are all over the place and cars are lining up like there was no end to it.
The only thing holding back EV sales right now is limited range and higher initial cost, both of which will fall by the wayside within the next few years. Electric charge stations will become commonplace and cars will have greater range to begin with.
I do wish they would bring back the trolley system in cities 🙂 Those were fun and convenient.
Thanks Dennis I appreciate that.
Hi Jimmy,
Happy to help.
Javier, on Sunday the temperature was 64 degrees Fahrenheit in the region where I reside. In 2003, it was 30 degrees below zero.
A 94 degree difference, the world is a much better place when it is warm outside.
Don’t use as much natural gas, don’t have to run to the car, don’t need a parka, mittens, a tuk, none of that.
Warming is far better than cooling.
A little off topic, for sure, just so you know.
126 degrees difference, unless you mean freezing point rather than zero point.
Utter rubbish – please ignore – too much lunch time refreshment, or too long retired!
Many use the debt issue as the cause of the economic crash, but this is less of a problem than many realize.
Who is the money owed to, aliens?
For the planet the assets and liabilities match.
Dennis, I find it alarming that you could believe something so unbelievably simplistic. Did you live through the subprime mortgage crisis? You know, the one that almost sank the economy and would have had it not been for the government bailout?
Speculators, using “liars loans” bought up millions of houses. Homeowners took out second mortgages on their homes to get money for vacations, boats, and many other things. Then the housing market collapsed and these mortgages were near worthless. Yet these mortgages were bundled and sold to other investors as AAA rated investments.
But it didn’t matter because all borrowers and loaners were earthlings, so it’s all a wash!
And that, the subprime mortgage crisis, is just the tip of the iceberg. Money is loaned and interest must be paid on those loans. Do you really believe the shale oil junk bond mess means nothing because borrowed money equals loaned money therefore it is all a wash?
The economy runs on borrowed money. People borrow money to buy houses, cars, boats and other stuff. Drillers borrow money to drill, manufacturers borrow money to expand their business… or in many cases just to keep it running. And if this all collapses, if the money is not paid back and no more money is available to borrow it means nothing because those on both sides are human beings so therefore it is all a wash?
Again, the world economy runs on debt. The economy must grow in order to pay the interest on that debt. If the economy shrinks, for long enough, then the economy crashes. We get a Seneca Cliff.
The US economy has already experienced one Seneca Cliff. It began in late 1929 and it took only a couple of years for the economy to crash almost completely. Billions of dollars were lost. But it should not have mattered because those on every side of all issues were all human beings… not aliens… so it should have been a wash.
One more point. String out a few years like those we had in 2009 and 2015 and you will see a Seneca Cliff.
We are shrinking! The neglected drop in Gross Planet Product
Hi Ron,
There can be financial crises when there is inadequate banking regulation as was the case in the US from 2000 to 2009 (with banking regulation gradually dismantled from 1980 to 2000 in the US).
Debt is not the problem, it is poor governmental oversight of the financial industry that is the problem.
What is important is real GDP not nominal GDP. At the World level here are the annual growth rates of real World GDP (at market exchange rates) from 1980 to 2014 (with 2015 estimated).
IMF data for Oct 2015 can be found at
http://www.imf.org/external/pubs/ft/weo/2015/02/weodata/index.aspx
Chart below uses IMF data to find World Real GDP in billions of constant 2014 US$ at market exchange rates from 1980 to 2015 (2015 is the October 2015 estimate for 2015). There was world deflation in 2015 which caused nominal GDP to fall in US dollars at market exchange rates.
Real GDP grew. The deflation may be related to the general fall in commodity prices world wide.
The average growth rate of real GDP from 1980 to 2015 was 2.9%/year. When we plot natural log of real GDP vs time and find the linear trend (R squared=0.996) the slope of the line is 0.029 or 2.9% per year.
From 2010 to 2015 the growth rate of real GDP slowed to 2.5%/year (r squared=0.999).
Debt is not the problem, it is poor governmental oversight of the financial industry that is the problem.
Debt is not the problem? What you are saying is that it is the government oversight of debt that is the problem. That still leaves debt as the problem, regardless of government oversight.
Junk bonds sold by shale drillers were all in compliance with government regulations. The problem still exists.
Even the subprime mortgage bundling was all in compliance with government regulations. What was needed was government regulations that did not exist… and still does not exist.
What you don’t seem to understand Dennis, is that the current debt based economic system we now have, requires growth. We can have a year or so of no growth without much of a problem. But more that and the problem gets really bad.
I am not going to try to explain to you… again… why our debt based economic system requires growth and without growth it must collapse. It has been done over and over again and explaining it one more time will not make you understand. Eventually growth will stop. It is a struggle right now to keep world GDP ever increasing. It will eventually stop and we will have a collapse. In some places in the world it has already started to happen. And this will spread.
Hi Ron,
Yes the economy needs to grow, you assume it will not due to lack of oil (maybe). What the economy needs is energy, we will gradually transition to other types of energy. The environmental damage will be solved when population peaks and begins to decline. Population growth rates have been slowing and between 2050 and 2070 decline in population will begin. Eventually economic growth may stop and perhaps debt will need to stop as well, though I would think there would always be those with excess savings that are willing to lend at interest.
Yes there are some nations that are struggling and others that are doing better, real GDP growth continues at 2.5% per year (2010 to 2015 average rate) for the World as a whole. For World real GDP per capita growth from 1982 to 2014 the average rate was 1.45%/year. If we assume this rate of real GDP per capita growth continues until 2100 and World Population follows the UN low fertility scenario, we get the following World GDP growth rates to 2100. Clearly the assumptions could be wrong, but if they were correct we should expect lower real GDP growth rates over time as population growth slows and then declines.
Hi Ron,
Can you explain why the economy stops growing? Is the assumption that an energy constraint is the reason?
Note that as population stops growing there will be assets passed down to children at a greater rate, those without heirs that choose not to give away their wealth to charity will have their assets go to the state and can be used to pay down public debt, so there might be less need for borrowing. It is difficult to envision how future society will be arranged, but it will change over time as it always has.
Dennis, are you serious? Do you actually believe that growth can continue forever? And as for the rest of your post, I have no idea how to reply to such an unbelievable post. So I will not even try.
Excellent discussion on economic growth-
https://www.ted.com/talks/robert_gordon_the_death_of_innovation_the_end_of_growth#t-151542
Hi Ron,
No I think economic growth will eventually stop, but not before 2100.
It is possible that per capita growth will slow down,
If we assume it falls to 1% growth per year and population falls at 1% per year, then a steady state of no real GDP growth will be reached in 2125.
At some point a zero real GDP per capita growth rate may be reached and a steady state no growth or decline economy would require a stable population level.
A 1% annual fall in population from 2126 to 2300 would result in 1 billion people in 2300. I imagine we would see population fall more slowly than 1% per year as population approaches 1 billion and growth in per capita GDP will also slow to zero over time. Human society has a long time to figure this all out.
If the planet cannot support one billion people, then population will fall to a level the planet can tolerate. There are varying estimates of this population level.
GDP growth can go on forever. In the year 2200 I’ll charge you $2000 to do your nails with tiny embedded microchips which allow you to play the violin like Julia Fischer. You’ll pay me by selling me a week’s vacation inside a sea floor resort located near the Antarctic coastline, where we tourists will spend hours watching bioengineered plesiosaurs eating giant penguins. Or something like that.
Hi Fernando,
I don’t think GDP growth will continue, it will stop around 2125, possibly sooner.
Population will fall so that a steady state can be achieved even if GDP per capita continues to grow slowly (1% to 1.4% per year).
Hi Ron,
When I asked about growth slowing down, I meant over the short term, say the next 20 years. Growth may slow a little due to energy constraints and slower population growth, a major recession is also likely to start within 15 years.
I do not expect it will be permanent, so we could see a temporary cliff in oil output due to a major recession,but then output will decline more slowly as the economy transitions to using less liquid fuel (and fossil fuels in general).
Over the long run growth will stop, but likely in the 22nd century and the way society is organized at that point will undoubtedly be different than today. The problem of a steady state economy may have been solved at that point.
Hi Ron,
In the case of the mortgage crisis, the poor oversight was not in the bundling of the mortgages that was the problem, it was the mortgages themselves. If the loans were good, the bundling would not have been a problem.
The safeguards put in place from 1933 to 1940 in banking regulations were gradually dismantled in the US from 1980 to 2000 and the only post 1929 banking policy left in place was FDIC (and equivalent for credit unions and S+L) insurance.
The defaults in the oil industry that will occur due to low oil prices are not likely to cause another GFC.
Output will fall, oil prices will rise eventually (by 2018) output may rise close to 2015 levels and perhaps even surpass that output level (a coin flip in my opinion). A lot will depend on the price of oil, $80/b in 2018 makes a new peak more likely, if prices rise more slowly and $80/b (2015$) is not reached until 2020, a plateau is more likely and 2015 will remain the peak year.
“the current debt based economic system we now have, requires growth”
Ron, your comment is just flat out wrong. You need to stop drinking your Republican brother-in-laws Koolaid of fear and distraction. What our system requires is an exchangeable currency and enforced regulations. Just because almost every year of your life you have witnessed growth, doesn’t mean it’s required. Most of you might not like it, but there is no law that says the economy can’t contract or deflation can’t become the norm.
Debt is a tool used to maximize economic opportunity. Without the opportunity of debt our economy wouldn’t be the HUGE size it is today. Innovation and education are the fundamental building blocks of growth. The economy needs the next new automobile or internet to grow.
Your missing the forest because your looking at a tree. The Republicans have been playing the debt fear game to obstruct Obama now for 7 years. Don’t fall for their con game.
Central banks are promoting debt with low interest rates to stimulate growth. They can turn it off in a moments notice in the need of price stability.
Money only has value because of government regulations. It’s simply a means of exchange.
XT5, Your first post here. Welcome to the list even though it is very obvious you don’t know diddly squat about economics.
Recession
1.
a period of temporary economic decline during which trade and industrial activity are reduced, generally identified by a fall in GDP in two successive quarters.
We have, in this nation’s history, had many periods of no growth. They were known as recessions. And if those periods of no growth, or actual contraction of growth, last long enough, it is known as a depression. We had one such period on contraction in the early 1930s.
I know that, theoretically, you can come up with scenarios where the economy does not require growth.
The problem is that this has never happened in the past. Every period in our history where we had no growth, or negative growth, we have had a recession or worse.
“the current debt based economic system we now have, requires growth”
Ron, your last comment above makes a case why you think growth is likely, but doesn’t make a case for your original statement. Actually, part of your post supports my comment:
“you can come up with scenarios where the economy does not require growth”
“Every period in our history where we had no growth”
Again, there is no requirement of growth in the economic system. Only in your expectations.
Productivity curve is looking at lot like it’s turning over exactly as predicted by the limits to growth study (and would be more so on a per capita basis that they used). If the model holds, which I think the authors themselves thought unlikely once one of the major extrema is reached, then the route drop down is faster than the growth phase – again more so on the per capita curve as the population keeps on growing foe a few years. The limit comes from excessive resource extraction costs especially for energy, which limits net availability – i.e. call it peak oil for short hand. The debt issue is either noise on the resource dominated trends or has been caused by the resource issues (e.g. using investment strategies that only worked when resources continually got cheaper to extract) – history will tell which more than we can at the moment.
In the UK the pundits have given up saying our productivity issues will be solved by doing XYZ and know say either we aren’t measuring it properly or it doesn’t matter anyway (I got a strange sense of deja vu).
Hi George,
If we look at real GDP per person, it has grown steadily at 1.4% from 1975 to 2014.
See
https://research.stlouisfed.org/fred2/series/NYGDPPCAPKDWLD
Chart below.
But is GDP the same as industrial productivity. As I understand it if my house burns down and I have to rebuild it, GDP goes up, but overall things are worse than before; if I sell you a meal and you sell me one GDP goes up, but if we both cook at home it doesn’t; I think even if house prices go up but nothing else changes, GDP goes up.
Read up on GDP.
https://en.wikipedia.org/wiki/Gross_domestic_product
House prices only affect GDP when they are new or renovated.
GDP per capita is a pretty good proxy for labor productivity, if the percent of the population that is working remains relatively constant at the World level.
I don’t have World employment statistics.
The thing is, we recovered from the crash of 29.
I don’t see any definitive proof that we can’t recover from a new crash brought on by poor banking and credit practices. I am not arguing that we WILL recover from an economic depression brought on by bad debt, but rather than we MIGHT.
The 29 crash was a USA crash, which also spread to parts of Europe, but not the entire world. And that crash did not happen during a decline of world oil production, but during a dramatic increase in world oil production during that great depression. That made a tremendous difference.
This crash will be a worldwide crash and it will happen during a decline of world oil production. That will also make a tremendous difference.
I would highly recommend “Memoirs of Harry S. Truman Volume One: Year of Decision” for insights into the depression years and the many difficulties encountered in putting the US on a war footing at the start of World War II. Interesting look at how the US dealt with material shortages.
OFM,
It’s different this time!
Google Dorothea Lange and compare with a visit to your local WalMart. You are obviously old enough to recognize the almost total loss of essential skills. We now live in a society that expects to be taken care of. Frustrated expectations on a grand scale make Madame Defarge look like an angel.
Dennis,
A Seneca cliff is consistent with our model for prices. This could happen, but is not likely, if there is a large decrease in extraction (production) and the level of extraction stays low for two consecutive years. A sudden drop in extraction could occur if non-OPEC extraction falls at the same time that war breaks out in the Persian Gulf for example.
I wrote a guest post that Ron says he may post near the end of the month when less data is coming in. I will update the post to discuss this scenario.
Hi Schintzy,
There is not a very good correlation between oil prices and output, output is better correlated with either population or GDP, I think the population correlation is due to the correlation between GDP and population.
Oil prices can fall for two very different reasons, a lack of demand or an excess supply (usually it is a combination of these factors). In 2009 oil prices fell mostly because demand fell due to the GFC, from the fall of 2014 to the present the primary factor is excess supply.
Note that I would define a Seneca cliff as a 4% or higher annual rate of decrease in C+C output. Is that what your model predicts?
Note that I do not think this impossible, just low likelihood (less than 15% probability over the next 10 years).
Hi Dennis,
We used autoregression. We have R^2=.37, that gives a standard deviation of about .6, or better than 50% of the change in demand.
Hi Shintzy,
Did you do a multiple repression on real GDP and oil price (independent variables) vs C+C output.
Most of the change in C+C output is explained by real GDP.
A model of C+C output vs real GDP gives an r squared of .983.
A model of C+C output vs real GDP and real oil price results in an r squared of 0.989.
So most of the variation in C+C is explained by changes in real GDP. The models for the 1982 to 2014 period are compared in the chart below along with the EIA annual data. Annual data was used for the regressions.
We did not use GDP. Only prices and historical C, C, and NGL extraction data. A very humbling result. My intuition that extraction had to drop before prices recover was way off! I will try to finish my post this weekend.
Hi Schinzy,
I look forward to your post and sorry for misspelling your name, twice!
I need to get my eyes checked 🙂
DC Wrote:
“Who is the money owed to, aliens?”
Pension Plans, Investors, TaxPayers and corporations. When debtor defaults is causes pain for someone that owns the debt.
DC Wrote:
” For the planet the assets and liabilities match.”
No, because a lot of if was misallocated. Money spend on labor for stuff that isn’t productive to the economy. ie a new casino (see Atlantic city as a reference), new homes that nobody can afford, or in the case of China, whole cities that aren’t occupied. Not every liability has an asset. To simplify, what if a bank loans a person money, but that person wastes the money on drugs and hookers. There are no assets. Many Business over borrow money that is not used for infrastructure. They may use it to hire more people, pay the building rent, or use it for services. If the company business fails there are no recoverable assets. The only asset would been in the knowledge base of a product/service that wasn’t economically viable.
Then there is also the issue when borrowers use debt to buy over priced assets. For instance, Perhaps a home owner, spend $750K buying a home that is really only worth about $100K. When the borrower defaults, at best the lender may recover about $100K when they sell the home. Where I live I still see lots of homes that got foreclosured in the 2008-2009 bust, and are still unoccupied today. I suspect the value of these homes is declining due to lack of maintenance. The Banks are hording these properties because if they sold them at market value it would take a bit hit. So they just hold them and retain the value as the cost of the loan.
There there is the case of Sovereign debt, when nations like the US, spend over $1T in entitlements and Wealthfare every year. The money spend on these programs has no assets and are just worthless liabilities.
I could go on, but I will stop here.
Hi Techguy,
The note is an asset for one party and a liability for the other. The value attached to the note is the same for both.
If a bank is going to loan 750k for a home worth 100k, then they are not very good at their business. The pain of one party in these circumstances is the gain of the counterparty.
The whole unfunded liabilities argument assumed current law remains in place.
Laws can change. The debt I refer to on the public side are treasury notes. Again the assets backing up the notes are not the question it is the assigned value of the note that is on the balance sheets for assets and liabilities as far as debt is concerned.
Who decides the “proper allocation of resources” you?
Currently it seems you would choose to balance the budget and maybe cut taxes? Do you think roads and bridges are a good idea?
Currently the real rate of interest on 10 year government bonds is negative, seems like a good time for the government to borrow and repair crumbling infrastructure.
Hi Dennis, thanks for your comments on the topic of Seneca Cliff/Curve. May I ask how you feel about ideas that suggest a net oil availability curve within a gross oil production curve may be viewed as something like a Seneca Curve/Cliff. It seems to me that decreasing production and decreasing EROI may compound and push the net oil availability curve into something resembling what might be called a Seneca Curve. Here is an example. Is net oil availability something that you can model if decreasing EROI assumptions are made?
http://energyskeptic.com/2014/net-energy-cliff-collapse-by-2030/energy-cliff/
That curve looks a bit suspect – I think he may have taken the expected EROI for new production coming on stream in a given year and mistakenly applied it to all existing production for that year.
I agree. I’m not saying that curve is representative of any reality or forward projections. I’m saying ‘here is an example’, as in an example of a picture showing a net available curve within a gross production curve that might visually represent the effect of decreasing EROI as well as decreasing gross production. I’m wondering if anyone could do a proper job of modelling this concept.
Hi Jimmy,
The problem I see is that we don’t have good estimates of EROEI.
I think net energy should be looked at on and economy wide basis for all types of energy. Much of the energy input to the oil production process comes from energy that is not oil, electricity produced by coal, natural gas, nuclear, hydro, wind, or solar.
Where are the proper boundries for a net energy analysis?
To me it is simpler to just look at energy output.
This would roughly tie in with Ron’s estimate of an all liquid peak in 2015.
Actually I made no such estimate or prediction. My prognostications deal only with crude oil or crude plus condensate. All liquids include biofuels and bottled gas, (commonly called NGLs). I have no idea what’s ahead for them.
My apologies Ron yes it was a C&C production prediction if I recall correctly. I’m doing this on an old model IPhone so I can’t easily navigate to older posts. Although it still does roughly correlate to a drop in emissions at around the same time.
Marcus,
The Seneca cliff scenario for oil production is also my likely view.
Rig counts did already fall off in a Seneca cliff fashion. So, it is just logical that production for oil and gas will follow. However there is a time lag, which many interpret as production resilience or technological advancement.
As oil production is a mix of conventional and unconventional, on – and offshore production, timing is nevertheless difficult.
Hi Heinrich,
We have seen oil rig counts fall steeply in the past, the only thing close to a Seneca Cliff so far has been 1979 to 1983. If there is a major War among most major oil producers in the Middle East (say Saudi Arabia, Iran, Iraq, and Kuwait), we would see a Seneca cliff until the War ended, then output would recover somewhat, though a transition to EVs, plugin hybrids, more public transportation, and generally more efficient vehicles would make demand for oil far smaller than before.
“We have seen oil rig counts fall steeply in the past, the only thing close to a Seneca Cliff so far has been 1979 to 1983.”
The Demographics is the West was much better than today. Today we have an aging population as well as unsustainable debt loads. You really can’t compare the past with the future. The Younger generation (mostly Millennials) is un-prepared to take over retiring boomers. Millennials were largely poorly educated on the real world and have been coddled into an “entitled” lifestyle. While I am sure there are good working Millennials, they are a very small number of population. I see very few Millennials in any of the companies I work with.
My personal feeling is we will just see a slowly deflating economy, taking energy production down with it. With a vibrant economy to support production and higher energy prices its going to be impossible to grow or sustain Oil production. I think its likely to be a bumpy and chaotic race to the bottom as we will see periods of fast economic declines (like the 2008-2009 crisis) and very anemic recoveries. We likely see Oil prices spikes higher and lower, but a lot of volatility in Oil prices. We might also see Oil shocks, if a Hot war in the Middle east breaks out (we aren’t too far from that happening today).
At some point we will breach a tipping point that sends the global economy off the Seneca Cliff. This will happen when the basic systems and infrastructure can no longer be sustained and everything begins to shutdown very rapidly. The other very likely scenario is that we go out with a bang in another global war as economic/demographic/social problems mount, as they did during the first World war. We can see tensions in the Middle East continually grow. Certainly a nuclear war between Iran/KSA/Isreal, is likely going to drag in the US, Europe, Russia, and probably China.
Hi Tech guy,
Yes I suppose it is possible, just not likely in my view. I think young people are better educated than you realize. We will have to deal with the demographic problems, Japan and Europe are the test cases, we will figure it out, in 30 to forty years many of the baby boomers will have passed on (including me). Economic growth will slow over time as population growth slows and energy will be used more efficiently as energy prices rise, so energy growth rates may indeed decrease because demand for energy will grow more slowly.
Oil production will fall, just not as fast as many believe. At some point if the transition to alternatives becomes too difficult we may see a major depression. Such a crisis may lead to major war or it might lead to positive social changes (carbon taxes for example and maybe a build out of public transportation and an HVDC grid), or as in the case of the 1930-1945 period maybe it will be some positive and some negative changes. This seems a more likely scenario than only negative outcomes, there will be both good and bad.
Drop in CO2 for 2015 has been attributed to lower Chinese coal use due to a mild winter, possible reduction in industrial activity, and overall wetter year which increased their hydroelectric output. It may take some time to confirm the data, and of course unknown if this will be sustained.
Might it have anything to do with the fact that global wind generating capacity grew by 17% to reach 432,419 MW at the end of 2015 (see http://www.gwec.net/global-figures/graphs/ ) and global PV installations grew by more than 32% in 2015 adding more than 57,000 MW to finish the year at more than 235,000 MW (data from estimates gleaned from various sources)? Given an average capacity factor of 30% for wind and 20% for solar that would mean that Wind generated about the same as about 130 GW of FF powered plant running at 100% and solar would have generated about the same as 59 GW of FF plant. That’s almost 190 GW or more than 3% of a world total of 5550 (as at the end of 2012 according to data from the EIA)
Surely there will come a point when economic growth can occur without growth in FF use and carbon emissions or is that just wishful thinking on my part?. It is interesting that the country with the largest growth in both wind and solar over the past couple of years is also the country that was growing it’s carbon emissions the most, China. It is also interesting that the second most populous country on the planet, India, is beginning to set some very ambitious targets for renewables. Things are almost starting to follow the narrative of Tony Seba, in that, he argues that renewables will become the least expensive source of electricity, with solar PV ultimately becoming the major source of all new generating capacity world wide by 2030.
Hi Islandboy,
Eventually Tony Seba will be right, I just think he is 20 years too optimistic so 2050 seems more realistic to me than 2030. Hopefully he is right and I am wrong, but unfortunately I may also be too optimistic, interesting times to be sure.
Dennis, were it not for the fact that, I have witnessed one technology disruption after another for all of my adult life, I would agree with you. I entered college as a teenager, just before the original IBM PC made it’s début so, that should tell you all you need to know about my experiences with disruption. My observation is that these disruptions start as a hardly noticeable trickle with one or two sightings of the technology every few months, before the trickle gets noticeable. After the trickle gets noticeable, it seems to be a very short period before the new technology is everywhere and before you know it, everybody has one (smart-phones being the most recent example that comes to mind).
Take a look at the following story:
Wind and solar provided all new U.S. electric capacity in January
All of the new utility-scale generation capacity added in the U.S. in January came from 468 MW of new wind and 145 MW of new solar, according to the latest “Energy Infrastructure Update” from the Federal Energy Regulatory Commission (FERC). There was no new nuclear, coal, natural gas, or oil generation capacity.
Renewables now provide 17.93% of U.S. installed electricity generation capacity, with hydropower leading at 8.56%, followed by wind at 6.37%, biomass at 1.43%, solar at 1.24%, and geothermal at 0.33%. Non-hydro installed renewable capacity, at 9.37%, beats nuclear’s 9.15% and oil’s 3.84%.
2015 was the second year in a row where renewables provided the largest share of new capacity, more than half and January 2016 is not the first time that all new generating capacity has come from renewables, specifically solar and wind. See:
Renewable Energy = 100% of New US Power Capacity In October
Following up on CleanTechnica‘s latest “US Electricity Generation Report,” here’s our latest “US Electricity Capacity Report.” The story in October is what it has been on numerous occasions in the past year — renewable energy accounted for 100% of new electricity generation capacity additions. Wind and solar accounted for 98% and biomass filled in the other 2%.
Bold mine. Bearing in mind the story on PV cost manufacturing technology I posted further down, how long is it going to be before that is the story every month and the addition of capacity that is not renewable becomes newsworthy? Methinks we have past the point where “the trickle” becomes noticeable so IMHO all bets are off on when “the trickle” will become a deluge.
And by the way, it’s not just the US:
Global Renewable Energy Capacity Reaches Milestone
A new report from the International Energy Agency reveals that half of all of the new energy capacity added in 2014 came from renewable sources. The agency predicts that wind and solar projects in many countries will surge this year.
October 27, 2015—World energy markets added 130 GW of generating capacity from renewable energy sources in 2014—nearly half of all new net capacity that was added during the year, according to a new report from the International Energy Agency (IEA). The report projects strong growth will continue into 2020, with renewable energy serving as the largest source of new generation capacity—approximately 66 percent—at that time.
“What we are finding is the cost of renewables has come down so much that renewables can actually satisfy [the majority of] new demand growth in some regions…if you have the right policy conditions there,” says Michael Waldron, a senior renewable energy market analyst for the IEA.
“The costs for wind and solar PV [photovoltaic] have dropped quite fast in emerging markets and places where you have a stable, enabling [policy] environment,” Waldron explains. “These areas typically have growing demand—places such as South Africa, or Brazil, or some Indian states. They also typically have better resources than you would find in Europe or the United States. As a result, you can get some very low renewable generation prices,” Waldron explains.
Hi Islandboy,
I agree there are hopeful signs, but growth rates will likely slow down in the future, I agree it will happen, but it will take some time, that is all I am saying. On rereading the Tony Seba prediction that all new capacity may be solar by 2030, that doesn’t sound so far fetched.
The key is new capacity, I was thinking (or misreading) him to be saying all capacity, which is very different.
The main objective is to be able to replace declining fossil fuels with wind, solar, and nuclear power. So the question is can the rate of increase in energy from alternatives rise as fast as the fossil fuel output falls combined with increased fuel efficiency which will decrease the need for energy.
Dennis,
You know what occurred to me just from reading over what I wrote about my obsrevations of disruptions? The late Prof. Albert Bartlett’s lecture on “Arithmetic, Population and Energy” contains a section on how exponential growth is observed if you have a pond with a population of lilies that is growing exponentially by doubling every day. His point was that, by the time you notice that the pond has a lily problem you are mere days away from the pond being completely smothered by lilies.
The analogy I used of “the trickle” becoming a deluge is a take on the observation of exponential growth. It tends to catch us by surprise, every time!
Yep, Professor Bartlett’s most astute observation was saying that the greatest shortcoming of the human race is our inability to understand the exponential function…
Hi Fred,
The exponential can be overused, most curves of growth in nature are sigmoid in shape.
I think the idea that the exponential will continue at a constant rate of growth is not very persuasive.
Wind and Solar output have grown at about a 25% per year from 1994 to 2014 (BP data in Mtoe).
I don’t think it realistic to assume that growth rate will continue for very long.
For oil and natural gas output the rate of growth averaged 6.6%/year from 1900 to 1979.
It is difficult to predict the future growth rates, but 2010 to 2014 was about 21%/year average growth for total wind and solar output, this rate will fall over time.
Of course the growth rate must fall:
1) We are dealing with physical resources and not just numbers on paper or bits in a computer. At some point resource constraints will be encountered.
2) According to Prof. Bartlett’s arithmetic, an annual growth rate of 21% means a doubling time of about three and a half years. If wind and solar are at 3% now five doublings would take them to 96% and with a doubling time of 3.5 years that would take only 17.5 years! Solar and wind do not need to produce 96% of the world’s electricity needs so at some point before five doublings are realized, there will simply be no need for more.
On of the points of Prof. Bartlett’s lecture is that exponential growth of physical quantities in a finite space is unsustainable and at some point you will run into one limit to growth or another.
Gawd! How many times do we have to go over this one?
Exponential growth, characteristics of?
I used to teach ME thermo. I kept getting the same Q’s every semester, and all too often, the same ones several times during the semester. So I wrote down all those questions, and a tediously detailed answer to them and handed it out to every student with the admonition that it could be asked ONCE as appropriate in the course of the series of lectures.
After that, I gave a penalty to the asker, demanding that he take that handout, read to the class the Q he had just asked, and then read the answer he was supposed to have already internalize, and then listen to the comments of the other students, some of which were of course pretty sarcastic.
Did it work? Of course not.
So I quit the teaching job and went into harvesting lilly ponds. Actually, duckweed.
Did it work? Not yet, but it’s fun to watch that exponential growth right outside the window.
Hi islandboy,
My point is the same as Bartlett’s.
I believe his point was that assuming a 21% growth rate will continue for very long is not a very good assumption.
A more realistic growth scenario might be a 1% decrease in growth rate each year several years(20%,19%, … , 9%, 8%) and the a 7% growth rate for many years (as was the case for the oil and gas industry) starting from 2015 (2014 wind and solar output about 200 Mtoe/year).
That model gets us to about 1/2 of 2014 total fossil fuel energy consumption(about 6000 Mtoe/year) from wind and solar by 2053.
the important number is fraction of energy used that’s renewable. That number can quickly get close to 100% driven by exponential REDUCTION of total energy use as AMOUNT of sustainable energy levels off.
That is to say, getting smarter about not
tossing most energy out the window the way we do now. And relative cost-effectiveness.
Just look at history. how long to get from no cars to all cars? Or all sail ships to all steam? years, not decades.
No more than 20 yrs after he wrote “two years before the mast”, Richard Henry Dana wrote about going to same places on a steamer. In luxury, and famous. And probably a hell of a lot fatter than that strong kid up the mast trying to furl that iron frozen sheet in the antarctic gales.
Always, as the new rises, the old shrinks. What counts is % new/old, which can go to 100% in an eyeblink.
S shape irrelevant.
Hi Wimbi,
I think if I am going to do a model it should be relatively realistic.
Yes the new will displace the old.
However assuming we will reduce our use of energy as radically as you believe possible is not very likely over the next 20 years.
What do you think will change to cause the slope of the curve of Energy intensity vs time to become steeper.
I assume the trend won’t change dramatically because it has been stable for 30 years.
So to assume that growth rates will remain 20% per year for wind and solar is not very realistic in my view.
The U.S. energy storage market just had both its best quarter and best year of all time. According to the GTM Research/Energy Storage Association’s U.S. Energy Storage Monitor 2015 Year in Review, the U.S. deployed 112 megawatts of energy storage capacity in the fourth quarter of 2015, bringing the annual total to 221 megawatts. This represents 161 megawatt-hours for the year.
The 112 megawatts deployed in the fourth quarter 2015 represented more than the total of all storage deployments in 2013 and 2014 combined. Propelled by that historic quarter, the U.S. energy storage market grew 243 percent over 2014’s 65 megawatts (86 megawatt-hours).
http://energystorage.org/news/esa-news/us-energy-storage-market-grew-243-2015-largest-year-record
I wonder how big the impact has been globally, so far, on the prices of coal and gas, due to the rapid expansion of wind and solar power. If we assume that all wind and solar power production offsets coal and gas generation, that means coal and gas sales, combined, for electrical generation will be off almost three percent. (Some small amount must be burnt to provide some additional hot spinning reserve, when wind and solar are added to a grid. However much it is, it is not a lot. I have been searching for this data a long time with no luck. It’s a cinch the utilities know how much to the last dollar, but they just won’t say. )
Personally I believe all the subsdidies spent on wind and solar power, collectively, by society, will be recovered with a ” profit”, collectively, by society, over the next two or three decades due to inflation alone running up the price of gas and coal.
Solar might come along as fast as Seba thinks, because there is close to enough conventional generating capacity already built to meet our needs in the richer countries already, given that wind and solar will be ADDING to that capacity.As more wind and solar power are added, the amount of fossil fuel back up needed as a percentage of the total will gradually fall off.
And in parts of the world where there is as yet NO GRID, or only a grossly inadequate grid, poor people by the tens of millions will be very glad to make part of their domestic and business hay with intermittent solar power when it is available.
Farmers have been making LITERAL hay when the sun shines for thousands of years. My great grandparents would have been tickled pink to run a couple of small electric motors on days when the sun was shining prior prior to the coming of the grid. They could have ground flour and meal, crushed apples, sawed some lumber , pumped domestic and irrigation water, cooled the house with a fan, run a refrigerator set below freezing temperature to make ice enough to last thru cloudy days, etc.
An Indian or Pakastani carpenter will be glad to arrange his work so as to use electric power tools when the sun is shining. Ditto a poor Indian tailor who can run his sewing machine on solar power. The potential for very fast growth of solar especially in poor countries can hardly be overestimated.
Some countries with forward looking governments will realize that importing coal and gas in a world of depleting resources is a risky proposition, and that their local economy may not always be able to stand the strain. In this case, such governments can be expected to do whatever they can to up the production of renewables, and curb fuel imports.
The 2014 peak CO2 emissions may also be tied to the ongoing shift from coal-fired power plants to natural-gas power plants, which produce a fraction of the same CO2 for the same kWh production. BP’s 2014 data shows that coal consumption was essentially flat in 2014 – no data for 2015 yet.
“Global coal consumption grew by 0.4% in 2014, well below the 10-year average annual growth of 2.9%”
http://www.bp.com/en/global/corporate/energy-economics/statistical-review-of-world-energy/coal-review-by-energy-type/coal-consumption.html
Good catch HVACman. My graphs from the EIA’s Electric power monthly show NG’s share of electricity generation going from under 20% to over 30% between 2005 and 2015, while coal’s share declined from 50% in 2005 to an equal share with NG by 2015. The monthly graph shows NG generating a greater share than coal for seven moths out of 2015 and the trend is for coal to generate a greater share than coal for most of 2016.
While this data is for the US, the fact that the US was the largest consumer of electricity in the world for most of the period shown, means that any shift in US consumption patterns should have a significant impact. Also noteworthy is that, following the significant pollution problems in China, largely as a result of FF use, Chinese efforts to mitigate their pollution problem can be expected to continue.
HVACman
“the ongoing shift from coal-fired power plants to natural-gas power plants, which produce a fraction of the same CO2 for the same kWh production.”
Not really, its only about a 40% reduction. But at the cost of burning up the remaining NatGas supplies at an accelerated rate. What is Plan B, when the Supply of NatGas become constrained due to depletion?
In my opinion, NatGas is to valuable to burn to produce electricity since it used for domestic heating, industrial production, Chemical production, and so on. This is short-term thinking on a grand scale. Just like in the 2004-2008, everyone was convinced it was a smart time to buy an un-affordable home. I am sure this grand delusion of replacing Coal with NatGas will be much, much worse than the housing crisis.
Yes, and it is crazy yo be exporting Nat Gas!
Interesting we are seeing a crude oil rally in March, as in 2009 and 1999. Of course, we also had a rally in April in 2015 that didn’t hold.
There are some that are saying this is due to a massive short squeeze as happened recently with iron ore, but I had not thought about the March correlation.
Last April didn’t include the most important presidential election this country has seen in decades. If either of the two insurgent candidates wins it could deliver a mortal blow to the empire. Anyone who thinks they know why the price of oil is rallying is living in crazy-town. Could be anything. Could be short squeeze, could be Chinese, could be Japan (based on a secret G-20) agreement. Who is the biggest beneficiary of an oil price “stabilizing” around $35 – 45? Besides the containment of contagion from energy to banking sector – Obama to Hillary baton hand-off.
I think we are about balanced as the market is tightening up rapidly. US production is dropping 100-150K B/D per month, the rest of the world is probably dropping at the same rate. Demand growing about 100k per month. It will not be long now. I think oil prices are going to rise rapidly into year end.
John Keller,
In my opinion a sustained oil price rise will only happen if the recent announced cuts by shale producers will hold. There is also a lot of inventory to be reduced. We need also a confirmed bottom, which would be a higher low than the last low point in February.
So, oil will bounce at the bottom of the barrel for a while until it can go up on a sustained basis.
I guess that is what makes a market.
I’m putting my chips down.
Despite the talk of record inventories, it would take less than a 1 million b/d change in supply/demand to bring them back to levels from a few years ago. I think the market will start looking forward and 2017-2019 will be good years for the oil producers, barring a global recession.
Y’all don’t have any idea what amount of oil will do what to price.
Y’all don’t have any idea IF any amount of oil will affect price.
There is no market. Money is printed whimsically without any underpinning by the Fed and other Central Banks and only by their agreement to cooperate with each other does impunity exist.
How can there be a market when there’s no meaningful measure of what you think of as price? This genie left the bottle in 2009 and it’s not going back in.
Watcher
“Y’all don’t have any idea what amount of oil will do what to price.”
That is a reasonable statement.
“Y’all don’t have any idea IF any amount of oil will affect price.”
That is not a reasonable statement. Suppose oil production drops in half, tomorrow and forever. That will affect price. I leave it up to experts like you to determine whether it is up or down.
Is Y’all a disrespect to Southerners, or are you from the South? I was born and raised in the US North, but moved South as an adult and found out that “Y’all” is smarter than Ya’think.
And, why can you not figure out that if money did not exist, you would not have a computer to spit forth your opinions on money. You would be bartering your daughter for food.
The system operates on money in the context of mutual agreement — NOT in the context of rational, calculated underpinning.
That’s gone and it’s not coming back.
Hi Watcher,
As long as price doesn’t matter, I’ll take 1000 barrels for $0.01/barrel. Ok?
My stupid excel model is now saying the oil price will average about $62 per barrel. That’s a slight drop from the $65 it showed two months ago. To be honest, it’s an incredibly stupid model, but I like it better than anything else I’ve seen.
Hi Fernando,
Do you have a link to your model (they are all simplistic, but some are better than others)?
In my opinion your model would be better than most.
The average oil price in January-February was $31
To average $62 in 2016, the average price in March-December should be $68.2
Are you serious, Fernando?
🙂
Good point, but he has said this several times, with no 🙂
So I assume he is not joking.
shallow sand,
China did increase its oil imports over the last few months to over 30 mill tons per month (see below chart). Together with natgas and cyclical hydrocarbon imports this adds up to 40 mill tons of hydrocarbons per month, which is around 10 mill barrels per day.
Slowly the fundamentals are building up for an oil price rise, although I think we will get a pullback over summer.
“The data also showed China’s February crude oil imports jumped 20 percent on year to their highest ever on a daily basis, driven by import quotas and stockpiling.”
From a China article today.
clueless,
In addition to the surge of oil imports, natgas is up year over year 100%, copper 50%, copper ore and extractives up 92%. The increase is all up in volume as imports in dollar terms are still very low due to low prices. However these numbers are huge as China is one of the largest importers in the world.
To me this looks like the early sign of a nascent commodity recovery.
3 main drivers of China’s higher oil imports are:
1) state and commercial stockpiling
2) robust gasoline demand (not closely correlated with economic growth, as opposed to weak diesel demand).
3) rising fuel exports
“Fuel exports in February rose 71.8 percent on a daily basis compared to the same month last year, reaching 2.99 million tonnes, or 721,700 bpd, after hitting a record 975,500 bpd in December, as China continues to export more diesel amid weakening domestic demand for the industrial fuel.”
http://www.reuters.com/article/us-china-economy-trade-crude-idUSKCN0WA0A2
Alex S,
“…as China continues to export more diesel amid weakening domestic demand for the industrial fuel.”
Plus: There’s increasing demand in China for gasoline as more cars are built and sold. More gasoline coming from refineries means more diesel coming from refineries, as they produce both.
The small “teapot” refineries are being given permission to import gasoline now, I believe, so that will help reduce overproduction of diesel, and the government has imposed a price floor too; that helps reduce the panic exporting.
AlexS,
The driving forces of Chinese oil imports are exploding car registrations:
http://www.tradingeconomics.com/china/car-registrations
The Chinese car market is much bigger than the US car market. And also growing much faster.
When a commodity cycle starts, metals (gold, silver, base metals…) are first to soar. Oil is actually the last to rise as oil in most cases brings a commodity cycle to its end due to higher inflation.
Yes, China exports diesel and gasoline, yet it also imports oil products of 2.66 mill tons per month.
http://info.hktdc.com/hktdc_offices/mi/ccs/index_static_type/ChemicalImport.htm
Net exports are close to zero.
There is little doubt that China is in the early stage of a massive upswing. Anyone who hopes for higher oil prices should hope also for a Chinese recovery. Oil prices will not go up without a Chinese recovery.
Heinrich Leopold
Changes in China’s imports and exports of crude and refined products are obviously important.
But what really matters for global supply/demand balance is
1)China’s oil consumption.
2) China’s oil production
China’s demand for diesel, which is an indicator of economic activity, is weakening.
Demand for gasoline, which is an indicator of growing car ownership, is robust.
Overall, demand growth is slowing.
But this is partially offset by projected decline in oil production in 2016, the first in many years.
China: demand by product
source: IEA OMR Feb 2016
Thanks Alex. Indeed quite a reduction in growth compared with the last years.
AlexS,
As the demand growth in 2015 has been way underestimated in 2014, it is again underestimated for 2016.
The IEA numbers for 2016 are just an estimate and not yet a fact. Car registrations and import numbers reveal way higher numbers are likely for China in 2016.
A strong sign of a Chinese recovery is the recent strength of the yuan, record high of new loans (2500 bn yuan) and strong money suppley (+14%).
Heinrich Leopold,
You are right, the IEA has significantly increased its estimate of China’s oil demand for 2015.
Last year, incremental demand was actually higher that in the previous 4 years.
I also agree with you that IEA likely underestimates China’s demand growth in 2016.
But this growth will still be slower than last year; it will not accelerate.
Growing imports reflect buying by the government and oil companies for stockpiling and increasing exports.
China’s y-o-y oil demand growth, 2000-2016
source: IEA
As I said above, there is also a serious structural shift in China’s oil consumption.
It is now driven by gasoline, which is due to growing private car ownership.
By contrast, demand for diesel, which is mainly consumed in the industry and construction, has sharply decelerated.
And this seems to be a long-term trend, as China is gradually changing its economic model from export-oriented, based on heavy industries and construction, to a more focused on private consumption.
China: y-o-y growth in gasoline consumption
source: IEA
China: y-o-y growth in diesel consumption
source: IEA
Hi AlexS,
It is possible that diesel fuel is being used more efficiently by the Chinese economy. For example diesel is essentially the same as heating oil and as China develops less will be used for heating buildings as natural gas pipeline infrastructure expands, there might also be some switching to heat pumps for heating. These switches take time and there is a significant time lag between high oil prices (from 2011 to mid-2014) and when we see the long run demand effects.
Also the expansion of auto sales tends to increase employment and economic activity throughout the economy.
For these reasons I think a focus on total oil demand makes more sense than a focus on only diesel demand.
Dennis,
Yes, there is an effect of fuel substitution.
I’m not sure if a lot of diesel is used for heating in China (I think they are mostly using LPG, coal, firewood, etc.), but certainly there are sectors of the economy where it can be substituted or used more efficiently.
For example, in the 2000s, a lot of diesel and residual fuel was used for power generation, as despite a rapid growth in generation capacity China often experienced serious power shortages. In particular, that explains a spike in oil consumption in 2004. China now has sufficient generation capacity, so diesel use for power generation in the commercial and residential sectors is diminishing.
But more important is a structural shift in China’s economy and energy consumption patterns. The country is undergoing a gradual transition to an economy oriented toward private consumption. The share of less energy-intensive sectors, such as services, in GDP is increasing. Fixed investment/GDP ratio is declining from 40-50% to more sustainable levels, which means relatively slower growth and less infrastructural developments. All this should lead to a less energy-intensive economy and relatively lesser use of industrial fuels, including diesel.
By contrast, gasoline demand is driven by rising living standards, growing middle class, and hence rapidly increasing car ownership. Gasoline consumption will continue to grow at a high rate, even though economic growth is slowing.
AlexS,
Nice analysis, agree 100%.
Yes the Chinese economy is changing shape from its decades of huge diesel intensive hard infrastructure building (high speed rail, urban metro systems, highways) now shifting to consumption, and reeling the rewards of building those high capex but spatially and energetically efficient movement systems ( especially electric rail – their HSR network over took the US interstate system as the world’s biggest infrastructure – and are now so much better suited to the 21st century tha the US )
Side note: Australia which bet that Chinese demand for coal and iron ore is infinite are now hurting after gambling on that (and that no one would cafe about climate change) and that side of their economy is suffering. Here in NZ, by contrast, our soft commodities are rising in demand in China.
Here’s the deal. China may actually be the country where EVs take off in a big way first (if you leave Norway out of it). The following insideevs.com piece rates China as the number one EV market in the world. I don’t understand the metrics used by the author for the countries below China on the list but, it is hard to deny that China is the fastest growing market for EVs or that the highest absolute numbers of EVs are being sold in China.
World’s Top 7 Electric Vehicle Adoption Countries for 2015
1. China
up from #3; local sales 207,000, plus a lot more buses and commercial trucks. Claim to fame: easily overtook USA this year for the global volume title; increased 300% over 2014; most sales locally made by a diverse domestic industry; makes and deploys the vast majority of the world’s EV Buses.
China has once again proven that despite its huge size, it can turn its economy and industry on a dime. They’ve been doing this every few years now, in a manner rivaling what the USSR and USA accomplished during World War II.
As always, when you crank out an omelette this big, eggs will break. Indeed, the sooty fallout of last decade’s massive industrial push is one big reason why China is in such a hurry now to clean up its energy grid, and its car and bus fleet. Hopefully they are learning some lessons, and not just causing problems just as big downstream.
This concern is important. For example, in January Amnesty International published a meticulous report, showing that China’s Huyaou Cobalt company buys cobalt mined off of Congolese child and slave labor. It then sells the cobalt directly or indirectly to Li-ion battery makers, including BYD and interestingly, Korean LG Chem and Samsung. This must stop.
That said.
It is simply mind-boggling, that in 2012 China had all of 3,000 EV sales. The US was already at 52,000 at the time. Three years later, they have apparently crossed 200,000 sales for the year, with 35,000 EV sold in December 2015 alone.
China To Increase Annual Purchase Ratio To 50% Electric Cars For Some Government Departments
he Chinese government intends to further augment plug-in electric vehicle sales by increasing purchases from various government departments.
The latest move sets buying guidelines of more than 50% of new purchases to be NEVs (New Energy Vehicles – electric or plug-in hybrid).
What this means for future gasoline consumption growth in China is anybody’s guess but, it appears to me that EVs are in the early stages of an exponential growth phase.
Why drill when you can refracture?
http://sdsearch.datapages.com/data/search.do?selectedGroups=46&fullDoc=Bakken&Search.x=0&Search.y=0&Search=Search
A Commercial Evaluation of Refracturing Horizontal Shale Wells
Purvi Indras
Abstract
“Low commodity prices and high costs associated with drilling and completing multistage horizontal shale wells have forced the hand of many US independent E&Ps. Firms are curbing new drilling activity in shale plays and instead are focusing on improving project efficiencies and controlling cash flow. Refracturing programmes are gaining momentum as it costs less to restimulate a producing well versus drilling an entirely new well.
Despite the bullish view, some players have about refracturing, uncertainty remains surrounding the well selection process and the long-term commercial success of refracs. This paper seeks to address this uncertainty by assessing the economic performance of refracturing programmes in three well-developed shale plays – the Bakken, Barnett and Haynesville.
Sensitivity analysis shows that refractured wells, in the Bakken and Haynesville in particular, can generate higher Net Present Value (NPV) than drilling a new well. Refractured horizontal wells in the Barnett, in contrast, show evidence of reduced recoveries and in some cases even value erosion.
Our analysis of historically refractured wells in the Bakken, Barnett, and Haynesville also leads us to believe that the variation in outcomes is too wide for refracturing to be adopted on a large scale today. While some restimulation events indeed have a profitability index (P/I ratio)
larger than a new well, others (even in the same play) generate very poor economics. We believe that technology will play a key role in making this asset management approach more common, particularly in decreasing the number of failed restimulation attempts.”
http://sdsearch.datapages.com/data/search.do?selectedGroups=46&fullDoc=Bakken&Search.x=0&Search.y=0&Search=Search
SM Energy was at $8.00 on Monday of last week, today it is over 17 USD.
Still losing 6.60 USD per share, they must have some money in the bank.
Peabody Coal (BTU) is 4.79 USD today, up $1.39, still losing 112.00 USD per share, the 52 week high was at 99 dollars and the low was near 2.20 USD, it don’t look too good for Peabody. Some say the company is being stolen by bondholders.
http://seekingalpha.com/article/3952486-peabody-energys-senior-creditors-trying-steal-company
Far be it from me what is going on with BTU. I wonder why the symbol is BTU? har
Coal companies across the board have not been going gangbusters, but seem to be gaining some ground in the stock market.
If you bought Whiting at lows, Oasis at lows, sometime before last week, you have done good. RIG has gained about fifty percent since last week.
Looks like a bottom was formed.
Fossil fuels aren’t going to go away anytime soon, so it might be a good idea to look into investing some pennies into some oil stocks. Let the rig counts drop some more, buy before they do.
My little old oil stock has gained 100 percent lately, but it is nothing to write home about.
Of course, I’m not going to tell you what stocks I am seriously considering to purchase, that would be giving away too much. ?
The reserves I have seen on refracs in the Haynesville do not work at $1.75 gas. 2 BCF for a 2.5 million dollar refrac does not seem like a money maker, but I guess if your goal is to lose as little money as possible while staying active, I guess it is an option. Not all wells are candidates for refracs, so you are limited there as well.
$37.90
not sure what happened today, but a trend is starting to show
[…] Peak Oil Barrel […]
http://perfscience.com/content/2143387-nasa-blames-severe-drought-issues-middle-east
Given the recent population explosion in the general area, the people there are going to have some REAL problems once the oil revenues dry up. A few little religious wars won’t look so bad, compared to mass starvation.
I just can’t see the locals exporting any thing OTHER than oil to pay the grocery bill.
I got a ton of E-mail alerts about Saudi Aramco hiring for unconventional oil. Does anybody know what this is all about?
They are developing unconventional gas to free up oil from power generation for export. I’ve not heard anything about unconventional oil before.
George. You are right, they talk about unconventional resources (not specifically oil)
I thought that Saudi/Kuwait had a water flood going in the Neutral Zone [with Conoco??].
I think it is very likely the Saudis and some of their more prosperous oil exporting neighbors will be building some truly massive solar farms within the easily foreseeable future, so as to run their air conditioners on solar power and have more oil to export.
Given the dependability of the solar resource, the close match with the peak load, the falling price of solar, and the likely increasing price of oil, this will eventually be a no brainer decision.
What is LTO oil?
https://en.wikipedia.org/wiki/Tight_oil
“Light tight oil, abbreviated LTO”
Many older retired geologists have doubts.
What is the chemical composition of C (X?) H (X?) ………………
How is it created? In what geological era?
As it is closed in the geological layers of impermeable?
(Other has been to migration (phenomenon of capillarity) to the other layers)
The final, this is important: how many really LTO is all over the world?
https://en.wikipedia.org/wiki/Tight_oil#Size_of_tight_oil_resources
Strange doubts?
In Europe, oil LTO was not found.
ERRATA,
Light, tight oil is oil that is contained in fractures in impermeable source rocks–rocks that oil cannot flow through. “Light” indicates that the oil has relatively low viscosity; “tight” refers to it being in impermeable rocks.
The oil is drained from the natural fractures in the impermeable rock by creating artificial fractures that intersect the natural ones; the artificial fractures originate from a well bore, and are caused by pumping water under high pressure through it. (This is called “fracking.”)
LTO is created the same way as other oil–it is just oil–and varies in composition and age just as other oils do. It is found in many parts of the world but has been developed most successfully, so far, in the US. There are large deposits in Argentina, where work has begun on exploration and development of the Vaca Muerta play; there is plenty to be found in West Siberia in Russia, too, but it will be a while before we see much development there, I think. (I’m no expert.) LTO is more expensive to obtain than oil from the conventional types of reservoirs the oil industry has been using for generations, so that has slowed development, and there are other factors that have delayed production too.
There has been exploration for LTO in Poland but no economically viable deposits were found. There is a lot of exploration yet to be done world-wide.
The rocks aren’t necessarily impermeable. It’s simply a question of extremely low permeability. I tend to agree with Errata, the combination of geólogy, reservoir geometry, surface conditions, and economic conditions will be really hard to find. The USA is unusual, it’s not likely to be matched by any other country.
Just a small tit-bit for those interested in news that might impact the demand side (in the long run).
NexWafe raises 6 million euro for its kerfless wafer technology
“Our unique technology enables us to fabricate monocrystalline wafers directly from chlorosilane with an extremely low energy and material usage,” said NexWafe CEO Stefan Reber, in a statement. “In a first phase NexWafe will fabricate in its technical center EpiWafers for highly efficient solar cells to be fully qualified with selected partners from solar cell and module manufacturing.” Reber is the former head of department Crystalline Silicon – Materials and Thin Film Solar Cells at Fraunhofer ISE.
NexWafe’s technology involves an atmospheric pressure chemical vapor deposition (APVCD) process, at 1,300C, for the production of PV wafers. In January 2015, NexWafe reported that it intends to establish a 250 MW line using its technology, with production targeted to commence in 2017.
NexWafe is not the only company pursuing kerfless wafer production in the PV sector. 1366 Tech, from the U.S., has already formed an R&D partnership with Hanwha Q Cells and is operating 5 MW pilot line, with plans for a 250 MW line in New York State set to commence production this year. Hanwha Q Cell has produced a 19.1% monocrystalline cell using 1366 Tech’s wafers.
These are significant price reductions that are “baked into the cake”, so to speak. Barring a significant balck swan event, these cost reductions should begin to impact module prices within the next couple of years and kerfless wafer production should eventually become the dominant technology. IMHO this stuff will have an impact on demand for NG in most large economies and oil in small island economies such as the one I live in.
A 1 GW PV manufacturing plant is under construction in Buffalo, NY, by Solarcity.
http://buffalobillion.ny.gov/buffalo-hightech-manufacturing-innovation-hub-at-riverbend
http://blog.solarcity.com/silevo
Kerfless wafer fabrication – eliminating the waste of expensive silicon that comes from having to cut a large crystal into thin wafers via a saw, producing waste crystalline silicon sawdust.
The problem is that even now, with conventional cell fabrication, the cell costs are becoming less and less of the overall installed PV system cost. Everything else, from panel assembly and shipping, to balance-of-system costs like inverters, wires, support racks, roof flashings, and installation labor are more of the cost. Improved cell energy conversion efficiency is actually a more important advance than improved cell-cutting materials efficiency , as improved cell efficiency reduces both the silicon material required used and panel size per kW rating, which also reduces panel assembly costs, shipping, support rack, and installation labor costs.
The last I read about it, the Germans are doing turn key small scale solar installations for half the going rate here in the supposed home of the master tradesmen, the USA. I guess we will catch up to where they are now in another five or six years. LOL
Can anybody other than yours truly imagine how well the Germans would be doing with renewables if they were located in the American southwest with plenty of Texas grade wind and sun?
Making moonshine while also inviting 2 million Muslims to invade the USA by offering them unemployment benefits and free housing and medical care?
6 million EUR will frack a single LTO well. Really hard to predict winers in photon harvest race.
Certainly, no one would have guess in 2008 that one could buy Pallets or Gigawatts of 260/320 watt CrystalSI Panels for High .60’s watt USD in 2014. Don’t know how much lower they can go. Not sure when the Sunpower Patent expires.
http://www.huffingtonpost.com/entry/oklahoma-earthquakes-limits_us_56de2359e4b0ffe6f8ea76eb
“The New York Times notes the restrictions are technically recommendations that may force energy companies to produce less oil and gas.”
Back to some ciphering:
https://www.eia.gov/tools/faqs/faq.cfm?id=667&t=2
Kilowatthour generated per unit of fuel used:
1,927 kWh per ton, or 0.96 kWh per pound, of coal
99 kWh per Mcf (1,000 cubic feet) of natural gas
578 kWh per barrel, or 13.76 kWh per gallon, of petroleum
https://www.eia.gov/tools/faqs/faq.cfm?id=667&t=2
You will need approximately 20 Mcf of natural gas to equal one short ton of coal for generation of electricity. 20×99 equals 1980 kWh.
3.5 barrels times 42 gallons at 7.2 pounds per gallon is 1058 pounds of oil.
You need half as much oil by weight to generate the same amount of electricity with a short ton of coal.
You will need about 3.5 barrels of oil for every short ton of coal to generate an equal amount of electricity.
CO2 emissions per barrel of oil: 1 barrel: 317kg of CO2 (min.)
http://numero57.net/2008/03/20/carbon-dioxide-emissions-per-barrel-of-crude/
317kg is 699.3 pounds of CO2 or 2447.5 pounds, when an amount of oil is generated to electricity equal to the amount of coal used, 3.5 barrels to 2000 lbs of coal.
CO2 emissions per short ton of coal: Complete combustion of 1 short ton (2,000 pounds) of this coal will generate about 5,720 pounds (2.86 short tons) of carbon dioxide.
http://www.eia.gov/coal/production/quarterly/co2_article/co2.html
https://www.linkedin.com/pulse/energy-from-coal-oil-natural-gas-carbon-dioxide-emissions-joseph-cook?forceNoSplash=true
Natural Gas 122 pounds of carbon dioxide/1000 cu.ft http://cdiac.ornl.gov/pns/faq.html so Natural Gas equivalent of 1 ton of coal equals 2306 pounds of CO2
https://www.linkedin.com/pulse/energy-from-coal-oil-natural-gas-carbon-dioxide-emissions-joseph-cook?forceNoSplash=true
By eliminating the use of natural gas and oil, coal can be burned to produce the usable energy, more than likely electricity. The emissions will be close to the same amounts. Purdy good sarcasm there.
Would you rather have a ton of coal or 3.5 barrels of oil?
3.5 barrels of oil will cost you $129.50.
A ton of good coal will be about 52 dollars in today’s world of money. $16.50 for Wyoming brown coal, good old Oklahoma crude refined into diesel and gasoline is the preferred choice, not Wyoming brown coal. Just the way it is in the real world.
You have to pay 77.50 usd for the convenience. It is much less trouble to buy gas than to convert coal to a usable energy for personal transportation, so you’ll pay the extra money for the ease of use and the better energy source, crude oil. You demand to use gasoline and reject coal except to be burned at power plants to generate electricity.
Determine the amount of coal used in by the billions of tons, you can estimate the amount of tonnage of CO2 emitted. One billion tons of burned coal will emit 2,860,000,000 tons of CO2 into the atmosphere. 7.3 billion tons consumed worldwide each year, or 20,878,000,000 tons of CO2 emitted into the atmosphere in a year’s time.
Pollutants are going to exist when coal and fossil fuels are used to make the machine go, civilization will collapse without fossil fuels.
That’s when overshoot sets in, not enough coal and oil will take its toll. Meanwhile, the post-modern era keeps chugging along burning all the coal and oil it can.
This is a brief excerpt from a REUTER’S article now two years old.
xxxx
Saudi power generators pay about $4 per barrel for their oil, industry data show.
That works out at a running cost of $0.006 per kilowatt hours (kWh) in 2010, excluding all other capital, fixed and operating costs.
But accounting for the opportunity cost of exporting crude oil at international prices of $113 per barrel raises the economic cost of oil-fired power generation to $0.13 per kWh, ignoring all non-fuel costs.
A simplified solar cost calculator developed by the U.S. Department of Energy’s National Renewable Energy Laboratory (NREL) estimates the cost of solar power at $0.07 per kWh under Saudi conditions.
That assumes a capacity factor of 33 percent as can be expected in sunnier locations in southern Saudi Arabia and a full capital cost of $1.5 per watt, a conservative estimate for utility-scale installations.
xxxx
So they are already building solar farms, not very many yet, with the juice priced competitively with oil at somewhere around fifty to sixty bucks. New solar farms will get cheaper. Oil will be going up.
It’s a NO BRAINER, run the ac on sun power, and sell that oil!!!! Once it goes up again, of course.
They may be holding off waiting for the price of solar to fall even farther. That’s why I don’t have a personal system yet, it is cheaper on me to buy grid juice from one year to the next and wait for panel and inverter prices to go down some more, using my generators for emergency backup.
“99 kWh per Mcf (1,000 cubic feet) of natural gas”
Small technical clarification about NG kWh/MCF. That is about 34% net thermal/kWh conversion efficiency, which would apply to a conventional old-school steam turbine natural-gas power plant. You just don’t see those built anymore. Just about everyone has gone to CCGT (Combined Cycle Gas Turbine) plants for new generating capacity. which are closer to 60% conversion efficiency.
Almost all coal plants are more conventional type pure steam power plants and don’t use CCGT technology. The newer coal plants do have some efficiency improvements, though, including heat recovery and using super-critical operating steam pressures. But all the new air pollution equipment for coal also takes an efficiency toll on these plants that NG plants just don’t have to pay.
That CCGT efficiency upgrade really changes the equations cited for converting “equivalent” MCF of NG to tons of coal for generating the same electrical energy.
I always thought Michael Klare was a good analysis, but I’m not sure I agree with some points he is making here.
” Just as the peak oil theorists failed to foresee crucial technological breakthroughs in the energy world and how they would affect fossil fuel production, the industry and its boosters failed to anticipate the impact of a gusher of additional oil and gas on energy prices. And just as the introduction of fracking made peak oil theory irrelevant, so oil and gas abundance — and the accompanying plunge of prices to rock-bottom levels — shattered the prospects for a U.S. industrial renaissance based on accelerated energy production.”
….
“Many reasons have been given for the plunge in oil prices and various “conspiracy theories” have arisen to explain the seemingly inexplicable. In the past, when prices fell, the Saudis and their allies in the Organization of the Petroleum Exporting Countries (OPEC) would curtail production to push them higher. This time, they actually increased output, leading some analysts to suggest that Riyadh was trying to punish oil producers Iran and Russia for supporting the Assad regime in Syria. New York Times columnist Thomas Friedman, for instance, claimed that the Saudis were trying to “bankrupt” those countries “by bringing down the price of oil to levels below what both Moscow and Tehran need to finance their budgets.” Variations on this theme have been advanced by other pundits.
The reality of the matter has turned out to be significantly more straightforward: U.S. and Canadian producers were adding millions of barrels a day in new production to world markets at a time when global demand was incapable of absorbing so much extra crude oil. An unexpected surge in Iraqi production added additional crude to the growing glut. Meanwhile, economic malaise in China and Europe kept global oil consumption from climbing at the heady pace of earlier years and so the market became oversaturated with crude. It was, in other words, a classic case of too much supply, too little demand, and falling prices. “We are still seeing a lot of supply,” said BP’s Dudley last June. “There is demand growth, there’s just a lot more supply.”
A War of Attrition
Threatened by this new reality, the Saudis and their allies faced a painful choice. Accounting for about 40% of world oil output, the OPEC producers exercise substantial but not unlimited power over the global marketplace. They could have chosen to rein in their own production and so force prices up. There was, however, little likelihood of non-OPEC producers like Brazil, Canada, Russia, and the United States following suit, so any price increases would have benefitted the energy industries of those countries most, while undoubtedly taking market share from OPEC. However counterintuitive it might have seemed, the Saudis, unwilling to face such a loss, decided to pump more oil. Their hope was that a steep decline in prices would drive some of their rivals, especially American oil frackers with their far higher production expenses, out of business. “It is not in the interest of OPEC producers to cut their production, whatever the price is,” the Saudi oil minister Ali al-Naimi explained. “If I reduce [my price], what happens to my market share? The price will go up and the Russians, the Brazilians, U.S. shale oil producers will take my share.”
http://www.tomdispatch.com/post/176112/tomgram%3A_michael_klare%2C_a_take-no-prisoners_world_of_oil/
I never heard of Klare, but if he wrote that then he’s pretty ignorant about the oil industry. Most so called experts are somewhat stupid.
Has anybody seen any recent estimates for the cost of a new coal to liquids plant?
So long as gas stays cheap, it will help lower the cost of any coal to liquids production. Even if ctl costs twice as much as oil, when oil is high, around a hundred bucks, the world will be able to afford it, due to vastly improved efficiency and changing lifestyles, assuming the price goes up GRADUALLY.
Six to eight dollar diesel fuel would not have a very big effect on the price of groceries in the USA. We could save back a lot more by buying in larger packages, and buying fewer highly processed foods. It probably costs ten times as much to haul a pound of potato chips as it does a pound of potatoes, due to the bulk rather than the actual weight of chips, not to mention the detours to the processing plant, warehouses etc, along the way to market.
It probably costs ten times as much to haul a pound of potato chips as it does a pound of potatoes, due to the bulk rather than the actual weight of chips, not to mention the detours to the processing plant, warehouses etc, along the way to market.
Hey OFM what do you think of this?
https://www.ted.com/talks/caleb_harper_this_computer_will_grow_your_food_in_the_future
I could see some level of disruption happening if you combined solar, wind, powerpacks, ultra efficient LEDs etc… I really like LED’s that only emit in the red and blue wavelengths because that is mostly what plants absorb.
Cheers!
Thanks Fred. Great video (TED). I’d never heard of aeroponics! (nor has my spell checker 🙂 ). IP-addressable broccoli! Thirty sensors per plant sounds a little labor-intensive. But as he says, it’s early days…
Actually much of that technology has been around for quite sometime. I remember seeing aeroponics at Epcot many many years ago. To be clear IP-addressable broccoli with thirty sensor may sound like overkill but I think all of this stuff is just more examples of technological disruption that already exists today. I think the future is local and distributed and that goes for energy production, manufacturing and food production too. Today you can email a DNA fragment have it transcribed and implanted in a cell and grow it into something useful just as easily as you might physically transport a container worth of monocultured industrially grown Chiquita bananas…
As a counter-point, this writer is dismissive, claiming 1,200 kWh required per kg (dry weight)!
http://www.salon.com/2016/02/17/enough_with_the_vertical_farming_partner/
I take his point and agree that growing produce indoors is probably quite energy intensive using currently available technology, though there may be ways to bring that number down significantly if you pipe in natural sunlight when available. Anyways, I will read his paper to see how he gets his numbers. However I also wonder how much energy is consumed in refrigerating and transporting produce around the globe?
Hi Fred,
I try to remember to never say never, but in the case of vertical farming, it is quite safe to say not within the foreseeable future, except for boutique crops such as herbs and salad greens that can be sold at super premium prices, and harvested on a sixty day or less basis.
High rise building construction is a mature technology, and there is simply no way you can build a high rise to operate it as a green house,compared to in the field farming, even allowing for shipping costs, losses to bad weather, pests, etc.
The cost of energy would kill you even if you had a free building, in nearly every case.
For my part, I just can’t see how you could gather enough sunlight, and focus it into a big building, to light up the entire interior adequately, especially in an urban environment. You would be shading forty times the footprint of a forty story building. The neighbors would have a few things to say about that, more than likely.
It’s pretty hard most of the time to make a go even of a single story or ground level greenhouse, where the construction cost per square foot is minuscule compared to a high rise. The cost of lighting and heat just simply kill ya. The folks who do succeed with cold weather green house production usually get some sort of sweetheart deal on energy costs, and what they sell still generally sells at a steep premium compared to conventionally raised produce.
Having said this much, I could easily get rich running a greenhouse operation if I could get cheap enough heat and light.
I’m still not exactly sure how my original post got equated with vertical farming since it was about computerized control systems and NOT about vertical farming!
Hi Fred,
I got into this in the middle, and jumped the gun.
Since then, I have watched the video. This guy knows some stuff, but his lack of appreciation of day to day realities indicates he has done just about zero research into the COSTS of implementing his dream schemes.
And he plays pretty loose with some fundamental facts as well. The average apple you buy in a super market IS NOT ELEVEN MONTHS OLD. The average age is less than six months. You might get an eleven month old apple a few days before the new harvest comes in, but apples have an extended harvest season globally ,spanning over four months. During harvest the crop goes directly to market, bypassing long term storage altogether for a quarter or more of annual total sales. Putting fruit into storage to take it out again right away is not good business.
Capital costs and economies of scale rule in agriculture. You can raise lettuce in four weeks in a green house, true , but lettuce in reality is damned near a REAL junk food, devoid of protein, fat, and even a significant amount of calories. You get some micro nutrients, which are essential, and some fiber, which is good, but these are readily available in REAL food also rich in fats, proteins, and carbohydrates. A rabbit would literally starve to death on a table lettuce diet.
In a decade or two, the genetic engineers / breeders / geneticists working out of life sciences and agriculture labs may come up with something that has serious nutritional value that can be grown in four weeks hydroponically or aeroponically.
For now such a crop does not to the best of my knowledge exist, except in the day dreams of researchers.
As a matter of some incidental interest, the old College of Agriculture that I attended was renamed the College of Agriculture and Life Sciences years ago. The ag engineering guys were building self driving tractors a full decade before anybody managed to get a self driving car to go down a highway.
The vertical farming guys are NOT shooting at a stationary target.
The guys who are dreaming about vertical farming have to figure out a way to build high rise buildings for no more than a nickel or dime on the dollar of the current going cost to even think about competing.
My money says they can’t do it.
None of this is to say that people ought not to grow as much food locally as they can. Greens are an important part of a decent diet, and easy to grow on even a very small scale. Folks with a little more room can grow more substantial stuff such as onions, tomatoes , and even beans.
Hi Old Farmer Mac,
Coal will also peak, Steve Mohr thinks by 2020, I expect more like 2030. When that happens coal prices rise and CTL may not be economically competitive. A 2007 by the department of energy suggests an ROI of 20% with crude prices above $61/b for the 30 year life of the project assuming a delivered coal price of $37/ton. In 2013 in the US the cheapest coal nation wide went to the electric power sector at $45/ton, for commercial and industrial (not including coke) it was as high as $90/ton for delivered coal. It will become more expensive than this over time.
DOE study at link below:
http://www.netl.doe.gov/energy-analyses/pubs/Baseline%20Technical%20and%20Economic%20Assessment%20of%20a%20Commercial%20S.pdf
I couldn’t find many recent analyses, probably reflecting the fact that it is not a viable alternative.
Not a lot of studies even during the high price 2011 to 2014 period indicates a lack of interest.
CTL is viable when the oil price is $110 per barrel and coal cost is equal to the average price seen in the USA in 2010-12. This excludes co2 emissions penalties.
Hi Fernando,
Coal prices will rise over time as we approach peak coal.
How will this new restriction affect oil production ? 40% out of 2 Mb/d of water (or something like that) is a very substantial figure. They probably can switch to evaporation but it takes time:
Also of interest (from various sources):
Thanks Dennis,
My personal opinion is that if coal peaks anytime soon, say within ten to twenty years, the peak will be more about economics and politics than the resource in the ground. I am willing to believe coal production WILL peak, and hope it does, within that time frame.
If oil were to become outrageously expensive due to a shark fin decline, which may be unlikely, but is possible imo, then even very expensive ctl might work for some countries, especially ones with a lot of domestic coal.
I suppose the question will play out according to how fast oil declines, how fast coal prices go up, and how fast renewables come along.
I am a big believer in the future of electricfied autos and light trucks, and believe railroads will come back big time, as oil depletes.
Hi Old Farmer Mac,
A sharkfin decline in oil output will be due to lack of demand due to a poor economy, under those circumstances oil prices will be low rather than high. It is always about both geology and economics when we are talking about resource extraction.
Coal to liquids is highly unlikely to ever be a significant liquid energy resource on a World wide basis, oil sands and many other difficult to extract energy resources are very likely to be cheaper in the long run.
The Mohr estimates are at link below:
http://www.theoildrum.com/node/6782
and the full PhD thesis at link below
http://ogma.newcastle.edu.au:8080/vital/access/manager/Repository/uon:6530
Mostly I agree with your comment.
The rate of decline of oil, the dates of the peak and the rate that renewables ramp up along with the prices of oil, natural gas, coal, wind, solar, and nuclear, as well as battery costs, rail costs, etc. will all affect how things play out.
Impossible to predict really.
Solar is growing rapidly in India and is now nearly as cheap as electricity from coal. By 2020, solar will be cheaper than coal.
“Solar prices are now within 15% of coal, according to KPMG. If current trends hold, the consultancy predicts electricity from solar will actually be 10% cheaper than domestic coal by 2020.”
The time has finally arrived for renewables to start growing exponentially:
http://money.cnn.com/2016/03/07/technology/india-solar-energy-coal/index.html
The time has finally arrived for renewables to start growing exponentially:
One of my biggest pet peeves is is that when people discuss energy they almost unanimously equate it with fossil fuels. It is way past time for that to change!
There are more things in heaven and earth, Horatio, Than are dreamt of in your philosophy.
– Hamlet (1.5.167-8)
Any opinions as to the meaning of Sander’s winning Michigan?
Personally I think it has a hell of a lot to do with people who are committed democrats keeping their mouths tight shut in public , when it comes to their doubts about HRC, but expressing them in the privacy of the voting booth.
Beyond that, coming from a working class background myself, I have NEVER believed that NAFTA type politics are good for the American people. We are now supporting millions of formerly well paid manufacturing workers partially on welfare and partially by boarding them in jail. Not many middle aged and older men and women can be retrained successfully, even in the best of times. Going from fifteen bucks with bennies in a local furniture factory to eight bucks without bennies at McDonalds has destroyed the lives of many people I know personally.
Some HRC fans are calling it the revenge of the angry white guy, but lots of minority folks lost out as well when industries were shipped overseas wholesale. Of course this hardly matters to a typical college educated professional, who has not lost his or her job an a result, and gets Chinese goods dirt cheap. Nor does it matter to a typical hard core union guy, because for the most part, he still has his job as well, and often at a very high rate of pay. ( I have been a member of a couple of them, at different times, but never wanted to spend my LIFE in a power plant, or an auto assembly plant, or police station, etc. )
It is virtually unprecedented for an average of major polls to be off by twenty points a day or two before a primary.
I expect more big surprises in coming days.
And way more things that are energy efficient than are discussed here. A few examples of many that are already proven and just waiting that inevitable carbon tax to take off near straight up:
Far smaller, more efficient and longer range EV’s. And much cheaper to buy and operate.
Very much more efficient small household thermal machines- generators, heat pump, fridge, etc,- that can run happily on gas from domestic trash/biomass pyrolyzation and/or stored solar.
Sum of above – off grid. Easy. Best buy. Now.
Kite wind generators – outasight more cost effective than existing monsters. Big fun to ride up and down cable.
Same thing on ships. I wanna ride!
Solar thermal far better than PV where direct sun is norm.
All of above reduces net energy, makes bioenergy far more effective.
Above just for starters. END for FF’s. Bravo!
Go Bernie!
Tee hee hee.
Now here is a type of headline you don’t see very often. Bold mine.
Russia may be running out of oil
Oil production in Russia will inevitably decline by 2035 according to an Energy Ministry report seen by the Vedomosti business daily. The different scenarios predict an output drop from 1.2 percent up to 46 percent two decades from now.
The document, obtained by the newspaper and confirmed by a source in the ministry, says by 2035 existing oil fields will be able to provide Russia with less than half of today’s production of about 10.1 million barrels per day.
The shortfall should be met by increased production from proven reserves, according to projections by the Energy Ministry.
In the best case for oil producers, short-term growth remains possible only until 2020, according to the report. After that, production will contract. The figures vary from 1.2 percent to 46 percent, depending on prices, taxation and whether or not anti-Russian sanctions will be in force.
A slight increase in production is possible only for smaller companies like Slavneft and Russneft, while the market leaders are facing the depletion of existing deposits. Added to an unfavorable tax environment, their production is set to fall by 39-61 percent.
To counter the decline in oil production, the Energy Ministry proposes giving private companies access to the Arctic shelf, to soften the tax regime and support for small and medium-sized independent companies.
The Ministry also suggests promoting the processing of high-sulfur and super viscous heavy oil with the introduction of preferential rates of excise duties on fuel produced from such oil.
Desperate times call for desperate measures.
This forecast published by “Vedomosti” is for crude only and excludes condensate (around 520 kb/d in 2015). It was not yet officially released.
Condensate production growth in 2014-15 was higher than crude only.
There are gas condensate fields in the far north of West Siberia that should start production in the next few years.
The worse case assumes very low oil prices and sanctions remaining for the whole period.
Is $30-40 oil a realistic scenario to 2035?
Base case implies 2035 crude production only 2.1% below 2015 levels
“Reasonably favorable” scenario: crude production in 2020-2030 slightly above 2015 levels;
2035: 1.6% below 2015.
Russian crude (ex condensate) production scenarios.
Source: Vedomosti newspaper based on the Energy Ministry data
Meanwhile, the EIA in its Short-Term Energy Outlook has revised upwards estimates and projections for Russian oil production in 2015-17.
From the report:
“Russia is one example of production exceeding EIA’s expectations. Fourth quarter 2015 oil production in Russia is 0.2 million b/d higher than in last month’s STEO, with initial data indicating it has remained at high levels in early 2016. This higher historical production creates a higher baseline level that carries through the forecast period. Russia’s production is expected to increase by 0.2 million b/d in 2016 and then decline by 0.1 million b/d in 2017. Russia’s exposure to low oil prices has been mitigated by the depreciation of the ruble relative to the dollar, given ruble-denominated production costs, and by Russia’s taxation regime for the oil sector.”
The EIA is the last of the key international energy forecasting agencies to revise the numbers for Russia (others are IEA, JODI and OPEC)
Besides what Alex already said, I want to add another important point: the recovery of oil-in-place in Russia is very low compared to international averages, around 20-25%. This is why there is a lot of potential just by improving extraction from current fields.
P.S. Then, there is shale oil, really a lot of it, but it requires much higher prices for it to be developed, and economically it makes more sense to first increase the % extracted of oil-in-place
The EIA has further reduced its forecast for U.S. oil production in 2016-17 (by 200-300 kb/d for 2017).
Apparently this is related with lower oil price assumptions, which are based on futures prices, and the recent cuts in E&P companies capex guidance.
From the report (STEO, March 2016):
“U.S. crude oil production is projected to decrease from an average of 9.4 million b/d in 2015 to 8.7 million b/d in 2016 and to 8.2 million b/d in 2017. The forecast reflects an extended decline in Lower 48 onshore production driven by persistently low oil prices that is partially offset by growing production in the federal Gulf of Mexico.
EIA estimates total U.S. production has fallen 0.6 million b/d since April 2015, to an average of 9.1 million b/d in February, with the entire production decline coming from Lower 48 onshore. With WTI prices currently below $40/b and projected to remain below that level through the first half of 2017, EIA expects oil production to decline in most Lower 48 onshore oil production regions. The expectation of reduced cash flows in 2016 and 2017 has prompted many companies to scale back investment programs, deferring major new undertakings until a sustained price recovery occurs. The prospect of higher interest rates and tighter lending conditions will likely limit the availability of capital for many smaller producers, giving rise to distressed asset sales and consolidation of acreage holdings by more financially sound firms.
EIA expects U.S. crude oil production to decline from 9.1 million b/d in the first quarter of 2016 to an average of 8.0 million b/d in the third quarter of 2017. Production of 8.0 million b/d would be 1.7 million b/d below the April 2015 level, which was the highest monthly production since April 1971. Production is expected to begin increasing modestly in the fourth quarter of 2017, as productivity improvements, lower breakeven costs, and anticipated oil price increases are expected to end more than two years of declines in the Lower 48. The forecast remains sensitive to actual wellhead prices and rapidly changing drilling economics that vary across regions and operators.
Projected crude oil production in the Gulf of Mexico rises during the forecast period, and oil production in Alaska falls.”
U.S. C+C production: STEO March 2016 vs. Feb. 2016
Projections for Lower 48 states (ex GoM) production in 2017 were revised down by 310 kb/d in 2017,
including a 350 kb/d revision for 4Q17.
EIA now expects Lower 48 output to decline from the peak of 7.73 kb/d in March 2015 to 5.84 kb/d in October 2017 (-1.88 kb/d)
Lower 28 states (excl. GoM) C+C production: STEO March 2016 vs. Feb. 2016
WTI oil price assumptions (based of futures prices)
ND rigs at 33. Burlington has one to stack. My estimate is rigs will bottom at 26-27.
EIA oil price projections are unrealisticly low IMO. Removing 1.5 million bopd from USA, plus world wide demand growth of 1-1.2 in 2016, plus other worldwide declines that Ron has illustrated, add up to more than Iraq and Iran can boost production. KSA appears to be incapable of going past 10.5 million. Russia cannot quickly increase production.
Things can change fast regarding oil prices, witness the volatility since 1/1/16. We are hearing there could be a real supply squeeze coming and are seeing real evidence of
that anticipation based upon some long term offers to hedge well above the current strip, sharply increased local basis and refinery planning chatter. All are anecdotal, but are not signifying worries of tanks topping.
re Iraq and Iran,
Also add 600k disruption from Iraq Kurdish area due to complete change in geopolitics in that area, that 600k is NOT coming back to the market until there is deal and safe infrasturcture on moving that oil towards the south terminals through areas controlled by Iraq government. And that talk of 500k from Iran waiting to flood the market is bogus story from the beginning and it was just used to perpetuate “glut” narrative.
Iran will not piss 500k at these prices unless there is a deal between Russians and Saudis regarding the quotas.
I would just watch March 20th meeting and try to decode the statements from the meeting.
talk of 500k from Iran waiting to flood the market is bogus story from the beginning and it was just used to perpetuate “glut” narrative.
Very true !
likbez,
My thoughts about Iran before even this article showed up:
http://oilprice.com/Energy/Energy-General/Iran-Slowly-But-Steadily-Increasing-Oil-Market-Share.html
Key comments in the article exactly match my thoughts written above:
” The world can take comfort from the fact that Iran has not flooded the market with cheap oil as previously envisaged by the experts. Capturing market share is one thing, but there are internal needs to consider as well.”
and this:
” The mid-March meeting between OPEC, Russia and other major producers offers a window of opportunity for Iran to increase production gradually, since the major nations have agreed to a production freeze. On top of that, Russia is planning to offer a different deal to Iran, which will allow it to ramp up its production to pre-sanction levels.”
Some US clearing banks have warned banks in Europe, Asia and the Middle East that their US-based dollar accounts will face close scrutiny if they do business with Iran.
And this in the absence of sanctions? Is the gov’t pressuring these clearing banks?
There is no absence of sanctions on Iran. The US has lifted nuclear related sanctions but there are still missile related sanctions against people and companies involved in Iran’s ballistic missile program. The new sanctions prevent the entities and individuals linked to the missile programme from using the US banking system . So yes, the gov is pressuring these clearing banks. It’s called threat of punishment if you breaking the law. I’m sure if the clearing banks contravene the missile related sanctions there will be consequences. It’s not a juicy conspiracy story like you were perhaps hoping for but there it is. It’s all written out in plain detail on the Treasury website if you wish to read about it.
https://www.treasury.gov/press-center/press-releases/Pages/jl0322.aspx
Ves,
Turkey announced today that the Kurdish pipeline should be back online in about a week. There’s been a major mine-sweeping effort going on there since the break.
The PKK denies blowing up the pipeline. Who knows?
Synapsid,
Turks can fix the pipeline but Turks cannot support financially and politically the whole Iraq’s Kurdistan entity where the oil is coming from. You still got eat even when the oil is $30 :), so the Kurds are doing bidding process on who will help pay the most. Iraqis central government has an offer dangling to take care of Kurdish government employees in exchange for re-routing that kurdish oil through central government for sale.
But Turks have way bigger problems than one pipeline. They are in real bind and are pushed real hard from both Russians and Americans. When it is all said and done they could be in process of being dismembered.
The only leverage that Turks have is over Euro elite that still needs them for their dirty work in ME. Notice how Ms. Markel can easily find 3 billion for Turkey (refugees will not see a single penny of it) while last year Euro pensioners in Greece/Spain/Italy/France all they got is austerity.
It is a class war and it has always been like that.
Ves,
The damaged pipeline is an Iraqi pipeline; it carries Iraqi oil all the way to Ceyhan, a Turkish port on the Mediterranean. The KRG built a pipeline that joins it at the Turkish border, so the pipeline carries Kurdish oil too. It’s in Iraq’s interest to have it open but since SE Turkey is essentially a war zone that can be hard to bring about.
I suspect that Iraqi Kurdistan could support itself from sale of the oil they produce if they were allowed to just sell it and not have the money come from Baghdad–and if they straightened out their own corrupt economy.
ShallowS,
EIA oil price projections are unrealistically low IMO
As for prices, Alex should always superimpose EIA STEO prediction from a year ago on the current. Otherwise posting such a graph does not make much sense and looks like a free promotion for crappy job that EIA performs with this metric 🙂
BTW they are unrealistic by design as they are based on futures. Futures are a bad predictor of oil prices dynamics as they are often used by producers and by hedge funds for hedging and offsetting other bets. Probably worse then a typical “oil expert” predictions 🙂
Hi shallow sand,
I agree the EIA price forecast looks too low, perhaps there a bunch of long term oil developments that are expected to start producing or will be ramping up over the 2016 and 2017 period. Does the Feb 2016 oil price forecast also look to low?
This is the first time you have made such a comment so I think you are referring to the March 2016 price forecast.
An interesting post from Ben Bernanke on the correlation of stocks and oil prices here.
Interesting in what way? What can be interesting in this arsonist turned firefighter? That it is coming from a former Senior Advisor to PIMCO and Citadel ( From February 2006 through January 2014) ?
Surrender market share or just support for higher prices down the road:
http://oilprice.com/Energy/Energy-General/Chevron-Protects-Dividend-Cuts-Another-36-Percent-Off-Spending.html
Chevron has had more than a few problems with their larger projects:
Angola LNG – shut down for longer than expected, Big Foot – one or two year delay, Kashagan/Tengiz – numerous issues, Hebron – one year delay, issues with the shared Kuwait/KSA neutral zone which I think is still shut down, Gorgon and Wheatstone LNG plants start up this year but selling into a saturated market, other large LNG options in Canada and USA which are not commercial in the current climate, a cross-border Venezuela/Trinidad project that doesn’t seem to be going anywhere, Rosebank offshore UK which was not commercial even at $110 per barrel. They may not have many options but to concentrate on smaller projects in tight oil and gas. Hopefully the Gorgon ramp up period goes well in the coming weeks.
Thanks to “hammerup” on the Energy Investing IV board:
http://finance.yahoo.com/news/forget-fracking-choking-lifting-latest-efforts-stem-u-111224982–finance.html
“While the number of oil rigs collapsed by some 75 percent since the end of 2014, U.S. production has only barely begun to ebb, a disconnect generally attributed to the increasing productivity of the hydraulic fracturing process, with each new well yielding more barrels than the one before.”
They haven’t taken into account the time lags involved, nor the completion of previously drilled wells.
The oil industry moves slow, even in tight oil fields. Even if rigs are TWICE as efficient, there will still be a big drop in new wells drilled with more than half of the rigs parked. Once the back log of drilled but uncompleted wells is worked out, production will start falling off pretty fast.
Bogus.
“Efficient” is defined as “our costs per well are lower”. Which can mean
1) stage count is reduced
2) We already drilled the hole and we don’t include that cost because it was from last year
3) Halliburton is charging us less to frack in the current quarter and deferred liability is somehow off the books.
4) Our suppliers are getting loans to let them operate at a loss and obfuscate the shale related debt
There is no magic
Nthing really new ut a good summary on the issue of the missing barrels. http://mobile.reuters.com/article/idUSKCN0WA2AQ
Nothing new about EIA being half statistical and half propaganda agency. But something new that it is Reuters who is drawing our attention to this fact 🙂 . I used to think they are in the same boat.
13 year old invents free energy device.
http://www.silverbearcafe.com/private/03.16/freeenergy.html
Yeah that’ll little monster lives down my block and his ‘free energy device’ is totally screwing up everybody’s WIFI.
OMG what a dilemma!
Free energy, or WiFi. Pick one.
What to do. How do the honeybees feel about it?
The Google search: “Do anthropogenic electromagnetic fields fuck with birds?” yielded:
“When exposed to weak fields like those produced by AM radio signals and various electronic equipment (like the little tags that stores put on clothing), the bird’s couldn’t orient themselves using their magnetic compass.”
http://www.iflscience.com/plants-and-animals/electronic-pollution-disorients-migratory-robins
Seriously, you think the wind turbine kill rate is bad? How many fledglings have starved to death waiting in vain for their lost parents simply so Wal-Mart can limit their shrinkage rate? How many birds have to die to ensure the profits of trans-national capitalist enterprises?
We have no idea what we’re doing. A little lead takes the ping away, but oh my, violent crime, murder, imbecilic children. It’s simply too much.
Antibiotics worked great for that pesky UTI, but now I’m schizo-affective, and have irritable bowel syndrome, if not Crohn’s disease. I’d just ask my brother for a fecal transplant donation to try and restore my micro-biome, but he’s obese. God forbid. I don’t even want to go there.
Maybe it’ll be alright tho. We have CRISPR now. Human nature is a disaster, but perhaps we’ll edit it in time to avoid complete catastrophe.
Economics 101 for Dummies – an OFM type of a post.
Art Berman looks at the numbers and says oil should go back to $30, or even lower. It does take capitalism time to work. But, EVERYONE, including Saudi Arabia and Kuwait, is losing $20/bbl or more. Those two countries are losers because they have already spent the money before it came in. So, the industry is losing $2 billion per day minimum. Probably $1 trillion/year at current prices. It will change. Relatively fast.
Look at the reverse. Suppose that a loaf of bread went up to $100 in the US. 99.999% of the population would be screaming for government price controls. OFM would be getting no sleep. Why is that? Because he would be baking bread 24/7.
Before the crash of the Soviet Union, TV reported stories of shortages of everything in their Union. It supposedly took 3 months of labor for a typical factory worker, saving 100% of his/her earnings, to have enough money to buy a cloth coat. That was unsustainable. Why? Because you could quit your job, stay home and knit a coat a week and get 12 times your salary.
Heck, even the French farmers were smart enough that when milk prices went below the cost of production, they just dumped it in the streets.
These US corps that are selling stock to shore up their balance sheets are not stupid. They will not start drilling again until their stock prices are well above where they diluted existing shareholders.
Yes, they are stupid. If they were smart, they would have done the stock offerings when the share price was exponentially higher.
Clueless.
I think the release of the LTO company annual reports let the cat out of the bag, so to speak.
At $50.28 WTI, no one can make a go of it, if you just read the financials on these companies. The companies will deny that and say all kinds of stuff, but the proof is in the SEC reports. Sure, they can get by for a long time in survival mode, but $50 as a long term price absolutely doesn’t work. Actually around $80 WTI is needed long term to have a viable LTO business, with there obviously being a range around that price, depending on many company specific factors.
When something like 70% of XOM’s upstream estimated net future cash flows disappear, and their proved reserves drop 24%, from the previous year, just imagine what happens to all of their lesser peers. Many had to show huge production and development cost cuts to even have net future cash flows at $50.28, and then we dropped to $30 the first two months of 2016? Again, can get by awhile but long term, no way.
No business media report on this stuff, and very few retail investors discuss this stuff. But you can bet the institutional people look at reserves and estimates of future cash flows. Seeing how bad those looked, and knowing that those are likely the BEST CASE SCENARIOs the independent reservoir engineering firms would allow, it had to have an affect. I do not think it is a coincidence that we were bombed with LTO 10K in February and the price has rocketed up since. The traders realized they overshot. They believed the company “break even hype” too much, and the 10K confirmed it is a lot of hype.
That is why I was so surprised when EOG came out and said what they did about economic at $30, after the release of their 10K. Unless the 10K is wrong, they have $0 net future cash flow at $32 WTI and $1.70 HH. Some heavy hitters had to get into EOG’s ear in order for them to say that. My conspiracy mind says political people, but likely it was Goldman Sachs types? It was just too “Red, White and Blue” talk coming from them,( i.e. we MUST be cost competitive with KSA and “win” this war).
I am not saying the low oil price nightmare that US producers have experienced is over, short term is a tough one. But, absent some major demand decreases or major OPEC production increases, low prices cannot last as the EIA is currently predicting.
This is important!!!
http://mobile.reuters.com/article/idUSKCN0WA1ZG
A bankruptcy court in New York has ruled that Samson Oil and Gas can terminate a contract with an affiliate of Cheniere Energy for the gathering and transportation of natural gas in South Texas. I believe this in in the Eagle Ford play but I am not certain of this.
If this ruling is up held, that what other contracts might a shale company try to abrogate? Just how does this Bankruptcy Judge think that pipelines are paid for?
This has immense implications for the unconventional industry and for the oil and gas industry as a whole.
ShallowS,
I think the release of the LTO company annual reports let the cat out of the bag, so to speak.
I am with you, but let me to assume the position of “devil advocate”. Your statement above is true if you view “the small picture”. But if you view “the large picture” the situation is slightly different. Here are my admittedly unprofessional (aka naïve) view:
1. In a sense “the cat out of the bag” is the necessary conditions for the recovery of oil prices, as only an incompetent, or a stooge now can talk about prices below $70 as sustainable for shale industry. But jury is out whether it is sufficient. May be the extinction of shale companies is in the cards, may be they will quietly kept afloat by extending loans and by sale of shares for an additional year. Life is complex thing and economics reflects life in more then one way.
2. That’s true that individual shale companies are forced into unsustainable position (aka charge of light oil brigade in the “death valley”, see https://en.wikipedia.org/wiki/Charge_of_the_Light_Brigade ). They fight bravely but the cards were against them. But for the county as a whole, low oil prices are a powerful economic doping, which probably helped the USA to avoid recession in 2016. Obama administration probably has a hand in staging the drop via Saudi as they openly admit (http://oilprice.com/Energy/Oil-Prices/Did-The-Saudis-And-The-US-Collude-In-Dropping-Oil-Prices.html )
3. IMHO low oil prices are critical to prevent slide from “secular stagnation” back into a new Great Recession. So keeping oil prices low in 2016 is one way of kicking the can down the road for Obama administration. Which definitely would prefer postpone possible economic problems connected with the recovery of oil price to the next administration.
4. Putin made a move against the current oil price “status quo” (eliminating “Call to OPEC” option) and managed to keep in line such possible detractors as Azerbaijan and Iran. So on March 20 oil price might get a boost like many suggested as shortages of oil might became reality much sooner the some people expected…
Saudi oil minister recently suggested that excluding Iran the drop can be closer to 0.5Mb/quarter (1 Mb/d for the second half of 2016) then the current estimate of $0.3Mb/quarter. Their own production is dropping too:
Nov. 30, 2015 10.04M
Oct. 31, 2015 10.14M
Sept. 30, 2015 10.19M
Aug. 31, 2015 10.29M
July 31, 2015 10.29M
U.S. crude production alone might drop this year by 0.6Mb/d or more, which may be enough to realign supply and demand late this year or early next year.
5. Saudi position about continuation of their predatory oil pricing game is now fuzzy as on one hand they still want to suppress growth of their regional rivals and Russia but on the other hand losing $100 billion a year is not an attractive option either. In no way Saudis ever considered US shale oil industry as a geopolitical competitor. As a nuisance yes, as a possible (and in a certain sense welcome, from the global economy health view, with a special emphasis of G7 economies health) player in the limiting of upper bound of the price of oil to the $80-$100 band for a decade, yes. But as a geopolitical competitor in the global oil market, I think, no. This is all MSM lies. IMHO neither quality, not quantity, nor status of the USA as an oil importer allow shale to play a significant role in the global oil market. The same is true for shale gas.
clueless,
Art Berman looks at the numbers and says oil should go back to $30, or even lower. It does take capitalism time to work.
This looks like too theoretical post well outside the scope of this blog, but still there are some basic facts that everybody needs to be aware of.
1. We all are living under
neoliberalism, aren't we? And current fascinating developments with Bernie and Trump is nothing more than unorganized protest of shmucks against "masters of the universe" — neoliberal elite that captured Washington, DC (along with London, Paris, Berlin and other G7 capitals). And they still have quite strong fifth column in Moscow too (Yeltsin was their man)
The revolt which BTW have little chances for success. As Orwell aptly stated, contrary to Marx delusions "the lower classes are never, even temporarily, successful in achieving their aims".
2. The key idea of neoliberalism is redistribution of wealth up from shmucks to international
(predominately financial) elite. So nobody care that either camel lovers or Putin lovers lose money on oil and that they are selling it below the cost. What is important that the quot;masters of the universe" became richer. And sustainability is provided by grabbing asset of distressed countries and companies when they go too deeply in debt slavery. So the key idea here is get those countries and companies "conditioned" enough to grab them on a cheap. In old days that was called "shock therapy" now it is called "disaster capitalism".
3. Destabilization as in "drop of oil prices to unsustainable levels" can be extremely
profitable (see The Shock Doctrine: The Rise of Disaster Capitalism.). This is the way the neoliberalism enforces its Washington consensus rules on other countries, especially resource nationalists like Putin’s Russia.
The countries and companies in question were gently pushed to increase the production to the level that assured the crisis to happen. While this sounds like another conspiracy theory, and can well be such, the simple logic suggests that in XXI century the elite understands the natural dynamics of capital accumulation well enough to freeze too enthusiastic Ponzi schemers before they do the major damage, if they want it. At least suppress them enough to avoid "Minsky moment."
This was not done in case of “shale bubble” and other countries were implicitly stimulated by it to rump up production as well as by regime of high oil prices and cheap Western credits. Now we have a real crisis when "resource nationalist" are quickly running out of money. If Washington is able to crush them, it is also will show the other countries who are trying to oppose neoliberal globalization "who is the boss". It is not accidental that all establishment candidates in the current presidential race are extremely, pathologically jingoistic and are ready to bomb yet another half-dozen of countries in short order after coming to power. In this sense differences between H, C and R are superficial. They all are servants of neoliberal oligarchy in Washington and Wall Street (for H in the opposite order).
It can well be that US shale was a part this Brzezinski’s The Grand Chessboard " gambit and now is a pawn sacrificed in a wider geopolitical game.
It seems Bentek agree with Art Berman that US or at least the NE gas production will fall by the end of the year, just for slightly different reasons.
Risk to Northeast Production this Summer
Wednesday, March 09, 2016 – 4:17 PM
As the winter ‘15/16 season winds down, the Northeast is set to experience lower seasonal demand, putting into question whether or not current production levels are sustainable with the amount of capacity leaving the producing states – Ohio, Pennsylvania, and West Virginia. Bentek’s latest CellCAST shows production averaging 23.5 Bcf/d for the remainder of 2016, about a 1 Bcf/d increase from the current year-to-date average of 22.4 Bcf/d. This feature will look into whether or not production can find a home from the combined OH, PA, and WV “Tri-State” area, considering the seasonal swing in demand, and high storage levels reducing injection demand. It will also explore whether maxed-out outflow corridors can handle an incremental supply surplus. Please continue to read on page two for further analysis.
I’m always interested in the stuff you have to hunt around to find reported. Someone on a web board earlier mentioned a pipeline bombed in Nigeria. Didn’t see it anywhere, very sporadically reported, apparently 300kbpd there, in reading that I found the pipeline from Kurdistan to Turkey has been out for three weeks, apparently up to 600kbpd there.
If it was something about the glut, bloomberg would be all over it. This, zip. I used to wonder about conspiracies, but I started following a few bloomberg reporters late last year and they are some of the laziest SOBs I’d ever encountered. The amount of copy/paste and rehash the prevailing sentiment without checking a few facts was astonishing. Talk about slobs, it really was about getting all the current keywords and search descriptions into the article and particularly the first paragraph and not much else.
Jed,
Thanks. My feelings, exactly. But at the same time, what to expect from them? Is not Bloomberg to a certain extent a GS propaganda arm ? May we need to lower our expectations.
Some grains of truth with additional effort still can be extracted from the piles of lies and lazy, incompetent reporting (aka rehashing somebody else talking points).
Funny, but this is a kind of “Back in the USSR” situation. Our feelings are probably 1:1 correspond to the feelings of Soviet citizens about the USSR government economic reporting :-).
Roof top solar running into a few issues. Maybe Tesla’s wall battery will find a ready market, after all.
http://www.downstreamtoday.com/news/article.aspx?a_id=51278
Future of U.S. Solar Threatened in Nationwide Fight Over Incentives
by Nichola Groom Reuters
March 01, 2016
Reuters
Los Angeles March 1 (Reuters) – Two sun-drenched U.S. states have lately come to very different conclusions on a controversial solar power incentive essential to the industry’s growth.
In California, regulators voted in January to preserve so-called net metering, which requires utilities to purchase surplus power generated by customers with rooftop solar panels. But neighboring Nevada scrapped the policy – prompting solar companies to flee the state.
It is hard to say how big the market will be for Powerwalls, considering net metering and peak use utility rates being political football issues.
But I am confident that Tesla can sell thousands of them every year to people who are now using lead acid batteries to store their home grown solar juice, as their legacy lead batteries reach the end of their service life.
And thousands more people every year will opt for their own pv and storage system, with the Powerwall being infinitely easier to use. Lead acid batteries are a pain in the ass, requiring a lot of attention. Furthermore the life cycle cost of the Powerwall is probably going to actually be cheaper than lead acid batteries anyway.
I could easily manage my place with a good pv setup and the higher priced Powerwall battery, but given the present day cost of the pv, the Powerwall, plus installation, I can’t afford to switch -YET. Not even doing the installation myself with a laborer to help.
I could use my existing generators enough to get by on the occasional days when there is so little sun the Powerwall would be dead.
Five years from now, I might go off grid, assuming my health holds up well enough that I think I will live long enough to make it worthwhile.
Wow,
Even RBN has run up the white flag on Bakken production.
https://rbnenergy.com/is-it-all-over-now-producers-lose-their-appetite-for-bakken-crude-output
Is It All Over Now? Producers Lose Their Appetite For Bakken Crude Output,
Push
Today’s RBN piece, looking at the HUGE upward revisions in the latest DPR report from the EIA concerning natgas output, is a must read for anyone wondering why shale oil/gas production has stayed so high for so long despite horrific pricing.
The next-to-last paragraph nails the operative modes, choking back, curtailing existing production, etc., that those of us closely following the companies’ activities have been witnessing for a year now.
This, in fact, is what the Yahoo report – linked by Greenbub above – was trying to convey.
Coffee,
I am loosing confidence on anything the EIA comes out with. Firstly these large revisions, and today I see on the weekly nat gas report, they thing Gorgan off the NW shelf of western Australia is a Coal Bed Methane play, in 1000 ft of water! Sloppy research on simple facts, so how can you believe them,when they need to use a calculator?
http://www.eia.gov/naturalgas/weekly/
Australia’s Gorgon, one of the world’s LNG megaprojects, prepares to ship first cargo
Australia’s Gorgon project is the largest coalbed methane (CBM) development in that country and one of the larger natural gas projects in the world. It includes a domestic natural gas plant, a carbon dioxide injection project, and a liquefied natural gas (LNG) export facility, which is preparing to ship its first cargo next week.
Toolpush,
Good ol’ Sandy Fielden.
This may be the best summary presentation I’ve seen, about North Dakota’s oil situation.
Thanks.
There is a storm brewing in Nevada, and it basically boils down to a dog fight between Warren Buffet, one of the biggest talk the talk but doesn’t walk the walk liberals in the country, and the renewables industries.
Buffet and company own the monopoly electricity industry in Nevada, and the Vegas and the entertainment industries located there, not to mention the net server industry, plus a lot of locals all over the state , want to go solar.
You NEED to go solar to attract convention business these days, and the business of sophisticated vacationers who are environmentally conscious. Plus the resource is excellent in Nevada, lots of sun. Plus of course there are some players with muscle of their own in the game, Elon Musk being the most prominent.
http://www.wired.com/2016/03/las-vegas-utilities-really-dont-want-strip-go-solar/
I am fully on board when it comes to the necessity of legacy utility generating facilities necessarily being maintained and kept in service, but a public utility commission is in my estimation supposed to give equal or greater weight to the people of the state it serves. The company gets a guaranteed profit, so it need not be a BIG profit.
In this case, I strongly suspect this man is right:
“Wynn’s president, Matthew Maddox, also noted in PUC testimony that NV Energy is owned by Warren Buffett’s company, Berkshire Hathaway (based in Omaha, Nebraska), and is therefore, in his estimation, more concerned with maximizing profits than with maintaining Nevada’s grid. Maddox pointed out that their money doesn’t even stay in Nevada, saying: “it goes to Omaha.”
oldfarmermac,
We are seeing now in Nevada – and very likely all over the US – the big challenge for solar and wind facing conventional utilities. As wind and solar need 100% stand by capacity if there is no wind or sun, utilities have to provide this capacity from conventional sources, yet the capacity utilization of these conventional sources is about to drop to record lows.
This costs the utilities dearly. RWE, one of the biggest utilities in Germany announced recently a loss of Euro 7bn and all the others are not better off. Share prices of utilities have diminished tenfold over the latest years. As most people would like to see capitalist companies to lose money for the sake of environment protection, utilities will at some point not be able anymore to provide stand by capacity and electricity prices will soar and/or the grid becomes instable. Warren Buffett is in my view aware of this as this will potentially give him astronomic losses on his investment.
It is a good opportunity for Warren Buffet to show his true social credentials. It is the same situation as for shale: There is an huge open bill for solar and wind. It will come late, yet it will come and somebody has to pay it.
Hello Heirich,
It’s perfectly obvious that utilities must be paid to maintain the back up capacity ready to roll for now and for next few decades at least, and maybe forever. It might not EVER be possible to build enough renewables to totally do away with conventional fossil fuel generation, and there WILL BE SOME gas, oil, and coal available for at least another century or two.
Buffet in my opinion can’t have it both ways, from any moral point of view. Capitalist level risk adjusted profits and government supported monopoly market control cannot be legitimately mixed. If a company is a monopoly, due to state intervention, it is only entitled to a small reasonable return on the money invested.
If he wants a guaranteed no risk return, he ought to buy triple a bonds. If he wants high profits, he must if honest acknowledge that high profits come only with the risk of loss.
One solution to this problem is to simply mandate that existing monopoly electrical utilities be mandated to invest themselves in renewables capacity adequate to meet the needs and desires of the citizens of the state.
If you read the article, you will know that the utility has compromised with a few BIG customers this way. But it is trampling on the little guys, who lack clout.
Personally being sort of a libertarian conservative type, I believe in as much freedom of choice as possible, and that people should be allowed to generate their own electricity if they please, and charged ONLY as much as necessary to support grid maintenance. In the case of Nevada, I think the PUC is very much on the side of the utility, and has gone overboard for Buffet and company.
You NEVER hear a single peep about people who are not grid making their own juice but buy extremely little from the utility. I have neighbors who pay as little as thirty bucks a month, simply because they are very light users of electricity, and others who pay even less, because they are absentee. Nobody ever accuses them of freeloading on the rest of us who use a lot more juice.
In Virginia and some other places, we have what are know as REC’s , rural electric cooperatives, which maintain local grid infrastructure, but generally buy the juice from larger companies.
Separating distribution from generation, as a business, is a good place to start, when it comes to solving this problem.
For what it is worth, I also believe the issue of grid stability has been substantially exaggerated, so long as it is understood that adding substantial amounts of intermittent renewable juice does require spending some money on upgrading the equipment, adding some new transmission lines, etc.
Some fossil fuel plants now run as peaking plants will be needed far fewer days, as renewables are built out, and so the rate the owners are paid for them will have to go up to compensate for the loss of revenue otherwise.
Since they will be running less often, with more renewables on the grid, they will cost more, proportionately, than formerly.
Texas a while back went about forty percent wind for three days or so, no problems. That’s twice what the naysayers have generally claimed is the upper limit for a stable grid.
Gas and coal will not always be cheap, and they will not always be readily available even if the end users can afford the price.
I have mixed feelings about nukes, being about as afraid of the LACK of them as the PRESENCE of them. Maybe a new generation of nukes can be built that really are safe, both environmentally and in terms of weapons proliferation.
If they CAN be built , I doubt such nukes can be built on the grand scale fast enough, SOON enough, to prevent an economic and environmental crisis associated with fossil fuels.
The bottom line, from the pov of the people, is that we will be far better off using our depleting endowment of fossil fuels more conservatively, stretching out the life of them as many years as possible, and saving them for things that pay geater economic returns , such as using gas to manufacture nitrate feltilizers.
Some folks think of the climate the main issue, but I see it as one of the TWO main issues. Any reduction in fossil fuel use is good for the climate and the environment, for sure, but my personal opinion is that we have to get thru a fossil fuel economic bottleneck just as surely as we have to deal with the climate issue.
Worrying about the climate will be sort of academic if we wind up fighting a flat out WWIII resource war.
Anybody who thinks such a war is out of the question has only a very poor grasp of history and the state of the world, imo.
oldfarmermac,
In practice it is not easy. I remember when I started up a big factory,which actually had in the long term excess electricity. However, the factory needed electricity for start up and shut down from outside.
The amount of electricity has been very low, yet the utility asked millions of back up fees. So, we had to pay millions for not even consuming electricity.
In my view this will be the case for consumers in the future just paying a back up fee. However this will be difficult for consumers to swallow: paying for nothing but back up.
Hi Old Farmer Mac,
In many places (not sure about Nevada), generation of power and distribution are already separately charged on the bill and the “electric company” provides only transmission and distribution services and buys the power from separate companies.
The net metering rules are a problem if they don’t account for the distribution and transmission costs.
The proper way to do it would be to charge the PV solar customer both for energy coming to their home from other sources of power and for any energy they “export” on the transmission and distribution lines.
Otherwise they are free riding.
This applies to those PV systems with no battery backup, the PV system is simply connected to the grid with no battery for storage. Many systems are built this way to save on costs. It is those systems that get the free ride if the net metering rules don’t account for the cost of distributing any excess power produced by the PV system.
Not that Simple. Dirty little secret is that In many area’s Dist and Trans cost are more than covered by the monthly meter fee. The real problem is who OWNS the Generating assets. The IOU can’t make compounded money on assets they don’t own and most are forbidden to own DG not on their property. PV is the ONLY Energy source that the costs and production are known and it’s scaleable down to a single panel. Large Central Generation assets often come in at many times budget.. New Coal Plants coming in at > $6 a watt and then there is uncertainly of future fuel costs. The only Fair way is TOU ( Time of Use) rates. Net Metering does not force the Utility to Buy back the Power. In many States they get Surplus for free. Do you have a Useless Internet connection that can only receive packets? Bottom Line, The Utilities need to be able to take power from customers and make a profit on it. The Fossil Grid as is is not even a Grid. It’s an un-network of one way check valves.
Too Bad Energy Deregulation was botched. It’s Un American to not to have choices. You can keep your Utility .. or not..
I strongly doubt that once the necessary one time changes in hardware are paid for that it costs a utility more than a pittance to distribute home grown solar power. They most certainly seem to sell it at the going retail rate, they don’t give it away.
So far as I can see, the only really significant cost to a utility when a moderate amount of solar power is put on the grid is that some generating capacity sits idle a great deal more time than usual, cutting into revenues from that capacity.
(Major hardware upgrades are necessary at some point, said to be around twenty percent wind and solar by most folks who write about this topic.But I have not run across anything about Texas utilities having to spend a lot of money to accommodate forty percent wind for days on end, except for the transmission lines from the windy interior plains to the cities near the coast. If the wind farms and the cities were close together, very few extra lines would be needed. )
That revenue loss can get to be quite a burden, even a disaster, no question. In Germany it has ruined some legacy centralized producers. But this is not an engineering issue, it is a political issue, and there are always winners and losers in political battles.
It looks as if the Nevada utility is sitting pretty, with the solar industry losing, for now at least.
So – Somebody has to make up the loss when generating capacity sits idle, or the utility has to eat the loss.
The question is who.
These things do tend to get as involved as a ball of cat’s yarn. It is true that people who generate a lot should pay a fair charge for the extra capacity the utility must maintain to cover peak loads, but on the other hand, these same people are reducing the need for the utility to build more transmission lines, and more generating capacity, saving the utility some money this way, with these savings supposedly passed on to retail customers.
And EVERYBODY who buys gas and coal, or uses gas and coal indirectly, saves money when utilities buy less, because lower sales mean lower prices.
I estimate that the combined usage of coal and gas in the USA is now very close to FIVE PERCENT less than it would be otherwise, because of our wind and solar industries. This means cheaper fertilizer for me , and cheaper apples from me to all the several millions of people who have eaten one of my very own, maybe even picked with my own hands, lol. Cheaper bread and burgers for everybody.
Then there is the cost of air pollution, in terms of public health consequences. Air pollution is a major cause of respiratory disease. In also has a significant impact on farm and forestry productivity.
Figuring out just WHO benefits from a given subsidy is not always easy.
I don’t have a whole lot of sympathy for big powerful companies enjoying monopoly status whining and moaning about making a little less money.
Once the price of the stock of the one that supplies my own juice starts going down because of solar on the local grid cutting into revenues I will think it is time to pay attention.
Let’s channel RW for the fun of it for a minute.
Roughly a hundred apples per bushel, times an average production of not less than five thousand bushels, is five hundred thousand apples per year, times six decades or so, means roughly thirty million apples. I probably picked a quarter of them myself, since I got home for harvest at least eighty percent of the time. We grew four or five times as many for quite a while . We might have grown as many as fifty million apples on our little family farm since I was a kid!
I picked from two thousand or so most years on up to around four thousand bushels myself, some years . That’s one hell of a lot of apples, one at a time. Picking them kept my belly flat and my muscles hard, and the girls back in town loved to run their hands over my arms and shoulders, lol.
No more, I am old and fat now. ;-(
Some full time pickers working on piece rates, who have no other duties, such as hauling empties out and full boxes in, etc, average over a hundred fifty bushels a day for the eight week to nine week harvest season.
Well, here in Edmond, OK my electric bill is separated into what is effect a grid charge for the capital assets [called a customer charge], and a usage charge.
Clueless,
I would be interested how much (as percentage of the total bill) the grid charge on capital asset is on your bill. With growing wind and solar capacity the grid charge will soar and this will increase utility bills to a level which is difficult to understand for customers.
This is the true challenge for wind and solar. The costs for wind and solar show up in a complete different position.
With growing wind and solar capacity the grid charge will soar and this will increase utility bills to a level which is difficult to understand for customers.
I suspect in the future most people won’t be on the grid! Well, maybe on a small privately owned microgrid but certainly not a large utility owned grid.
“As wind and solar need 100% stand by capacity if there is no wind or sun, utilities have to provide this capacity from conventional sources, yet the capacity utilization of these conventional sources is about to drop to record lows. ”
Here you make a important mistake in your reasoning. Wind does of course not need 100% stand by capacity. If you need 10 GW you overbuild wind by at least factor 2, check power duration curves of larger areas, the resulting losses are very small.
The back-up capacity is of course only 10 GW, i.e. only 50% or less in our case, and you have to check the full load hours of this back-up, open NG turbines running less than 1000 hours per year could do the job or written off coal power plants, again I assume you overbuild wind and add some PV.
In larger regions you have to connect non-correlated wind turbines with sufficient transmission capacity to get a flat baseload-like output.
As most people would like to see capitalist companies to lose money for the sake of environment protection, utilities will at some point not be able anymore to provide stand by capacity and electricity prices will soar and/or the grid becomes instable.
Do people like you really not understand that without healthy ecosystems there will be NO companies, capitalist or otherwise? The world you wish to continue, can’t. Deal with it!
There is an huge open bill
for solar and wind. fossil fuels, It will come late, yet it will come and somebody has to pay it.Yeah, we are paying that bill already and my grandchildren will have to continue paying for it for a long time to come!
http://www.theguardian.com/environment/2016/mar/10/co2-levels-make-largest-recorded-annual-leap-noaa-data-shows
“Do people like you really not understand that without healthy ecosystems there will be NO companies, capitalist or otherwise?”
No, they really don’t.
Beyond that, the chances they will get enough technical education to come to understand it are approximately ZERO.
We all depend on the professional opinions of experts in various fields, because none of us can be experts in more than a bare handful of fields. I depend absolutely on my MD, and my attorney, even though I am FAR more knowledgeable about law and health than the average layman.
TECHNICALLY IGNORANT people are unable to differentiate between real science and junk science. Hence they make their minds up about matters such as forced climate change based on the opinions, or at least on the stated positions, of people they trust.
Such people don’t trust folks such as me and thee, or climate scientists, who they perceive to be members of the out group, and thus ENEMIES.
They trust the Koch brothers, and El Rushbo, and Trump and Cruz, and HRC, depending on their personal preferences and situation.
Actual facts have almost nothing to do with what they believe or appreciate.
And of course my dear cyber buddy Fred Maygar understands this perfectly well.
But some of the youngsters who might read this forum occasionally are not yet old enough to have figured it out, even if they are sharp witted. Hell, a lot of otherwise sharp witted old people haven’t figured it out, and never will. They don’t have the necessary intellectual skills, or the necessary data between their ears.
PS, one thing HRC is right about is climate.
http://www.rita.dot.gov/bts/sites/rita.dot.gov.bts/files/publications/national_transportation_statistics/html/table_01_10.html
151,423 miles of crude oil pipeline in the US.
Volume of a cylinder formula pi times radius squared times the height.
66,350 cubic feet in one mile of pipeline 4 feet in diameter, divide by 5.61 cubic feet per barrel.
There are 11,827 barrels of oil in every mile of pipeline if the pipe is 4 feet in diameter.
Multiply those two numbers and the total oil in pipelines is 1,790,879,821 barrels of oil in 151,423 miles of pipeline 4 feet in diameter.
If the pipeline in one foot in diameter, there will be 111,934,256 barrels of oil in 151,423 miles of pipeline. Needless to say, there is still a lot of oil in those pipelines even if it is a measly one foot in diameter. 739 barrels of oil in a mile of pipeline one foot in diameter.
If the pipeline is 3 feet in diameter, there are 6652 barrels of oil in one mile.
1,007,381,320 barrels of oil in 151,423 miles of pipeline 3 feet in diameter.
Lots of storage in pipelines. I will take some time for them to empty.
Super Mario has spoken.
Let’s try, at least try, to remember what the world used to be. Back in The Day . . . before 2009, monetary policy was . . . provide a money supply of magnitude appropriate to support economic growth without risking the side effect of inflation.
Now . . . and this is profoundly important, but missed by nearly all . . . now monetary policy has become “whatever it takes to create growth and inflation”. Not reflect growth. Not support growth. Create growth.
IT IS SEVEN YEARS FROM THE CRISIS. If it’s all supposed to work out in the long run, just how long is the long run supposed to be? Has anyone noticed that Exit Plan for the Central Banks is no longer talked about? The Fed, the ECB, the BoJ, the SNB . . . they are creating money from thin air, reflecting nothing, describing nothing. Just flailing to obscure that which clearly isn’t normal.
This is the substance that we use to measure the value of a barrel of food transportation. How can that possibly make sense? People die almost immediately . . . the long run is 2 weeks . . . if they don’t have food transportation.
Money isn’t physics, people. It’s whimsy. If someone wants to inflict harm on an enemy, and everyone does, they can take advantage of this.
Yeah dude we know. It’s called collapse. You planning on narrating? What were you expecting, economic and political order? Get with the program.
Sigh, I can’t even edit my spam post.
Ron must be busy
It noted Super Mario’s uptick to 80 billion euros per month aka 1 trillion dollars being created from thin air and how such a thing really should not be the measure of the value of food transportation barrels.
and more but not gonna retype
Who you going to Call? ET to the Rescue ?
“Until TEPCO figures out the exact location of every radioactive glob of melted metal, the overseers can’t make a plan to remove the fuel from the reactors and proceed with the decommissioning. They’re stymied.”
http://spectrum.ieee.org/energy/nuclear/harnessing-cosmic-rays-to-peer-into-fukushimas-deadly-reactors
BBC on Fukushima http://www.bbc.com/news/world-asia-35761141?SThisFB
R Wilson MD Radiology ret.
Evacuation unjustified?
http://www.japantoday.com/category/national/view/fukushima-relocations-were-unjustified-kneejerk-reaction-uk-academics?utm_campaign=jt_newsletter&utm_medium=email&utm_source=jt_newsletter_2016-03-10_PM
“ALONG with bank runs and market crashes, oil shocks have rare power to set monsters loose” ! Image of the Week !
http://www.economist.com/news/leaders/21688854-low-energy-prices-ought-be-shot-arm-economy-think-again-whos-afraid-cheap
UBER INTERACTIVE Chart of week linked from same economist article !!
Energy Podcasts of Interest https://soundcloud.com/the-energy-gang
The CEO of Canadian Pacific Railway says fossil fuels are “probably dead.”
Hunter Harrison told a transportation conference today that the transition to alternative fuels will be long, but new investments in traditional energy sources will dry up because of environmental hurdles.
http://www.huffingtonpost.ca/2016/03/09/fossil-fuels-probably-dead-says-canadian-pacific-railway-ceo-hunter-harrison_n_9420864.html?ir=Canada+Business
Nothing like making the transition when you aren’t ready to.
I don’t see this going as smooth as the political class et al thinks. Dropping the hammer on FF without a substitute that can supply the energy needed to run the world is a recipe for disaster. Famine, depression, and revolt.
My guess is people would willingly transfer to renewables without the mandates and without the government trying to limit FF use if renewables were ready. My opinion is this won’t work, and if government has to choose between adequate amounts of energy to feed, clothe and keep the economy running, AND meeting their arbitrary targets for energy use, they will choose the former.
BTW sports fans . . . just heard a Hillary commercial about the evils of Valiant Pharm. She is gonna go after them because of what they’re doing — which she labeled:
Predatory Pricing.
Thought there was no such thing. Imagine that.
Carried over from here…
So 1.5 times your original .06°C at 0.09°C within the 55-year 1955-2010 time-frame.
‘Less than 0.1°C‘ sounds a little more benign than ‘1.5 times .06°C‘, so maybe we can understand why one might write that, such as if they have an agenda that wants to ‘massage/cherrypick/downplay’ the numbers/time-frames.
Two 30-year intervals is of course 60 years, rather than 50, 55 or even 57 years.
Nevertheless, this is a sea change as opposed to an atmospheric change. Water is different than air and should be regarded and respected as such, perhaps especially for the creatures within it that, for example, maybe depend on, and are sensitive to, specific and relative levels and degrees of stratification and temperature.
One might think after reading this that the ocean was just one big moderating pool for humans’ industrial activities, irrespective of any superfluous life contained within.
I would replace your ‘scared’ with ‘cautious’, ‘concerned’ and ‘proactive’ (as to collectively doing something about it) and then suggest why, in part, because of the 60-year interval– even though the deep ocean has ostensibly warmed .09°C in 55 years from the period 1955-2010– and because of what clifman’s comment’s link suggests, including its update:
Our Hemisphere’s Temperature Just Reached a Terrifying Milestone—Faster Than Expected
In the last two Democratic debates, Bernie Sanders has mentioned (to generous applause and much fanfare from the like-minded audience) that he would ban fracking to deal with climate change. I assume he’s referring to fracking just in the United States, but who knows. In any event, does that sound like a good, reasonable, and workable solution to deal with these baseless fractional temperature increases you’ve decided to bring up?
The Lighthouse Keepers of Anthropogenic Climate Change
Quote from the link:
To a T, Jason T. Your ‘canned comment’ deserves a canned response.
New drillinginfo data is out (http://diindex.drillinginfo.com/). Another 11% drop in new US production capacity in February (-21% for oil). This accumulates to 36% in the last 2 months now
Interesting, thanks Daniel.
DMR at 33 today with 3 MIRU and 1 stacking. Two third of the rigs in MacKenzie county. Number of rigs in Baker Hugues probably at or below 30 (-10%).
Looks like CLR is executing the plan of no new Bakken wells, with focus on OK gas.
Latest IEA report – OECD commercial inventories gained 20.2 mb in January
According my numbers, USA commercial inventories increased by 32 mb in the same time, so the rest of the world is already reducing inventories by ±300,000 bpd. Can this be correct?
“What if Riyadh’s oil wealth days are numbered?” American political analyst Phil Butler asks, shedding light on what “peak oil” means for the Western economy.” “What makes matters even more complicated is that the Ghawar Field, the world’s largest oil field, is running out after about 65 years of continuous production and the Saudi Aramco is due to start the CO2-EOR process to extract the last of the field’s oil, the analyst stresses.”
After decades , just now resorting to Gas? Where they source the CO2? Do they continue with water/brine fill?
http://sputniknews.com/politics/20160310/1036086686/saudi-arabia-oil-business-going-bust.html#ixzz42Y3vIArL
Link to the original article:
http://journal-neo.org/2016/03/10/key-crisis-point-is-saudi-arabia-running-out-of-gas/
What a waste of blood! Oil from Sunshine just not worth fighting over. /sarc .. Not April 1st yet. What we find for graphs & charts in 2017?
http://journal-neo.org/2016/03/05/needless-wars-over-oil/
It has got to be the warmest winter I have ever witnessed. It was a record temp yesterday, it will be again today. Never has it been such warm weather for this time of year that I have seen in all my born days.
Maybe in other times like a hundred years ago before I was born, but I don’t think so. It’s unreal.
Sure is good for getting things done outside. Sure saves on gasoline and heating costs. The bears must be waking from their long slumber.
The sun finally rises above the Arctic circle on the 21st of this month.
http://www.bnsf.com/about-bnsf/financial-information/weekly-carload-reports/
Coal cars down about 17,000 compared to 2015, petroleum cars down about 3400.
Have a nice day!
Anadarko cutting 1000 or 17% of workforce and 50% of Capex budget for 2016:
http://oilpro.com/post/23058/anadarko-lays-off-17-workforce
Here is an upcoming disruption in the transportation industry. New Jersey Transit workers are about to strike. The large number of rail and bus commuters will have to find other means, such as using the already congested roads of eastern New Jersey and the tunnels into New York City.
“Two emergency federal labor boards convened by President Barack Obama over the last several months leaned toward the unions’ proposals, but NJ Transit rejected those recommendations as too costly for the agency to absorb without another fare increase. NJ Transit has raised fares twice in the last six years. ”
http://www.cnbc.com/2016/03/11/
Looks like all those electric trains will be replaced by ICE transport for a while, unless an agreement is reached quickly.
Oh boy I can’ wait until the OPEC MOMR comes out on Monday. It’s gonna be like Christmas! (I need a life lol)
“Reuters Health – Obesity rates may surge in places where artificial lights blaze all night compared to communities where people tend to live in darkness after the sun goes down, a recent study suggests.”
http://news.yahoo.com/bright-light-night-lead-obesity-182319384.html
Baker Hughes US oil rig count 386 vs 392 prior
Oil rigs 386 -6
Gas rigs 94 -3
Horizontal 375 -14
Vertical 55 -3
Directional 50 +8
Oil rigs in key LTO basins:
Permian: 150 -6
Bakken 32 -1
Eagle Ford 37 -3
Niobrara 15 unchanged
Although the overall decline in oil rigs is slowing, key tight oil basins have lost 10 oil rigs.
Also note a significant decline in horizontal rigs.
Horizontal rigs drilling for oil:
– down from 311 to 301 for the week.
– down 120 units (-28.5%) from the end of 2015
– down 814 units (-73%) from the peak on November 26, 2014
Why is “Directional” adding?
Directional wells are drilled in conventional fields.
In particular, of the total 27 offshore rigs, 22 are directional.
The number of offshore directional oil rigs increased 3 units for the week to 18 and is flat since the end of 2015. 2 units started operations in Louisiana waters and, for the first time since last October, 1 in California waters.
The number of directional rigs drilling in inland waters increased from 1 to 2.
Thank you, AlexS.
Oh Canada
Canadian Rig Count is down 31 rigs from last week to 98, with oil rigs down 22 to 28, and gas rigs down 9 to 70.
Canadian Rig Count is down 122 rigs from last year at 220, with oil rigs down 57, and gas rigs down 65.
Not an expert on Canada drilling but the production numbers won’t be that impressive in 6 months as I understand this is the time they suppose to be drilling.
AND since US + Canada are the ones that been keeping world production up we all need to hope for some serious Iran drilling in the coming months (won’t happen though). Price spike here we come my and my guess this is in August/September. Everyone will be like: I thought we had a surplus? WTF happened?
The NDIC just released production info for January. I published a new post on the data
here.
Thank you Enno.
What are your expectations for the next few months?
[…] World Outside US and Canada Doesn’t Produce more Crude Oil than in 2005 Matt Mushalik, Crude Oil Peak We can see that almost all additional oil produced now above that level is US shale oil. In other words: without US shale oil (which required cheap money from quantitative easing), the world would be in a deep oil crisis. We can therefore confidently say that growth of the world economy managed to make itself completely dependent on unconventional oil from the US and Canada. The oil price in October 2015 of $48 is the same as the average oil price in the first 5 months of 2005. Many will call this a price cycle and not worry. But in oil depletion there are no cycles, there is only a race to the bottom of the barrel. Since 2005, the world has gobbled up more than 300 Gb of crude oil and that was definitely oil which was easier to extract than what lies ahead of us. (Also read: International Rig Count Still Falling) […]
[…] gedrittelt und international ist ein Rückgang um ein Drittel aktiver Anlagen zu verzeichnen (PeakOilBarrel.com: International Rig Count Still Falling). Aktuell ist der Markt trotzdem absolut überversorgt (Lagerbestand: +9,4 Mio Barrel in einer […]