A Guest Post by George Kaplan
This analysis concerns C&C only. Natural gas production is low and steadily declining with few deep gas-condensate discoveries and the shallow dry gas fields at end of life. I don’t know if lack of gas may affect oil production – e.g. insufficient: flow to allow stable pipeline operation; income to be economic to warrant continuing maintenance; or fuel gas or lift gas supply to surface facilities. Any such issues could influence shutdown timing and hence the possible stranding of assets.
Top Down Production Projections
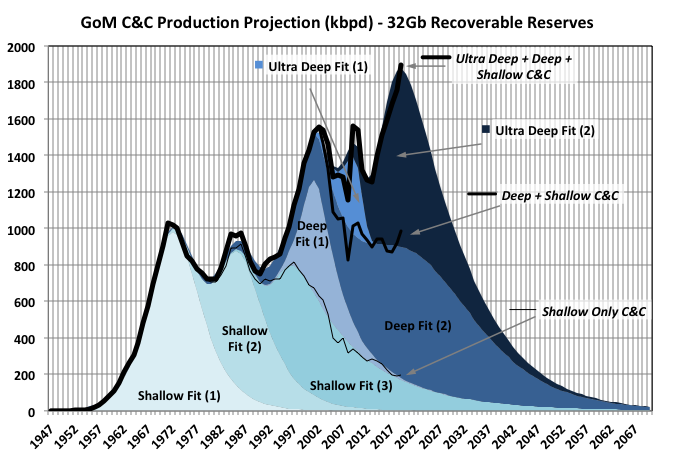
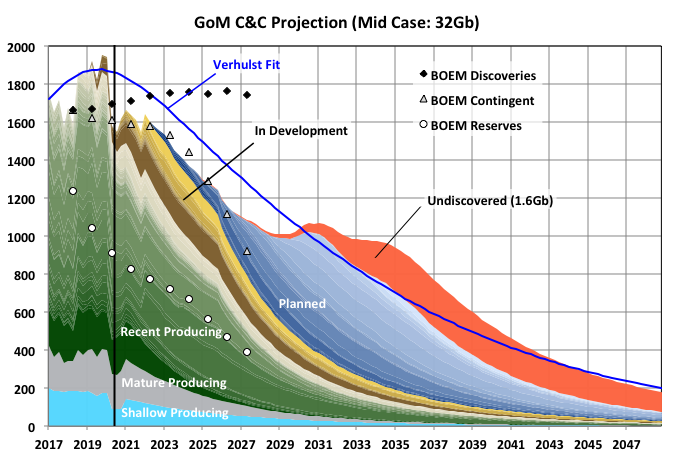
The chart above shows a Verhulst fit to GoM C&C production using seven curves, three describing shallow production and two each for deep and ultra-deep. A symmetric logistic curve is convenient for manual curve fitting as it allows a linear extrapolation to give the ultimate recovery, but most production curves are not symmetrical – usually the decline is less concave with a thicker tail, especially as the production volume and number of independent producing entities are reduced. With Excel, using least-squares optimisation fitting to any curve(s) is simple and has the benefit of allowing additional constraints to be imposed for sensitivity checks (e.g. total area, equivalent to the ultimate recovery, and position or height of peak), so more general Verhulst curves allow closer fitting.
Against this is that fitting fairly arbitrary curves maybe negates some of the births-and-deaths theoretical basis for a logistic model and, as mentioned below, can distort the extrapolated tails unless some additional constraints are applied.
The drilling hiatus after 2010 complicates the fit by creating a false trough and deferring the peak; without it only one curve would be needed for each of the deep and ultra-deep production. The fit to the shallow production is pretty good and gives an ultimate recovery of 14Gb. in its 2018 report BOEM estimates ultimate recovery at 13.4Gb, with 67mmbls added that year (and generally the additions are declining each year) so that too fits well.
The curve above has a total recovery of 32Gb C&C, with 12Gb in deep water and 6Gb in ultra-deep; BOEM in 2018 gave these as 7.8 and 3.7 respectively, with annual changes of -36 and 174mmbbls, make of that what you will. There are a couple of billion under development or close to FID but not included by BOEM: projects in the Appomattox area, Vito, Mad Dog, Anchor, Kings Quay and Shenandoah, though much of it is 20ksi technology that has yet to be proven in full operation and is costly and with long lead times.
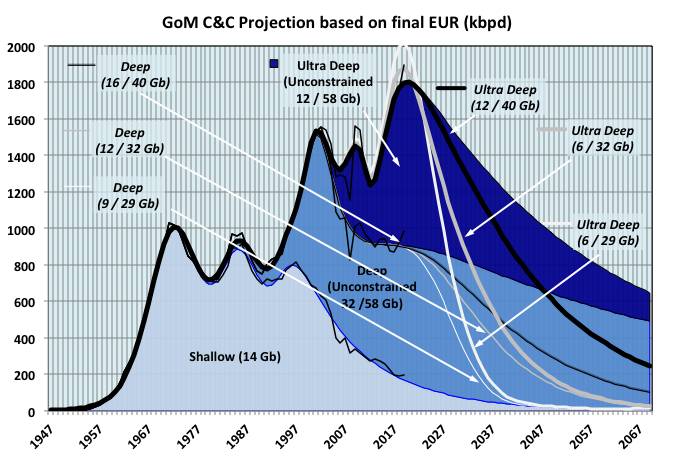
The second chart shows fits with constrained recoverable reserves of 28, 32 and 40Gb (shown as line curves) and an unconstrained case that gave reserves of 58Gb (shown as the stacked area chart). All cases use the same curve for the shallow production and optimsed the fit with the parameters of the four other Verhulst curve. Current BOEM 2018 estimates of total 2P reserves of C&C are 24.9Gb (13.4 / 7.8 / 3.7).
By these estimates 2019 looks likely to be a peak, if not an all-time then at least for some years. This year will be well down compared with last and it will take a few years of steady development to catch up if the peak is to be exceeded, assuming sufficient and rapid discoveries become available, which seem unlikely (see later sections). As mentioned before, a delayed and higher peak would be an expected result of the 2010 hiatus (as happened to a bigger effect in the UK with the Piper Alpha shutdowns).
With only half the curve to fit to the parameters are sensitive to small changes, although I’d venture that the actual answer is bounded by the cases shown. The displayed curves indicate that new reserves need to come more from deep rather than ultra-deep but I don’t think too much should be read into that; in further studies just small parametric changes didn’t change the accuracy of the overall fit much but had big effects on the split between each curve.
Reserve Projections
Below is an attempt at a similar fit to reserve discoveries, although only using a single curve for each depth. This is rather more difficult than for flow: (i) the process of discovery is more stochastic than for production; (ii) recent discoveries, which have a large effect on the tail shape, are not known well and depend on whether they have yet been through FID; (iii) with BOEM any new field discoveries in a producing lease are backdated against the original field, which loads the curves to the front end and thins out the tails; BOEM estimates for recoverable reserves tend towards the conservative; and (v) the estimates for new discoveries not in development in 2018 are based on company reports, either directly or through industry magazines, which tend towards optimism (often citing an “up to” figure, which would correspond to a P3 estimate).
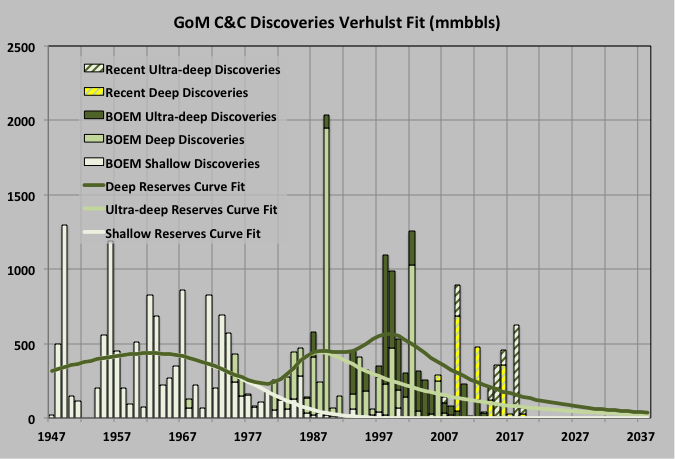
The tails on these curves give only 700mmbbls more, split slightly in favour of deep rather than ultra-deep, to give a total ultimate recovery of 29Gb. I think it will be higher with a couple of major finds but mostly near field tie-ins either to the set of hubs currently under development or appraisal or extended reach tie-backs (BSEE/BOEM is currently looking at technology that could promote development of these so that presently stranded assets can be matched with existing under utilised surface processing, which I’d assume includes things like heated flow lines, subsea compression, and subsea separation). The dearth of recent lease sales would tend to militate against a lot more – maybe 32Gb will prove to be about right.
EIA Reserve Estimates
The previous estimates are all based on BOEM reserve figures. The EIA also issues estimates based on reports from the E&Ps. For 2018 these are 5191mmbbls (C&C), but are a 1P number (proven). This compares with 3434 from BOEM, a nominal 2P number. In the UK 2018 probable reserves were 40% of proven, in offshore Mexico 80% (but the Cantarell field contains almost half the probable reserves which is a bit surprising for a mature field), and in Brazil about 60% (an educated guess as the ANP board only issues 1P an 3P numbers). Given the maturity of the GoM basin and the technology available I’d expect the GoM would be closer to the UK number. In addition the companies numbers likely include some reserves for fields in development but not yet in the BOEM numbers; so a conservative guess around 7Gb for 2P EIA equivalent seems reasonable, but is likely to be more dependent on oil price than the BOEM number. I think some of the biggest contributors to the extra EIA reserves are higher recovery factor estimates, especially for the large ultra-deep fields operated by the Shell, BP and Chevron. For example the BP fields Atlantis and Thunder Horse have present recoveries, from BP investor presentations, of just above 10%, and Mad Dog’s is given as below 5%. These are large fields with over a billion barrels of original oil in place. Just small changes in the recovery factor results in a significant change in reserves. BP is forecasting an increase to 400kboed production (from 300 in 2019) and then, without new discoveries, a slow decline. The higher EIA numbers are not incompatible with an estimated C&C recovery of 32Gb, but may suggest a higher upper end, depending as usual on future discoveries.
Well Decline Rates
Well decline rates were estimated by fitting an exponential to the decline phase (after the maximum monthly average is reached) for data from 2014 onwards. New wells tend to decline rapidly in the initial months after ramp-up and any plateau. A power-decay curve (e.g. a hyperbolic) would be closer than an exponential in the early months, but that is not particularly relevant to the later life behaviour, which is what matters most for estimating ultimate recoveries.
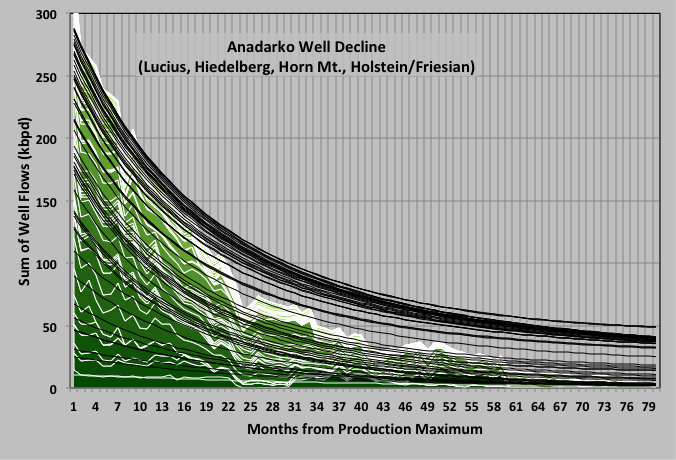
The chart above shows the example of some of wells for Anadarko. In each field the wells are stacked from oldest to newest and all start at their maximum month, so the upper measured curves are shorter and some may not even be in the real decline phase.
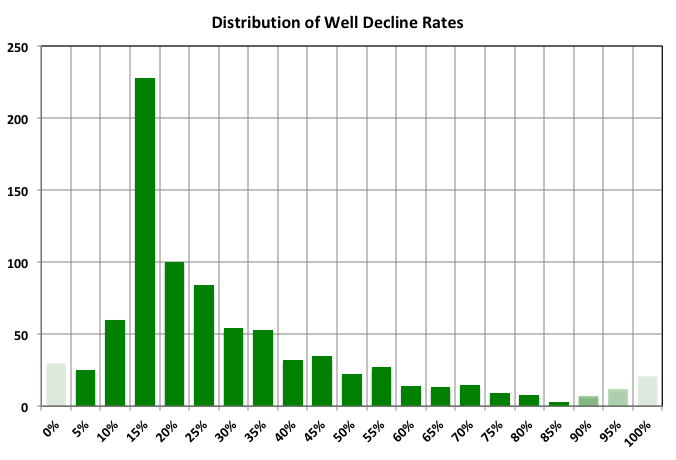
The rates are mostly collected around 15%, but some have are above 50%, e.g. Lucius and Heidelberg have some initially large wells that decline fast with water break through. Older low flowing wells decline much slower, and because the time considered was only from 2014 these numbers are not really representative over the life cycle of the well. A few wells (not shown) have negative decline but are all low producers and, often, intermittent. Those with very high decline rates are either newly started or have ceased flowing, in either case the fit was against only a few and scattered data points. Overall the decline rates are probably better than average for high-pressure wells mostly without external pressure support, but do indicate that to maintain or increase overall production a steady supply of wells from new projects or in-fill drilling is required, and those are starting to run thin.
Well Start-up Activity
The following shows the number of new deep or ultra-deep water wells started up in recent years, plus the total extra flow added once they have achieved their maximum monthly average flow, which may be several months to years later because of ramp up issues or plateau periods. Also shown is the number reaching their maximum and the sum of these maximums each year. These are a bit dodgier as indicators of growth because wells may be on a bumpy plateau and have just a small increase in a given year rather than indicating end of a ramp up or plateau. New maxima do not all come from recently drilled wells but could be from recompletions, work-overs, sidetracks, added gas lift, other causes of reduced wellhead pressure (e.g. as throughput from neighbouring wells is reduced), improved availability etc. These wells would not necessarily correspond to wells shown as new start-ups.
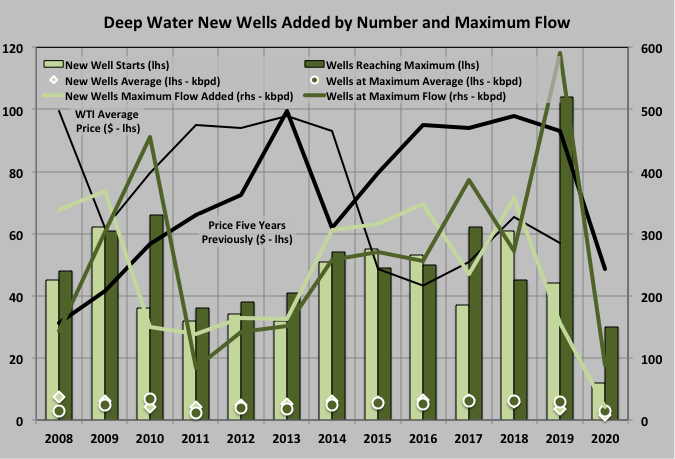
There was a spike in completions in 2009, probably from deep rather than ultra-deep water projects, a dip from 2010 to 2013 and then a steady rise to 2018 with new starts dropping in 2019 and so far collapsing in 2020. Wells reaching a maximum follow a similar pattern but a year or so behind and 2019 had a peak in number and flow of wells reaching their maximum. Likely the 2019 values will decline and 2020’s will increase as some wells exceed their previous maximums. The number of added wells for 2020 is only through June but is unlikely to double in the second half given the CAPEX reduction for all the E&Ps plus other effects of the COVID pandemic and an active Hurricane season. Some of the wells to be added might be quite large producers though, especially for Appomatox and Atlantis Phase III, additionally Stampede and Big Foot are still ramping up and Katmai may come on line, depending on Fieldwood’s bankruptcy.
The pattern of peaks somewhat follows oil price: five years before 2018/2019 was just before the oil price collapse and would have seen major project FIDs, and late 2016 was when the price started to recover so that brownfield developments and small tie-ins were approved, all of which would have started beginning in 2018. However the sample size is a bit small to be conclusive and the net effect of many small individual issues may be the significant factor.
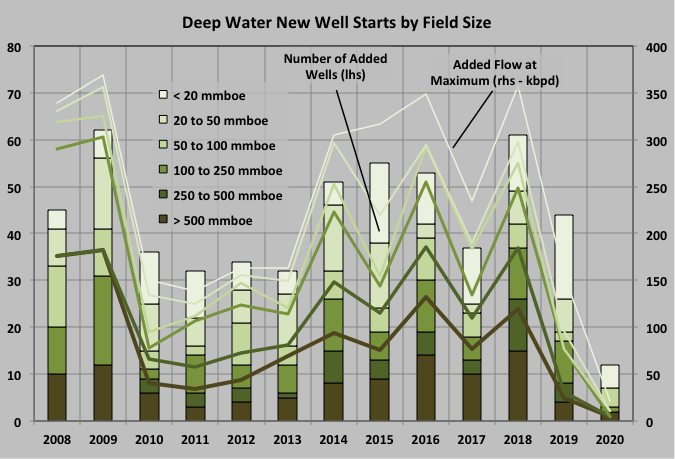
The chart below shows well additions by number and maximum volume according to the field size at the time that the associated well was started. The additions from each group follow pretty much the same pattern (i.e. the same years tend to attract higher or lower number of starts from all groups), and the larger fields tend to result in slightly larger producers.
Overall it looks like the next two or three years are going to see declining production compared with 2019, mitigated by the ramp-up of Appomatox and Thunder Horse South Phase II, before some large new developments begin start-up from late 2021 onwards (Kings Quay, Vito, Mad Dog II – aka Argos, Anchor). It seems most of the attractive near field opportunities for existing hubs have been used up and new ones will have to wait until the coming ultra-deep water hubs get through their plateau and have enough spare processing capacity to allow new tie-ins or in-fill wells, or new technologies that allow extended reach tie-ins (and, of course, depending on discoveries).
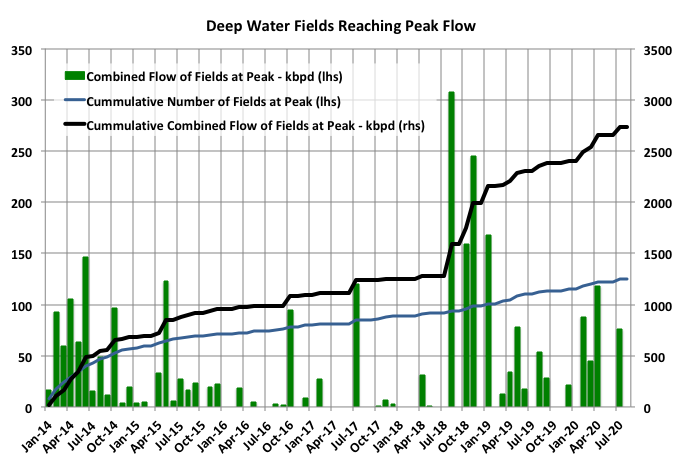
Field Decline Rates
Many large deep water fields peaked around the second half of 2018 and have been declining, slowly, since. The pace at which fields have peaked is slightly higher in the months since then than before . Another set of smaller fields peaked in early 2020 some of those may yet ramp up further as production recovers or new wells are added but several of these are one or two well tie-backs and have been declining as expected since a peak in their first couple of months on stream. Only Dalmatian, Coalecanth and Buckskin peaked in July (and for these it could be a final peak) but Appomatox and Big Foot will certainly exceed current maximums as drilling progresses.
In order to look at mature field declines (i.e. those started before about 2010 or without significant new associated field discoveries since then) they were split into three groups: shallow water, those operated by the majors (which include the still high producing fields like Thunder Horse, Atlantis, Shenzi, Mad Dog, Caesar/Tonga/Tahiti) and other mature deep water that are all well into the decline phase (albeit with occasional brown field impacts).
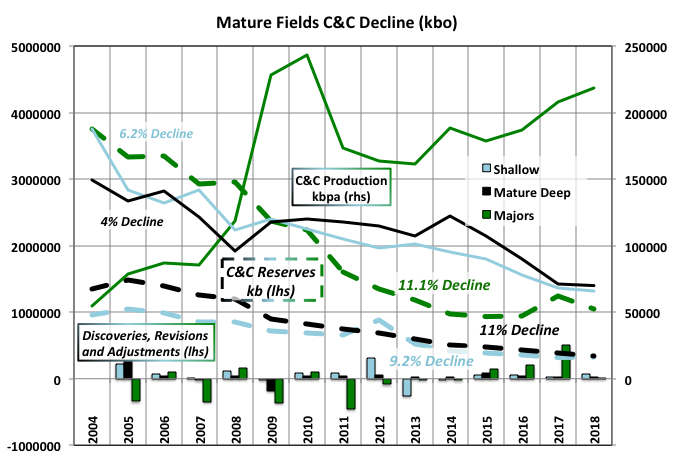
Each group shows a significantly higher decline rate for the remaining reserves than for their production rates, in fact the ‘majors’ group shows steadily increasing flow. This means their respective R/P numbers have been declining and either the reserves are under-estimated (by a lot) or something is going to give and production declines increase considerably. From 2005 to 2018 the R/P values for shallow/mature deep/majors fell from 7.4/11.1/41.5 to 4.9/5.4/4.8 years. Even the group of remaining non-mature fields (i.e. recent start-ups) has an average R/P value that has been steadily falling to reach 4.8 years in 2018. Values around five imply decline rates of 20%. There are signs that the small deep mature group has entered a steeper decline starting in mid 2019 after a plateau period, partly the result of production deferment after the Enchilada platform fire and Garden Banks pipeline shutdown but with extensive brownfield development. Shallow fields might be similar but the Covid related shut-ins make any new trend difficult to see at the moment. There have been small net increases in the overall reserves, probably mostly from small near field discoveries and/or IOR initiatives, for the shallow and mature deep groups but these have been trending down towards zero (probably in the next few of years). For the larger, major operated fields downward revisions from original estimates have exceeded new discoveries so far, due mainly to large decreases in Atlantis and Thunder Horse soon after their start-ups.
The peak month for the majors group was December 2018 (with the maximum for the trailing twelve month average in January 2019). Even the group of recent start-ups (i.e. everything else and not shown in the chart) had a local peak in February 2020 (average annual peak in March/April ) and has declined by 30% since – see below for further discussion on Covid-19 and Tropical Storm deferment effects.
Leasing Activity
In 2016, under the Obama administration, BOEM stated that it would present for sale all remaining available leases in Western and Central GoM in a series of tranches up to 2022. The Eastern area is mostly under a drilling moratorium until at least 2022 but is generally considered not to be highly prospective and the few discoveries there have been natural gas. There are five auctions planned, although that for August was cancelled, and others might follow suit if oil prices and E&P activity remain low. Each sale is for about 14,500 tracts meaning about 70,000 are available, but recent uptake has only been a bit above 6% and falling so maybe only 3000 to 5000 would be sold to add to the 1200 existing open leases. This is considering non-shallow wells only; there are still some shallow leases available but recent discoveries have been insignificant.
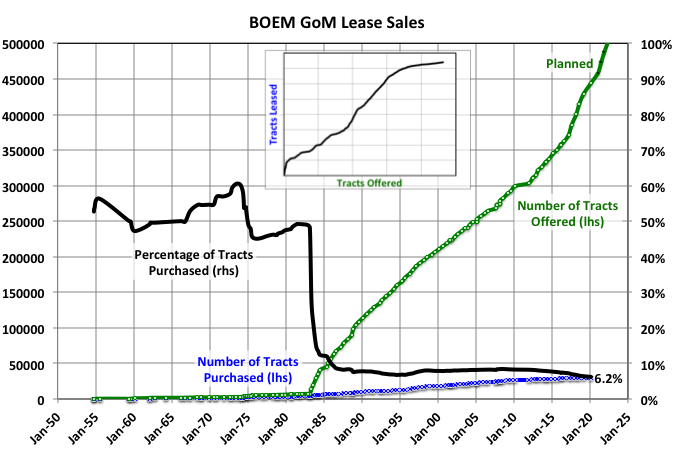
GoM leases are held open initially for 5, 8 or 10 years. If they are not then retained by production or exploration activity they expire; they may also be relinquished early or extended if an operators request is accepted by BOEM/BSEE. Most by far are ceded without seeing any production. All water depths have seen a declining proportion of operated leases even as the numbers purchased have been declining at each sale. The lines in the chart below show a five-year average of the proportion reaching production out of all the non-open leases (i.e. closed or held b activity); the indicated recent drop in ultra-deep water is an artifact of low sample numbers (i.e. there are some small producing fields from direct tie-ins to exploration wells and a few more that have been relinquished, but most are still open) and will disappear as the sample size increase. For all water depths 98 to 99% were ceded in the 2010s and the trend is slowly upwards. Therefore of the yet to be sold leases only 30 to 100 would go on to produce anything, with (a complete guess) an additional 50 to 100 from those presently open (a higher proportion because these have already been winnowed to some extent).
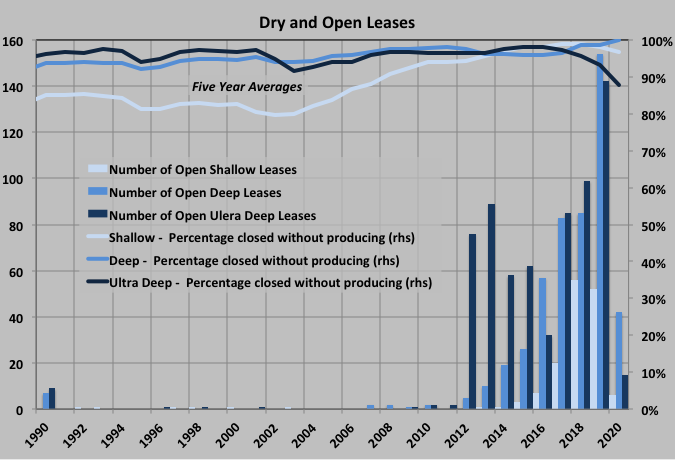
Of the open deep-water leases only fourteen (seven in each of deep and ultra-deep water) have had wells drilled in them, and six of those are under development already.
This is not the full picture because there may be new exploration wells and new field discoveries in leases that have already been developed (or for some shallow lease have been relinquished after depletion of the original discoveries) but these would tend to be smaller producers that were either missed the first time round with older technology or had unattractive economics (e.g. not worth designing facilities for but alright for a tie-in once capacity is available).
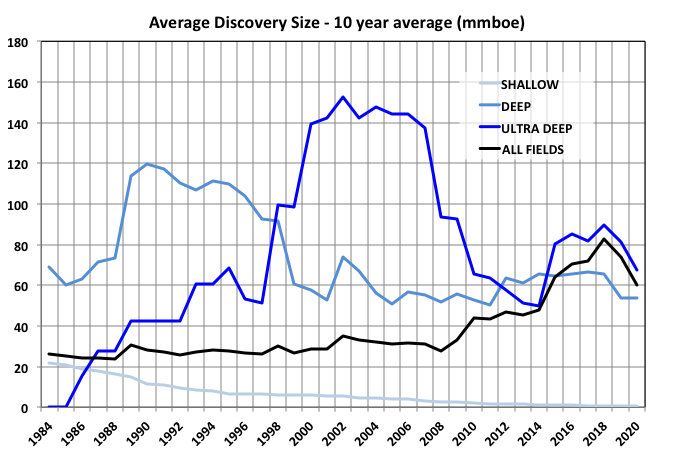
A ten-year running average of recent discoveries, including estimates for fields under development and putative discoveries, is shown below. Current average for deep and ultra-deep is 60mmbbls and falling, but this includes gas and NGLs; for C&C only it would be 45 to 50. Allowing for continued decline, which seems unlikely to be reversed in the medium term given recent history of successes, 30 to 40 might be a better range. It is unsurprising that the uptake and success rate of leasing has been falling as there is close contact between the industry and the regulators and the best land tends to be offered first plus many of the tracts have been offered before and been left unsold or subsequently ceded.
Multiplying the range for the expected number of producing leases by the range for discovery size gives expected future reserve discoveries of 2.4 to 8Gb, but with a likely median closer to the low end. Again a value around 32Gb looks reasonable.
As part of the 2016 initiative for the final leasing program BOEM released estimates for recoverable reserves in the tracts to be offered (half of which have already been auctioned). For C&C these were 2.1Gb for $40 oil, 3.5 for $100 and 5.6 for $160. I think trying for accuracy like this is a bit ridiculous when there are so many future unknowns – e.g. in the present environment operators are asking for and getting up to 40% CAPEX cuts and deep-water rig day rates have collapsed – but it is what the models churn out and it does indicate the complexity and/or reliance on existing infrastructure of the putative developments.
Project Schedules
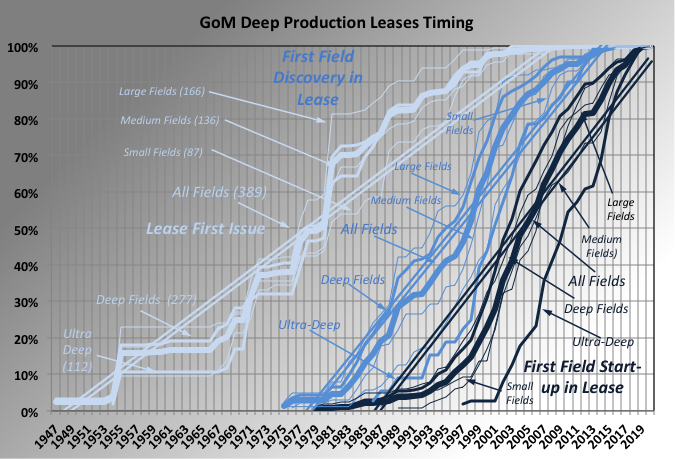
The chart above shows the cumulative number of lease sales, first discovery in each lease and first production against the year for the main field against which the lease is listed by BOEM, for deep-water start-ups. The curves are categorized according to depth of water and field size (small fields are less than 20mmboe, medium fields are 20 to 100mmboe and large those above 100mmboe). The numbers are normalized so they are directly comparable. The time to discoveries has been narrowing, probably as technology has improved, down to about eight years. The time from discovery to first production, which for the main field would require development of a platform hub, has been pretty steady at nine years. Deep and ultra-deep fields take about the same time; small fields are done in five to six years, medium fields in nine to ten, and larger fields in just over ten. Appraisal and development time is dependent on human factors: engineering and construction man-hours, planning and regulatory processes, procurement cycles, installation windows etc., and are unlikely to shorten but could slow as supply chains shrink and skilled labour is lost.
COVID19 and Tropical Cyclone Shut-ins
The effects of oil and gas prices, and possibly manpower shortage, after the Covid19 lockdowns had a dramatic effect on the number of inactive wells (i.e. shut-ins) and production in May. Mostly it affected shallow wells with 293 extra wells inactive compared to 53 in deep water. In June the additional inactive count had reduced to 239 for shallow and 7 for deep. It’s possible that some shut-ins allowed planned maintenance work to be bought forward and so avoid net deferment.
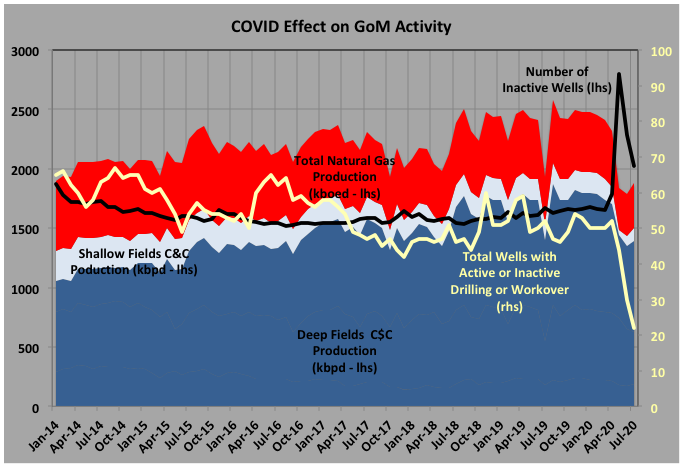
Hurricanes show only minor ripples on the inactive numbers but bigger impacts on production, probably because they only last a few days but tend to affect larger normally-attended deep-water platforms. According to BSEE figures Cristobal knocked off a monthly average of 141kbpd of oil and 34kboed gas in June, Laura/Marco 415kbpd (78 for gas) in August, Laura/Sally 152kbpd (33 gas) in September and in October Delta/Zeta deferred 593kbpd (103 gas) . There were significant pauses in drilling too, for both platform rigs and MODUs, with a total of 303 drilling days lost.
At the time of writing in early November Zeta has just exited (contributing 56kbpd C&C and 8 gas off-line for the month) and TS Eta is threatening some further disruption. This year has been particularly active because of continuing high and rising ocean and Gulf water temperatures, a mild La Nina to reduce Atlantic wind shear and possible effects from lower aerosol levels. Hurricane season peaks in the firs weeks of September and continues through November, but is tending to start earlier and remain active longer as climate change accelerates.
Bottom Up Projection Estimates
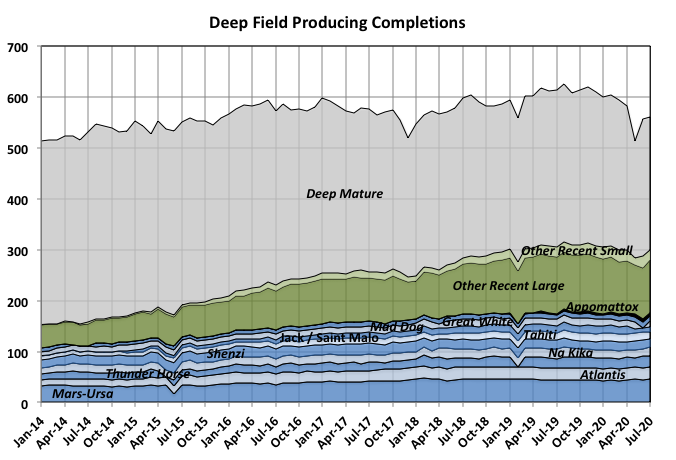
Even without the pandemic and weather interruptions it is unlikely that 2020 production would have exceeded or even matched 2018 or 2019, Production had a local peak in August 2019 and has been trending down since. Several of the large, recent start-ups reached plateau in or before 2019 and the brownfield work switched from increasing producing production to maintaining it (e.g. Atlantis Phase II, Thunder Horse South Phase II, St. Malo Water Injection). Additions of producing completions have declined while older wells continue to be exhausted, so the overall number of producing completions has been declining since late 2019, with a large Covid related drop in May.
Many of the medium to large fields are showing increasing water breakthrough to the extent that it is probably limiting processing capacities as well as well flow rates (Atlantis, Shenzi, Mars-Ursa fairly steady at 3 to 4% increase per year; Gunflint, Marmalard, Dantzler, Cardamon faster at 15 to 25%; Lucius and Heidelberg with continuous issues; several small tie-backs showing immediate and rapid breakthrough; Jack/St. Malo just beginning; other large fields starting to rise as production increases plateau).
Two fields are continuing ramp up: Big Foot has two of eight producers on-line and bring another one on every seven to eight months at about 13kboed, but it also needs three water injectors; and Appomattox has 6 of 15, and with two rigs operating adds one every 4 to 5 months at 10 to 33kboed so far. All the new wells appear to start declining soon after start-up at around 15% per year but there is limited data so far. Some tie backs are planned and likely to proceed eventually, the largest are: PowerNap to Olympus (35kboed), Leon to Lucius and (with questionable timing as it is for the bankrupt Fieldwood) Katmai to Tarantula.
From 2021 onwards some larger fields will begin to ramp-up: Argos (Mad Dog II) with 140kboed capacity, Vito at 80kboed, Kings Quay at 80kboed (but only 50 utilised without more tie-ins) and Anchor at 80 to 100kboed. The GoM doesn’t utilize much pre drilling even for sub sea completions, and the current oil price and slow down militates further against so these will take at least a year to ramp up. There are many fewer near field tie-ins and in-fill drilling developments than 2017 through mid 2019 so it is hard to see production not taking a considerable dip, at least through 2022, given the decline rates of the fields.
For the latter half of the 2020s there are some large developments in the (now delayed) queue for FID: Whale, probably at 80kboed; Ballymore at 100; and North Platte at 75kboed; plus a number of significant discoveries in appraisal: Dover, Shenandoah, fields associated with the proposed Tiber hub, Blacktip; and some possible extensions: Atlantis Phase III, Julia II, Mad Dog III, various fields around Appomattox. However, given that average project development time is around five years and the FIDs will probably need to wait for a price recovery, then any additional production is some way off.
Recently Hess presented at an energy conference and stated that it would not pursue near field prospects – these days often referred to as infrastructure led exploration or ILX – until WTI price reaches $50. Also presented was a list of breakeven prices developed by RH Energy Consultancy. These were developed in January 2018 and so probably are a bit high for current conditions given about a 5% fall in the IHS upstream capital cost index, a collapse in rig rates and, likely, a bit for process “right sizing”. Some prices given were, for projects in operation: Heidelberg – $53, Appomatox – $60, Stampede – $62, Big Foot – $71; those in development: Vito – $44, Anchor – $62; and those in appraisal: North Platte – $ 59 and Shenandoah – $65. These are just breakeven floor prices without allowing for company profits, contingency etc. and would probably need to be exceeded for around six months before FIDs were to be reconsidered. Therefore, overall, there seems to be a low probability for much short or long cycle development in the near future even given a miracle vaccine and rapid economic recovery.
In the longer term the trends for wildcat exploration and discoveries show: a diminishing inventory of prospects; a slow decline in the number of wells drilled over the past few years before the sudden dive this year; a fall in number and (probably) the size of discoveries; and a move to ultra-deep water, frequently high-pressure-high-temperature fields and often requiring innovative 20ksi completions, and hence relatively more expensive and complex. For future wildcat discoveries first oil is at least five and up to fifteen years after discovery (i.e. maybe seven to twenty five years from now). A more likely source for undiscovered oil is near field exploration around the hubs currently under development or appraisal, but these can only be tied in once the originally developed fields start to decline and processing capacity becomes available – hence still about seven years ahead at minimum. Additional issues will come from labour resource availability. The industry was suffering from a greying workforce and being an unattractive environment for new graduates. Now most E&Ps are laying off large numbers, many of whom will be voluntary retirements of senior personnel. The service industries are cutting back, the EPIC contractors are pulling out of competitive bidding and the deep-sea drillers are all facing bankruptcy.
Low Case
The low case is based on current BOEM reserve estimates for producing fields except for a few that are obviously underestimated given the present decline rates (e.g. Big Bend should be exhausted by now based on the production since 2018 but is still going strong). All are assumed to start declining immediately except for a few from BP and Murphy, which have parts of future production profiles available from recent company presentations and where the estimated declines would be significantly lower than the observed well declines, in which cases I increased plateau periods and/or design throughputs. The fields in development and planned have reserves based on available data, e.g. company press releases, Rystad etc., or approximated from announced production rates or tie-in details (number of wells, flow line sizes, spare surface capacity) but at the low end of possible ranges especially for those still at concept appraisal. Future discoveries are guessed as a reasonable looking Verhulst curve that fitted the top down curve estimated from reserves (above) allowing for expected discovery and development schedules.
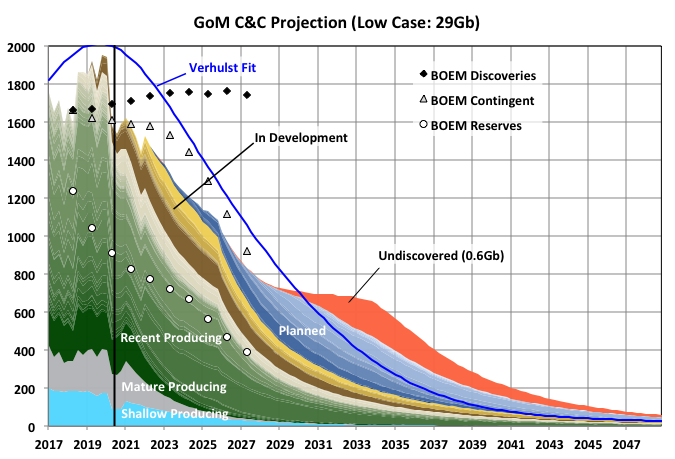
The lines indicated by isolated annual markers show the forecast from BOEM in 2016. I don’t know exactly what BOEM meant by ‘contingent’ – presumably on price in some way – but the stacked reserve plus contingent numbers closely represent all fields currently on production or in development. It matches well the middle case but is above the other cases. I don’t think there is any chance of new discoveries, including those awaiting an FID to be so declared, keeping production as high as indicated.
Mid Case
The middle/median case is similar to the low case except reserve growth is allowed on mature shallow and deep fields, and some of the large newer fields better to match recent decline rates, and the planned fields use median range estimates.
High Case
The high case uses higher reserves on several fields through lower decline rates on those that have apparently excessive declines based on the BOEM reserves, and using extended plateaus and lower declines for both the larger recent start-ups and those in development or planned. I haven’t changed te start-up timing between the cases but if conditions encouraged high production it is likely some of the putative planned projects would be advanced. The opposite will also happen – if the development environment remains negative then projects will be delayed and some assets may become stranded as aging nearby infrastructure, on which development depends, becomes uneconomic to maintain.
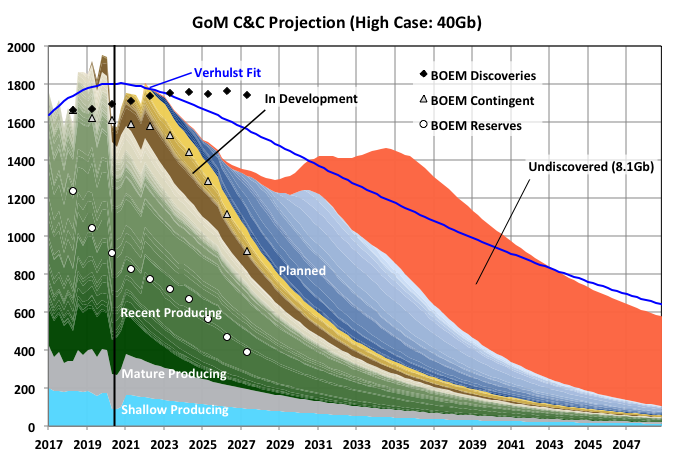
Even with this case it is difficult to see how a significant drop in production over the next five or so years can be avoided, unless the E&Ps have knowledge of some large projects still ramping up or a number of highly prospective near field opportunities that they have not shared. On the other hand there is any number of possible geopolitical events that could further reduce production even on the lower cases (e.g. leasing/drilling bans, continuing economic recession, skilled labour shortages, infrastructure ageing, new pandemic issues, disruption to material and equipment supplies, worsening climate disruptions).
Off Topic Finish: Arctic Ice Retreat
2020 will show the second lowest minimum volume and area of Arctic Sea ice after 2012. It continues a general trend in decline with first place 2012 a bit of an outlier but likely to lose its record in the next few years even without the sort of exceptional weather as seen in 2012 and 2007 (another unusually low year).
The trend can be more dramatically shown by looking at the amount of time the volume in the Arctic Sea’s various regions drops below some threshold. Since 2000 some regions have started going ice free in summer, and now have rising numbers of ice-free days each year. Others are just approaching ice free conditions but the trend of increasing days below a certain level is still clear.
Ice free conditions represent a positive feedback and possible tipping point as, once present, all the sun’s heat goes into raising water temperature (sensible heat) rather than melting ice at constant temperature (latent heat). Volume is closely related to area and as it reduces so too does the albedo allowing more radiation to be absorbed, maybe especially relevant in the peripheral seas that get more direct sunlight radiation flux for longer than the central basin.
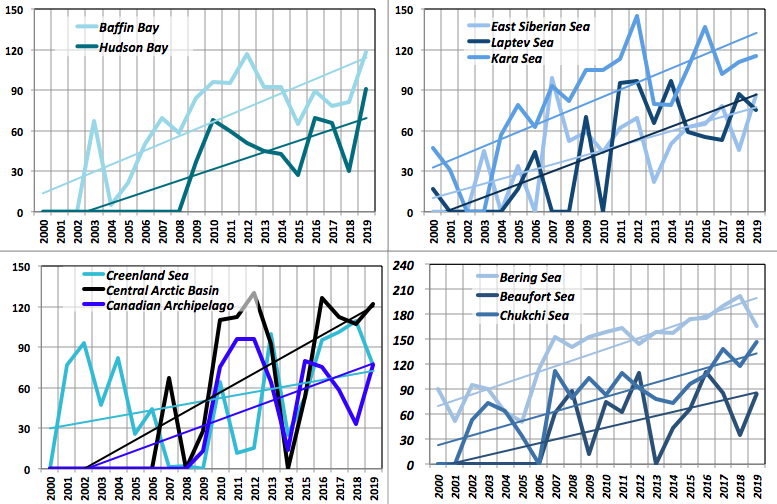
The y-axis shows days per year at or below a threshold volume (by PIOMAS). The Bering Sea and Hudson Bay thresh holds are set as ice free; the other peripheral seas have thresh holds at 10-20% of the average volume from 2000 to 2019. The Central Arctic Basin is set at 50% and the Canadian Archipelago at 25%. The trend gradients for all are close, though this may just be a result of the thresholds I’ve chosen. The Greenland Sea is slower but I think there are two opposing effects: increased melting, which is now dominant, and transport from the thinner and looser CAB ice, which is now diminishing as the overall summer volume falls.
This year is likely to extend or accelerate the trends for all except the Beaufort and Greenland Seas. If they continue at the same rates it seems likely that some of the peripheral seas will be ice free all year round before the CAB goes ice free in September.
93 responses to “GoM Summary Part V: Possible Futures”
Mr Kaplan , I have not yet read your analysis of GOM (it is a long read ,so will do it later ) however I always read your off topic finish first as it is always interesting . Well after going thru it , I am going to grab my sleeping pills:-) ( no use spending a sleepless night ) . Being in Europe I am 5 hrs ahead . Finally take care in the time of Corona . Be well .
I’d be most interested in a “cost to extract per year” estimate chart for oil.
Deci , not possible . Why ? The cost of extracting oil in Saudi Arabia , Gulf of Mexico and Permian basin are just ” too far apart ” to arrive at an estimate . Even if you were to average out the cost it would be misleading and misinformation .
Saudi Arabia turns to bond markets to fund the $ 75 billion dividend . Heck , they told me the sheikhs are swimming in money .
https://uk.news.yahoo.com/aramco-hires-banks-raise-cash-coronavirus-hit-oil-prices-085053090.html
What, they’re borrowing money to pay dividends?? This means that they’re either not making enough money to pay the dividends or somebody is siphoning off the profits. In my opinion, this kingdom is toast.
Some refinery news . The best offer for the sale of the Indian refiner received is about $ 6 billion against an expected price of $ 10 billion by the govt . The whales of the business abstained from the auction . The bidder is an Indian mining magnate . Refining is not so profitable anymore .
Another great post, George. I believe this is your first attempt at assessing GOM EURs? I like the bottoms up, granular approach, as you’ve done in all your posts.
By the way, OCS lease sale 256 just completed with bids on 93 blocks (out of some 14,000 available).
On your chart labeled “BOEM GoM Lease Sales” – the reason the bold black line labeled “Percentage of Tracts Purchased” takes a big jump down in 1983 is because that is when area wide lease sales were instituted. Before that, any leases that could be bid on at a lease sale had to be nominated by an operator before the sale.
SLG -thanks for the info. I haven’t previously estimated EURs, it wasn’t really part of my knowledge base and I don’t have the feel for it that reservoir engineers and petroleum geologists have. People can get a bit overexcited with exact numbers I think, rather than just taking them as a general indication. If my numbers hadn’t been in the ball park of yours and Jean Laherrere’s I’d probably have left them out. I was surprised the top down and bottom up approaches agreed quite well. I didn’t include some curve fitting that I did to the rate of addition of new wells and leases and their expected life times, most agreed fairly well with the other figures and indicated about an R/P (or whatever the equivalent is for well and lease “reserves”) of about 8 to 12 years.
All the best.
Hi all,
For those who don’t look at the non-petrol thread, Ron has said goodbye. Pop over to wish him well.
http://peakoilbarrel.com/open-thread-non-petroleum-november-18-2020/#comment-711264
HHH, continuing from the last thread . I disagree . If the FED goes negative interest rates ,it will loose credibility . We all know this is a confidence game . Foreign interest in US debt has declined but at the same time US needs more buyers to meet it’s ever ballooning deficit . The big foreign buyers viz ; the oil producers , China etc are no longer in the market for US debt due to political or financial( see above on KSA ) reasons . We are having a problem . The problem is that other currencies in the SDR basket of IMF are issuing debt at a faster rate ( compared to the size of their economies ) . They are running out of space . BOE has said that they are down to their last GBP 250 billion as far as QE operations are concerned . That will be exhausted by April/June ,they said . What then ? London must raise interest rates if it wants to borrow . If London raises interest rates then so must others , otherwise all money flows to London and we have an unsold treasury auction . We know the issue is yield and that is why we have a stupid category called ” junk bonds ” . Already interest in US bonds is declining and their is a problem at the auctions . The fact is the FED is trapped no matter what it does .
https://www.zerohedge.com/markets/ugly-tailing-20y-auction-pushes-treasury-yields-session-high
Not sure what we are disagreeing on. Because what I said was FED knows it can’t go negative. But if the markets, the banks force the FED’s hand which they are in the process of doing. Banks in the US own over $4 trillion in US treasuries. That is just the US banks. Right now banks are more in the business of buying US government debt than they are in the business of making loans to support the economy.
Do you think yields on the 10 year and 30 year can go negative while the FED keeps short term rates low but still positive? FED has a major. And i mean major problem here. The whole game they are playing comes unraveled.
Think about what I just said. US banks own over $4 trillion in US debt. If yields rise. They lose money on their over $4 trillion portfolio of US treasuries. Any rise in yields will be met with more buying from US banks to push yields back down to protect that portfolio.
Another thing banks won’t do is lend enough money to consumers to spark inflation that might make yields rises. Banks are and have been tightening lending standards.
Then there is the government pensions and social security funds that have massive exposure to government debt. If yields rise they lose money.
Market will eventually force the 10 year and 30 year negative. Question is what will FED do about it. If negative interest rates are off the table then QE ends and price of everything readjust to a much lower level. Deflation
How is this related to GOM oil production again?
Alimbiquated , very simple , if FDR had not worked out the security element with King Saud and had not Kissinger worked out the pricing of all oil in USD after Nixon quit the gold standard ,the world would be using the USD as toilet paper . USD to oil price is a historical correlation which it seems is breaking down . For as far as I can remember High USD= Low oil prices and vice versa was the norm . Now we have low oil prices and a depreciating(Low) USD . This needs to be analyzed . HHH is the only one who posts on this connection . Dennis has not objected , if he says so we can move it to the other thread . Currently the other thread is crowded with messages of gratitude for all what Ron has done for all on this forum , so better it remains here . It is however a Dennis’s call .
@Hole in Head
The U.S. can fund it’s deficit while it has the petroleum resources to do so. The problem is the physical constraints in supply. If the U.S. is more efficient in energy use along with the reduction in demand the pandemic has brought about.
The oil not being used by Americans can be used by the government to sell into foreign markets to sate their demand and recycle dollars in the process.
Hume, I think you seem to forget that the US is a net importer of oil . It is an exporter of finished products . Its conventional oil production is all utilized locally . There is surplus in shale but very few countries have refineries to use it . At peak, exports of shale touched about 2.5/3 million BOPD but are now languishing in spite of diminished production output . Anyway deficits are now going thru the roof ,the only solution is default .
We may have a sliver of agreement on this issue HinH- Debt
“,the only solution is default”
I am trying to understand how a world (or countries/states/cities) deals with debt when it gets to a point that that it can no longer be serviced by current budgets.
Default seems likely, and I wonder what that means on a grand scale.
Here are some of my thoughts on it and I am curious what others may think are likely mechanisms or outcomes.
-When a loan is defaulted on, the lender loses the money. It may be the bank stockholders, the retirees pension fund, the states/cities budget. Anyone relying on those assets or services. or income in their pocket would be the losers. The ramifications of that can be huge, such as loss of medicare funding or pension payment.
-When a loan is defaulted on, the loan holder losses assets (like a home or business), losses credit and/or suffers big downgrade in credit worthiness. This can be indefinite, and can wreck the ability to get back on the feet or get the economic ball rolling again. Too much debt always equals slower growth, even without default conditions.
-In a major default scenario there are always losers and those who lose less (not winners). If it is on a big enough scale, you get social unrest and the door is open to autocrats and tyranny- which begets even more losers, sometimes much more. Poor leadership often comes to power during these times. We have had a glimpse of that with this current US president.
-No one knows how to work their way out of a scenario of too much debt painlessly. Its a game of ‘kick the can down the road’ as long as possible. No one knows how long this game can last. perhaps much longer than anyone imagines, but it can also come to a jarring end on any given week, without notice.
-Austerity is a dangerous game, and can in and of itself lead to a situation that triggers a debt default/severe instability by hitting the economic brake pedal to hard.
No one knows how much is “too much debt” to trigger default. It varies on the specific conditions.
It is important to consider all debt, such as Student loan debt. In the US- “There are 45 million borrowers who collectively owe nearly $1.6 trillion in student loan debt. In the U.S. Student loan debt is now the second highest consumer debt category – behind only mortgage debt”
Energy funding is debt based. Whether it is offshore oil or shale oil exploration and development, hydroelectric or nuclear power plants building, or solar/wind deployment. A broken credit system will not allow energy development- the lack of funding would slow development to a trickle while oil depletion never sleeps.
Hickory,
In a financial crisis the problems are caused by too little credit, rather than too much. At the World level there is not really a problem at present the World debt to GDP level is about 245% for the most recent quarter reported (2020Q1). In 2002 it was about 210%, most of the change has been better access to credit for emerging market economies, that’s a good thing it tends to result in a higher rate of growth in real GDP for those nations.
Japan has had debt to GDP % above 300 since 1998, currently they are over 382%, that level is likely to be a problem, but for the World anything under 300 is probably fine.
See link below where I got the data for the chart below
https://www.bis.org/statistics/totcredit.htm?m=6%7C380%7C669
Public and private debt in the USA now up to about 340% of GDP.
https://www.imf.org/external/datamapper/profile/USA
Is that sustainable, and if growth of GDP is below expectations?
Lets acknowledge that fiscal discipline is not part of the equation in this country, and will not be indefinitely, under either party.
The severe mishandling of the pandemic at the federal level, and the resultant economic repercussions have served to accelerate the longterm debt instability scenario. At some point default will be seen as the least poisonous pill to swallow.
Hickory,
BIS is called the central banker’s bank. They report for the US that credit to the non financial sector for all sectors of the US economy at the end of 2020 quarter one was 265% of GDP, for a household applying for a mortgage the rule of thumb used is 300% debt to income ratio, note that GDP is essentially income at the national level. The debt to GDP % for the US has been above 240% since 2008.
Also consider Switzerland, known for its conservative bankers, there the Debt to GDP for all sectors is currently (most recent quarter reported by BIS) at 287% for all sectors (public and private non-financial sector debt) and has been above 230% for all quarters since Q4 of 1995 (first quarter reported is 1995Q4).
The chance of debt default for the US is less than 1 in 1000 in my opinion. Businesses declare bankruptcy all the time, it is a part of capitalism.
The focus should be on non-financial debt, borrowing on margin to buy stocks and other financial instruments is less important than non-financial debt borrowed by private and public entities to buy real goods (cars, houses, factories, machinery, roads, trucks, tractors and other goods.)
Based on the IMF data US public and private non-financial debt is about 281% of GDP, the difference from the BIS data may be that it is 2020Q2 rather than the BIS estimate for 2020Q1.
Understood. I don’t have any expectation the USA Federal government will officially default, since for the foreseeable future it controls the rules of the game. A scheme of relatively gradual currency devaluation will be the goal. The losers will be those relying on fixed or slowly rising incomes/assets.
Other countries, and states, pension funds, companies and individuals are a whole different story. A massive wave of default is far from a remote scenario over the next decade or two.
Bailouts for some, perhaps. If the political mandate for that action is in place.
I am not arguing for austerity. The time for that option is far past, just like the quaint notion of paying down debt during prosperous times.
The best we can hope for is a successful game of kick the can down the road as long as possible. But I doubt that game can be played forever.
side note- one of top candidates for the Treasury Secretary under the Biden administration was a girl I knew as teenager, seen walking with our friends in this photo. I have full confidence in her.
Dennis and Hickory , you are based in USA and I have two legs one is based in the heart of Europe(Brussels) and another one in India ( please do not peek ):-) . There is a major crisis brewing in Europe with Covid . UK is down and out . Besides Covid it has two major problems (1) Brexit which must be finalized by 31st Dec (2) Calls of independence from Scotland and Wales who want to exit GB . This is very strong ( 65%) in Scotland and 56% in Wales . There is now a second lockdown and there could be third . Link posted below . As I write there are no hospital beds now available in Germany and in Belgium. All is lockdown till 2nd December in the major economies of Europe . Will they open on 2nd Dec ? All govt’s have said we will review the situation . So probably goodbye to Christmas sales . I will post again on this in the end of Jan/Feb 2021 when the data comes thru for business bankruptcies . In my discussion with HHH , I have mentioned that BOE has said that they can do QE only till April/ June 2021 . UK will have to access the bond market but must pay higher interest rates or declare default . If UK offers higher rates then so must others . This is the Achilles heel . Another hole in the dyke is Australia . 40% of its exports are to China . They have picked up a fight with Beijing . Beijing imposed blockages (unofficial) on $ 20 billion of exports . Canberra like London is printing money like crazy to keep up the façade that all is good . So what about the Euro ? I wish I knew . Italy with 12 quarters of negative growth is selling debt at negative interest rates . Spain, Portugal , Greece are in the same boat . I see a crisis starting in the currency markets in 2021 which will contaminate the commodity market , stocks ,derivates etc. 2021 will decide who is the ” last man standing ”
https://www.reuters.com/article/us-health-coronavirus-who-envoy/who-covid-envoy-fears-third-wave-calls-europe-response-incomplete-idUSKBN28206N
Last but not least let us not forget the Euro dollar on which as HHH has explained the FED has no control . The guns are loaded, what will be the trigger ? I don’t know .
Hickory,
A bit of debt is fine, as is a bit of inflation, people who assume that inflation will stop when they retire are poor planners, inflation has been fairly subdued for quite a while in the US. Since 1990 the average annual rate of inflation in the US was 2.28%, for the past 10 years it has been lower at about 1.6% per year.
You are confusing the federal budget deficit with the balance of trade deficit.
Hole in Head
I’m aware the U.S. is a net importer of oil. But it pays for that oil in it’s own currency.
The financial reset is probably an admission the world needs a debt jubilee.
Hume, I know that , remove the status of the USD as the reserve currency and USof A will be going directly to Nigeria or so in a jiffy . As to the debt jubilee , I don’t know enough to make a comment but there are many problems . My debt is an asset on the balance sheet of my supplier . What are you going to do about the treasury debt that China, Japan, India hold ? Write that off and you have a recipe for war . Not as simple as it seems
Hole in Head,
None of the countries you’ve mentioned can start a war and hope to win. Japan’s economy is wholly dependent on the U.S. and as a consequence won’t grumble about a default. China’s growth is due to America. They’ll flex their economic might but they won’t let slip the dogs of war.
I wonder how many BOPD and MCFPD are being operated in the USA by companies that have filed Chapter 11 BK?
Thanks for the explanation of sensible and latent heat. Learned something today!
Global peak oil production may have already happened in October of 2018 (Will covid-19 delay peak oil? Table 1). It is likely the decline rate will be 6%, increasing exponentially by +0.015% a year (see post “Giant oil field decline rates and peak oil”). So, after 16 years remaining oil production will be just 10% of what it was at the peak.
If peak oil happened in 2018, then CO2 ppm levels may be under 400 by 2100 as existing and much lower emissions of CO2 are absorbed by oceans and land. The IPCC never even modeled peak oil in their dozens of scenarios because they assumed we’d be exponentially increasing our use of fossils until 2400. They never asked geologists what the oil, coal, and natural gas reserves were, assumed we’d use methane hydrates, and many other wrong assumptions.
Meanwhile, all the ignored ecological disasters will become far more obvious. They’re papered over with fossils today. Out of fresh water? Just drill another 1,000 feet down. Eutrophied water? Build a $500 million dollar water treatment plant. Fisheries collapsed? Go to the ends of the earth to capture the remaining schools of fish.
The real threat is declining fossil production, yet climate change gets nearly all the coverage. And I’ve left out quite a few other threats, such as “nuclear war” with 17,900 results since 2016 in scholar.google.com.
From the blog of Alice Friedmann . Is she correct about the decline rate and the result thereof ?
Hole in head,
Fossil fuel peak (oil, coal, and natural gas) in 2030 with reasonable (middle case) estimates of URR for each type of fossil fuel will result in about 1500 Pg C anthropogenic emissions from all sources (including land use change). This is fairly consistent with the IPCC RCP4.5 scenario which projects about 2 to 3 C of warming by 2100 based on AR5 science. More up to date science suggests those estimates may be too low for the potential warming from that level of fossil fuel emissions.
In short, Ms. Friedmann is incorrect.
Dennis , I was referring to this “Global peak oil production may have already happened in October of 2018 (Will covid-19 delay peak oil? Table 1). It is likely the decline rate will be 6%, increasing exponentially by +0.015% a year (see post “Giant oil field decline rates and peak oil”). So, after 16 years remaining oil production will be just 10% of what it was at the peak. ”
What do you think ?
Hole in head,
The decline rate is not likely to be 6% per year. More like 3% per year after 2040 with an undulation plateau from 2018 to 2040.
Dennis , When was the 3% figure first announced ? Was it before Shale or after shale . Shale has a decline rate of 50% in the first year or two . You are aware that I am skeptical about averages and stuff . You have visited the blog of Mike S and must have noted in his latest post that he comments that all future / further investment with OPM (other peoples money) is over . This means no CAPEX, the DUC’s don’t get fracked and so now the question is not only decline rates but actual stoppage of production . In a comment in the last post I had said that refineries and shale oil are now the Achilles heel of PPS (Petroleum Production System) . Most of the additional production since 2010 has been shale . The growth was rapid , from virtually zero to 8 million BOPD in just a period of 8/9 years . The decline will not be the bell shaped curve but I think it will fall sharply ,maybe shark fin, or Seneca . I think 3% is too low a figure . I would accept 5% at the minimum . Agreed none of us have a dipstick to measure this and all we do is go by old data an info provided by EIA and IEA ,both of which have not a very good track record .Your POV .
P.S : In my opinion DUC’s are BS . How many are dry or economical is just firing shots in the dark . I am not banking on them even if prices go higher .
Hole in head,
Mike thinks there will be little investment in tight oil plays at current oil prices, I agree. He also thinks nobody knows future oil prices, I agree on that point as well.
Note that anybody who is in the oil business has a set of expectations for future oil prices that they use to plan ahead, it is a set of assumptions about future oil prices no different from me creating a future oil price scenario, none of these predictions of the future is likely to be correct. It is a guess plain and simple.
For the US I looked at conventional C plus C output for the lower 48 onshore. Tight oil is considered unconventional oil output, that was excluded from the estimate.
The data is below with an exponential trendline shown.
The World scenario is based on a URR of 2950 Gb, with 2800 Gb from conventional and the rest from tight oil and extra heavy oil (oil sands in Canada and Venezuela), Jean Laherrere’s estimate is similar for World URR, what some miss is that basins decline unevenly with rapid decline at first followed by slower decline, the timing of the decline in various basins will not be synchronzed (the odds are exceedingly small that they all begin there decline simultaneously). The only way we see a World decline rate at 5% is either this synchronicity occurs (1% probability or less) or demand crashes as the World transitions to alternatives to oil (this is more probable in my view, perhaps a on in 3 chance this occurs between 2030 and 2050).
Also keep in mind that tight oil is a tiny fraction of World oil resources, perhaps 4% of the total remaining resources.
US L48 onshore conventional chart below
For shale decline scenarios see
https://shaleprofile.com/us-tight-oil-gas-projection/
Enno Peters does excellent analysis, ask Mike Shellman, this is a point we might agree on.
Chart below compares the Oil shock model (excluding extra heavy oil with URR of 80 Gb for World C C URR=2950 Gb) with URR of 2870 Gb with two scenarios by Mr. Laherrere with U=2600 Gb and U=3000 Gb for World C C less extra heavy (XH) oil. JL also shows decline rates of 3.5% and 2.5% per year, about 5 years after peak.
Laherrere’ chart from page 19 of paper (bottom of page) linked below.
https://aspofrance.org/2018/10/03/updated-extrapolation-of-oil-past-production-to-forecast-future-production/
I superimposed my oil shock model on top of his original chart from August 2018.
Chart
the average annual decline rate from 2040 to 2100 is 3.2% per year.
The average field declines by 6%, but new fields are constantly being added, also note that the US conventional L48 onshore output has declined at roughly 3.2% per year from Jan 1970 to August 2020.
A set of Permian scenarios with different oil price assumptions (maximum Brent real price in 2019 US$ per barrel of 50, 62.5, 75, and 87.5). URRs at respective prices scenarios from low to high are 15 Gb, 35 Gb, 50 Gb and 51 Gb. For the low scenario maximum wells completed per month after March 2020 is 320 new wells per month, for the 35 Gb scenario the maximum wells completed per month after March 2020 is 500 new wells per month and for the highest 2 scenarios the maximum number of wells completed is 700 new wells per month. To date the highest average 12 month completion rate was 460 new wells per month (in 2019). The well completion rate doubled from mid 2017 to the end of 2019 (about 2.5 years) the model has the completion rate doubling from 350 to 700 over about 4 years ( jan 2024 to jan 2028).
To date, the average Permian well loses about ten F150s full of cold hard cash for each well. Continued drilling depends on finding additional cash-burning aficionados who enjoy watching cash burn more than actual cash. It is unknown how many such individuals exist worldwide.
Hi Stephen Hren,
At current oil prices that may be correct and few wells should be completed (or only much better than average wells), for the $62.5/bo maximum oil price scenario, wells are completed using cash flow, note how the debt decreases during 2021, remains level from 2022 to 2025 and then decreases from 2025 to 2029 when all debt is paid off. From 2029 to 2035 $150 billion (in 2019 US$) of cumulative net revenue (aka profit) is accumulated. See left axis and solid line in chart below for the URR=35 Gb scenario with the $62.50 maximum price level for Brent Crude (in 2019 $/b).
No chance. Take a look at what’s happened over the last decade with Exxon, the S&P 500 Index, and Tesla. Investing $100 in Exxon in 2010 you would now have about $50; s&p index you’d now have about $330; Tesla you’d now have about $10,000. Now I’m betting that Tesla is likely overpriced, but all the same, how many investors do you think are willing to throw more money at oil companies this decade? What are investors telling you they are interested in? Basically anything but oil companies.
Stephen,
Yes oil companies have been hit hard by low oil prices, the transition will take time so oil prices are likely to rise or oil supply will be inadequate.
I agree that Tesla is overvalued by a huge margin. Note that the scenario above requires little capital from outside investors, the money for new wells comes from free cash flow. The only money that might be needed is a rollover of debt as corporate bonds reach maturity from now through 2029. Currently the prime interest rate (3.25%) is quite low so investors looking for yield may be willing to invest in corporate bonds from well run oil companies. Note that I assume a 7.4% average interest rate for Permian tight oil producer debt in my model, which is a very conservative assumption (I am sure that bonds from majors have far lower interest rates).
Funny you should write that Stephen, as I’m looking to load up on Exxon Mobil stocks.
The net importers of petroleum around the global require cheap oil and gas to keep their economies growing and avert a prolonged recession. The oil producing nations need a higher oil price to cover the cost of production and turn a profit. Exxon Mobil’s share price is roughly $37. This is down from $72 two years ago when many believe global oil production peaked at 84mb/d.
The central planners can only raid the futures markets for so long until oil has to go back to $100 a barrel.
Good luck with that brother. Exxon has more debt than most countries and no realistic way to continue financing its dividend. It’s a dead man walking.
For scenarios above I assume new well EUR starts to decrease after Dec 2019, the rate of decrease depends on the number of wells completed each month (more wells completed leads to a larger monthly decrease in new well EUR and fewer wells completed leads to a smaller monthly decrease in new well EUR. Also the scenarios assume the mean estimate by the USGS for Permian basin TRR is correct (that mean estimate is 75 Gb.) Economic assumptions including the price of oil lead to fewer wells completed than the TRR case because not all wells that might technically be completed will be profitable under the oil price scenarios I have created. Note that I agree with those who will point out that I do not know future oil prices, but the scenarios cover a fairly wide range of the infinite number of possibilities, these are but 4 cases out of an infinite set of possible futures.
Oil Price scenarios used for Permian scenarios above in chart below.
Tight Oil Scenarios for US based on $50/b, $62.50/b, and $75/b oil price scenarios in chart above. URR of 31, 60, and 79 Gb from lowest to highest oil price.
Two things I look at right now when concerning the value of the dollar. Those are EUR/USD and USD/JPY. If you back a chart out. Zoom out. Use a monthly chart. Go back to 2014 for the EUR/USD. When the ECB unleashed negative interest rate. Price of oil fell right long with it 2014-2015. The Euro can move the dollars value more so than any other currency.
USD/JPY zoom out on monthly chart. Go back to Oct of 2012. The BOJ does QE that is slightly greater than the FED’s at the time in an economy that is only 1/3 the size of the US economy.
Domino’s. Right now those two trades those two events one from 2014 the other from 2012 are unwinding. Which can very well lead to a much weaker dollar and higher prices for things that are priced in dollars. Like oil.
But here is the only catch. The debt loads in both Europe and Japan have increased since 2014 and 2012. If the exchange rate goes back to where they were in 2014 and 2012. Domino’s fall.
George
With reference to your off topic finish. It Look’s like positive feed back loops have been activated.
https://siberiantimes.com/other/others/news/bubbling-methane-craters-and-super-seeps-is-this-the-worrying-new-face-of-the-undersea-arctic/
LIGHTSTOUT,
Yeah, it seems as if the world has moved its attention to HIGH-TECH GADGETS, POLITICAL CIRCUSES, and FREE DIGITAL MONEY for as far as the eye can see.
However, it does now seem like Mother Nature will have the last laugh.
Regardless, when oil production heads south FOR GOOD, it will take down Coal, Natgas, and the ability to ramp up Renewables, along with it.
Steve
Outstanding work George, yet again.
Perhaps I’ve missed it, but anyone have a projection of reserves of Nat Gas in the GOM?
On a different note-
Ron has said that global peak oil is now a year or two behind us.
This article supports that view, and it develops that view from a report indicating that rapid electrification of transport in China and India (and other such economies of the world) will blunt oil demand.
They are suggesting a flattening of oil demand growth this decade (not falling off a demand cliff).
I think this scenario is likely, considering how quickly the electric vehicle industry has developed in the past years.
By 2025 the vehicle industry is going to look like a different world, even in places that have yet to see much in the way of plug-in vehicles.
https://www.greentechmedia.com/articles/read/rapid-transport-decarbonization-means-weve-probably-passed-peak-oil
This chart indicates the projected rate of adoption of vehicle electrification (which of course includes everything from bikes to trucks, and full EV as well as PHEV’s-plugin hybrids)
Hickory,
The report is encouraging, but I would note the following excerpt from the piece:
But if future transport electrifies, “it basically means that the demand [from transport] is essentially flat, and that therefore removes almost all of the demand growth for oil.”
“It’s a really significant issue,” he added. While aviation and shipping also account for a portion of future oil growth, 92 percent of transportation in emerging economies is road transport.
Bold added by me. So the article does not imply, from my perspective, that oil demand will be flat, only that it will be less than a BAU scenario. I expect demand for oil will continue to slowly rise from the 2019 level (which I expect we will return to by 2023) up to roughly 2030, at that point I expect the World will have reached peak oil supply (2028 to 2032 is my best guess at present) and oil prices will rise to a level where enough demand is destroyed to balance the oil market. From peak supply to 2037 the transition to electrified transport may accelerate due to high oil prices and falling battery costs and by 2037 even falling oil prices might not allow oil demand to match oil supply, the oil market from that point forward will be chronically oversupplied as OPEC+ falls apart and low cost producers compete for oil market share. Expensive oil from tight oil, oil sands (new projects) and new deepwater offshore projects will no longer be viable in the new low oil price scenario (this is where we may get to an oil price of $30/b in 2019$). Unclear how long it takes for this to play out (my oil price scenarios have the oil price reaching $30/bo in 2063, but it could be much sooner, probably not before 2050 in my opinion.) Much will depend on the oil price war that may ensue, perhaps we will even see Hole in head’s expected $28/bo for Brent in 2019$, just 25 years after he expects (if the 2050 guess is correct). Of course he may be correct and I may well be wrong, the future is unknown.
Fair enough.
We come back the relative strength/weakness of the world economy (and thus demand for energy) in this decade being the deciding factor on oil price, and on the rate of electric transport transition.
Hickory,
I agree.
If the World economy does not reach a World real GDP higher than 2019 the 2019 level by 2030, then we may be past peak oil. I think continued population growth and the time needed to realistically replace the 1 billion vehicle World fleet (automobiles), that fleet grew by about 200 million in the 2013 to 2017 period from 800 million in 2013, about 50 million per year on average, if that were to continue we would be at 1.5 billion vehicles in 2027, it will take until 2035 to get to the point that EVs and plugin hybrids an reduce oil demand to less than supply.
Due to population growth it seems highly unlikely that oil demand will remain below the 2019 level beyond 2023, but there are lots of unknown unknowns that may make my guess incorrect.
Hickory , whosoever included India in this report must be living in the Arctic or the Antarctic .
Hickory, regarding GOM gas. Jean Laherrere’s recent GOM assessment also included gas. Se e table below.
The GOM is way past peak on gas production – peak was in the mid 90s or so when it was producing 13-14 bcf/day. Now it is down to 2-3 bcf/day. Deepwater, where about 90% of current production is from is much more of an oil province than the shelf.
The reason for the difference is probably a combination of 2 reasons – the source rocks on the shelf are more gas prone (more terrigenous/land based) and they are also buried deeper. Both of these would tend to result in more gas generation.
Thank you for the info.
Of interest. From experts that know nothing of what oil is. https://spectrum.ieee.org/energy/fossil-fuels/peak-oil-specimen-case-apocalypic-thinking
The writer Vaclav Smil has diarreah of the mouth. He has at least 30 books listed on Amazon on essentially the same topic of transitioning away from fossil fuels (or staying on fossil fuels) , so whatever he has claimed in print will match the observations.
Unfortunately, Bill Gates seems to rely on Smil, and Smil is (as a practical matter) an advocate for fossil fuels: he argues that a transition away from FF will take a very long time. This may be true, but what he doesn’t say is that this is a political choice: FF is inferior to the alternatives, and modern civilization would be better off if it chose to move much more quickly away from FF.
Gates is a fan of his, I know. But as he has written so much, he can play both sides and try to draw as large a readership as possible. His writing on coal production in the UK is appallingly bad — he thinks coal production declined because other fuels became available, LOL it peaked in 1913.
Didn’t the Royal Navy convert from coal to oil in about 1913? IIRC Churchill was Sea Lord, and liked the 20% increase in speed that oil provided. Of course, that made the UK dependent on Iranian oil, which set it (and later the US) up for endless trouble in the ME.
Paul, you said:
It’s so easy to look up the Hubbert Curve for UK peak coal.
Yes, UK coal production has peaked. The question is why? Lot’s of things peak because demand goes away: horses, lead, mercury, Freon. US coal production did not peak due to supply limitations: US coal demand peaked.
Come up with an argument that this isn’t depletion of a finite resource
I already gave you one argument: oil replaced coal for transportation.
Here’s a 2nd: the UK United Mine Workers were extremely aggressive, and the Powers That Be hated them. They were willing to destroy the coal industry to do so, and Margaret Thatcher was the one to do it.
A 3rd argument: UK mine production faced growing price competition from alternatives. Those alternatives included North Sea oil & gas production and imports (coal, wood, natural gas, etc), some of it cheaper due to being non-union.
In the end, what you need to argue for supply-driven Peak Coal is price data: is there a rise in prices around the time that production peaked? I’ve looked for coal price data for this period, and been unable to find it. Have you seen data for this?
————
(PP)
Lots of misinformation here:
Nick G said:
No, it peaked due to it being a finite resource. This is clear if you look at anthracite coal, which is the highest grade, found primarily in PA.
That’s from a document written by the USGS last updated in 1997
https://pubs.usgs.gov/circ/c1147/historical.html
It has not recovered since
BP, now British Petroleum, started off life in 1909 as the Anglo-Persian Oil Company. Persia = Iran of course.
It’s so easy to look up the Hubbert Curve for UK peak coal. Come up with an argument that this isn’t depletion of a finite resource, If plentiful coal was still around, the UK would still be mining for it, instead of importing wood chips from North Carolina to burn.
Paul, you are right on the dot . UK is FUBAR .
In West Virginia they have resorted to blowing up mountaintops to get at the remaining scarce nominally higher-grade coal. They wouldn’t be blowing up mountaintops if the coal was still plentiful in a place such as Pennsylvania.
Well, sadly, blowing up mountain tops is pretty cheap (if you ignore the extraordinary damage they cause) – that’s why they do it.
It’s true that anthracite has peaked in the US (it burns relatively cleanly, so it’s nice for residential heating), but bituminous and sub-bituminous are the primary forms of coal used for electrical generation.
The US has enormous amounts of coal, in places like the Illinois Basin, and Powder River. It’s very, very clear that coal production is falling in the US because consumption is falling even faster (and the industry has had a hard time ramping up exports). Natural gas, wind, and solar are beating the pants off coal.
“ More than 40% of coal produced in the United States comes from 16 mines in the Powder River Basin (PRB), a mining region primarily located in northeast Wyoming and southeast Montana.”
Those mines are now lying underutilized due to low demand:
“Coal mines in the PRB are only using about two-thirds of their productive capacity. Productive capacity refers to the amount of coal that mines could produce each year with their existing equipment. ”
https://www.eia.gov/todayinenergy/detail.php?id=41053
That’s weird: Paul, did you edit my comment?
Did someone hack my handle (Nick G)? And where did the “1st” in my handle pop up from?
Vaclav Smil books are okey. They are pretty dense, and leaves the reader to draw what they want from them; hence not very political at all. He tries to cover everything within energy and that alone is a really challenging task. The best point he makes is the giant challenge it is to transition away from fossil fuels. Still true!
If Bill Gates draws anything from them, then I understand his point of view better. (I am very conflicted about the polarisation republicans/democrates in the US, and find myself drifting from a natural anti-Trump democrat towards sympathising with republicans. I am Norwegian btw).
Yes Longtimber electrical engineers may believe they know everything, but they don’t.
Smil looks at US only (or focuses on that). He also focuses on the symmetry of a simple logistic curve, the logistic is just a simplification, nobody believes output will be symmetrical before and after the peak, future output is obviously unknown.
If we look at World C plus C output less tight oil output and less extra heavy oil, what I call conventional C plus C, there has not been much change in output from 2005 to 2019, the peak was in 2016 at only 1.4% higher than 2005 and 2018 output was below the level of 2005.
tight oil is likely to peak around 2028 to 2032 and may decline steeply after 2035 to 2040, it is unclear if extra heavy oil output could ramp quickly enough to make up for this steep decline (it will be roughly 16 to 20% annual decline rates for tight oil after 2040, some think OPEC or Russia will come to the rescue, they may increase output, but it will be unlikely to prevent a peak in World C C output in the 2028 to 2032 time frame.
I do agree that it may be possible to replace this declining energy contributed by oil by increased natural gas, wind, solar, and perhaps coal output, from a climate change perspective it makes sense to maximize wind, solar, and other non-fossil fuel energy sources as quickly as is feasible.
This what I expect for future conventional (right axis) and non conventional (left axis) World C plus C output. I define unconventional crude plus condensate as extra heavy oil (oil sands from Canada and Venezuela with API gravity less than 10 degrees) and tight oil. Peak for this scenario is 2028 at 84 Mb/d and represents my best guess.
I got a scenario where oil goes to $100 maybe even $150 under a president Biden. If the Dems also get control of the senate. It no secret that Biden plans tax increases on the wealthy. Which will be front run in earnest the minute he is confirmed the winner. You’ll get capital fight where the wealthy get their money outside of the US well before he even gets to office much less before any tax increase is passed.
So we will get price inflation due to a much weaker dollar. FED can’t really raise interests rates to slow down price inflation. So Biden has to double down an increase taxes even more to hold down inflation. Which will cause even more capital fight by the wealthy.
You’ll get capital fight… Which will cause even more capital fight
Why would an increase in income taxes cause capital “fight”?
“tax increases on the wealthy” do not have to be income tax. And, I think he means capital flight, so higher tax on financial wealth that can be transferred overseas and real assets/property/etc. Would sure be fun to look when capital starts to fight..?
It’s true that Warren proposed a wealth tax, but I don’t think there’s any chance of that happening. The closest thing in the US is property (real estate) tax, as buildings & land can’t hop across the border.
Obama raised income taxes on higher brackets very slightly to pay for the Affordable Care Act, and that caused a sh**storm from Republicans. Seems doubtful that Biden will try to do more than a relatively small income tax hike.
HHH,
Doubtful that we will see a weak dollar as you suspect, I also doubt oil prices will go to $100/bo, maybe $75 to $80/bo for Brent in 2019$ by 2030 with roughly a linear rise in the 12 month average Brent price over the next 9 years or roughly a $3/bo average annual increase in the average annual Brent real oil price (in constant 2019$) from 2020 to 2030.
Hi,
I agree. It will be a “tug of war” between too high oil prices and too low oil prices going forward. Too low, the current scenario, will not only subdue future production too much; it will also force a strong reaction among common people to get back to normal consumption and lifestyles. And that will bring prices higher anyway, or break the current “zero interest rate economic system”. The oil producing countries economic well being is also dependent on a surplus to fund states. The agenda to crush oil prices will not go far, but likewise too high prices will crush the current economic system. If printing money is the way forward stating the price of oil in dollars will be futile. How much of the economic pie producers get is more interesting.
Kolbeinth,
Using constant 2019 US$ adjusts for inflation, though exchange rates change depend on the relative economic well being of various nations (or groups of nations when looking at the Euro), excess money supply tends to have little affect on economic output, the excess money sits in the accounts of the wealthy, but has little affect on economic output.
Take a look at velocity of money for the US.
https://fred.stlouisfed.org/series/M2V
The excess money supply in the US has simply reduced the rate that money turns over this is because most of it is sitting idle in bank accounts.
Which is why there are zero or negative nominal interest rates in Europe and Japan.
Alimbiquated,
Monetary policy does not really do the job once interest rates hit zero, also zero and negative rates result in poor capital allocation and an inefficient economy. Europe and Japan should adopt fiscal measures or structural reforms to boost their economies once the pandemic has been resolved, monetary policy is unlikely to be effective.
Dennis you said ” Europe and Japan should adopt fiscal measures or structural reforms to boost their economies once the pandemic has been resolved, monetary policy is unlikely to be effective.”
My response ” If grandma had a moustache with a d**K and b***s , she would be grandpa . ” :-). or on a softer note ” If wishes were horses , beggars would ride . Not going to happen . So the question ? Then what ?
Hole in head,
It is up to individual governments whether to enact fiscal policy to alleviate the suffering of their citizens or not.
I still cannot predict future events. This will always be true.
Hint:
Velocity of money.
What our conservative economists missed, and Volcker finally embraced.
Real inflation (consumer) comes with higher oil prices in my opinion. Especially if it rises fast enough. Which is why the supply situation in the oil market is something to watch.
Latest data on US tight oil output see “tight oil estimates by play” excel data link at page linked below (click on “crude reserves and production”)
https://www.eia.gov/petroleum/data.php#crude
US output fell by 70 kb/d (about 1%) in October 2020, Permian basin tight oil output was 54.5% of US tight oil in October and increased by 19 kb/d from September. Total US tight oil output from Jan 2000 to October 2020 was 18.4 Gb, if no new tight oil wells are completed in the US after October 2020, about 28 Gb of cumulative oil will be produced, so the URR will be at minimum 28 Gb. My $50/bo scenario for Brent real oil prices in 2019$ has US tight oil URR at about 31 Gb, the $62.50/bo scenario has URR of 60 Gb and the $75/bo scenario has a US tight oil URR of 79 Gb. In my opinion the $75/bo oil price scenario is the most reasonable, but clearly future oil prices are unknown.
Projection for tight oil from
https://shaleprofile.com/us-tight-oil-gas-projection/
Supply projection has US tight oil at 6.94 Mb/d in Sept 2020, 5.3 Mb/d in Sept 2021, and 4.90 Mb/d in Sept 2022.
Dennis , are you a mentalist ? I was going to ask this question and you already posted the response . Terrific Now the question ? Will the USA enter the export market to cover the shortfall ? What does that do to the ELM model ? Who will be the on the loosing side ,if the USA decides to import the shortfall ? Interesting thoughts .
P.S : Suggestion , maybe you can participate in AGT as a mentalist . 🙂 . Just joking on a serious blog .
Hole in head,
Keep in mind that OPEC cuts are supposedly 17 Mb/d and Libya is increasing production and Iraq never keeps to its quota, there is plenty of extra output that can be brought to market if oil prices rise, though I would imagine your expectation is that there will be no shortfall because demand will be low due to a slow (or no) economic recovery. Under a scenario that looks like the IMF reference case from Oct 2020, OPEC increases output to balance the oil market, also rising oil prices might increase US tight oil output to 8 or 9 Mb/d.
Also there may be an 800 kb/d drop in GOM output (using Mr. Kaplan’s mid case) over the next 10 years, estimating from chart. I think shortages of oil may become a problem after 2030 and oil prices may spike, OPEC may develop more capacity in anticipation of the shortage, difficult to predict 10 years out.
My own scenarios for US tight oil mostly project about 6200 kb/d to 6500 kb/d in Sept 2022, except the $50/bo maximum real Brent oil price scenario where output is about 5000 kb/d in Sept 2022 and continues to fall beyond that date. Most of my scenarios expect an increase in tight oil completions after Dec 2020 with US tight oil output reaching a low point in Dec 2021 around 6000 kb/d and then recovering to 8000 kb/d or more by 2025 to 2026 (varies by scenario). The 5 scenarios in the chart below all assume a US TRR of 110 Gb and economically recoverable resources (ERR) vary from 29 to 78 Gb. There are two different assumptions for maximum tight oil completions in the Permian basin of 500 new wells per month or 700 new wells per month for the $62.50/b and $75/bo maximum real Brent oil price scenarios (2019 $).
The scenarios with the higher completion rate have a higher peak and higher ERR in each price scenario case.
My opinion is that the $62.50 and $75/bo scenarios are more likely and expect there is about a 50% probability that oil prices will mostly fall between these scenarios from 2022 to 2032, with perhaps a 10% probability that oil prices will be lower that the $62.50 scenario over the 2022 to 2032 period and about a 40% probability they will be above the $75/bo scenario over the 2022 to 2032 period.
None of these grandiose plans are going to get through Congress.
It has become interesting watching how fuel consumption drives Farms, and also the finances of farms could very well be, and might very well be now, the model for oil. They don’t make a profit, often, but they still plant and harvest every single year. It does sound familiar up there in the Bakken.
Indeed, we are probably close to peak industrial agriculture. The future is regenerative agriculture. Fewer inputs.
Yes, and hopefully less damage to the soil as well. There are some pretty radical ideas on how to do this. For example, there are people working on perennial, nitrogen fixing cereals.
But I think a bigger hope in the short term is fake meat, which could result in a massive reduction in animal feed. Ground beef is already wildly available, and ground pork is now being introduced in the Chinese market. The prices are crashing, so in a few years we’ll see how much of a dent they can make.
A new Non-OPEC thread has been posted
http://peakoilbarrel.com/non-opec-july-output-up-by-1-2%
A new Open Thread Non-Petroleum has been posted
http://peakoilbarrel.com/open-thread-non-petroleum-november-24-2020/