The EIA’s Drilling Productivity Report has US shale oil on a steep decline. The below shale oil production charts are the EIA’s estimate of what shale production will look like through January 2016. Keep in mind this is the EIA’s estimate and not hard production numbers.
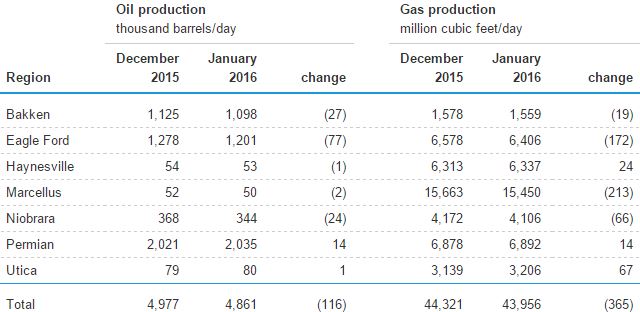
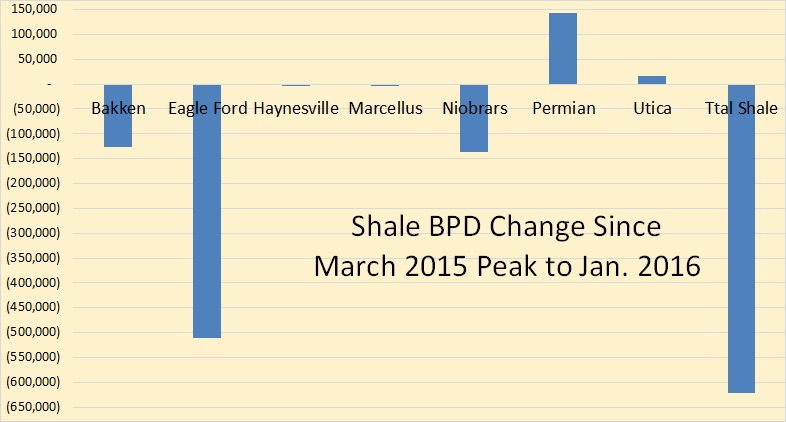
The big drops here are Eagle Ford, Bakken and Niobrara. They have the Permian still increasing in production. An expected drop of 116,000 barrels per day drop in January is very significant.
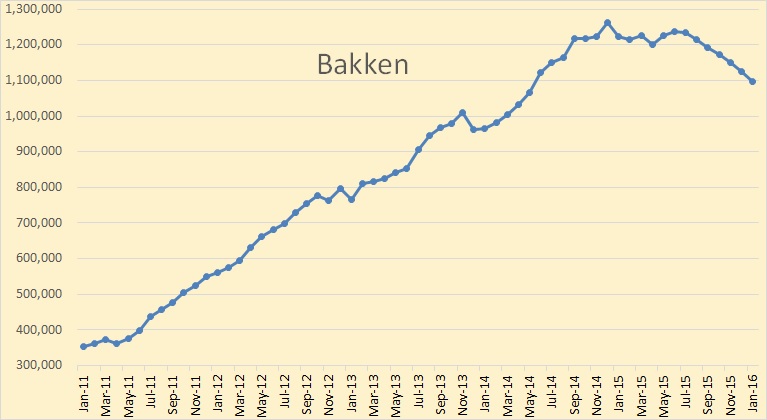
They have the Bakken in a continual decline after July. It is important to note that the EIA’s Drilling Productivity Report has the Bakken decline, July thrugh September, very close to what the North Dakota Industrial Commission has. So it appears that the DPR is getting better with its production estimates.
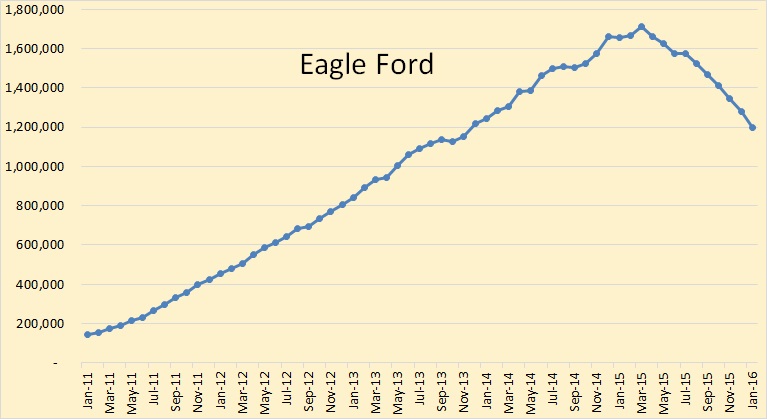
Eagle Ford is where the action is, or isn’t, depending on your point of view. Dropping 77,000 barrels per day to start the New Year does not bode well for shale production in 2016.
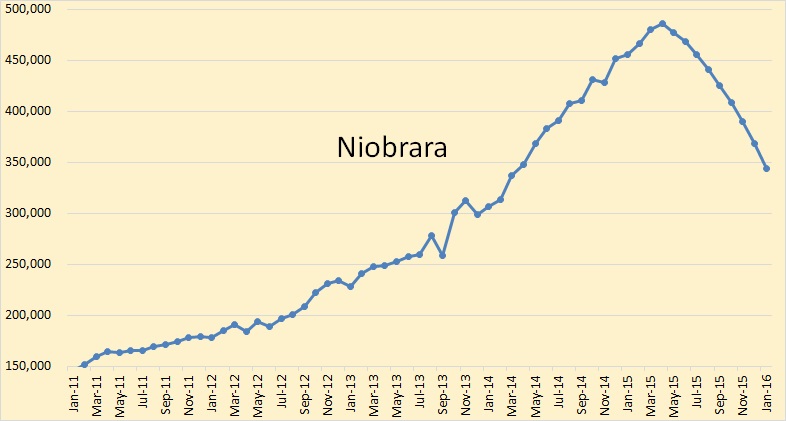
Niobrara appears to have the steepest drop since the March peak. But actually they, if the DPR is correct, will be down 28.37% since March while Eagle Ford is down 29.81%, The Bakken will be down 10.35% while the Permian will be up 7.59%.
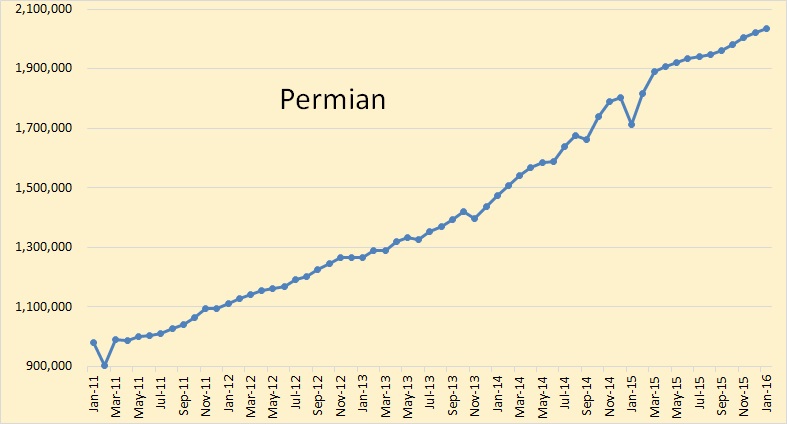
The Permian, which is about half conventional oil, continues to buck the trend and increase production while everyone else is in decline.
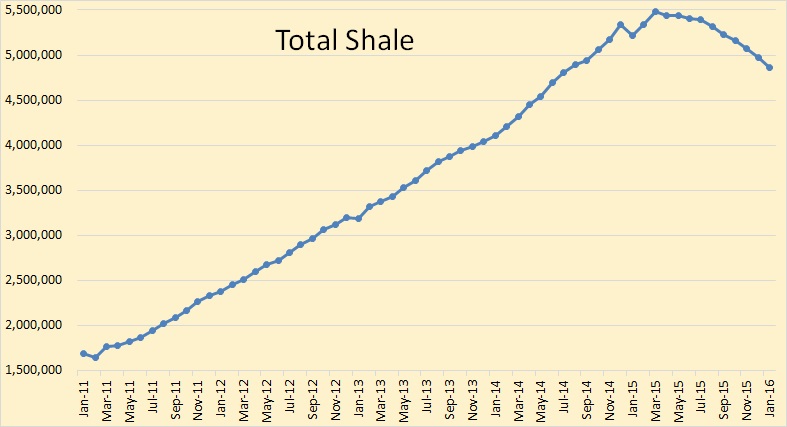
Total for the seven shale areas peaked in March and declined only slightly through July but then heads down in earnest after that. Total Shale, if the DPR is correct, will be down 11.34% March to January.
Total shale, if the DPR is correct, will be down 622,000 barrels per day from the peak in March until January.
The Baker Hughes International Rig Count is out with worldwide rig count numbers for November 2015.
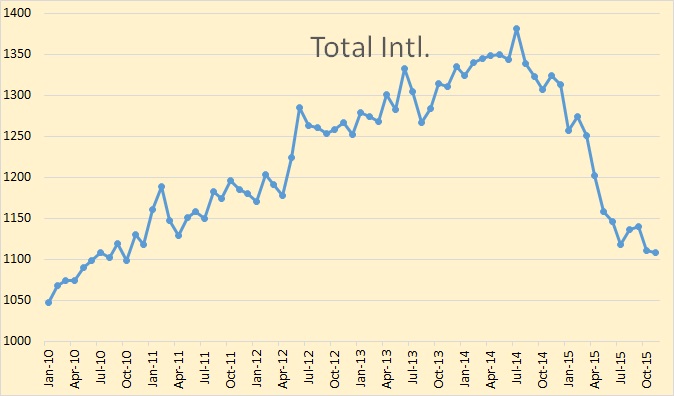
This total international rig count does not include U.S., Canada, on shore China or any of the FSU countries. In November it hit 1109 rigs, both oil and gas, down 273 from a recent high in July 2014.
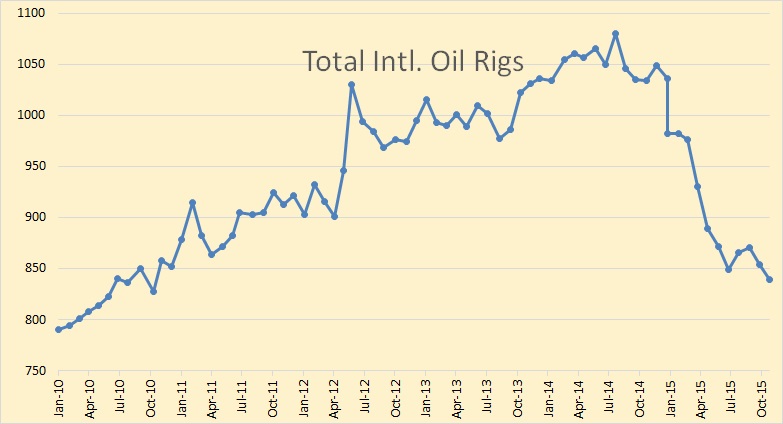
Looking at international oil only rigs gives a very similar picture as does total rigs.
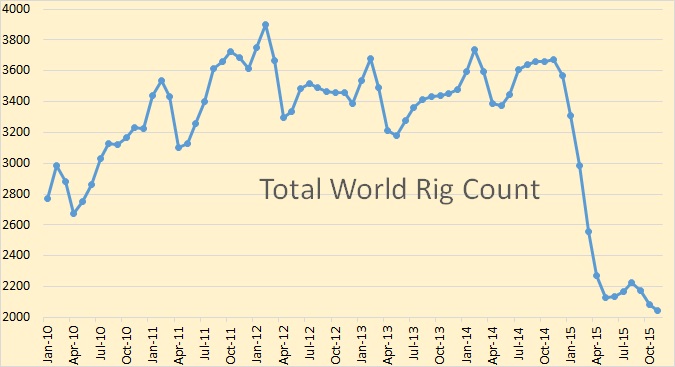
Total world rig count, ex FSU and on shore China, looked like it was heading back up in August but then turned back down and hit a new recent low 2047 rigs in November.
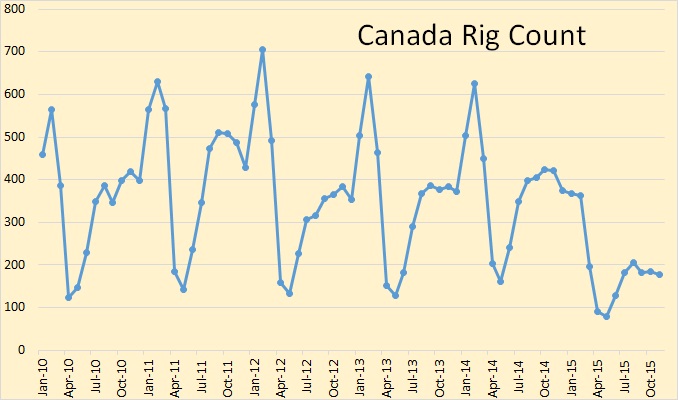
The Canadian rig count is highly seasonal, reaching a high in February and a low in April and May. So it is best to measure Canadian rigs from year to year. In November 2014 Canadian rigs stood at 421. This November they were at 178, down 243 rigs or 58%.
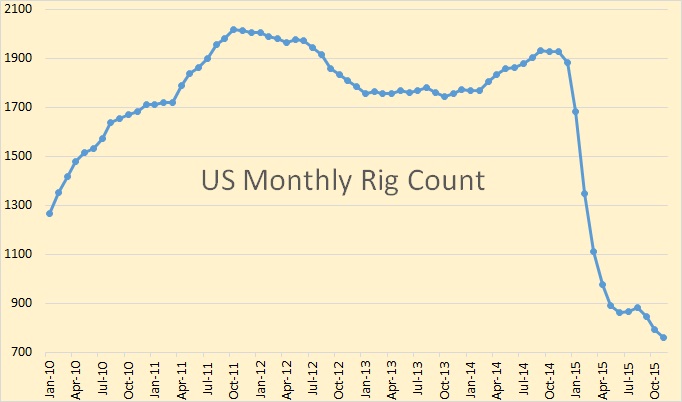
US total oil and gas rigs stood at 760 in November, down 31 rigs on the month.
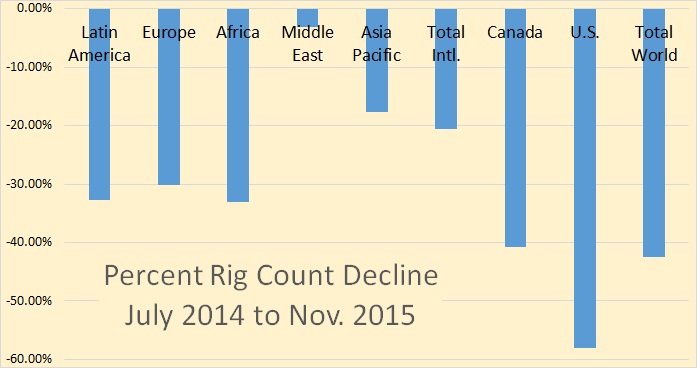
Here I have measured the percent change in rigs from the International high in July of 2014. Note that everyone has suffered heavy attrition in rigs except the Middle East which is down only slightly.
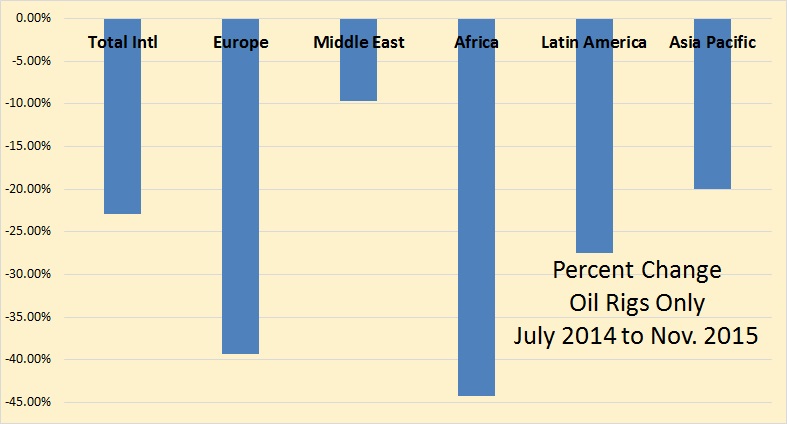
Here we have international percent change of oil rigs only. The Middle East still loses the least percentage and Africa the most.
Below Percent Oil Rig Change for Major Producers, July 2014 to November 2015.
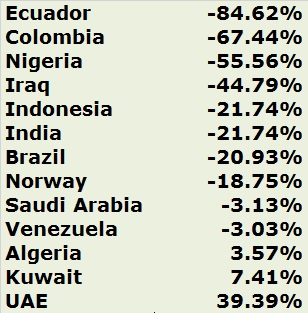
Percent oil rig changes were all over the map. Here I have listed the some changes from major producers, largest decline to largest increase. Iran showed no rigs so no change. This is oil rigs only.
My conclusion from all this, the Drilling Productivity Report as well as the Baker Hughes rig count, is that we are in for a big production drop in 2016. Prices will increase but it will take years before major producers are back up to full speed. And then production will still be well below 2015 production levels.
___________________________________________
I send an email notice whenever I put up a new post. If you would like to be added to that list then email me at DarwinianOne at Gmail.com
237 responses to “EIA Says Shale Continues to Decline”
Geopolitics seems to be a completely forgotten factor in oil price at the moment. Iran already defying their nuclear pact and Syria being armed with Russian ABM’s now announcing intent to shoot down allied F-16’s.
Syria has very little oil and if Syria does shoot down an allied plane then what?
I do not see the UK or France or the United States invading Syria in retaliation. At the moment the big story is OPEC meeting collapsing so no production cap. Iran is getting ready to supply the world with another half a million to a million barrels of oil per day, which it will do over 2016.
http://www.wsj.com/articles/iran-expects-oil-exports-to-start-rising-as-early-as-late-november-1443115364
Turkey has the possiblity of broading the war. Turkey has invaded Iraq (late last week)and the Iraqi gov’t has asked Russia to intervene (yesterday) on its behalf. Odds favor that the Syrian proxy war morphs into a hot war with KSA and IRAN battling each other. Almost every week there seems to be an event that escalates the conflict.
Iran has a few nukes (Pakastan/FSU black market and make have enough for a one or two bombs from its enrichment projects), so does KSA (Pakastan), and Israel. It may not take much for nuke to start flying in the Middle East. The US and the EU have done nothing but exacerbate the problem. Even if nukes do not get used, it would not take very much convention warfare between KSA and IRAN to distruption ME oil production, and draw in Western powers.
I am sure that when WW3 does begin, it will start in the Middle East.
Hi TechGuy
Everything you have said is certainly within the realms of possibility.
I had not heard that Iraq had asked Russia to intervene with regards to Turkish violation of it’s territory.
I think if Russia did bomb Turkish troops inside Iraq then turkey would withdraw them. There is little prospect of any NATO country backing the Idiot Turks if they go invading another country.
However as you say there are so many opportunities for escalation of violence in the land of the religion of peace.
ISIS want to ferment as much hate and violence as possible, which is really not hard.
At the moment Iran and Iraq are holding off ISIS, with the help of the Kurds and Syrian government forces attacking from their sides.
I only see Saudi Arabia getting far more involved if ISIS blows up a large Saudi oil installation or something of equal importance.
One thing is for sure WW3 will start in the Middle east, exactly how things escalate I am not sure.
Why do you think ISIS would attack Saudi Arabia interests?
You do not bite the hand that feeds you.
Saudi Arabia is the biggest promoter of world terrorism, the biggest buyer of small arms, the biggest threat to regional stability and the biggest impediment to Middle East peace. There is nothing right about that country.
Javier
Saudi Arabia are the biggest sponsors of extremism but ISIS are like a new mafia mob that want to muscle in on the action.
http://www.theguardian.com/world/2015/aug/06/suicide-bomber-attacks-mosque-in-saudi-arabia
Angela Merkel’s deputy accuses Saudi Arabia of sponsoring extremism
Vice Chancellor Sigmar Gabriel told the German newspaper Bild am Sonntag Sunday that it should be made clear to the kingdom that “the time for looking the other way has passed”….
Gabriel’s comments come after the German intelligence agency BND warned of the destabilizing role of Saudi Arabia in the Middle East in a memo shared in the German media last Wednesday.
http://edition.cnn.com/2015/12/08/world/germany-saudi-extremism/index.html
Unfortunately Angela got lost in official narrative. One day paying off 3 billion to Erdogan for his blackmail and the next day accusing SA for exactly same thing. The fire is getting closer to the core and consequences of sleeping with the devil are getting real. She should ask Monsieur Holland about that. All the attention this weekend was on election in Venezuela but the game changer elections were regional elections in France. Nobody is paying attention but the clouds are gathering.
Javier Wrote:
Why do you think ISIS would attack Saudi Arabia interests?
ISIS is very much a rabid dog terriorist group. What happens if KSA cuts off the money? KSA may become an easier target to start a Calphate then Syria and Iraq as Russia now engages them. I can’t say with any certainty that ISIS will go after KSA, but nor can it be excluded.
There is also a risk that of a coup in KSA as not to many people are happy that the King is replacing high level gov’t officials with his family members, a coup could draw in ISIS. I posted an news article about this here a few weeks ago. If a coup does happen in KSA its going to draw in ISIS fighters and probably Al Quada, houthis, etc
Peter Wrote:
“I think if Russia did bomb Turkish troops inside Iraq then turkey would withdraw them. There is little prospect of any NATO country backing the Idiot Turks if they go invading another country.”
I don’t think Turkey will draw in NATO, but I fear that once the proxy war in Syria is lost by KSA, that KSA might start engaging Iran directly. Consider that KSA is also fighting a proxy war in Yemen as Iran is trying to create a lot of chaos in the Arabian peninsula. If KSA starts losing all its proxy wars, I don’t it will sit by and do nothing. At some point KSA might just go full blown berzerk.
I think if the KSA/Iran (aka Sunni vs Shia) proxy war switch to direct confrontation, it will draw in NATO and perhaps China and Russia, once oil exports from the ME are impacted. Consider that NATO and Russia both now have substantial military assets in the Middle east, fighting on different sides of an expanding proxy war, its not a far stretch that it can escalate. Russia also has been dealt a coup in Ukraine, initiated and backed up by NATO.
Once a hot-war between KSA and Iran starts there will likely be a some nukes flying about. You have Iran, KSA, Israel that all posses a few nukes. In the process, its likely to take out NATO and Russia troops. It a very fluid situation its very easy for mistakes to be made draw in nuclear assets of NATO, Russia, Pakastan, India, China, and Europe.
IHS estimate of ISIS revenues:
IHS: Oil sales 43% of Islamic State revenue
http://www.ogj.com/articles/2015/12/ihs-oil-sales-43-of-islamic-state-revenue.html
Islamic State, the jihadist occupier of parts of Syria and Iraq, makes 43% of its $80 million/month revenue from illicit sales of oil, estimates the monthly Conflict Monitor at IHS Aerospace, Defense, and Security.
The firm based its estimate for late 2015 on open-source intelligence, including social media.
“Unlike Al-Qaeda, the Islamic State has not been dependent on money from foreign donors to avoid leaving it vulnerable to their influence,” said Columb Strack, senior IHS analyst and lead analyst for IHS Conflict Monitor.
The group has at least six main sources of revenue: production and smuggling of oil and gas; taxation of the profits of all commercial activities in areas under its control; confiscation of land and properties; trafficking of drugs and antiquities; criminal activities such as bank robbery and kidnap for ransom; and state-run businesses, such as running small enterprises that include transport companies and real estate agencies.
“According to information gathered from Arabic-language social media and our in-country source network, efforts to target the Islamic States sources of revenue are paying off,” Strack said.
Airstrikes by US-led coalition forces have focused on disrupting the Islamic state’s oil income. IHS said the attacks have “significantly degraded” the group’s refining capacity and oil transport capability.
“Although the Islamic State retains its capacity to produce oil, its loss of easy access to Turkey after its defeat at Tal Abyad and the efforts by Turkish authorities to stop smuggling activities along its border with Syria have gradually forced the group to rely increasingly on the internal markets in Syria and Iraq to smuggle and sell its oil,” it said.
Yes, I read that ISIS is doing the refining at fires in private courtyards within villages to avoid bombings. Obviously this greatly affects the quality of the refining, damaging prices.
TechGuy,
“You have Iran, KSA, Israel that all posses [sic] a few nukes…”
Iran and KSA have nukes? Can you quote a source for this?
KSA:
http://nypost.com/2015/05/17/saudi-arabia-to-buy-nuclear-bombs-from-pakistan-report/
Iran very likely smuggled a couple of nukes when the Soviet Union collapsed in 1989. There are articles about this about 10 years ago. I used to have an Washington DC inside contact who also also mentioned it. Iran also has two enrichment factories. I have no idea how much weapons grade material they now have. I would imagine they have enough for at least a few small bombs by now. They been enriching Uranium for over ten years now. Iran has had a covert Nuclear weapon program for decades. Iran also has a very active Ballistic missile program.
T G,
Thanks.
This from RT news:
https://www.rt.com/news/325070-turkey-iraq-troops-crossing/
Russia attacked targets by launching missles from a submarine stationed in the Mediterranean Sea.
http://www.dw.com/en/russia-launches-attacks-on-syria-targets-from-submarine/a-18903123
Any hard information concerning missing USSR ( Russian ) nukes would be appreciated. Ditto Iranian possession of the same.
Links to articles in well known papers or magazines etc.
On December 2, Russia’s Deputy Minister of Defense Anatoly Antonov made a strong statement about Turkish complicity with ISIS. The charge sheet is long and detailed. It mentions many aspects, but the most incendiary is the accusation about “ISIS oil.”
ISIS controls Iraqi oil fields near Mosul. They have been making millions of dollars each day by selling oil from these fields. How does ISIS get the oil from the fields in Mosul to the market?
What ISIS has done is to use the old networks that have smuggled oil from the Kurdish Regional Government without any consideration given to Baghdad’s sovereignty over that oil. This had been a point of contention for decades, since the Kurdish region began to exercise autonomous control of the north. Kurdish oil was sold to smugglers who would cart them in tankers across the border into Turkey. In Turkey the trucks would run the length of the country to the Mediterranean port of Ceyhan. From Ceyhan, which is a port run by the Turkish government, the oil is purchased by transporters whose ships go to Malta, where the oil is transshipped to destinations such as Ashdod (Israel). This has long been a bone of contention between the Iraqi government, the Kurdish Regional Government and the Turkish government. It was documented by Tolga TanıŠin his book Potus ve Beyefendi (2015). Tanis accuses Berat Albayrak, son-in-law of Turkish president Recep Tayyip ErdoÄan, of involvement in this illegal scheme. ISIS has merely replaced the Kurdish Regional Government in the new arrangement.
“where the oil is transshipped to destinations such as Ashdod (Israel).”
are you kidding me?
http://www.opednews.com/articles/ISIS-Oil-by-Vijay-Prashad-Isis_Putin_Smuggling_Syria-151207-747.html
That makes sense.
https://en.wikipedia.org/wiki/Baku%E2%80%93Tbilisi%E2%80%93Ceyhan_pipeline
https://en.wikipedia.org/wiki/Trans-Israel_pipeline
All the oil transportation infrastructure is already there.
Large increase in Kurdish oil exports is another reason oil prices have been falling.
http://www.reuters.com/article/us-russia-oil-hungary-idUSKCN0S12TF20151007
Although ISIS is profiting from Iraqi oil, it is also undermining the country’s oil production:
How ISIS Is Undermining Iraq’s Oil Production Potential
December 1, 2015
http://oilpro.com/post/20528/isis-undermining-iraq-oil-production-potential
ISIS’s activities could place at least 1.5 million barrels per day of potential Iraqi oil output at risk between now and 2020. Three primary factors are at play: (1) physical threats to oil exploration and production operations; (2) sectarian splits within Iraq and (3) outside powers’ unwillingness to fully engage ISIS and root the group out of its strongholds in Iraq and Syria.
Oil Market Implications
Iraq’s Oil Ministry seeks to have the country pumping 6 million barrels per day (“bpd”) by 2020, but analysts at Barclays believe the country’s output will fall 1.5 million bpd short of that official target. The recent deterioration in Iraq’s security environment—both domestically and in adjacent areas of Syria and Turkey—suggests Barclays’ forecast is on the right track and might even be a bit optimistic.
I have said the exact same thing on this blog several times before. But let me expand on this issue some more. The oil production capacity of at least these five countries is artificially suppressed by the still dominant NATO-GCC alliance: a) Russia, b) Iran, c) Iraq, d) Kazakhstan and e) Venezuela.
To be clear, I am not moralizing here, but I am merely saying that the NATO-GCC alliance sees fit to exclude those countries from fully participating in the global market-place on equal terms. It’s good old Real-politik.
The suppressed oil production from these regions, has allowed western oil majors, as well as much more numerous but smaller US shale drillers to increase their own production of quite marginal oil & gas deposits in the US shale patch, the Canadian tar sands, in several deep-offshore sites around the globe etc…
This is at least 50% why the above countries are allied with each other and against the NATO-GCC Empire.
Why is Syria a hotspot?
Peel back the onion:
http://www.alternet.org/world/why-yria-crucial-energy-future-mideast
Happy Daze
Yeah, I was off on the Permian, but I expect it to drop more in 2016 than what EIA anticipates. What has delayed everything some is the hedges oil companies used in 2015. That is pretty much gone in November. Another factor was that the companies had to keep drilling in some areas to hold valuable lease area. Most of that is covered now, with 180 days in between completions, creating more of a drop.
You are spot on that it will take years to ramp back up. Investment money and loans will be pretty scared for awhile, and that will create more of a time lag. What it depicts to me is that EIA and IEA are, once again, pretty off on future projections.
Guy Minton said:
They’re completing some real barn burners in the Permian Basin.
This is a production curve for a well Henry Resources just completed in the section north of a property of mine. In the third month of production, the well produced almost 1200 BOPD and 1 MMCFGPD.
Our lease is with EOG, fortunately for us. In southwest Atascosa. First well looks like it will get about 160k the first year, which would be great if prices were higher. Marginal at 40. They won’t go crazy drilling at that price, but keep it at the 180 day continuous drilling clause. That’s perfect with me. Wait until better prices for the majority.
What is the cost of drilling these in the Permian?
This from Pioneer’s December investment presentation.
Guy,
I took a quick look at EOG’s Eagle Ford shale production in Atascosa county, and yep, it looks pretty dismal.
EOG operates a total of 151 leases in Atascosa county.
Average daily lease production for September, 2015: 148 BOPD and 110 MCFGPD
First production was in December, 2010. Through September 2015, EOG’s 151 leases have produced a cumulative of 18,538,757 BO and 12,176,939 MCFG.
That’s only an average of 122,773 BO and 80,641 MCFG per lease.
During the first nine months of 2015, out of EOG’s 151 leases, only 7 produced more than 100,000 BO.
EOG Resources’ leases in Atascosa County that produced more than 100,000 during first nine months of 2015
It looks like of the seven leases, the only two that are anything to write home about are the Fallow Unit and the Whitetail.
In both cases it looks like EOG completed one well on each lease in April 2012.
Then EOG went back in and completed three new wells on each lease in February 2015.
These new wells look to be very prolific wells.
The second round of wells completed in February 2015 are starting out much better wells than the first well completed in April 2012.
Same story here.
..
This is the production curve for a unitized property a couple of miles to the south. Concho Resources completed two new horizontal wells on the property in the past year.
Separating the production of the two new horizontal wells from the rest of the unit production is guesswork. But if we estimate a base-line from pre-existing production of 65,000 BO and 150 MMCFG per month, then it looks like the two new horizontal wells have produced about 330,000 BO and 0.8 BCFG in their first 8 months of production.
That’s nothing to sneeze at, but it still probably doesn’t cut it at $37/barrel oil and $2/mcf gas.
Oil Production Vital Statistics November 2015
Ron, this post already plastered all over the internet. “World total liquids production up 240,000 bpd to 97.09 Mbpd, a new record high.”
I note Permian still rising.
There is a bearish flag pattern that has yet to resolve that implies a WTI target in the mid-$20s.
But $37 is critical support with a stop at $29.
Euan, the EIA’s Short Term Energy Outlook, and Art Berman, seems to disagree with what I assume is IEA data.
Ron, correct, I am reporting IEA data. I stopped following the EIA since they fell so far behind. But my last month for IEA is October and so I’m surprised to see EIA bang up to date with November data. The pattern of IEA data revisions also complicates matters.
The bottom line is that after a year of oil price crash, total liquids production is still up there at 96 / 97 Mbpd.
From Art’s chart I note there is a 5 month lag from supply surplus to price collapse. Can we expect same when the supply / demand lines cross? We have God knows how much oil in storage and the prospect of Iran coming back with full exports. I find it hard to see short term hope. And when the market does rebalance, which it will do, I’m unsure how the price will react. I’m unsure if the rules of the past will apply. This comes down to understanding elasticity. 1000 idle rigs…..
Hi Euan,
I would think it would be 5 to 10 months after consumption rises above supply that we will see oil prices start to move. To make things simple if we assume consumption is 1 Mb/d higher than supply and storage levels are 300 Mb above normal. it would take 10 months foe supply to fall back to normal levels. I think when storage levels fall to 150 Mb above “normal” levels we might see prices start to rise, but somewhere between 5 to 10 months after consumption rises to 1 Mb/d above supply seems reasonable.
As to when either supply falls (or consumption rises) so that storage levels decrease, I would think first or second quarter of 2016 with oil prices starting to rise in the 3rd or 4th quarter of 2016. My guesses are usually not very good on oil prices.
Dennis, the IEA sees supply ahead of demand for whole of 2016, without Iran. So I dare say / fear that we don’t see a proper rally in price until 2017.
Thanks Euan,
My guess is that the IEA will be a little on the optimistic side with their supply forecast, they usually are. Does their supply forecast seem reasonable to you? I haven’t looked at it closely.
If the world slides into a recession so that demand growth is very slow, then 2017 is a good bet, I may be more optimistic on economic growth of 3% continuing in line with the IMF forecast.
DPR is right lool
Bakken September 2015 : 1,06 mbj
DPR December 2015 : 1,125 mbj
Etc…
Isn’t there a seasonal effect that has to be deducted?
Don’t know how this got here. Refers to the post itself about Dec – January declines expected.
ND, TX, and LA economic indicators:
https://research.stlouisfed.org/fred2/graph/fredgraph.png?g=2R6J
https://research.stlouisfed.org/fred2/graph/fredgraph.png?g=2Ln6
https://research.stlouisfed.org/fred2/graph/fredgraph.png?g=2R7N
Employment:
https://research.stlouisfed.org/fred2/graph/fredgraph.png?g=2R7T
What is in steep decline is the price of oil company stocks and some are shark fin shaped.
WLL, Whiting Petroleum, is at 12.44 today and losing 13.18 per share.
No more wondering what is happening.
I sold an oil sector stock yesterday and am very glad I did.
All of the worry is gone. The hand wringing is over, what a relief.
It is going to be a record high temperature today and is going to be another one tomorrow. The temp will be 50° F. The record low is – 29 ° F.
Maybe Whiting Petroleum picked the wrong shale play to bet on?
Compare WLL to this.
Or this.
Sure, there are always a couple of winners in the crowd no matter what the business. A couple of flukes.
Across the board, the equities in the oil sector have suffered price drops, losses due to the low price of oil. It is a sea of red. Time for more beer.
Whiting has two trusts, WHZ, which gained a few pennies yesterday, had a high of 8.47 usd, currently at $0.965. The other is WHXT, which is worth 6 cents per share. Net profit interest, a royalty, more or less.
Off topic but I am interested in being able to look up record highs and lows by date and zip code if there is a relatively simple and free way to do so.
Any pointers will be greatly appreciated and thanks in advance.
http://weather.org/weatherorg_records_and_averages.htm
AccuWeather. They don’t call it AccuWeather for nothing. A lot of work has been done to call it AccuWeather.
Type in the zip code at the search, the daily weather stats for the city will be on a the web page, click on the current conditions, there will be a daily almanac for that date. It will have the historical data on the page, the highs and lows for the day.
AccuWeather for Chicago, Illinois:
http://www.accuweather.com/en/us/chicago-il/60608/weather-forecast/348308
Chevron CEO: Oil prices will be higher in a year
http://www.cnbc.com/2015/12/08/chevron-ceo-oil-prices-will-be-higher-in-a-year.html
CE, it’s hilarious over at Gail’s site. Most there really think the price of oil will ‘never’ go higher again, but can only permanently go lower from here due to end game dynamics which have nothing to do with supply & demand – lol.
I put my prediction on that site of $70-80 a barrel in the latter half of 2016. It was ignored but at least they got a different viewpoint.
I don’t share Gail’s view of permanently depressed prices, but I don’t think you should laugh about it. I bet you would have laugh at anybody saying in 2013 that prices were going to do what they have done. Truth is nobody can predict future oil price. Not even producers.
Javier,
Gail and those douches at the automatic earth. Every year, every month, every day, predicting lower oil prices, deflation and collapse, does not make them remotely right when things go their way for a short time. They have been predicting this since 2006 at least. I actually remember having a conversation where I said stocks should be bought in 2008 and Raul said I was an idiot.
We will be at $90 in 18 months. And then Raul Illargi Miejer and Gail will have a great explanation why the end of the world is delayed for yet another 15 years.
I don’t believe that for a moment. But I am sure that in 18 months you will have a great explanation why $90 is delayed for yet another 12 months.
I tell u what….you choose your price, I will choose mine. We see where it lands.
And we can ask Gail to explain what the 40 Million additional cars each year on the roads will run on.
http://ourfiniteworld.com/2015/11/23/why-supply-and-demand-doesnt-work-for-oil/
Only the Chinese cars matter. US car sales likely roll an old one off the back end of the inventory onto the scrap heap. So US car sales, huge though they are, aren’t all new consumption.
No reason the price can’t stay low even with increased consumption. See the predatory pricing wiki.
Oh and btw, you don’t get to pick the time frame that defines what or who is right. The time frame for right is always now.
That is 40 million NEW NET cars.
Total global sales are expected to be 100 Million. 60-65 Million being scrap replacement.
So Global fleet expands by 4% a year from a base of 1 Billion. It is like depletion. Only in reverse :).
And if you saying someone can be wrong all the time and eventually, once, unlike even a stopped watch being right twice a day, by luck have a couple of things right, and you “buy” it. Well then you deserve what you get when you listen to such people. Good Luck!
If those 100M new cars were 40% more efficient than the 60M (20yo) cars they replace, then there would be no net increase in fuel consumption per mile driven.
Not that new cars are that efficient. If people only bought the smallest, least powerful vehicle they actually needed to get from A to B, they would be, and probably even more so.
See the predatory pricing wiki.
Yeah, it was a little unclear. So, I edited it to clarify that this is a very short-term strategy. Prices below the equilibrium point cannot be sustained indefinitely.
Hi Huckleberry Finn, NickG, Stiglar Wilcox, and Chief Engineer,
When Huck says:
We will be at $90 in 18 months.
Would you interpret that as $90/barrel exactly some time during June 2017?
I tend to think Huck meant the oil price will be $90 or higher sometime between now and 18 months from now.
As in the oil price will be at least $90/b within 18 months.
That makes sense.
Hi Dennis,
I understood it to mean that it would make the $85 to $95 range in the May to July time period. I wouldn’t hold his feet to the fire to be any more precise and call him correct within this range.
Stiglar was up a little late last night with Fast Eddy over at Tverberg’s cheating on Ron. He might be a little slow to respond.
You still don’t understand. Doesn’t matter what price you pick. You can only be right by luck, not by foresight. If we do this with enough monkeys one of them will be right and will claim superior abilities.
I work by scenarios and probabilities like many here. Right now we are at the edge of global recession, and if it comes to take place prices are likely to be depressed for a couple of years. If we don’t enter a recession, deflationary forces are going to continue being a strong head wind for oil prices meaning that even if prices recover, near 100 $/b are going to be difficult to achieve unless we get an oil crunch due to important production destruction or major war.
Whatever price you choose it is subject to so many unknown variables as to give a chance similar to picking a number at the roulette. My safest bet is to bet against you.
Go ahead then I pick $85-$95 in June 2017.
I pick inflation accelerating at this point when everyone is looking for deflation.
I pick Gail and Douchus Maximus at TAE saying saying that they are just really early (will be 9 years and counting at that point) not wrong.
Good luck with that then. You are more likely to be wrong than right, but if by chance you happen to be right you are going to feel good and smart. If you want to put your money where your mouth is you have oil futures.
Hi Stilgar,
Thanks for the heads up and thinking of me. An hour ago, Fast Eddy has the Europeans helicoptering money to head off a collapse by Christmas.
I see a 2016 peak in late June or July in the $60 to $70 range. By the Summer of 2017, $90 range is perfectly possible.
Now, I’m hoping oil bottoms around mid January, so that I can fund my 2016 Roth with some real bargains.
Javier – ” Truth is nobody can predict future oil price. ”
Anybody can predict the future. Now getting it right is a little more difficult. Let’s see what story Gail comes up with when the price recovers.
“Fast Eddy has the Europeans helicoptering money to head off a collapse by Christmas.”
Yeah CE, FE holds court over there and the minions line up behind on the idea of near term collapse. I don’t know how he keeps up that kind of tension level.
“I see a 2016 peak in late June or July in the $60 to $70 range. By the Summer of 2017, $90 range is perfectly possible.”
That’s a good prediction too.
See Javier, another prediction.
It is really strange that people can keep that level of tension up over years. I think people wise up, leave and are replaced by new fools.
I find it fitting that the two worst predictors in the blogosphere, Ilargi and Stoneleigh, have to ask for handouts to keep their site running. Makes total sense you would take predictions from idiots who cannot make a few dollars a month to run a website.
Some people pay themselves a salary to run a non profit.
Running a non profit can be QUITE profitable.
Oil price predictions are very common. Every guru and adviser has one. There is even a market consensus. Nobody does a track record, but if they did they would discover is pretty abysmal. Consensus is almost always wrong because for markets to work as intended only a minority has to get them right.
Hi Javier,
Interesting, you say nobody knows what oil prices will be. Then you imply that you know oil prices will not be higher than $89/b, 18 months from now. Which is it?
I get it, only you know what the oil price will be 🙂
You should go to Gail and TAE for some amazing low price porn.
Dennis,
You are back to your old tactic of saying what other people imply when they write, as if you could possibly know that.
Huckleberry Finn said “We will be at $90 in 18 months.” Not over $90. The difference between these two prepositions in English should be clear to you as it is your language.
And I said “I don’t believe that for a moment.”
And now come your strawman interpretation: “you imply that you know oil prices will not be higher than $89/b, 18 months from now.”
What I posted a few days ago was: “High volatility scenario with big price swings as mismatches in production and demand take place due to alternate production destruction and demand destruction cycles in an economy that is contracting in bouts. This is my predicted scenario.”
http://peakoilbarrel.com/oil-forecast-from-a-reputable-firm/comment-page-1/#comment-549332
It is clear that you are looking for excuses in every post that I write to attack my credibility using fallacies.
Your intention is clear because a few days back you said: “Of course, I rarely get oil prices right”
http://peakoilbarrel.com/the-case-for-peak-oil/comment-page-1/#comment-547563
So by your own admission you don’t place much faith on your own price predictions, yet you rush to take a swing at me by building a strawman argument over a prediction I did not make.
This little thing that you have against me is getting out of control. If you don’t want to get professional help, perhaps you could take it easy. Every time I write you can take a big breath and count to ten. It will be good for your own credibility.
Hi Javier,
The oil price now is $40, he said it will be at $90 in 18 months. It is pretty clear that his meaning was $90 or higher for the oil price. Perhaps you thought he meant exactly $90.00 for the oil price exactly 18 months from now, at noon. I did not interpret it that way.
Based on my sensible interpretation, when you said he would be wrong, I interpreted that as an expectation that you believed the oil price would be below $89/b?
Was that incorrect? Your argument was that the oil price would not be exactly $90/b exactly 18 months from now?
As you said to me before, you noticed the 🙂 in the previous comment, yes? Relax.
Absolutely. He said prices were going to be at $90. That means along that month prices are going to be at $90 at some point.
Obviously he has no idea what the price is going to be in the future like everybody else. Otherwise he wouldn’t be here posting. He would have his own island and would be bragging to other billionaires.
If in a casino roulette you are betting on a number for the next spin, I’ll be the house and bet against you. If you bet that it will be a red number in one of the nest three spins, I’m not taking that bet.
I have no idea what oil price is going to be in any time of the future. I assign a bigger probability to a 2-3 years of depressed prices due to economic weakness or downright recession, followed by high price volatility as demand destruction and supply destruction take turns to lead.
A shorter economic downturn followed by an earlier price recovery is also possible, but in my opinion less probable.
So do you think I am the only one that knows what the oil price will be?
HI Javier
I interpreted Huck differently.
My guess is that you may have misinterpreted.
I will let him comment about if he meant 90 exactly or 90 or higher 18 months from now.
I agree that nobody knows what the oil price will be.
I agree prices will be volatile.
I also think nobody knows when the next recession will begin.
In English if you want to say 90 or higher, you can say
90 or higher
above 89
90 or more
≥90
a minimum of 90
but not at 90.
It is not me who is misinterpreting here.
There’s an old saying, that Javier is channeling: “if you’re so smart, why aren’t you rich?”.
If any of us really believe that we can predict the behavior of oil prices at all, we should be placing bets in the futures market.
That includes a prediction of volatility, because that means prices will rise occasionally quite sharply. If you believe that, then you should go long, and sell at one of those price spikes.
So, if anyone is willing to make a forecast on prices of any sort, then they should also explain why they aren’t investing accordingly…
I also happen to think that oil markets are not going to survive in their present form for very long. Once it becomes clear that we are past Peak Oil and that oil exports are going to plummet at double the rate of production, the oil market will change radically or disappear substituted by bilateral arrangements. Markets do not function on restricted goods.
That’s when markets are most valuable.
When the price of oil hit $147, there was no sign of markets failing. Exporters who restrict their sales will mostly hurt themselves: they’ll hurt their exports, and make themselves obsolete all that much faster.
I wouldn’t want to live in Saudi Arabia 50 years from now. I suspect all of the princes will be in the south of France.
Javier wrote:
“I don’t believe that for a moment. But I am sure that in 18 months you will have a great explanation why $90 is delayed for yet another 12 months.”
I concur. With the exception of a crisis in the ME (ie hot war that disrupts Oil exports), its very unlikely Oil prices will rebound. the Emerging market Credit bubble has popped and its not going to reflate anytime soon.
“And we can ask Gail to explain what the 40 Million additional cars each year on the roads will run on.’
Most of those new cars will end up rotting away, as the owner defaults on the payments or has no job to commute to. the US will likely see about a million job losses next year as the Shale bubble pops. Not only will a lot of high paying Oil workers be out of a job, but manufacturing (piping, drilling equipment), and all those that sold goods and services (ie food, cars, homes). We probably will see another round of bank failures as the shale drillers go busts and default.
As far as China, its part of the Emerging Market economy. All commodity prices have dove off a cliff which means growth in China has ended and is in retraction (no matter what the Chinese gov’t says). Tens of millions of Chinese are going to be out of work and aren’t going to be driving as much. Also China is switching to robotic manufacturing which has already eliminated hundred of thousand of jobs this year. This trend is going to continue for many years to come.
My guess is that when Oil prices do recover they will peak between $70-$80 as consumers worldwide, simply can’t afford any higher prices. With this price cap, its going to exclude a lot of undeveloped oil fields (ie no more share, deep water, etc) and we will have a much steeper production decline than most people anticipate.
Hi Tech guy,
If all of your assumptions are correct, that is a good guess.
What do you think has changed since 2011 to 2013 when oil prices were mostly around $100/b for 3 years. People could afford oil at those prices then. If $70 to $80/b is a high enough price to bring on adequate supply, then prices will rise no further. I doubt that will be the case, I think a lack of supply will drive prices higher, unless the World is in a recession, that is possible, but difficult to predict in my view.
DC wrote:
“What do you think has changed since 2011 to 2013 when oil prices were mostly around $100/b for 3 years. ”
The EM (Emerging Market) was is a credit bubble. Credit was cheap for China, India, Brazil, etc. All them went on a massive borrowing binge which drove all commodity prices up. Now that they can’t borrow more, its all collapsing. I don’t believe they will be able to re-inflate the EM credit bubble anytime soon.
DC Wrote:
“I think a lack of supply will drive prices higher”
Yes, it eventually will, but I believe it will cap around $70 to $80. Any higher will result in demand destruction without the availability of cheap and very abundant credit.
DC Wrote:
“unless the World is in a recession, that is possible, but difficult to predict in my view.”
World is almost completely in recession now. Look at the demand for commodities world wide. Since when as the entire basket of commodity prices collapsed and the world not be in recession?
I think almost all of the world is in recession except for a few small regions and the USA. However the USA is falling into a recession and will be by the spring. I look at the USA Trucking, Manufacturing, indexes and they been falling steady almost the entire year and appear to be accelerating in the second half of 2015. There was a bit push by retailers hoping for strong holiday shopping, but does not appear to have materialize.
Hi Techguy,
I will go with the IMF, growth can slow down, without a recession, only when the World economy contracts will we be in a recession, this happened most recently in 2009 and before that in the 1930s.
I think your prediction of impending World recession is not very likely (less than 1/3 chance). Time will tell.
“We will be at $90 in 18 months. And then Raul Illargi Miejer and Gail will have a great explanation why the end of the world is delayed for yet another 15 years.”
Interesting that someone can say with a straight face that oil price nearly tripling in just over a year will make everything right in the world.
Make everything right?
What does that have to do anything with making things right?
I am referring to a specific, chronically incorrect prediction of impending massive deflation, massive unemployment and S & P 500 at 100 and the rest of the good stuff.f which comes from those two intellects. Go the oildrum archives and see how long those nut bags have been getting it wrong. They had one moment in the sun for 6 months in 2009. They would argue they have it again, but their price predictions and all other items of unemployment and deflation have been chronically wrong.
“…end of the world is delayed for yet another 15 years.”
That definitely implies making everything alright.
“I don’t share Gail’s view of permanently depressed prices, but I don’t think you should laugh about it.”
You have a comprehension problem, Javier. I didn’t write Gail, I wrote “most there…” (as in posters on that site). And yes it is hilarious that they somehow think supply and demand no longer determines price. Supply & demand will always determine price; Econ. 101.
You also wrote: “Truth is nobody can predict future oil price.” Actually anyone can predict anything they want, but that doesn’t mean it will come true. I am predicting a rise in price in the range of 70-80 dollars a barrel in the 2nd half of 2016. There I just made a prediction about oil price.
The point was oil price is currently low due to an oversupply, a temporary glut. Once the oversupply dwindles, oil price will rise again and we will all know supply and demand reigns supreme.
Oh, and I’ll laugh all I want when some idea being suggested is outlandish. Maybe you need a good laugh too. Try it you’ll like it.
“The two lower equilbria, e1 and e2, [see graph at link] are not stable. Any drop in price will result in excess supply that will drive prices down the schedule. An upward increase in price from e1 or e2 will result in excess demand that will continue to increase price in a spiral. In the case of e2, it will propel the market up to the one stable equilibrium: e3. If the price increases, supply will exceed demand and it will quickly fall back to e3. If it decreases, demand will exceed supply, the price will rise and the market will again tend toward e3.
The volatile behaviour displayed by most outcomes in this model is in accordance with much real world experience in the stock market, from the downward spiral of Facebook to the internet stock bubble and other frequent historical experiences.” ~ Unlearning Economics
“…prices do not reflect the fundamentals of supply and demand in any particular industry. If they did so, equities and different commodities would not move in relative synchrony, yet they have often done so.
Instead, prices reflect a combination of general confidence (or lack thereof) and the perception of future scarcity or glut, whether or not that perception is, in fact, accurate.” ~ The Automatic Earth
“At least two assumptions are necessary for the validity of the standard model: first, that supply and demand are independent; second, that supply is “constrained by a fixed resource”. If these conditions do not hold, then the Marshallian model cannot be sustained…
The model of prices being determined by supply and demand assumes perfect competition. But:
‘economists have no adequate model of how individuals and firms adjust prices in a competitive model. If all participants are price-takers by definition, then the actor who adjusts prices to eliminate excess demand is not specified’.
Goodwin, Nelson, Ackerman, and Weisskopf write:
‘If we mistakenly confuse precision with accuracy, then we might be misled into thinking that an explanation expressed in precise mathematical or graphical terms is somehow more rigorous or useful than one that takes into account particulars of history, institutions or business strategy. This is not the case. Therefore, it is important not to put too much confidence in the apparent precision of supply and demand graphs. Supply and demand analysis is a useful precisely formulated conceptual tool that clever people have devised to help us gain an abstract understanding of a complex world. It does not—nor should it be expected to—give us in addition an accurate and complete description of any particular real world market.” ~ Wikipedia
See also, Why ‘Supply & Demand’ Doesn’t Work For Oil by Gail Tverberg
I am sorry. I really like Gail but this is just a little absurd.
The model of prices being determined by supply and demand assumes perfect competition. But:
No it does not. Nothing is perfect. There will always be goods that are overpriced and some people will buy them. Likewise there will always be bargains to be found for some lucky folks. But such examples of overpriced and under priced is not the general rule and does not affect the big picture. Where there are millions of buyers and sellers the general price of any product or service will reflect the demand for that product or service.
‘economists have no adequate model of how individuals and firms adjust prices in a competitive model.
Firms do not adjust prices willy nilly, they always try to get the very best price their product will demand. And if the demand for their product is too low, they will either adjust their price down or stop the manufacture of that product. And they use the same principle when buying. They look for the very lowest price they can find for the quantity and quality they want.
It just defies all common sense to say that supply and demand does not dictate price.
You got the word “always” in there.
But I’m pretty sure you didn’t mean it. I’m sure you agree there have been occasions (and dare I say plural) when price was determined by a buyer paying more than they could, or a seller selling for less than he might fetch.
And once you acknowledge that’s true, and I think you would, you’re essentially lost.
Then you are in a situation where you have to add up all transactions that have ever taken place and prove this seeking of the best deal possible is the majority. Odds seem much higher that the majority of transactions that have ever taken place were fathers selling to offspring for lower than “market” price, were governments imposing excise taxes or tarrifs, were predatory pricing, were purchases of military equipment from one’s own manufacturers for higher price than the same function could be purchased outside the borders.
You should, objectively, be seeing that this is correct. THIS is the majority of transactions in history.
Hi Watcher,
And your proof? The rule is pretty simple, in markets that are not controlled by a single seller or a single buyer when the supply of a good is higher prices will tend to be lower or vice versa, likewise when there is a decrease in the demand for a good its price will tend to fall.
In order for markets to be perfectly optimal there needs to be all kinds of unrealistic assumptions made so that one can prove this mathematically.
Real markets are not perfect, but generally when there is an oversupply, relative to demand at some price P then the price will fall to P’ so that P’P. The demand curve can also shift right or left with similar effects an increase in demand (shift to the right) causing higher prices or a shift left causing lower prices (assuming no shift in the supply curve).
Thanks for the elaboration, Watcher.
Ron, unless Gail has a hand elsewhere, none of the quotes are her’s– just the link.
“Artificial scarcity describes the scarcity of items even though either the technology and production, or sharing capacity exists to create an abundance, as well as the use of private property laws to create scarcity where otherwise there would not be. The most common causes are monopoly pricing structures, such as those enabled by private property rights or by high fixed costs in a particular marketplace [oil?]. The inefficiency associated with artificial scarcity is formally known as a deadweight loss.” ~ Wikipedia
“Artificial demand constitutes demand for something that, in the absence of exposure to the vehicle of creating demand, would not exist. It has controversial applications in microeconomics (pump and dump strategy) and advertising.
A demand is usually seen as artificial when it increases consumer utility very inefficiently; for example, a physician prescribing unnecessary surgeries would create artificial demand. Government spending with the primary purpose of providing jobs (rather than deliverying any other end product) has been labelled ‘artificial demand’. Similarly Noam Chomsky has suggested that unchecked militarism is a type of government-created artificial demand, a ‘system of state planning […] oriented toward military production, in effect, the production of high technology waste.’, with military Keynesianism or a powerful military industrial complex amounts to the ‘creation of state-guaranteed markets for high technology waste (armaments).’
Vehicles of creating artificial demand can include mass media advertising…
Another example of artificial demand can be seen in penny stock spam. After purchasing a large number of shares of an extremely low-value stock, the spammer attempts to create artificial demand by implementing a spam-based guerrilla marketing strategy.” ~ Wikipedia
“‘economists have no adequate model of how individuals and firms adjust prices in a competitive model. If all participants are price-takers by definition, then the actor who adjusts prices to eliminate excess demand is not specified’.”
Whoever wrote this malarkey doesn’t even know enough to be dangerous,except to himself and anybody who reads him.
This is an excellent example of the danger of sound bite thinking. UNDERSTANDING usually requires at least a little thought.
“The actor who adjusts prices to eliminate excess demand” in a competitive ” price taking” market is the actor who increases his production in order to take advantage of the high prices associated with “excess” demand.
My folks back in the post WWII era found themselves in the happy position of making a KILLING on their apple production,due to few trees being planted by large growers in the Depression years and hardly any by any body at all during the war years. My folks being workaholics with nothing better to do kept on planting right thru the Depression, as did many other small timers.
The natural consequence of this post war amazing prosperity, with barely literate previously poor farmers (with one decent pair of bibs reserved for church), making doctor and doctor money or BETTER, was of course that EVERYBODY planted more and MORE trees.
The price crashed due to “excess” production.
It took a while for this process to play out of course. One thing the orchard biz and the oil biz have in common is that both necessarily move VERY slowly in terms of adjusting production in response to changing prices.
My parents and grand parents generation did not set out to DELIBERATELY lower the price of apples, but that hoary old INVISIBLE HAND so often mocked by people too worldly and too sophisticated to take supply and demand theory seriously lowered the price FOR THEM. Like it or lump it.
sarcasm light BLAZING.
Rolling on the floor laughing at people who think price, supply and consumption are not related.
Individuals and and industries buy the things that are essential to short term survival no matter the price . You buy groceries even if you quit making the house payment. You feel starvation after twelve hours but eviction takes weeks to months.
We can definitely adapt to using less oil.
But WILL we adapt faster than LEGACY oil production depletes ? This is the sixty four dollar question, because new production sufficient to replace legacy production will not materialize at current prices.
Price wars always come to an end when somebody runs out of cash and credit and has to say uncle.
Legacy production that is yielding cash will still come to market even if it is losing money over all, but new production will not, once the industry has time to adjust.
I personally do not think the world wide economy IS going downhill faster than legacy oil production, or that it WILL go downhill faster than legacy oil production anytime SOON. I don’t think we WILL adapt to more expensive oil FASTER than legacy production declines, although it is probably technically possible that we COULD do so.
Somebody will pay for the production of every last new barrel that IS produced. It will not be produced at a loss, except by miscalculation on the part of oil company management.
IS the economy going downhill faster than legacy oil production?
I just don’t see it.
Oil will go up, because the world must have it and CAN afford to pay more for it, and the ONLY way it will be produced is at a profit.
Arguing about subsidies keeping prices down is a bullshit waste of time. A subsidy is a welfare benefit, no more and no less. It can be paid directly to a producer, or paid by the end user with welfare money. Same thing.
If the profit comes in the form of a forty dollar subsidy on top of a forty dollar ” price” , the REAL price is still eighty bucks.
The industry, except for tight oil, moves like molasses in January, and it will take a while to scale back and sell out the large stock on hand, but the industry IS scaling back. I guess it will take a year or two , but oil is going up again, barring the world wide economy crashing HARD within that same year or two.
I wonder. Iraq, Iran and Russa all seem to be pretty willing to develop new production at current prices. The US, and most of non-opec, not so much. But the picture overall is pretty murky.
Hi Nick,
I forgot to mention that there is still some low hanging fruit in a couple of places, specifically Iran and Iraq. I have not heard much about Russia bringing new production on line short term.
If the marginal new barrel costs eighty to a hundred, the the REAL price is going to eighty to a hundred also. Some of that price may be paid in the form of a subsidy, either to producers or consumers, but the real price will still be the real price.
If peace truly does break out, I suppose Iran and Iraq together can produce enough to offset most or all of the legacy decline for a few years.
My opinions concerning oil markets are based mostly on what I read on sites such as this one. I never do any actual research. If the legacy decline estimates are too high, the current supply glut might last a long time yet.
CEO’s = talking their (burning) book.
Where is the money? Show me the money!
My brother used to say, “real estate prices can only go up because God isn’t making any more land.” I said, “God isn’t making any more people with money, either!” Money is credit: without good credit there is no bid for real estate … also, no bid for oil.
An increase in petroleum output relative to shrinking market => perception of a ‘glut’. => low oil prices.
An absolute petroleum shortage => a rebound against the customers’ ability to borrow => even lower oil prices.
The price action has little to do with in oil fields but rather w/ the loans to customers. That’s why output volumes are disconnected from price. Drillers can obtain loans, customers cannot = the drillers are stranded.
Okay, let’s bring on the inflation arguments!
Throw them away, they don’t work! Whether the nominal price is $20/barrel or $20,000,000/barrel, the buying power of the hapless customer is the the same or diminished. Meanwhile, changing the customers’ number changes the driller’s number at the same time. He must use the same $20,000,000 — and more — to extract his barrel of crude.
More problems include globalization that uses same dollar everywhere, also worldwide monetary stimulus and ‘QE’ … that shifts buying power from customers to drillers leaving them (drillers) with nobody to retire their debts.
Our problem isn’t frackers or Saudi sheikhs, it’s on the consumption side … at the end of your driveway. Using petroleum does not produce any value for the user, it provides ‘utility’ … a bit of time-wasting entertainment and phony-baloney convenience. Using fuel for the greatest part does not offer the user any ability to retire the funds he has borrowed to buy the fuel. Without ability to repay organically, he must borrow or someone — his boss’s customers or the government — must borrow in his name. Because his actual earning power is nil he turns out to be a credit risk and he can’t borrow. He is insolvent … so is the entire fossil fuel industry … so is its lenders and the speculators (markets) who have bet on prices!
There are two ways to do anything: easy and hard. Easy way is to acknowledge our absence of return, recognize this is structural, it runs with industrialization. Next is to get rid of the JUNK; the industrial firms (that are all underwater from a macro standpoint), reform agriculture, jettison the hubristic empire-building and the political messes that go along with it … and learn how to live within a finite (shrinking) energy- and resource budget.
The hard way is to allow circumstances to do the exact same thing w/ max pain: ‘Conservation by Other Means™’ … something that is already taking place in Syria, Greece and Somalia, in Venezuela, Spain, Ukraine, Russia and Portugal, in Haiti, Saudi Arabia, Yemen, and pile of other countries.
Coming to your town. Are you ready or are you still in denial?
Hi Steve from Virginia,
I always read your posts with great interest and often learn something.
When it comes to the world wide economy going to hell in a hand basket, I am a believer. We are in overshoot, we are long on people, short on resources, our money systems are all clusterfucks etc.
BUT I think maybe Old Man Business As Usual will stumble along, staggering sometimes , but still remaining on his feet for a while yet, maybe as much as a decade or two, barring bad luck. With really good luck, he might last even longer.
I take it you think things are going downhill VERY fast already.
How long do you think for instance it will be before automobile sales crash again on a world wide basis? How long until the domestic house market crashes again?
I understand any reply will only be your personal guess.
Agree. Peak Oil, Peak Debt, and Peak Warmth, all at the same time. Lots of fun later.
Hi all,
The drilling productivity report does not do a good job predicting future legacy decline. The only play where they get this right is the Haynesville. Notice that after natural gas peaks the legacy decline rises. For the Bakken, and Eagle Ford they predict a continued fall (increase in absolute value) in legacy decline even though they show output as having peaked. The declines that they are estimating, especially for the Eagle Ford, will be too high. Chart for Haynesville natural gas and legacy decline below.
Devon Energy (DVN) Inks Deals to Survive the Crude Slump
3:50 pm ET December 8, 2015 (Zacks) Print
Independent energy producer Devon Energy Corporation DVN inked three independent deals, all designed to sharpen the company’s focus in the potential emerging oil plays, amid the global glut in crude prices.
Confirming market rumors, Devon Energy has acquired 80,000 net acres in the Anadarko Basin STACK play from Felix Energy LLC, a smaller operator in the oil and gas space, for nearly $1.9 billion (read:Will Devon Energy Acquire Felix Energy to Add More Oil?).
Devon Energy has also announced the acquisition of 253,000 net acres in Powder River Basin, south of its existing assets in Wyoming, having a production capacity of 7,000 barrels of oil equivalent per day (‘BOED”),,of which oil accounts for 85%. Devon is shelling out $600 million to close this deal.
In a separate transaction, Devon Energy’s joint partnership unit, EnLink Midstream, has entered into an agreement to acquire its peer Tall Oak Midstream for $1.55 billion. Tall Oak has midstream gathering and processing assets in the core areas of the STACK oil play, the STACK natural gas system and STACK crude oil system, which are expected to commence operations in 2016.
Devon’s twin acquisitions in the STACK play will catapult the company to an industry-leading position in that play. Upon closing the Felix Energy deal in early 2016, Devon Energy’s production from the region will increase to approximately 80,000 BOE/d .
News sources and time stamps can be misleading. This entire story was in my morning edition of the Daily Oklahoman (OKC), which I picked up in my driveway at 6:30 am this morning. So, the info was out yesterday.
Dennis,
As production from new wells declines, legacy decline will become smaller over time. Yet it will take months. It is simply undeniable that total legacy decline for shale production stands at 350 kb/d and month (or 4 mill b/d annualized). This is somehow compensated by production from new wells, yet shale companies have to re-drill 80% (4mill b/d out of 4.8 mill b/d) of current production every year. Compare this to just 6% of total conventional world production (6mill b/d out of close to 100 mill b/d). This shows the monster task of shale companies to compete with worldwide conventional production. This makes it clear that most investors in the shale patch will never see their money again, if oil prices do not recover to astronomical heights. In my view shale companies have to cut voluntarily production as fast as possible as this is the best way to bring up the oil and gas price and will ensure survival.
Your last sentence assumes they aim to make a profit, which many don’t. The reason they haven’t cut production over the year is debt related. Yes, they need cashflow for interest and repayment. But more importantly, they need to show PDP for their creditors, as many companies heavily rely on debt.
Hi Heinrich,
Your estimate for legacy decline is based on the DPR, the DPR is wrong. At minimum it is inconsistent when you compare the Eagle Ford oil with the Haynesville. You do see that the size (absolute value) of the legacy decline got smaller for the Haynesville when output of natural gas peaked in 2011/2012. Legacy decline in Jan 2016 will be about 94 kb for the Eagle Ford and for a model matching the EIA’s DPR (which is likely too conservative), the Eagle Ford will decline another 300 kb/d by Dec 2016 to about 900 kb/d (if oil prices remain low). The Bakken will decline by maybe 200 kb/d at most from Jan to Dec 2016, decreases in other shale plays may equal the increases in the Permian, possibly the net will be down 100 kb/d for Permian and other plays.
The total US LTO decrease from peak in March 2015 to Dec 2016 will be about 1200 kb/d.
This might be enough to balance the oil market if there are not increases elsewhere to offset declines in the US and Canada. Time will tell.
Kinder Morgan (biggest pipeline people) just cut their dividend 70%.
https://en.wikipedia.org/wiki/Predatory_pricing
New drilling statistics for Texas rrc shows new completed wells for November down to 667. It was at 1472 last nov, and that was a slow month.
Attached is a chart of C+C production for the lower 48 states up to September taken from the Petroleum Supply Monthly. The chart excludes all offshore production and Alaska and so reflects the lower on shore 48 production. Does the almost straight line drop from March to September of 375 kb/d reflect reality or is this an EIA best estimate?
Checking the March to September production drop from the drilling productivity report shows that it is only 202,252 kb/d. So which one is closer to the truth.
The Drilling Productivity Report reflects shale production only. So both could very well be close to the truth. And I believe they are. In this case anyway. There is a lot more to the lower 48 than just shale you know.
If they are both right, that implies that the on land Conventional/Other oil fields declined by about 173 kb/d over 6 mths or 346 kb/d/yr. With total Shale output at the peak of 5.5 Mb/d, that leaves close to 2.1 Mb/d of on land conventional/other oil. That would put the decline rate of the on land conventional/other fields at 16.5%. Seems a bit high to me for conventional fields.
I still think that one or both of them are best guesses. I do not understand how come the info cannot be either more consistent or closer. If the info were closer, say orders of 5%, for the conventional field decline rate, I would agree that both of them could be correct.
Ovi, I received a detailed research note recently which discussed US onshore conventional decline from 1/1/15 to 6/30/15. The data used was sales data which all of the crude oil purchasers sell to IHS Energy. It is extremely accurate IMO.
1/15 US conventional onshore lower 48 was 2.665 million bopd. 6/15 US conventional onshore lower 48 was 2.447 million bopd.
I suspect there were many conventional well drilled in 2014 in US lower 48 onshore, but a huge drop in those in 2015. So the decline numbers do not surprise me.
Unlike LTO, there are finding costs for US conventional. Drillers of those either pay cash or pay back loans to banks on a five year amortization.
Doing the math:
2.665 …. January 15 production
2.447 …. June 15 production
-0.218 …. 5 month decline
-8.18% … Total 5 month % decline
-1.64% … Monthly decline rate
-19.63% . Annual decline rate
Did I get that right?
Ron your calculations are correct. However, I have my doubts regarding the value of the data.
SS: It is not clear to me that one can equate sales data with production data. Note that US inventory data has been on the rise since the beginning of the year. So companies could be selling just enough of their production to cover their financial needs and putting some into storage. What is the incentive to do that?
Looking at the WTI futures curve, it has been in contango for the past year. The current contango with the front month is $1.37 and the 6 month contango is $5.16. This means that a company that has storage can sell their oil into the futures market at a higher price than it would get today on the prompt market. It is for this reason that one needs to question whether sales data can be equated to production data.
I find it difficult to believe that all of those wells/fileds producing those 2.665 Mb/d in January had an average decline rate of 19.6%/yr. We need another data source to confirm such a high decline rate or an explanation of what is so unique about these fields that make them decline at such a high rate.
Hi Ovi,
There are some wells that get shut in at these low prices because they are no longer profitable to produce. A lot of that conventional onshore oil consists of stripper wells and at these oil prices a lot more of them get abandoned.
Shallow sand can correct me as he knows what is really going on.
That is an interesting thought and a plausible explanation to add to the mix Dennis
I recall reading that SA admitted a few years back that its fields were declining at 8%/yr and that continuous drilling and water pumping reduced that to 2%/yr. That is what makes decline rates in the high teens appear to be a bit excessive, unless there is something unique regarding the US fields/wells
Dennis and Ovi. The number one reason for conventional decline is the lack of work overs in 2015.
We routinely “clean out wells” in the summer and fall. We did four total when the price bumped up in May and June. None since.
One problem in addition to lack of work over of producing wells would be lack of work over in injection wells in water floods. This can affect production greatly also.
In our field there are many more workover rigs than drilling rigs (some admittedly can do both). Those rigs are sitting in the yards. I spoke to a friend today who owns two workover rigs. He has not cleaned out a well with his sand pump since July, is strictly doing rod/tubing jobs. He says some wells are being left down now. He is very worried he will have almost no work this winter.
Another I know tests tubing. Slowest he’s been in years. Says many are just not testing, just finding the hole, replacing the bad joint, and running it back in the well.
This year is the first we have ever shut in wells due to economics. Also will be our steepest year over year decline ever.
As I have posted before, I make a 100 or so mile trip every so often. I go through an area that was heavily drilled in the early 1980s. Until about 2004, it was almost all abandoned. Rusted out tanks. Pumping units with weeds and small trees growing around them.
In 2004 I saw activity, they started to clean up everything. New tank batteries, well sites cleaned up, pump jacks pumping. Then, in 2012 I noticed new wells being drilled. Now, it is almost all shut down again.
All of these are small producers. But I assume this is being played out all over the lower 48.
Maybe look at the MLP oil production. I think it has been trending down this year.
Hi Ovi,
I agree decline rates in the teens seem too high, I would expect 8 or 9% annual rates of decline for the average stripper well (Shallow sand would have a better guess, or maybe Fernando). So I was looking for some explanation for your observation, besides simply bad data (a very real possibility IMO).
Ovi,
The Monthly Petroleum Supply reports data from September 2015, yet the Drilling Report is forward looking to January 2016. So, there is a time lag of four months between these two reports and the data are different accordingly.
Hi Heinrich,
Ovi looked at the drilling productivity report estimates through Sept 2015, it is likely that the Eagle Ford estimate in the Drilling productivity report is too low by about 120 kb/d, based on estimates from Dean, RRC, and Bentek. Also the EIA’s estimate for lower 48 onshore output is slightly too low because Texas output is a little higher (99 kb/d higher) than EIA estimates based on Dean’s analysis.
So based on Ovi’s initial estimates, these would be revised to a 275 kb/d decline in lower 48 onshore and about an 80 kb/d decline in LTO output. So about a 195 kb/d decline in non-LTO production. With 2100 kb/d of non LTO output at the peak, that is an 18.6% annual decline in non-LTO (aka conventional) output.
Shallow sand has suggested two explanations:
1. Most new conventional drilling has stopped due to low prices, fewer new wells relative to the peak in March leads to fast decline rates.
2. Lack of work overs on legacy wells which causes faster decline rates.
I would suggest a third explanation (probably already stated by Shallow sand), that many stripper wells have been temporarily or permanently abandoned due to low oil prices.
Taken together these may explain the apparently high decline in output from conventional wells.
Note also that there is a fair amount of conventional oil (roughly 500 kb/d in the Permian alone) included as “LTO output” in the DPR, if this is added to the 2100 kb/d conventional estimate, it becomes 2600 kb/d, there is likely another 125 kb/d of conventional included in the DPR’s eagle Ford numbers, and about 50 kb/d in the Bakken. When these are all added back to conventional output we get 2775 kb/d of conventional output and the annual decline rate falls to 14%. I believe the normal decline rate of these wells (with proper maintenance) is about 9 to 10% per year, new well drilling tends to bring the overall decline rate of conventional down to about 3% in the US.
In summary low maintenance levels (lack of workovers), low completion rate for new wells, and well abandonment may explain these high conventional decline rates.
I will let the experts correct my mistakes.
This may seem like a naive question to some here, but I don’t work in the oil production biz, so here goes.
A graph in the article shows the US rig count going from about 1900 to 800 over the past year. I assume that refers to an active drilling rig (on and off shore). If so, what happens to the idle rigs? Do they get parked and mothballed? If so, that must be costing the owners (borrowers) a lot money in interest/opportunity cost!, and it must mean an awful lot of idle workers.
Secondly, how long does it take for an idled rig to get redeployed and for the oil it produces to get to market once the pricing conditions improve? Weeks, months?
Hickory,
Parked rigs are called stacked rigs, and are either warm stacked or cold stacked.
A warm stacked rig, has a skeleton crew, walking around with a grease gun and turning motors.These rigs are on a ready to go status, with a little dust off.
A cold stacked rig, if you are lucky has had preservatives added where required, pumps fluid ends removed, and on offshore rigs, literally the doors welded shut and left unattended. These rigs will take a fair bit of work to get back to work, depending on how long it has been stacked and on how well it was stacked in the first place. But you are talking around a month or two.
The other issue is certification. All the major machinery requires re-certification every 5 years. This requires full breakdown of the equipment by OEM, Original Equipment Manufacture, or approved repairer. Now you are talking time, and also where cannibalization of equipment can take place between different rigs. It can take months to schedule these overhauls, so from a planning prospective, you are talking 6 months plus.
Hickory,
I have posted this comment in the previous thread.
A brief summary of an article from “World Oil”, with the data from National Oilwell Varco (NOV):
http://www.worldoil.com/magazine/2015/november-2015/features/global-rig-fleet-declines-in-tandem-with-industry-activity
Last year’s tumble in oil and gas prices forced U.S. rig owners to stack numerous units and downsize operations over the past year. According to the 62nd Annual NOV Rig Census, the 2015 U.S. available fleet has declined significantly, as activity levels plummet. Rig counts were tallied for this year’s census in the early summer, after almost a year of weakened commodity prices. The gap between available and active rigs widened, showing an overall, reduced U.S. market.
Key statistics from the 2015 census include the following:
• The U.S. fleet suffered an overall decline of 883 rigs, causing the total available count to drop about 27%, from 3,254 to 2,371 units.
• This net decrease is the result of 1,120 rig deletions and 237 rig additions,
• 237 rigs were added to the fleet over the last year, compared to 387 units for 2014, which is a 39% drop
• The number of U.S. newbuilds was essentially the same for 2015 and 2014 with 182 and 187 new units being counted, respectively. The average age of rigs in the fleet is now much lower, with more than 2,100 new units entering the fleet over the past decade. The rigs entering the fleet are more efficient and cost-effective—qualities especially needed in today’s market.
• The number of U.S. rigs that were “Reactivated or assembled from parts” dropped significantly in 2015. This year’s count came in at 41, while 193 units were brought back into service during 2014.
• Utilization of the U.S. fleet (combined land and offshore) declined 19 percentage points, from 70% to 51%.
The chart below shows that the current reduction in the U.S. drilling fleet is not yet as big as in the 1980s, but quite significant:
U.S. available vs. active rigs, 1955-2015.
Thank you.
The global economy is aligning historically, demographically, and WRT debt to wages and GDP, interest rates, and the secular deceleration of real GDP per capita with the 1930s and 1890s.
Within that frame, the oil/commodity cycle (associated with the Juglar, Kuznets, and larger Long Wave rhythms) is turning negative (deflationary regime of the Long Wave) as in 1986 (reflationary regime of the Long Wave) and the early to mid-1960s (inflationary regime of the Long Wave).
Should the once-in-a-lifetime cycle/rhythm bear out as implied by the historical precedent, we will witness continuing deceleration of real GDP per capita since 2007 to ~0% or negative;
1% or perhaps lower 10-year Treasury yield;
the Fed adopting NIRP and resuming QEternity;
a persistently stronger trade-weighted US$ (and the US$ Index around par +/-);
nominal GDP per capita continuing to decelerate below 2% since 2007;
CPI trending around 0% and periodically negative;
nominal wage growth decelerating and labor share of GDP remaining at a record low, further constraining productivity growth and thus real GDP per capita;
an eventual persistent, pervasive contraction in the labor force;
wealth and income inequality worsening, resulting in increasing economic anxiety and hardship for the bottom 90%, and the resulting resentment, acting out of same, and social instability;
fiscal constraints and no growth per capita of gov’t spending from increasing gov’t spending to GDP for employee pensions, benefits, Social Security, Medicare, Medicaid, unemployment payments, disability, food stamps, etc.;
health care spending per capita peaking and resulting rationing, cuts of payments to providers, etc.; AND
the 3-, 5-, and 10-year price of WTI falling to the $30s-$40s with the current price in the $20s-$40s for years to come with production falling to 5-6Mbd and consumption declining 2-3Mbd as a result of the consequences of the foregoing conditions.
http://ftalphaville.ft.com/files/2013/01/Perfect-Storm-LR.pdf
And “they” TPTB will still be promising that growth is right around the corner because if the average human understood that growth is dead its game over.
For what it is worth, I summed the DPR data for their 7 natural gas producing regions just to see what they are predicting for January compared to their peak for the report. There seems to be 1.5 bcf/d decline predicted for January from the peak that they see in July. Obviously I do not regard this as even slightly reliable. It is just one view of a part of what may be happening.
Jan-15 42,988,054
Feb-15 44,089,397
Mar-15 44,639,786
Apr-15 45,033,824
May-15 45,212,689
Jun-15 45,387,012
Jul-15 45,455,543
Aug-15 45,283,781
Sep-15 45,108,659
Oct-15 44,920,412
Nov-15 44,668,979
Dec-15 44,319,960
Jan-16 43,954,567
Don,
Over the last ten years, shale displaced non-shale natural gas production to the tune of 4 to 5 bcf/d per year (see below chart). As this year even shale production declines and on the other side supply still grows 3 bcf/d this year, there is a supply/demand gap of around 10 bcf/d building up. This gap can only be closed through much higher natural gas prices.
My thoughts exactly. NG should be over $5 by December 2017.
We expected another decline in October’s output in North Dakota, but their statewide production tool has non-confidential production at 1102752.258 b/d. If you include the general level of confidential production that has them flat at 1.168 million b/d or so; if you use last month’s confidential production, they manage an increase back to August levels of 1.186 million b/d.
Our forecast missed by 1% last month due to confidential wells overproducing, which I put down to redetermination season – forcing very high 30 day IP to make your assets look better. Expected something similar for October, but it looks like they’ve beaten my expectations by a wide margin, as October apparently saw lower levels of completion activity too.
Can anyone else with access to their database confirm what I’m seeing?
Bentek estimates for Octobershow resilient production in the Bakken and, contrary to the EIA data, in the Eagle Ford:
Report: Production in Bakken, Eagle Ford remained flat in October
http://www.ogfj.com/articles/2015/11/report-production-in-bakken-eagle-ford-remained-flat-in-october.html
Oil production from key shale formations in North Dakota and Texas remained relatively flat in October vs. September, according to Platts Bentek, an analytics and forecasting unit of Platts, a global provider of energy, petrochemicals, metals, and agriculture information.
Oil production from the Eagle Ford shale basin in Texas continued flat streak in October, increasing only 6,000 barrels per day (b/d), or less than 1%, vs. the previous month, the latest analysis showed. The Eagle Ford basin demonstrated production growth, albeit minimal, for the fourth consecutive month. Similarly, crude oil production in the Northeast Dakota section of the Bakken shale formation of the Williston Basin grew less than 1% month-on-month in October, marking a second flat month of production, following a period of slight decline during the summer.
The average oil production from the South Texas, Eagle Ford basin in October was 1.5 million barrels per day. On a year-over-year basis, that is up close to 65,000 incremental barrels per day, or about 5% higher than October 2014, according to Sami Yahya, Bentek energy analyst. The average crude oil production from the North Dakota section of the Bakken in October was 1.2 million b/d, or about 13,000 b/d from year ago levels.
“In this challenging pricing environment, producers are doing whatever they can to stay afloat,” said Yahya. “Reducing the number of days to drill a well and/or figuring out ways to bring down completions costs has been on everyone’s agenda most of this year. But some producers are starting to target other formations within a basin to bring costs down or to hold acreage by production.”
For example, said Yahya, in the Eagle Ford, the production boom traditionally targeted the Austin Chalk and Upper Eagle Ford, before the Lower Eagle Ford was developed and yielded much better returns. “However, with diminishing rates of return, some producers are going back and targeting the Austin Chalk and Upper Eagle Ford again, where it is shallower and cheaper to drill.”
“Much like the Eagle Ford, producers in the Bakken shale are also consistently looking to reduce costs to hold production steady,” said Yahya. “In September 2014, 77% of the total wells drilled in the basin were drilled in the core counties (McKenzie, Dunn, Williams and Mountrail) and that metric has since risen to 92% in October 2015. Beginning in September 2015, producers have taken this process a step further and are migrating within the core. The number of wells drilled in Dunn and McKenzie counties rose 20% for the same time period. Conversely, the number of wells drilled in Mountrail and Williams counties declined 20%.”
Bentek analysis shows that from October 2014 to October 2015, total US crude oil production has increased by about 320,000 b/d.
Thanks. great article.
EIA data is pretty rubbish from DPR at any rate, as I’m sure we all agree. I saw the Bentek piece a few days ago, but discounted it as they also predicted a rise in September (which simply didn’t happen, either in Bakken production or North Dakota overall) – though they have been very good in other months.
I think I remember seeing somewhere that their methodology is gas flow measurement, so changes in the gas-oil ratio might make a difference to their accuracy. In any event – we might be talking a 20kbpd increase in Oct, rather than staying flat.
Edit: And that 1.2 million figure has some rounding in it to say it has “stayed flat” at that level. It declined three straight months from a peak in June to around 1.162 in September.
The core migration thing is also a bit overblown – in ND they’ve consistently completed (rather than drilled) at the mid 80s% and above in the core, so it hasn’t changed all that much.
“I remember seeing somewhere that their methodology is gas flow measurement, so changes in the gas-oil ratio might make a difference to their accuracy”
Interesting methodology, I didn’t know that.
Yes, 1.2 mb/d “flat” Bakken production actually means slight declines.
More important, Bentek says that “The Eagle Ford basin demonstrated production growth, albeit minimal, for the fourth consecutive month”.
Meanwhile, according to the EIA, oil production in the EFS dropped by 300 kb/d between March and October, including a 160 kb/d decline in the past 4 months.
As we have discussed earlier, the Eagle Ford production is the most obscure
part of the US oil production statistics.
AlexS,
However Bentek issued today a substantial downward revision for Bakken:
……Wednesday, December 09, 2015 – 5:45 AM
Substantially lower drilling activity in the Bakken has led Bentek to revise both its oil and gas projections downward in December 2015. Williston oil production in December was revised 45,000 b/d lower than last month’s projection and……
This is huge as this adds to the already forecast decline. It is going much faster than I thought and this could lead to a price revival much sooner than anticipated. Finally the industry is responding with the necessary steps. Rather than going under, companies have chosen to cut production.
Except North Dakota just released a few minutes ago, and production IS up very slightly at 1.168 million b/d. What is important about that is the huge increase they would need from new wells this month (or from some other source like refracking). Daily reports suggest fewer wells were completed in October than in September, yet the production added is almost double in size, given the decline rate we are using for existing production.
Edit: link to the monthly report: https://www.dmr.nd.gov/oilgas/mpr/2015_10.pdf
gwalke,
Agree with you. However these are October data. I am talking about November, December and January 2016 estimates. It is absurd to question the drilling report. Why should an US government institution make matters worse as it is? I would rather assume an error on the upside. So, this makes the results even more interesting.
It is definitely not “absurd” to question the drilling report: they use rig productivity, which has no bearing on production, and their methodology is routinely terrible. For a decent period they were simply using a ruler to apply a fixed increase: now they are using rig counts, which bear little relationship to final production (do the regression and you’ll see).
Even if you want to disregard the above, compare their data with the actual figures from, for example, North Dakota and Montana – they are consistently wrong, often by a wide margin, for states which release good data in a timely fashion. I’m not arguing conspiracy – I’m just saying the DPR is rubbish for forecasting. Just look at this, and you surely must agree: https://twitter.com/Petrologica/status/674209548354363392/photo/1
Hi gwalke,
I only have access to data through Sept. For all of North Dakota the decline from June to Sept was about 1.67 kb/d each month. If we assume a naïve linear decline that would be a 25 kb/d decline by Dec 2016, if we assume an exponential decline at 1.7% per year, the result is very similar (about 25 kb/d fall in output by Dec 2016 for North Dakota to about 1137 kb/d. This is probably an underestimate, I think output will fall by about 100 kb/d through Dec 2016 to about 1060 kb/d in North Dakota, Eagle Ford output will fall by 500 kb/d from September levels. The total fall in US lower 48 onshore output from the March 2015 peak may only be 1100 kb/d through Dec 2016, reduced output from other non-OPEC countries such as Canada, Norway, and the UK will be needed to bring supply down. We really need a new cartel of the Oil Producing Countries to regulate international oil output, unfortunately cartels never really work.
Volatility in the oil market will be the new normal, it has always been volatile, it will be worse in the future.
Hi Dennis,
You’ll probably have access to the same well data as me (i.e. through Sept). But you can get an early guide to the next month’s data a few days out by checking out this page: https://www.dmr.nd.gov/oilgas/feeservices/stateprod.asp
Select October 2015, and it’ll give you what production data has come in. As we’re less than a week away from the monthly data, it’ll be mostly complete by now. Add some extra for confidential and waste disposal production, and you have a good ballpark figure for next month’s production.
Ron,
for some reasons, I could not post a comment
Thanks,
Alex
Alex, I have marked it as not spam and approved it. I deleted the two duplicates. Sorry about that but I have no idea why the spam filter sometimes does this.
Thank you Ron
Probably the spam filter doesn’t work properly
The most informative picture I can get from the Texas rrc site is from the monthly drilling, completion, and plugging reports under oil and gas/research and statistics/monthly drilling and completion and plugging reports. At the bottom you have to add oil and oil and gas permits to get the total of oil permits. Some companies request differently. If you study two years of these reports, you may come to the same conclusion as I, that we are starting to go over the cliff, fast.
Guy,
Thanks for the link. It is really amazing how completion rates came down. Finally, the industry is coming to its senses. There is also talk from Platts that December Bakken production is down by 45 000 b/d nearly double the initial forecast rate.
“There is also talk from Platts that December Bakken production is down by 45 000 b/d nearly double the initial forecast rate.”
Link?
Thanks,
This exceeds seasonal effects by how much?
Hi Guy,
Permits don’t really tell us that much, the completions are what matter. Digging that information out of the RRC is not worth the trouble to me because they tend to be pretty behind on their reporting and the interface is very clunky. So far, according to Bentek, Eagle Ford output has held up pretty well, it has been flat for the last few months. If you look at Dean’s estimates Texas output has been pretty flat during 2015, perhaps a cliff is coming, the market hopes you are right as the supply is too high and we need a decrease in output.
The weekly petroleum status report http://ir.eia.gov/wpsr/overview.pdf just came out and the numbers are moving into the right direction. Production is down 38 000 b/d to 9.164 mill b/d and moving soon below last year’s rate. Crude oil imports are over 8 mill b/d again and total imports (crude and products) over 10 mill b/d since a very long time. As product exports are still strong, net imports are 5.5 mill b/d. This will weaken the USD and drive up oil prices again. This could be a significant turning point.
Hi Ron, ND Director’s Cut out. Preliminary production for OCT up from 1,162,253 to 1,168,950 bbl/d
Big surprise for me, as wells completed according to daily reports are less than in September, and they had to add double the production added in September to overcome our (previously accurate) decline rate. For me, it feeds into my hypothesis that in Sept and Oct operators boosted production to up 30IP and EUR, thus improving their PDP and asset base and getting access to better credit terms.
Thanks, I will have a post out tomorrow, along with some OPEC data.
A little off topic today, but Nissan is working hard on enabling Leaf owners to use their cars as backup power supplies for their homes, thereby enabling them to charge the car at off peak rates and discharge it at peak hour rates and so forth. A person with a Leaf and a robust pv system of his own could just about eliminate his grid consumption on days the sun is bright and he doesn’t have to drive the car very far. Fifteen kilowatt hours will get most people who are interested in cutting back on grid consumption thru the evening and the night unless they are using the juice for heat. That would be half the battery capacity and with a half charge, you could still run twenty miles of errands with twenty or more miles of back up range.
This technology is not going to have any discernible effect on oil markets for a long time, but it could be a real shot of adrenalin in terms of boosting pure electric car sales in places where home grown sun power is popular.
The article is short on detail but worth reading.
http://wap.engadget.com/2015/12/09/nissan-enel-vehicle-2-grid-trial/
To follow OFM with a slightly off topic post from the demand side:
U.S. solar market prepares for biggest quarter in history: 1,361 MW of PV installed in Q3, 3 GW expected in Q4
GTM Research expects the fourth quarter of this year to be the largest quarter for solar installations in U.S. history. Led by the utility-scale segment, the United States will install more than three GW. Looking further out, cumulative PV installations will nearly double between now and the end of 2016, bringing the nationwide total to 41 GW.
The utility-scale market continues to lead the U.S. solar market. Utility-scale PV installations made up 42 percent of the nationwide total, while residential installations accounted for 41 percent. Additionally, the residential market hit another new quarterly record as it grew 69 percent year-over year.
Despite some inconsistencies in the non-residential market, the report notes this segment also made progress, increasing 4 percent year-over-year and 19 percent over last quarter.
GTM Research forecasts that the U.S. solar PV market as a whole will grow 19 percent over 2014 and will reach 7.4 GW by the end of 2015.
Is lithium-ion ‘the safest bet’ in the future of battery storage?
The really interesting part of the article to me, is the last sentenced:
Independent power producers and utility executives looking for the right storage technology — to provide renewables load shifting, replace peaker plants, defer transmission and distribution system upgrades, or provide ancillary services to grid operators — “should regard lithium-ion as the safest bet here, likely to dominate for at least the next decade,” according to Laslau.
GTM/ESA Energy Storage Monitor forecasts total U.S. energy storage deployments of 192 MW in 2015
Energy storage has started to appear in different utility RFPs
“Even though we’ve seen the PJM market dominating megawatts of deployments so far, third quarter of 2015 had utility-scale deployments in states like Georgia and Vermont. Energy storage has started to appear in different utility request for proposals (RFPs) and grid planning across states, another indication that utilities and policymakers are getting comfortable with the technology and multiple values it can provide.”
The majority of deployed capacity this past quarter was in the utility-scale (front-of-meter) segment which had its best quarter since the end of 2012. The utility-scale market deployed 46.6 megawatts of capacity, representing 25 megawatt-hours.
The report notes that the majority of the front-of-meter projects were deployed in PJM territory for frequency regulation, a short duration application. As a result, the total energy capacity in megawatt-hours is less than that of the behind-the-meter segment, which consists of residential and commercial deployments that are typically used for medium- to long-duration applications.
The U.S. deployed 13.7 megawatts (28.1 megawatt-hours) of behind-the-meter energy storage in the third quarter of the year, bringing the segment’s annual total to 18.8 megawatts. Commercial deployments made up 88 percent of the quarterly behind-the-meter total, and residential deployments accounted for the rest.
“Storage brings value to all parts of the grid. We are seeing that demonstrated in the diversity of markets where storage is being deployed,” said Matt Roberts, executive director at the Energy Storage Association.
“And storage is reliable and increasingly cost-competitive, so not only is utility-scale storage continuing to expand, but customer-sited storage is growing rapidly as well.”
My reading of the current state of affairs with utility scale solar is that, in locations where the solar resource is very good, it is a more economical solution than NG peaker plants, even at current historically low NG prices. My understanding of the storage (battery) market is that utilities are beginning to view batteries as a better investment than peaker plants, especially for frequency regulation roles where the response time is measured in seconds rather than minutes . Among the reasons is that, the storage can use up some of their otherwise underutilized base load capacity during times of low demand and then negate the need for new peaking plants at a lower cost than the peaking plants. Another reason is that (battery) storage can be located close to high demand centers, reducing transmission requirements and losses.
My question is, will there be enough renewable energy and energy storage in place for them to have a meaningful impact on NG use when NG production declines start to affect pricing? How large do the renewable energy and energy storage have to get before they start to make a meaningful impact on NG demand? I guess we will have to continue to watch the EIA’s Electric Power Monthly over the next few months for a possible answer.
Solar Energy Industries Association
Solar Means Business Report
Released Dec. 1, 2015
http://www.seia.org/research-resources/solar-means-business-2015-top-us-corporate-solar-users
2014 NREL Renewable Energy Data Book
http://www.nrel.gov/docs/fy16osti/64720.pdf
“My question is, will there be enough renewable energy and energy storage in place for them to have a meaningful impact on NG use when NG production declines start to affect pricing? How large do the renewable energy and energy storage have to get before they start to make a meaningful impact on NG demand? I guess we will have to continue to watch the EIA’s Electric Power Monthly over the next few months for a possible answer.”
If you check the situation in Germany or EU you find that NG was the first victim of more REs. In Germany NG lost 1/3 of its share of electricity generation within five years:
2010: 89.3 TWh
2014 61.1 TWh
As long as enough hard coal capacity is available this can substitute for NG in many cases as back-up for REs. In Germany hard coal power plants were traditionally used as mid load power plants, i.e. there is enough flexibility in the coal power plant fleet.
The high German electricity exports kill NG in neighbour countries, i.e. we see a large scale (net) substitution of NG with REs and efficiency gains.
The economic force is the price difference between NG and coal, when NG gets more expensive than coal it dies as long as there is unused coal capacity.
Regarding the new NDIC data for Oct.
Total oil production is up in ND from 1162 kbo/d (Sep) to 1169 kbo/d (Oct). There were only 72 new wells producing (95 in Sep), while 122 new wells were spud (69 in Sep). These newly producing wells were not much better than wells starting in the previous several months. However, total production was up because older wells (<2015) produced just 2 kbo/d less than in Sep (which can be seen in the below graph as well), while in previous months, and in normal circumstances, they could have been expected to decline in total by about 30 kbo/d.
However, total production was up because older wells (<2015) produced just 2 kbo/d less than in Sep (which can be seen in the below graph as well), while in previous months, and in normal circumstances, they could have been expected to decline in total by about 30 kbo/d.
No geological way for decline rates to take a month of vacation.
So this absence of decline has to be from some other mechanism, which can’t be real.
Maybe on site tanks fill with oil that is less frequently emptied by trucks, and a lot of emptying was done in October. Unless production is measured pre truck loading.
Oooh, or how about choke arrangement for Sept and Oct for purposes of camouflage during bank collateral examination.
That last sentence is my favoured explanation. Confidential wells overproduced this year (i.e. production was significantly more than oil sold) in March, April and September (will check Oct once I’ve turned the monthly report into an excel file). That is, only around redetermination time.
Seems like my theory is incorrect for this production increase, though, given Enno shows below that the gain comes from a lower decline in older wells, and Reuters reports from the ND DMR press conference that operators boosted output from old wells to pre-empt the OPEC meeting.
http://www.reuters.com/article/us-north-dakota-oil-production-idUSKBN0TS2P320151209#7sg8R3MROk0QLzLi.97
Performance from new wells.
So the first month for new October wells was more productive than September wells, September’s second month was less productive that August’s, and August’s third month was more productive than July’s.
Have I understood the graph correctly?
Gwalke,
Cum stands for cumulative, so the green and red lines represent cumulative average daily production. So the average 2 month return of wells just flowing was in September less than in August. The 3 month return of wells starting to flow in August was higher than the same return of wells starting in July.
The important point to me is that this shows that there is no evidence that wells are significantly performing better in 2015 compared with 2014, based on cumulative 1st, 2nd, or 3rd month returns.
Thanks for the clarification, Enno. They appear to be trending ever-so-slightly upward, but I agree with you.
Growth of new wells vs decline of older wells. The difference between the 2 lines is the monthly growth/decline of oil production in ND.
Enno,
Thanks for all you work.
Do you think low decline rates of the old wells are due to refracks?
Alex,
No, it doesn’t look like an exceptional number of sudden increases happened, compared with the previous 2 months. I also didn’t see anything strange in the average number of production days. However, 100 more wells than in the past 2 months (250 vs about 150) were producing, that had 0 production in the month before. Besides that, there were a few hundred wells more that didn’t decline, compared with the previous few months.
It appears to me more inactive wells were brought online, or older wells were pushed a little harder. Perhaps the rising GOR in the below graph is also an indication of this.
I had a look and it looks really interesting. If you group the wells by year as Enno did, then production was the same in October as in September for 2007-2011 and 2013. 2012 had even a bit higher production and 2014 a bit lower. GOR has increased a bit for all years but water cut has not changed much. I see no reason to refrac newer wells, so I don´t believe in refrac for those at least.
Enno, FreddyW, thanks
Reuters has this, guys – overproduction to lock in profit before the OPEC meeting:
http://www.reuters.com/article/us-north-dakota-oil-production-idUSKBN0TS2P320151209#7sg8R3MROk0QLzLi.97
Hi Enno,
I noticed that recently there were a lot od wells that would produce in month 1 and then have low or no production in month 2, there can also be variation in the start dated of the first month wells so that in the average month the average 1st month well might produce for 15 days, but this probably varies from 10 to 20 days. These two factors together probably explain the low legacy decline for Oct., the other factor is that wells go down for maintenance and are brought back on line which can vary from month to month, October may have had a bunch of wells being brought back online after being down the month before.
It looks from the statistics that about 174 more wells were producing in Oct vs September, there were only 72 new wells completed, so 102 extra wells were brought online that had been down in Sept.
There were less wells producing in September than in August and it seems that they were brought back online in October
Dennis,
Yes, all these are relevant factors. But besides that, I saw a few hundred more older wells slightly increasing production, compared with the previous 2 months.
You guys are seeing the results of the ‘halo effect’.
Bruce Oksol has been tracking this fairly consistently over on his blog.
As these newer producing wells are all on pads with older producers in place, the operators are completing one or two at a time, meanwhile temporarily shutting in the older well.
After the frac, the older wells are put back online with frequently HUGE (up to 10x) increased output.
Mr. Oksol just recently detailed about 4/5 QEP wells in the Grail field that displayed this clearly.
While I have never seen any company acknowledge this phenomena anywhere in their communications, a few blog sites have noticed this regularly occurring these past few years … much more so this past 18 months.
Coffee,
Wouldn’t you think that if it was a significant effect, that the shale companies would have taken the chance to highlight this positive factor? They have done so with most other real or imaginary effects..
I’ll belief it when I see data & statistics (not a few exceptions). 🙂
It would have to be a very large halo effect to have this much input, and it would also have to have not been existing prior to October 2015. Bruce has been talking about it for a long old while.
In addition, Reuters points out that operators were trying to lock in the price prior to OPEC meeting. You would think inquiring minds would note that if they can boost production late in the life of old wells, this means they can set 30IP and thus EUR of new wells to a number that suits the company.
If you read the reuters article that gwalke posted:
http://www.reuters.com/article/us-north-dakota-oil-production-idUSKBN0TS2P320151210
another factor is that a bunch of natural gas collection equipment has arrived on scene, so operators can now capture gas,
instead of shutting in wells that went over the limit for flaring.
Maybe they also have some new gathering pipelines now in place.
From Reuters:
“… North Dakota producers also were able to raise output, in part, because of new natural gas collection equipment coming online from Oneok Inc and others.
North Dakota requires oil producers to collect certain percentages of the environmentally harmful natural gas released when oil is extracted, or face temporary well closures.
About 86 percent of produced natural gas was collected and processed during October, 5 percentage points higher than the previous month and far above state-required minimums.
Roughly 260 wells had failed to meet the minimum in September and had been temporarily shuttered by state officials, but they were able to come online by October, fueling part of the production rise.
…”
And maybe the guy is reading peakoilbarrel.com, I wonder where he got his 110 completions per month…
“…Still, the state’s oil producers only fracked 43 wells in October, 65 percent fewer than the previous month. At least 110 wells must be completed each month to maintain long-term production.
…”
about that rising C02 being good for plants thing…
New study suggests reevaluating global carbon emissions targets
MINNEAPOLIS / ST. PAUL (12/7/2015) Because plants need carbon dioxide to grow, scientists have expected rising atmospheric CO2 to substantially enhance plant growth, offsetting a portion of human CO2 emissions and, in turn, slowing climate change. However, new research from the Institute on the Environment published today in Nature Climate Change adds to a growing body of research challenging this expectation.
http://environment.umn.edu/news/global-plant-growth-not-keeping-up-with-rising-co2/
So it has increased, but not as much as expected. Expected by whom? Consensus climate scientists?
Current models are unrealistically optimistic about CO2 greening. But they are also unrealistically pessimistic about CO2 temperature increase.
So they got it wrong and their models don’t work. What else is new?
oh and about that bias thing with scientists…
A Greenpeace undercover investigation has exposed how fossil fuel companies can secretly pay academics at leading American universities to write research that sows doubt about climate science and promotes the companies’ commercial interests.
Posing as representatives of oil and coal companies, reporters from Greenpeace UK asked academics from Princeton and Penn State to write papers promoting the benefits of CO2 and the use of coal in developing countries.
http://energydesk.greenpeace.org/2015/12/08/exposed-academics-for-hire/
Greenpeace attempted to set a trap for a Princeton physics professor that has backfired.
Greenpeace co-founder reports Greenpeace to the FBI under RICO and wire-fraud statutes
Any impartial investigation would show only Greenpeace wrongdoing.
Greenpeace already demonstrated that they know no limits to pursue their goals when they permanently damaged the Nazca cultural heritage monument to stage a climate change protest a year ago.
http://www.wsj.com/articles/peru-says-greenpeace-permanently-damaged-nazca-lines-1418681478
They have a vested interest since they get a lot of money from climate change budget.
I used to be a Greenpeace member many years ago, before they converted from protecting the environment to an extremist left outlet with an environmental excuse.
so Patrick Moore is still claiming he is a Greenpeace founder. I wonder why? Does this give some sort of gravitas to his crap?
Here’s what Greenpeace has to say about Patrick Moore:
“Patrick Moore, a paid spokesman for the nuclear industry, the logging industry, and genetic engineering industry, frequently cites a long-ago affiliation with Greenpeace to gain legitimacy in the media. Media outlets often either state or imply that Mr. Moore still represents Greenpeace, or fail to mention that he is a paid lobbyist and not an independent source…
For more than 20 years, Mr. Moore has been a paid spokesman for a variety of polluting industries, including the timber, mining, chemical and the aquaculture industries. Most of these industries hired Mr. Moore only after becoming the focus of a Greenpeace campaign to improve their environmental performance. Mr. Moore has now worked for polluters for far longer than he ever worked for Greenpeace. ”
http://scienceblogs.com/gregladen/2014/06/27/who-founded-greenpeace-not-patrick-moore/
So what. The guy was one of the small group of people that founded Greenpeace and was in charge of a branch in Canada IIRC. Obviously Greenpeace is not too happy about that and tries to present it as a Judas that has not done any good.
But I agree with Patrick Moore that the Greenpeace of the beginnings had nothing to do with the organization of the last decades. Once it became big enough and established enough it morphed into an institution whose main goal was the institution itself. And politics, present only as a personal issue at the beginning, took over in the drift towards political Green parties of the European extreme left.
I think Greenpeace is going to come out toasted from the climate change debacle once the climate starts cooling in the near future.
Cooling?
“If you tell a lie big enough and keep repeating it, people will eventually come to believe it. ” … Joseph Goebbels
Come now my ideologically crippled friend, reality is not your friend.
Are you denying that there was global cooling between 1950 and 1975? If not why are you so sure that cooling in the near future is impossible? Do you know that sun activity has been decreasing for the past two cycles and it is expected to further decrease for at least the next two? Do you know that a Dalton-type solar minimum is expected by around 2050 and that the reduced solar activity is known by all to be a cooling factor? What do you think would happen if over current near-zero warming trend a cooling factor is applied?
Do you know why they call it climate change?
No, just observing reality:
Top 10 Warmest Years (NOAA)
(1880–2014)
Rank Year Anomaly °C
1 2014 0.69
2 (tie) 2010 0.65
2 (tie) 2005 0.65
4 1998 0.63
5 (tie) 2013 0.62
5 (tie) 2003 0.62
7 2002 0.61
8 2006 0.60
9 (tie) 2009 0.59
9 (tie) 2007 0.59
And 2015 will shortly be on top.
See a trend, my reality challenged friend?
No. I see a trivial observation. If we are at Peak Warmth, every year necessarily has to make it to the top warmest years.
This tells you nothing about the future.
Your only skill appears to be extrapolation. Let me tell you it is a pretty useless skill. Many great fortunes have been lost due to most people failing to recognize the cyclical nature of most complex systems. It is a shortcoming of our simple minds to think in linear terms when it is clear that most of our real experience is with cyclical phenomena.
Are you being paid to be on here, Javier? To create FUD?
Don’t be ridiculous.
Whoever you are thinking would pay to have you convinced against your wishes could not afford my fees.
Ok good. I feel better already.
Patrick Moore was discussed hereon previously, Javier.
I personally believe that Greenpeace is a useful organization doing useful work, and that Patrick Moore HAS sold out for the judas silver.
But it is in the nature of things that any large organization eventually comes to be more concerned with it’s OWN problems than the problems it was created to solve.
Greenpeace is not immune .
Same guy? Moore? Apparently promoting Roundup Ready pesticide and saying it was drinkable?
A rent a whore for our corporate masters.
I don’t like herbicides and would not go as far as saying that glyphosate (roundup) is harmless. But the guy has a point:
“Glyphosate has a LD50 of 5600 mg/kg based on oral ingestions in rats, according to EPA assessments (PDF), placing it in Toxicity Category III. The EPA ranks chemicals in four categories, I being the most toxic and IV being the least. The EPA has also found that glyphosate does not cause cancer. To compare, caffeine has a much lower LD50 of 192 mg/kg based on oral ingestions in rats.
Caffeine is over ten times more toxic than glyphosate. Is this cause for concern? Should we stop drinking coffee? No, the main reason being that a typical dosage of caffeine is not high enough to cause toxicity. Let’s look at the numbers. With LD50 of 192 mg/kg, it would take 12192 mg of caffeine to kill an average 140 lb human being. A typical 8 oz cup of coffee only contains 95 mg of caffeine, much lower than the dose required for acute toxicity. The same reasoning applies to glyphosate. Following the same calculations, it would take 12.5 oz of glyphosate to kill an average 140 lb human being. That means drinking about three gallons of Roundup Original.”
http://www.geneticliteracyproject.org/2014/04/30/is-glyphosate-used-with-some-gm-crops-dangerously-toxic-to-humans/
My problem with toxicity category ratings of individually considered compounds that we use and release in to the environment is that they do not normally consider additive and synergistic interactions with the thousands of other compounds that we are also releasing.
A single compound tested in the lab for toxcicity may be deemed OK at a certain level. However we have very little data on what happens when it interacts synergistically or additively with all the other compounds we release.
The whole generally turns out to be much greater than the sum of the individual parts. So maybe it’s not such a great idea to have too many of those RedBull Vodka Jello Shots just before quaffing a few chalices of that yummy, relatively non toxic, Roundup Original.
A half a gallon of vinegar, some Epsom salts, a little dish soap, half a gallon of water, you will have an herbicide.
Costs about two dollars per gallon.
I keep highly trained ninja grasshoppers that only attack weeds… unfortunately just about the time they are fully trained and ready to go to work they usually end up dying…
Hmm, maybe I should train leaf cutter ants instead!
That is a silly exercise on the part of Greenpeace. Yep, academics (and journalists, politicians, analysts for that matter) can be bought for little more than a weekend stay in Teluride. I assume they understand that scientists can be paid to do a climate warming paper that supports renewable energy just as easily…
But that is not what happened.
If you read the link that I put, Prof. Happer clearly stated that he would not defend anything he had not already defended; that he was not to receive any payment at all; that the fees were to be paid to a non-profit NGO from which he did not receive any salaries at all and only some help with travel expenses.
Prof. Happer was assaulted right before giving voluntary testimony to the Committee by a Greenpeace member. You can see it all in this Youtube video. This is a Princeton professor and he gets so mad by the false accusations that he calls the Greenpeace member by his family name, SOB.
https://youtu.be/tULDE_gYmuc
I think that the accusations by Patrick Moore of 18 USC 1512 (tampering with a witness due to appear at a Congressional hearing); and 18 USC 1505 (obstruction of proceedings before committees) are spot on.
Climate alarmists, including Greenpeace are getting bucket loads of money from all type of sources including Big Oil and lots of money from taxpayers, and they are using that money to try to suppress any dissenting voice.
The public is becoming more and more aware of this prosecution and cannot help but wonder how right they can be if they have to resort to these tactics.
To recap: We’re burning fossil fuels to cut down trees that would otherwise eat the carbon dioxide in the atmosphere, which in turn causes global temperatures to rise, which leads to the forests combusting, which results in fewer trees to eat the carbon dioxide in the atmosphere, which…
How about a little background info concerning this matter of Patrick Moore and witness tampering?
A couple of links would be great, thanks anybody and every body.
While I disagree with Javier when it comes to the scope and scale of the problems associated with forced global warming, I try to remember what old Ronnie Raygun had to say about friends and enemies.
If a man is on your side eighty percent of the time, he should be accounted among your friends.
The cultural gad fly is one of the best of cultural inventions.
Javier seems to be dead on in the middle of the enlightend mainstream when it comes to environmental issues with the exception of climate.
And for what it is worth, there IS a small but non zero chance he is right, that the climate will NOT go rogue on us because of fossil fuel pollution. The odds are high to very high, that it WILL go rogue, in my opinion, just to make my position clear.
Now as to WHEN forced climate changes will actually cause really big troubles on the grand scale, assuming this happens, I tend to think Javier might be right in that we have a couple of OTHER existential bridges to cross SOONER, that if we don’t deal with the OTHER problems, first, the biosphere and the world economy are going to fall apart BEFORE warming does us in.
We are caught between a rock and a hard place, between the devil and the deep blue sea,we are in a real jam. The only real hope of our transitioning to a renewably powered economy, a sustainable economy, is dependent on the continuation of business as usual long enough for the transition to come about.
But business as usual is the problem.
Javier understands this problem.
Sometimes I wonder if his critics ever stop to think about how many things he and they have in common.
from Richard Heinberg at PCI
Climate change may divide us. But if we are to avert the worst of it, we must unite behind strategies that will actually work in the real world to preserve the planet’s life support systems as well as the best of what we enjoy as modern humans. But that’s going to entail some material sacrifice for just about everyone—especially those who currently consume the most. Here’s the thing: the sooner we accept reality, the smaller the sacrifice and the greater the benefit.
http://www.postcarbon.org/can-we-have-our-climate-and-eat-it-too/
New companies purchasing 720 wells in the Bakken.
December 09, 2015
http://thebakken.com/articles/1390/new-companies-purchasing-720-wells-in-the-bakken
Nine new operators are acquiring 710 wells in the Bakken, said Lynn Helms, North Dakota Department of Mineral Resources director. The two companies with the highest amount of well sales are Whiting Oil and Gas and Occidental Petroleum.
Occidental Petroleum, which is leaving North Dakota, is selling 300 of the wells. ”
OXY’s exit from North Dakota was planned for about 2 years. But Whiting selling Bakken assets is something new.
It is interesting, who are the buyers? Private equity guys?
Alex
Whiting most probably is spinning off some peripheral acreage that has producing wells on it. (Kinda like Oxy was finally able to do for their entire ND operation).
If these sold wells do not have gathering lines for production, supply lines for frac water and produced water takeaway, they would be relatively much more expensive to own and operate than the ‘factory’ production pads closely located in their core areas.
Someone posted on this site, the other day, the report of Devon purchasing a lot of acreage in the Eagle Ford and Powder River Basin.
These properties were very close to Devon’s existing , core operations with much of the aforemention infrastructure in place.
(Devon is also planning on selling $3 billion – they hope – of somewhat uneconomic properties to recoup money as well as streamline their operations).
As to who is buying these Bakken wells/acreage? Probably some optimistic people with some spare change to invest … but also other operators who may have adjacent, larger positions and could thus ‘bolt on’ surrounding producing property.
Lynn Helms’ comment:
“There are now nine new operators seeking to enter the state through the acquisitions, and it’s another way for existing operators to improve their cash flows and bottom lines,” Helms said.
Operators are running out of ways to respond to the continuing low-price environment as they already have slashed rig counts, deferred well completions and cut personnel, adding up to collective cost reductions of more than 40%.
Asset sales are the last step.
“I don’t know of any other tools they have in their toolboxes,” Helms said of the operators. “It looks like selling legacy properties or some of their noncore Bakken/Three Forks assets is the last line of defense to keep the rigs operating and the crews working.”
http://www.naturalgasintel.com/articles/104631-north-dakotas-eps-face-more-belt-tightening-says-helms
“New operators in Bakken”?
Ha-ha-ha-ha …this is hilarious.. Is this some kind a new comedy routine from Lynn Helms, North Dakota Department of Mineral Resources director??? LOL
New operators, but sorry we don’t know who are they. Some phantom group 🙂 and also, “I don’t know what other tools they have in their toolboxes,” he said. ….Really!!! LOL
Hi Ves,
I don’t see why you should find this so funny, unless you believe oil is going even cheaper than it is now and will stay dirt cheap long term.
There are always people with money to invest ready to come in, when the time is right, and buy up the assets of distressed companies, regardless of the industry. This is of course a risky business, but if you time it right, you can make a KILLING.
Hi Mac,
It’s funny because it is lie. Who are these “new” operators? Do they have names? Are you saying that the oilman who could not do a magic and turn a profit for over a year at these prices and are pushed into Dairy Queen jobs are replaced with Dairy Queen people who think that can make it going in oil business? Common Mac!!!
There’s been some discussion about forecasting. If there’s anything to be said about forecasting, it is that it’s very, very hard to do. As Dennis has noted, one problem is that it’s self-non-fulfilling: if enough people say prices are going up, then production rises, and prices fall. And vice versa.
So, with that in mind, here are a few old forecasts:
Chris Nelder in 2008 calling all liquids peak of 90 mb/d in 2010.
http://www.dailymotion.com/video/x5bzco_chris-nelder-called-a-peak-freak-on_news
—————————-
Ron Patterson September 27, 2012
“I am picking peak. Peak oil is already in the rear view mirror and the decline has already started. Of course that is Crude + Condensate. I have no idea when bottled gas might peak.
Ron P.”
http://www.theoildrum.com/node/9495#comment-920822
—————————–
Steven Kopits is predicting $85 oil by the end of the third quarter. Here’s the link to the recent interview with Steven on CNBC:
http://video.cnbc.com/gallery/?video=3000384466
http://econbrowser.com/archives/2015/06/ten-years-of-econbrowser
http://www.bloomberg.com/news/articles/2015-12-10/billions-of-barrels-of-oil-vanish-in-a-puff-of-accounting-smoke
I am wondering how PV10 will not fall by 1/2-3/4 depending on the company. Surely someone will figure out some hocus pocus.
I again point to CLR, who disclosed in 2014 10K that PV10 of $22.7 billion fell to $8.9 billion using 2/15 product pricing.
From the link
The U.S. shale revolution, which brought the country closer to energy self-sufficiency than at any time since the 1980s, was built on money borrowed against the promises of future output.
While that statement may be technically true it’s IMHO beyond ridiculous to say that a country which still imports 9 million barrels per day of petroleum is anywhere close to being energy independent. But it sure is fun to discuss how many angels are dancing on the top of the US’s pin…
Would all the naysayers remind us again why investing massively in alternative energy infrastructure shouldn’t be this country’s number one priority. If anyone truly thinks alternative energy is expensive now, just wait till it becomes impossible to secure those extra 9 million barrels per day. So go ahead just keep counting those angels…
You can’t argue that. The situation is much worse for those countries that have no fossil fuels at all.
As the investment has to be made also in energy from fossil fuels we should realize that the time is running out to prevent falling into the energy trap.
Nah. There’s an enormous amount of oil consumption of very marginal value: probably 50% of current consumption.
Oil production could fall quite dramatically and there would still be enough for the truly essential uses, like freight and construction.
Oilpro.com has a good list of, “You might be an oilman if…” jokes.
A couple I thought were humorous:
If the hand you fired last year for gross incompetence is now your supervisor at Home Depot.
If your banking is done exclusively with DBC Bank (down behind the couch).
If your business strategy is going bankrupt AFTER your competitors.
This is my first post in this blog.
There has been a lot of talk regarding the oil glut, but according to eia crude inventories there is only 105.1 million more barrils of crude than a year ago. That is just 6.4 days of refineries inputs. It does not seem a lot, even less to justify a 60% decrease in the oil price. Oil must be the only commodity industry where one week of extra inventory produce such a price correction.
It is even worse if we consider that gasoline inventories are just 0.4% higher than a year ago. The most important product which represents 46% of the refineries output is at 2014 level. Where is the glut?
There is a glut in distilite fuel oil, residual fuel oil, propane/propylene and fuel ethanol. It seems that there is a big problem in the industrial part of the demand or maybe there is a big unbalance between what refineries can produce and what the market needs.
Warm weather promotes more driving, so we could start spring 2016 with gasoline inventories quite reduced and we could face a high gasoline price environment while we still have this huge oil glut that the media talks all day long.
I have no idea if what eia states in its inventory report as crude and other oils ( the two mayor inventory ítems by quantity) can be completely used as inputs to produce gasoline or if there are some technical limitations ( not any type of crude can be used to product any type of output). Maybe, and just maybe we have a glut of some types of oil and condensate that nobody needs in the quantities it has been produced since the shale boom.
It is basic economics when it comes to any commodity. If there is a shortage, the price can rise rapidly to the amount that the most critical user will pay. Ask yourself “at what price would the hospitals, ambulances, fire trucks, police cars, offshore drilling rigs [which are being leased for up to $600,000/day], say the price is too high, we will just shut down?” With a small surplus, the price of a commodity will drop like a rock, as buyers see no need to have high inventories and shop around for the lowest price, looking for a seller that has to sell at any price.
A game analogy. Musical chairs with 20 players and only 19 chairs (only short by 1), and two other rules: The person without a chair gets killed, but there is one chair for sale and anyone can buy it to guarantee their safety. How high would the bidding go? Up to the point of the person with the most money.
Same game with 20 players and 21 chairs (only 1 extra). How high would the bidding go? Zero, as everyone can see that there is more than enough for everybody.
You can easily see this play out even more frequently by looking at charts for agricultural products such as: wheat, corn, soybeans, etc. Prices can double quickly if there is a crop surplus, and fall by over 50% just as quickly if the next crop has a surplus.
Clueless, you are not when it comes to commodity prices. I wish I had thought of the musical chairs analogy myself. But you got in a little bit of a hurry in his last sentence and should have said prices can double quickly if there is a crop SHORTAGE.
Commodity food prices are not nearly so inelastic as oil prices, because there are generally plenty of substitutes for any GIVEN food that might be in short supply.But the price can still double in the event of a short crop, it happens.
There are NO short term substitutes for oil.
Thanks OFM. However, my error was not due to being in a hurry, it was due to being 4:13 am my time, and I was still half asleep.
There are NO short term substitutes for oil.
I know what you mean, but that’s a little strong. Driving slower, driving your small car instead of your SUV, mass transit, carpooling: there are a lot of short term substitutes.
None of them are perfect substitutes for dirt cheap oil…but that’s different (and, of course, dirt cheap oil doesn’t really exist if we take into account externalities).
The US just needs to price driving accurately and a huge amount of low value wasteful trips would suddenly become understood as unnecessary. Furthermore the uplift this would give to all alternatives; not just EVs (you guys are so stuck in autodependency), but Transit, active modes, and, most importantly of all; the rise of the local, would huge. And please note, this is not subsidy, simply user pays, just price driving for all its costs, direct and external. Sorted.
Also always remember that proximity trumps mobility; that’s why cities exist!
Sprawl topia is doomed, but I guess that’s hard to grasp when it’s all people have ever known. And getting real about actual cost allocation is the mechanism to get North America out of the current stuck pattern. Climate change and all other pollution mitigation isn’t about personal choice it’s about rational cost allocation; by all means choose to stink, just actually pay the whole cost and there will be more rational actors than old contrarians.
Yeah!!
I’d love to see what would happen if we got rid of that communistic pestilence: free parking…
If anyone’s wondering – I’m serious.
Yup free parking and underpriced driving is the whole problem. Leads to involvement in stoopid wars with unlikeable people (and that’s your allies) in distant a lands due to absurd liquid fuels waste and import addiction.
The craziest thing is that otherwise libertarian freemarketers are violently committed to the Soviet style socialism that is your taxpayer funded driving amenity and no-price driving system. What kind of crisis will it take for reality to be grasped in this area? Cos I suspect you’ll get it sooner or later.
Meantime: Keep on truckin’…
What the EIA calls “Crude oil” is actually Crude + Condensate (C+C).
I suspect that most of the 2015 build in US and global C+C inventories consists of condensate, and I frequently cite a Reuters article earlier this year that documented case histories of refiners increasingly rejecting blends of heavy crude and condensate that technically meet the upper API limit for WTI crude (42 API gravity*), but that are deficient in distillates.
In any case, based on the most recent four week running average data, US refineries were dependent on net crude oil imports for 43% of the C+C processed in US refineries (7.1/16.5) versus 44% a year ago (7.1/16.2). If we had so much (generally cheaper than imported) actual crude oil on hand in the US, why are refiners importing the same amount of crude oil as they did last year?
*Most common overall dividing line between crude & condensate is 45 API
The market for oil is a World market, look at IEA reports for a better look at the International market. Last time I checked, st0rage levels in the OECD were about 250 million barrels above the 5 year average level. There is a limited number of places to put the oil that has been produced, and storing oil costs money, so when there is an excess prices fall. In theory this should increase demand at any given level of World GDP and it should reduce supply as higher cost production is less profitable at lower prices. It takes some time for this adjustment to take place (people don’t go out and buy a gas guzzler right away and oil producers try to outlast their competitors, hoping the other guy stops producing as much). So far it has been about 12 months since oil prices dropped sharply, it may take another 12 months, maybe more for production to slow down and excess inventories to be used up.
If there is not a severe recession worldwide in the next 24 months, I would be surprised if oil prices are not above $60/b, 18 months to 36 months from now, possibly they will be much higher.
It depends on how quickly the oil business can ramp back up after the downturn over the next 1 to 2 years. The longer it takes, the higher oil prices will go, but at some point there may be a major recession, due in part to inadequate oil supply two or three years in the future.
Chart below with the Reference Oil Price case for Brent Oil in 2013$ from the EIA’s Annual Energy Outlook published in April 2015.
30,880¥ for oil in Japan today, 34.47 USD per barrel. 3.5 million barrels sold at 34.47 per barrel.
8,864 petroleum cars for week 48 at the BNSF weekly carload report.
2014, 11,116 petroleum cars during week 48.
11,116-8,864=2,252 fewer cars hauled by the BNSF. Been fewer incidents of derailments, so there is a positive there. Warren must be sleeping better. BRKa is under 200,000 USD per share as of yesterday, so Berkshire Hathaway is losing some ground.
http://www.bnsf.com/about-bnsf/financial-information/weekly-carload-reports/
Given the recent discussions about where US oil and gas production is headed, I have tried to find some forward looking indicators. Well permits and well completions seem to give reasonable indicators for future production. Below chart indicates that at least Texan oil and gas production will steeply slump over the next months. Well permits declined fivefold to a six year low and well completions are not far behind. It will be interesting to see the consequences of this trend.
The RRC Production data is very bad for the most recent 18 months. Texas output has in fact been relatively flat from Nov 2014 to Sept 2015. Perhaps the completion data suffers from the same reporting problems. Permit data is just not very useful.
Dean Fantazzini’s most recent estimate for Texas C+C in chart below. I remembered incorrectly, flat output from Dec 2014 (3460 kb/d) to Sept 2015 (3521 kb/d), actually an increase of 60 kb/d, the average level of output over the Dec 2014 to Sept 2015 period was 3500 kb/d.
I recently posted some summary stats on natural gas production from the EIA DPR. Heinrich responded with a comment asserting, “shale displaced non-shale natural gas production to the tune of 4 to 5 bcf/d per year” and “there is a supply/demand gap of around 10 bcf/d”. Huckleberry Finn weighed in with, “My thoughts exactly. NG should be over $5 by December 2017.”
I am used to Heinrich making statements that are as absurd as Fernando or Javier on global warming. However, his comment made it clear to me that I did not have a clue about what might be happening to nat gas conventional production. Moreover, I had great difficulty finding any good evaluation on it elsewhere. Our attention here and elsewhere is much more focused on shale production and more focused on oil than nat gas. That yields a relative information vacuum re conventional nat gas. The best that I could do is estimate that current conventional US nat gas production is likely to be very modestly over 30 bcf/d. From a Scientific American article I got an estimate that the decline in conventional production is running about 5% a year. That would suggest a decline of about 1.5 bcf/d for 2016. This would be massively less than Heinrich’s prediction.
From what I can tell producers in the Marcellus are getting prices that are very slightly over $1. There is now massively greater takeaway capacity for the US northeast. $5 at Henry Hub would yield about $4 for producers in the northeast. This would be obscenely profitable for producers and there is from what I can tell at least 20 bcd/d additional production capacity that is possible from proven reserves. From this I would suggest that there seems to be a near zero chance of $5 gas by the end of 2017. Prices at that level would create a tsunami of supply.
More to the point about this market. Does anyone have more reliable knowledge about nat gas conventional production going forward? Obviously my guesstimate is worth little more than the non-existent toilet paper that it is not written on.
Don
[…] It seems, now, that the market is slowly redressing the unbalance. Demand is growing, and supply seems to have peaked in July 2015. In a few months, we may go back to a situation where demand matches supply, at this point we’ll see prices rising again. We’ll likely see production going down, and the whole system regaining some kind of balance; at least for a while. For sure, the main element in the readjustment is the decline in the production from shales in the US (image from Ron Patterson). […]