A press release from The Carbon Capture and Sequestration Technologies Program at MIT, December 6, 2013, Bold mine.
Uthmaniyah Fact Sheet: Commercial EOR using Anthropogenic Carbon Dioxide
Company/Alliance: Saudi Aramco
Location: Saudi Arabia
Start Date: 2013/2014
Size: 0.8 Mt/yr
CO2 Source: Hawiyah gas plant
Transportation: 70 Km onshore pipeline
Oil Field EOR Storage Site: Ghawar field
Reservoir Type: Jurassic Carbonate limestones
Comments:
The objectives of the project are determination of incremental oil recovery (beyond water flooding), estimation of sequestered CO2, addressing the risks and uncertainties involved (including migration of CO2 within the reservoir), and identifying operational concerns. Specific CO2 monitoring objectives include developing a clear assessment of the CO2 potential (for both EOR and overall storage) and testing new technologies for CO2 monitoring.
Approximately 60–65% of all Saudi oil produced between 1948 and 2000 came from Ghawar. Cumulative production until April 2010 has exceeded 65 billion barrels. It was estimated that Ghawar produced about 5 million barrels of oil a day (6.25% of global production) in 2009. Ghawar also produces approximately 2 billion cubic feet of natural gas per day.
After 60 years of production, the field is depleted and Saudi Aramco is going to start CO2-EOR. The project will consist of 4 injection wells, 2 observation wells and 4 productions wells.
Is there any doubt anymore whether or not Ghawar is depleted? 2009 is likely the year when production began to fall fast in Ghawar. But it was already falling prior to that.
A bit of history. Three oil fields, discovered decades ago, were held offline because of economic and and other problems.
Shaybah: Discovered in 1968 but due to its remote location was not brought online until 1998 at 500,000 bpd. It was upgraded in 2009 and increased production to 750,000 bpd.
Khurais: Discovered in 1957 and brought online in 1959 and shut down in 1961 due to low production and remote location. It was brought back on line in the early 1970s. Khurais produced 144,000 bpd in 1981 but dropped off dramatically in 1982. Gas re-injection attempts to increase production failed and the field was shut down a short time later due to almost no natural pressure. In 2009 a new massive water injection program began with the injection of over 4 million barrels of water per day brought the field up to 1.2 million barrels of crude oil per day.
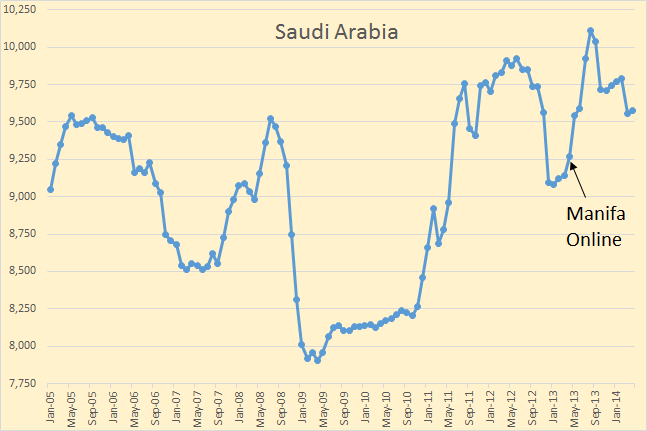
Manifa: Discovered in 1957 but shut down almost immediately because the oil was extra heavy and contaminated with vanadium. But Aramco built their own refineries to handle the oil. The field was put on line in April 2013 and was producing 500,000 bpd and will be producing 900,000 bpd in 2014.
It is these three fields that has kept Saudi production near 10 million barrels per day. But there are no more old fields to be brought on line. From here on out Saudi must rely on the fields it has.
Okay, we know that Ghawar is depleted and in serious decline. But so is Safaniya, Abqaiq, Berri, Abu-Safah, Qatif, Zuluf, Marjan, and all the smaller fields in Saudi Arabia.
Saudi has three fields with a combined production of 2.8 to 2.9 million barrels per day that are not in decline. Everything else is seriously depleted and in serious decline. Matt Simmons, Twilight in the Desert Stuart Staniford, A Nosedive Toward the Desert and Chip Haynes Ghawar is Dying, were all absolutely correct… they were just all premature with their prognostications. They had not counted on Khurais and Manifa.
Saudi is diversifying, making preparations to increase their finished product income when oil production declines: Change is coming to Saudi Aramco, the state oil company
Time was when Saudi Aramco didn’t need to worry much about its ability to deliver all the oil needed to maintain Saudi Arabia’s share of the global market…
A quick glance at Aramco’s 2013 Annual Review, published last week, is enough to convince anyone that change is in the wind for the flagship Saudi state-owned enterprise.
“We have embarked on ambitious corporate transformation guided by our Strategic Intent, our overall vision for Saudi Aramco through 2020,” the review states.
“These advancements will not only ensure that Saudi Aramco remains a global leader in crude oil and NGL production and exports, but will also propel us into the top tier of chemicals companies worldwide and reaffirm our commitment to the Kingdom’s future in a rapidly changing world.”
The IMF seems to be getting overly concerned about current stocks and future crude production: Looking into two Saudi IMF reports
And for that OPEC is expected to furnish the market with additional 800,000 bpd from what it used to produce in April, which was the lowest level of production in five years.
That could be attributed to three factors: the diminishing non-OPEC supplies, which will rise by 100,000 bpd only and the growing worry about the level of inventories, which remained ‘tight.’
IEA estimated that there is a ‘wide’ deficit of 110 million barrels to their five-year seasonal average, according to the report, which puts stockpiles in the 34 IEA members were at 2.57 billion barrels in March, down 2.5 million from the previous month.

202 responses to “A Closer Look at Saudi Arabia”
Cat’s out of the bag, big time.
Ron,
I have a couple of new posts, the first very relevant to your post here on Ghawar.
Carbon Capture and Storage and 1984
White House goes Green – and into the Red
A warning for your Green readers – you will absolutely hate both of these posts, best stay away. The main point is that in the UK, the government has been trying to give away £1,000,000,000 to companies demonstrating CCS deliberately trying to avoid using the CO2 for EOR in the North Sea. I have a worthy rant at the start around Doublethinking that is also relevant to your post. The MIT chaps claim the CO2 is “anthropogenic” and yet the source is the Hawiyah gas plant suggesting to me the CO2 came out of the ground and is likely geological. But it makes much sense to use CO2 EOR in Ghawar if it works – it will be wrapped up as saving Planet Earth when in fact the motive is to produce more oil and keep the Saudi regime in power for a while yet.
The second post above looks at the economics of Obama’s solar without the subsidies that you chaps have to pay – I was quite shocked at the level of subsidy. PS – I remain quite in favour of solar which only works in a high electricity price environment.
Euan,
I had several email exchanges with a mechanical engineer, Jerrgy Graf. He has done some excellent CASH FLOW studies of many of the large Solar & Wind Projects in the states. Basically all of them do not return the initial investment over the 25-30 year depreciated lifespan of the project.
He did an article on the 3 California Solar Projects:
1) California Valley Solar Ranch
2) Antelope Valley Solar
3) Topaz Solar Farm
He states that at typical WholeSale Electric Rates, on 40% of the $5.36 billion investment will be paid back over a 30 year timeframe:
http://jerrygraf.wordpress.com/2013/12/15/what-happened-to-5-36-giga-dollars-in-ca/
Well, Jerry’s an ME, so +1 for that, but maybe he should stick to design, not long-range energy and price forecasting. Per his analysis:
Jerry’s electric price starting point – “The average wholesale price of electricity in southern California in 2013 is about $36 per MWh.” It should be noted that this is at the low end of the last 10 year’s average CA wholesale price, largely due to very inexpensive wholesale natural gas. It’s almost a cherry-picked starting point.
Jerry’s key assumption – “Price of electricity will rise at a rate of 2.5% per year” (for the next 30 years). According to my calcs, that Jerry believes the price of electricity will double in thirty years. (future price = 1.025 to the 30th power)
Given that most wholesale CA electricity is generated by natural gas (and what little coal we have is being been phased out of the CA energy mix), who in the forum believes it is reasonable to assume that it will take 30 years for wholesale electric rates to double to 7.2 cents per kilowatt-hour?
$36/MWh average wholesale cost came from EIA information from 2013 for the region served by Palo Verde in southern California. If you look further north around the San Francisco area served by Caiso NP15, it was running $42/MWh.
Referring to my analysis: If I start with a nice round overtly generous number like $50/MWh, if I double the expected inflation rate to 5% quadrupling the cost of electricity over 30 years, and if I continue to NOT apply any inflation to the underestimate of annual O&M costs I originally used…………..then the analysis shows that the projects would just return the original investment at the end of its life in 30 years. Still, why would anyone do this??
I’ll make you an offer right now. If you give me $5.36 billion dollars right now, I will promise to return that exact $5.36 billion to you in annual payments over the next 30 years. Do we have a deal? When can I expect your check?
Jerry,
Great reply. Heck…. Jerry almost sounds like Art Berman when he said, “Who would invest in shale gas if you only break even on a point forward basis?”
Steve
Thanks for jumping in, Jerry. I don’t question your calculation technique, nor your starting point. The key assumption of 2.5% annual cost increase, or even 5%, though, gives me pause.
I have been following the CA energy structure a long time. What I’ve seen is that the CAISO wholesale spot-market kWh rates tend to track the wholesale natural gas prices, plus a nominal fixed cost markup. As an example, current NG price is about $0.40/therm. Run gas through a 60% efficient CCGT plant and you’ll get about 17 kWh/therm. Fuel cost at 40 cents/therm = 2.3 cents/kWh. Add 1.3 cents for fixed plant costs and you’re at the 3.6 cent PaloVerde price. So that validates your initial cost assumption.
So now looking at future costs. My assumption – going forward, wholesale electric rates will continue to be driven by NG prices. Basic question: Is it reasonable to assume that NG, now at 40 cents/therm will increase at just 2.5% or even 5% per year? The price was almost $1/therm before the market was flooded with shale gas a few years back . If/when high shale gas well depletion rates catch up with the market, wholesale gas cost could quickly shoot back up to $1 or even $2/therm. That could happen in just a couple of years. That quickly puts CCGT fuel costs up to 6 cents – 12 cents/kWh. Yeah, I know, the EIA AEO shows a nice gentle NG price inflation chart going out 20 years, but lately, I don’t know they can claim a great long-term FF capacity/price forecast track record.
My take: With world demand also growing and LNG terminals planning to export US gas to a NG-hungry world at world-prices, I think it is more reasonable to assume that NG will be much more expensive in the future than now – perhaps figuring 10%/year fuel cost increase. That would quadruple the wholesale electric price in under 15 years, making the PV investment breakeven point around then.
What is your take on NG future prices?
Hi Euan,
A couple of flaws with the solar analysis. Electricity prices are assumed constant. Current technology tends to favor micro-inverters which raises the initial cost of the system by $1680, but eliminates the replacement of the inverter at 10 and 20 years ($11200 total) and increases system output by about 15%. Also the initial system cost will decrease to European levels (40% less than US system cost or about $20,000). Note that electricity prices increased by 50% over a 6 year period in DC (2004 to 2010) which is 7% per year, this would be about a 4% price increase in real dollars. A price rise in electricity prices of 3.5% with the lower initial system cost of $20,000, 15% better output and a discount rate of 5% makes the NPV about equal to system cost without subsidies.
Yep-
scrawny old boomer gal never worked around helicopters before, but she was my boss… “helicopter manager” i think was her official US forest service title
she’d come in on a project fire in colorado …from alaska, and seemed to assume that i’d throw service in with the helicopter service… replacing her former pilot whose helicopter went hard down for some reason i forget… parked in a farmers’ field heliport like a big floppy static display
the fire boss comes into our heliport one day for his daily joy ride… he’s all smiles, “we went over a million dollars today!” … i ask him, “how many acres?” …he says, “i dont know”
he got some good pictures of the cliff dwellings… anasazis and that… after all that work building those houses, they just packed up and left…
.
that was not the beginning of the end… that was not even the middle of the end… that was the end, period, of my career as a helicopter pilot, such as it was
The only way SOLAR works is if the regional utility companies pay 2-4 times the wholesale rate. WHAT A DEAL…AYE?
steve
Wrong.
Austin Energy just signed a contract for large amounts of solar power from a private company, at a bit under 5 cents per KWH, which Austin Energy figures is LESS than the all-in cost of a new gas plant.
And if you put solar panels on your roof, the cost is competing with retail, not wholesale.
What is the homeowner’s insurance premium increase to cover these?
http://forum.solar-electric.com/showthread.php?15727-Homeowners-insurance-and-solar-panels
One poster said Geico would not cover the roof mounted panels, nor the house on which they were mounted.
Hi Watcher,
Most of the responses were more like the following(from your link above):
“Nothing too hard about getting insurande on your solar system. Just call your agent and he can quote the coverage and cost. In my case it was a small addition to my premium. ”
I guess the take home message is don’t use Geico for insurance if you have solar PV or better yet check with your insurance company before buying a solar PV system.
Buffett owns geico.
and?
Oh, I thought he was uber green.
BTW do we know what damage to the panels is covered? Gamma particle asymptotic decay of junction total? Or just blown branches?
Maybe I’ll call and ask someone tomorrow. Earthquake insurance has a $10,000 deductible.
If the panels are mounted with some gap between themselves and the roof and wind comes along and rips the panels upwards, taking the roof with them, this has insurance dodge written all over it. Just like if a squirrel in the attic bites some wires and sets fire to the house? Not covered. (check your policy, I guarantee it excludes damage by rodents (squirrels are rodents)).
Made some phone calls. 5, too lazy for more.
Two said they won’t do coverage. No sufficient database. Recommended installing on poles separate from house in order to deal with the problem. For them, if you put it on the roof, you will lose coverage for the whole house should more or less anything happen to the house because they would have no way to know the panels were not somehow related.
Two said they consider it like a deck and apparently their deck addition coverage is height dependent so if you have $30K worth of panels it’s like covering $30K of deck at that height, which seems to be much pricier than a deck at ground level.
The last call said they will add the panels cost to the house and increase premiums in no special way, meaning if the construction cost of replacing the house with $30K of increased replacement was needed, that’s what the charge premium for.
Oh, one of the places that do deck-like coverage seemed to know stuff. The lady said look careful at panel warranty. They cover power production for X years, but that means any power production. If power output falls off after 5 years, but even one erg of output is still there, the warranty won’t pay.
Interesting, you need to do your homework I guess, I don’t have PV panels so I had no idea. Your concern about the panels being torn off the roof by wind would likely only be an issue in a hurricane situation.
Thanks for looking into it.
Watcher, I don’t know why you feel compelled to invent spurious objections every time someone speaks favorably of solar power. None of your objections are correct.
Code requires solar panel mountings to withstand the highest winds thought to occur in the area. (90 MPH wind in Austin, Texas) Blowing away is not a problem.
The guarantee on panels says they will produce 80% of rated power for 25 years.
Rodent munching the wire causes an open circuit, not a fire. These are 1-conductor wires.
Retail versus wholesale is what makes it worthwhile to grow your own tomatoes to the extent you can.
Tomatoes during the heart of the gardening season last year never fell below a buck a pound but when they were a buck at retail they were only fifty cents wholesale.The buck was at flea markets for very local tomatoes. The supermarkets never sold for less than a buck and a half for tomatoes hauled in from ” someplace” if you asked.
Then there is the wholesale versus retail in terms of taxes.
Most of us are going to be paying thirty percent or so at least in various income taxes.
Home grown is tax free as a rule.
Between the taxes and the actual cost savings based on retail prices things look a lot different.
Hi OFM,
In most states there is no sales tax on food. So taxes on tomatoes are not an issue.
The taxes I refer to are the income taxes you pay on wages or salary used to buy food, or on income earned by selling food.
If you are paying thirty percent taxes on income you can get only seventy cents worth of tomatoes with a pre tax dollar.
Grow your own and actual value of them to you in monetary terms is tax free if you eat them yourself.
I don’t sell tomatoes but if I did I would have a hard time getting sixty cents for them wholesale at the time of year I would have enough to sell and have to box them up and deliver them to a buyer.
But if I eat them myself and they are equal or better quality to the ones that are $1.39 at the supermarket that makes them effectively worth close to two bucks of pretax money to me.
The situation will not be so extreme at the present time in favor of home generated electricity but in the future I expect electricity to be much more expensive for reasons of inflation, higher prices for fuel to generate it, the decommissioning of some nukes and some old coal plants, and higher taxes on it.
Personally I expect residential retail electricity to double in price within ten years on average nationwide.
My opinion is that CCS is a boondoggle and that except when the CO2 can be used in enhanced oil recovery or possibly some other large scale industrial process it will never be widely implemented. Efficiency and conservation will provide far bigger bangs for the dollar.
This is also true in the case of solar power in the short term to medium term in locations with a fair to poor solar resource.
But the bigger picture and the longer term are critical considerations and we need to look at more than the current day costs of an installed residential sized system in order to judge the value of solar power.
Now of course I may be entirely wrong but I have been following the peak oil debate off and on for a good while now and I am personally convinced that barring economic collapse the price of natural gas is going to do what the price of oil has done over the last couple of decades- go up and go up and go up some more until we remember todays prices the way I remember thirty five cent premium gasoline and seventeen cent heating oil and diesel even cheaper. There is apparently enough coal that the mine head price of it won’t go up so much but the delivered price is another thing altogether.Unless I am mistaken the delivered price of Wyoming coal in Atlanta is about five or six times the price at the mine.
It is inevitable that as finite resources deplete even as population continues to grow that localities and states or provinces and national governments are going to run short of revenue and a tax on fossil fuels leaving the jurisdiction is going to be a mighty attractive proposition.How high might such a tax go? As high as the market will bear of course.
It is bad business and bad policy to invest money simply because a subsidy is provided for doing so but a subsidy sanely applied is another story. A solar system installed in Arizona or southern California will put out a hell of a lot more than one in Washington DC and given the match between air conditioning loads and solar output can make sense there.
Again- if I am not mistaken- as system in Germany nowadays costs about half what it does here in the US.
IF there is anything at all to the constant self congratulatory ” USA USA NUMBER ONE ” foolishness we can eventually match the German costs. American carpenters and electricians are not dingalings or deadbeats but they do need a standardized set of rules to work with in order to get costs down and a higher volume of work in order to get good at it – to get it done in a fast business like fashion.
I will have more to say about this later.
But for those who are seriously opposed to wind and solar power-I challenge you to post your opinions as to what the cost of delivered natural gas and coal are going to be in ten and twenty years time and what the actual per kilowatt hour cost of fossil fuel generated electricity will be at that time in places without wind or solar integrated into the local grid.
OFM wrote:
“But for those who are seriously opposed to wind and solar power”
1. I doubt think it will scale up because wind and solar are intermittent power sources. The more intermittent power sources added to the grid the more unstable it will become. Like a juggler. the more PV/Wind farms added the more balls the grid has to juggle. At some point there are simple too many balls that need to tracked. Sooner or later the Grid is going to collapse and the cause is going to be related to a problem with an intermittent power source and that will be the end of further expansion.
At best, when the grid does finally collapse installed wind solar will supply intermittent power to the island grids with permanent rolling blackouts. But of course one needs to be local to one of these farms to make use of them. With the grid down, its probably be difficult to maintain them for the long term. I don’t see how any investment in grid PV or Wind systems is going to delay or provide a transition off fossil fuels.
2. FWIW: Solar and Wind make some sense for private off-grid installations. Better to have intermittent power than none. Unfortunately since these systems are very expensive only a small number of households will be equipped. Probably less than 1 in 10,000 homes has an off-grid system. Most of the newer private installs still rely on the grid as they are using grid-tie systems to avoid battery and the off-line electronics provide power off-grid, which increase installation costs.
Well now….I am not an engineer of any sort except the backyard kind but this frees me up from the blinders of professional expertise which are amazingly effective blinders- much better than the ones Old Pa used to use on his mule.
THIS IS AFTER ALL A PEAK OIL SITE. This fact does not in and of itself prove that peak oil is an inevitable reality or anything of that nature of course.(SARCASM LIGHT ON)
But since I am only a simple minded farmer, albeit one with science oriented degree from a major university, and with about fifty years of serious reading on a daily basis crammed in my old gray noggin I believe in peak oil and peak gas and all that sort of chicken little foolishness.
So I propose that as the shysters say in court , let us for discussion purposes DEEM it a fact that we will leave oil and gas behind or oil and gas are going to leave us in terms of cost and availability.
Wake up folks! We may have plenty of coal but oil and gas are getting pretty short and pretty expensive and most of the articles that I run across these days which I DEEM to be seriously thought thru on the subject of tight oil and gas point out two basic facts.
One of them is that getting tight oil and gas to market is a very expensive undertaking.
(All you guys had some good fair fun out of me a couple of days ago for argueing that Russian oil and gas from the far back corners of Siberia might not be so expensive as you think. Can you remember two days or three days back? I don’t know beans about Siberian oil but I do know a little about no holds barred large scale industrial construction having been a rolling stone all my life.)
The other one is that there really might not be all that much accessible tight oil and gas out there anyway- maybe not even in Siberia!!!
Fifty or sixty years ago it was considered prohibitively expensive to provide more than three forward gears in a nice American made car- even though four gears and a clutch pedal were provided in Pintos and Vegas as matter of necessity.
The grid CAN BE upgraded to handle any amount of renewable energy that is ever likely to be available except wind can be too productive some days and some wind farms might have to be idled on really windy days due to over building them to have enough juice on average days.
No doubt it will be expensive. Eight speed transmissions for automobiles are expensive but there are half a dozen models equipped with them this year.
IT will NOT require more fossil fuel generating capacity to back up the renewables than it would take to meet demand ANYWAY.
The primary justification for renewables in dollars and cents terms for the next couple of decades is going to be as tools useful in AVOIDING the cost of buying coal and natural gas and paying the taxes and delivery charges thereon.
The people in the business of actually generating power by burning coal and gas are going to have to be paid a reasonable amount to compensate them for the lack of income resulting from idling back or shutting down some capacity which would ordinarily be running on a very regular basis and thus bringing in money on that very same regular basis.But this is a political problem rather than an engineering problem and it will be solved in due time.
Most of my working ( non retired ) farming acquaintances used to just drive their big pickup trucks exclusively except on social occasions for which they kept a big car.Nowadays almost all of them have a compact truck or car in addition to the heavy duty pickup- this compact vehicle having been bought for the express purpose of not having to put so much fuel in the four by four six thousand pounder which burns about three times or even four times as much on a per mile basis in real life the truck being older and the compact newish.
Wind power provided four percent of all the electricity used in the US last year. That means in essence that utilities were able to save pretty close to the equivalent amount of oil and gas that would have other wise been purchased.The existing wind farms will continue to save us as a society that same approximate amount of oil and gas every year for the next twenty or twenty five years minimum.
In addition to that the reduction in the sale of any commodity puts downward pressure on the price of it.( This happens to be a benefit that the opponents of nuclear power never credit to nukes but since they have provided a huge chunk of the juice used for our last half century the avoided costs of coal and gas in terms of price increases alone is probably ample many times over to pay for decommissioning and so forth)
Come on guys .. we have a choice to make … there are three doors … behind one of them there is no or very limited supplies of juice coming from ever more expensive fossil fuels.. behind another there is the nuclear dragon.. which scares the hell out of me but I am less afraid of it than I am of not having it around…. and behind the third is a world powered mostly by renewables.
None of us in this forum today are going to live to see real honest to Jesus fusion power running our toasters.
Storage is a hell of a problem no doubt but not nearly so big a problem as opponents of renewables think it is … because the choice is not the one they think it is. The choice is not current day business as usual but somewhat intermittent and limited availability of electricity or else eventually hardly any electricity at all.. or large scale renewables…..unless the public can be convinced to go on a nuclear spree and pretty damned quick about it.
I am only a back yard tinkerer but I can think of a hundred ways I am sure to accommodate myself to using wind and solar powered electricity and cutting back on using fossil fuel powered juice without seriously impacting my lifestyle. As electricity becomes ever more expensive it will be both possible and practical to build our electrically powered appliances to take advantage of intermittent supplies.
There is no reason at all for instance why the average mcmansion owner could not have a two hundred gallon hot water heater as opposed to a forty gallon except for the initial cost. With a smart grid and a chip in the water heater or a computer managing the house it could supply almost all the need for hot water for an average family utilizing wind power alone but it would still need to be backed up because the wind might not blow for MORE than a week of course.
HVDC transmission is expensive as all get out but it will be cheap compared to the cost of coal and gas in a couple more decades bun transmitting wind and solar power a thousand miles or more will be cheaper than the alternatives.
We are running short of natural resources and will soon enough forget the easy convenience of around the clock around the calendar coal and gas fired juice in unlimited quantities because forgetting is one of our greatest talents.
We are after all forgetting the reality of fossil fuel depletion in a discussion on a peak oil site are we not?
( I can take it as well as dish it out. Pour it on when I forget something just as obvious next week or maybe even later today.)
When I was a kid and we wanted some fish I was allowed off from other chores and hiked a couple of miles to a nearby stream and brought home enough wild trout for dinner most times.The trout are gone now.. the stream is wall to wall on both banks with vacation houses and the construction work and sun allowed in by removal of so many trees finished them off. If they were still there …then they would be the property of the new owners and unavailable to me.
History ain’t over.
Jeff Brown’s ELM is a reality.
Hot resource wars are inevitable.
I have a good friend that needs a thousand bucks worth of prescription drugs every month to keep breathing. His choice is not paying or not paying for them.His choice is life or death.
Choose your door.
And another thing… I am not a physicist either. But I understand the black box problem in layman’s terms. CO2 insulation traps heat that comes in short wave and can’t get back out long wave on this old blue marble.
I am not naive enough to believe we super monkeys will voluntarily give up our coal and gas fired electricity any sooner than absolutely forced to by the boot of reality in our collective backside… the hotter it gets the more coal we will burn to cool off ….. but whatever juice we get from renewables will put off the inevitable for a few more years.
I expect by then that I will be safely dispersed and my component molecules pushing up the crabgrass .Crabgrass can stand the heat.
The big box landscaping stores only a hundred miles away in Charlotte are stocking palm trees these days although they aren’t yet selling very many of them.
My Old Pa used to tell me about driving his Model T on the ice on the New River for miles. Fishermen are seldom fool enough to walk on what ice there is on it in the last couple of decades.
Hi Old farmer mac,
I don’t know about others here, but I’m expecting the fourth door: political and economic dysfunction teaming up with worsening climate change impacts and declining net energy availability to drive us into a long decline over the next couple hundred years before bottoming out with a much lower world population living by human and animal labor and intermittent, low-scale, simple renewable energy sources. No idea what the next civilization on from that will look like, though I sure wish I did!
I don’t know for sure if running some kind of reduced version of the industrial economy is technically possible without fossil fuels or not. I doubt it, but I could be wrong in a purely theoretical sense. However, I don’t for a moment believe that, at this point, we’re going to transition ourselves to that. Maybe we had a chance in the 70s, but we decided not to bother. At this point? Again, technically, there might still be the energy and resources available to make this transition–though again, I’m skeptical–but there sure as hell is no indication that there’s the foresight and maturity within our society and political establishment to do it.
Building out the incredible amounts of infrastructure needed for this–both in energy generation, major grid revamping, and a reworking of all the fossil fuel-powered infrastructure that makes this whole thing possible–would require a dramatic cut in our lifestyles, pretty much starting now, with a diversion of all those energy and resources saved to the effort of building out this new future.
Do you see that happening any time soon? I sure as hell don’t.
There’s absolutely no indication that we’re going to come to our senses and be willing to make this sacrifice for a goal that may or may not be possible. Indications are that we’re on the verge of the fracking bubble bursting and oil decline really setting in. At that point, I think it’s foolhardy and blind to current realities to look around and expect some come-to-Jesus moment wherein everyone wakes up to the hard reality staring us in the face, sets aside all their differences and animosities, come up with a nationwide or worldwide plan, accept the necessary sacrifices, and embark on it with steeled resolve in the hopes of making the future better at the expense of the comforts of the present. No, every indication from our recent history is that we’re going to continue to believe in nonsense, find scapegoats, scrabble to hang onto whatever we have now and throw someone else under the bus as necessary, and just generally double down and try to save our own skin at the expense of the collective lot.
That’s pretty much what we’ve been doing and I don’t expect everything to suddenly change over night.
We tell ourselves stories. We fit everything into our narratives. We’re going to continue to do that. If the reality doesn’t fit our story, we’ll force it. If it continues to not fit, we’ll find scapegoats and cast blame. That’s how it works at the national level right now and I don’t expect it to change widely enough to avoid a long decline.
The hope, in my mind, is that we can do better on the small scale. We can do better within our families, within our local communities, with our neighbors. I’ve been farming for about five years now, mac–much less time than you. But being in that world has shown me the way that people can pull together, can get along as they need to, can rely on people they don’t agree with. I see a massive amount of hope in that.
But I see that hope on the small and local scale. That’s where the differences will be made. I just don’t see that happening on the national or global scale. At that scale, the decline’s baked in, so far as I’m concerned. At the local scale, we can rework our lives and the lives of our friends and family and neighbors. It will still be hard, a lot of us are still probably going to die sooner than we would hope, and there’s still going to be a lot of pain and suffering, but that’s pretty much par for the course for human history. No real reason we should get a permanent reprieve just because we figured out how to dig up and burn a bunch of stored sunlight. It just ended up being a crass party and now we have to deal with the mother of all hangovers.
I wouldn’t mind being wrong, mind you, but where are the indications that the entire population is suddenly going to become mature about this, accept the reality of net energy decline, and willingly make massive lifestyle cuts to embark on a major renewable-infrastructure build out? And then also willingly make the necessary transition away from an economic growth model, begin to manage world population into decline, and accept a continued reduction in standard of living? My money’s not on that kind of rationality and long-term planning, unfortunately; it’s on the forced decline of natural limits and all the mad scrabbling and unnecessary pain and suffering that will entail. Which sucks, but the universe is under no obligation to provide us the future we desire, or to save us from our own shortsightedness.
Hi Joel,
You may be correct, but I tend to agree with OFM’s take on this (and on most things to be honest, I find his point of view very realistic, despite the ribbing he gets from others when they disagree).
One way to think of it is this, right now the average person (who does not follow energy issues very closely) has most mainstream media telling them that there is plenty of energy.
Within 2 to 10 years it is very likely that a decline in world crude plus condensate output will be apparent. At that point there will likely be an economic crisis (either immediately or within 5 years of the decline) and possibly governments will take action to mitigate the problem.
I am talking about a WW2 type effort where we build HVDC, wind turbines, solar PV, railroads, light rail, electric buses, recycle human waste for fertilizer, amongst other ideas rather than focusing on tanks, planes, and ships as we did in the 1940s.
I could be wrong, but I just don’t see everything falling apart with no pulling together within the nation to solve a difficult problem.
The current political climate makes this seem unlikely, but a crisis sometimes has the tendency to pull people together to work for the common good.
I could be wrong, but I just don’t see everything falling apart with no pulling together within the nation to solve a difficult problem.
We are a global nation and this will be a global problem. While some nations may start a Manhattan type project to prevent a crash, every nation will not. However…
The question, for the entire world, is not what will they do but what can possibly be done. You, and a lot of others, see “renewables” stepping in to fix everything. I am deeply sorry but those who believe such a thing simply have not done their homework. It simply cannot be done.
Yes our nation may do lots of things in an attempt to keep the wheels from coming off this civilization train. And it just might work… for a while. But in the end the population will collapse. But the vast majority of humankind will go on believing that things will never really collapse. I fully understand why they must believe that.
Ron,
The problem will be obvious to all nations because you are correct that it is a global problem. It was not only the United States that pulled together as a nation during WW2, this happened throughout the World. All nations that can do something to mitigate their problems will do so.
I do not think it will be smooth sailing and I believe that population will come down as total fertility ratios continue the decline that began in 1960. The economic turmoil will no doubt increase death rates and speed the decline in population. An attempt to mitigate the problems associated with fossil fuel depletion through energy efficiency and rapid deployment of wind, solar, geothermal, tidal, and nuclear power, could result in something more sustainable than what we have today. Such a transition will no doubt be a 50 to 100 year process.
Hi Joel and Dennis,
I think that when the public finally realizes the truth about fossil fuel depletion there will be a war footing effort made to use what is left to fund a switch to renewables.
I expect an extremely hard time economically and martial law and very possibly a police state but not a mad max scenario to come to pass sometime within the next few decades.
The fourth door is outside the time farme I had in mind when I made the above comment. It will come to pass if we choose the fossil fuel door out of the first three- which is certainly what is going to happen given our natures. But we are capable of reacting to crosses and Leviathan has proven to be infinitely tougher than Goliath- he is big guy who can be cut up in little pieces and reassemble himself alive and well in a very short time- witness the fact that there is hardly any territory on the planet under the long term control of warlords-and in essence a warlord is a king with a small kingdom.Warlord control is government too, just on a small and probably temporary scale.
Can we pull it off and actually manage a transition to renewables? The odds would seem to be against it at first glance but the Reverend Malthus did not envision pestilence, war and starvation killing people off silmantaneously all over the planet.
There is plenty of coal in the ground yet and a lot of oil and gas too and some countries are going to come thru the initial collapse due to fossil fuel depletion wounded but still on their national feet.
I cannot see any real reason – other than mismanagement or than nuclear chemical and biological war on the grand scale why a country such as the US cannot under an authoritarian government manage a transition back to a coal based industrial economy.
We are certain to get an authoritarian government.
Whether it will have good people in charge of long term planning and executives willing to implement such plans is an open question.
History indicates the odds are poor at best but not astronomically high against a favorable outcome.
A coal based industrial civilization with population control could last a very long time if it implemented strict energy efficiency and conservation standards and it could also continue to make technological progress in many fields.
Alan at the old TOD site used to point out that once a railroad tunnel was built it lasts more or less forever with maintenance.
We will not have cheap energy in a renewables powered world but we could have super insulated houses and super effficient appliances and battery powered cars that would get us around a hell of a lot better than the wagon my Old Pa used when he was a teenager to haul his own Daddy’s produce to town. He left before daylight and got back after dark in the summer time. Round trip twenty five miles.
And the horses had to be rested the next day after such a tough haul and fed every day although they were used only a day or two a week except in the spring and fall.
There is no reason in a world with a stable population even if energy constrained we could not afford to build zero energy houses- because when properly built they would last for generations.
Expensive up front like renewables but cheap as dirt over the long haul if they really do last a few centuries.
A wind or solar farm should last just about forever once constructed with the equipment being refurbished or replaced with new every three or four decades which will cost peanuts in comparison to paying for critically scarce fossil fuel for those same decades.
By the time the coal comes up short in such a civilization as this a few centuries at least will have passed .
Beyond that I cannot even guess but there will be breakthroughs in many different fields.
A few million people with high standards in terms of education might be able to maintain a technological civilization for many thousands of years based solely on hydro power so long as they were willing to make sure the barbarians would never be numerous to trouble them.
Ron, do we have price data for the CO2 KSA will inject into Ghawar?
No, I don’t have any such data and have no idea where it might be obtained.
Here you go:
May 2013:
http://www.slideshare.net/globalccs/saudi-aramco-cmeffort-may-2013
In 2013 the did a startup EOR with CO2 (see page 18):
Ghawar:
40 MMscfd
4 injectors & 4 producers
I haven’t found any more recent information, but from what I found they are just starting and need to put in a lot of infrasture before EOR can be applied broadly. They need to add CO2 plants and the piping to get to the fields. This is probably a 10+ year project (my guess)
Oct 2013:
http://online.wsj.com/article/BT-CO-20131013-701316.html
“Falih told reporters on Sunday that Aramco plans to raise light sour crude output from the Shaybah and Khurais fields by 550,000 barrels per day in 2016-2017 as part of the company’s plan to maintain its capacity, relax production from more-mature fields”
http://www.arabianbusiness.com/saudi-aramco-use-co2-boost-ghawar-oil-field-output-by-2013-383900.html
Saudi Arabia also has a so-called enhanced oil recovery project in part of the al Wafra field that aims to pump more crude by heating it underground using steam injection. That field has rerserves of about 23 billion barrels, a company official said in October.
dated 2011 to be implemented 2013
Really big reserves numbers.
The earliest mentions were in 2009. Dave Summers covered this issue in 2012: Bit Tooth Energy: OGPSS – conditions and treatments in North Ghawar
Good stuff, but I thought it was to be about steam injection.
Saudi ECI Chart, for 2002 to 2012, with extrapolation based on seven year 2005 to 2012 rate of decline, follows.
ECI = Ratio of production to Consumption
Production = Total petroleum liquids + other liquids
Consumption = Total liquids
The Saudi ECI Ratio fell from 5.7 in 2005 to 4.0 in 2012 (2013 consumption data not yet available). At the 2005 to 2012 rate of decline in their ECI ratio, they would approach an ECI Ratio of 1.0, and thus zero net exports of oil, around the year 2040.
Estimated post-2005 Saudi CNE (Cumulative Net Exports) are 3.3 Gb/year (annual net exports in 2005) X 40 years X 0.5 (area under a triangle) less 3.3 = 63 Gb.
A similar exercise for the Six Country Case History*, based on seven year 1995 to 2002 rate of decline in their ECI Ratio, put their estimated post-1995 CNE at 9.0 Gb. Actual post-1995 CNE were 7.3 Gb.
*Major net oil exporters that hit or approached zero net exports from 1980 to 2010, excluding China.
Correction: Estimated post-2005 Saudi CNE (Cumulative Net Exports) are 3.3 Gb/year (annual net exports in 2005) X 35 years X 0.5 (area under a triangle) less 3.3 = 55 Gb.
Note that Saudi Arabia shipped about 18.5 Gb of net exports from 2006 to 2012 inclusive, putting estimated post-2005 CNE about 34% depleted in seven years.
Given 18.5 of Saudi net exports from 2006 to 2012 inclusive, some Estimated post-2005 CNE (Cumulative Net Exports) depletion percentages:
Saudi Net Exports approach zero in:
2035: Est. post-2005 CNE of 46 Gb, 40% depleted in seven years (2006 to 2012), 7.3%/year depletion rate
2040: Est. post-2005 CNE of 55 Gb, 34% depleted in seven years (2006 to 2012), 6.4%/year depletion rate
2045: Est. post-2005 CNE of 63 Gb, 29% depleted in seven years (2006 to 2012), 4.9%/year depletion rate
Jeff,
FWIW, I very much doubt KSA will hold that trend line to 2030. At some point production is going to nose dive and exports will drop like a rock. My guess is that around 2019-2020 it will start falling into a tailspin, assuming KSA doesn’t get arab springed before then.
That’s what happened with the Six Country Case History. The ECI Ratio and net exports peaked in 1995, but production continued to (slowly) increase, until 1999, when they started showing a slow production decline. In any case, for the Six Country Case History, the initial seven year 1995 to 2002 rate of decline in their ECI Ratio suggested that they would hit zero net exports around 2015, but they actually hit zero net exports in 2007, because the production decline accelerated.
Yeah, KSA is more or less the same case as Russia. Tapped everything they’ve got, every production boosting trick deployed at their giants, nothing new big coming to offset depletion and opaque enough to hide problems. No free media or travel in either country.
Those two maintaining their production level is going to turn out to have come at the price of their tail. With the problems the US can expect to have once all the good shale drill sites are exhausted, one can only hope that it doesn’t make too steep a cliff. I’m not very optimistic on that front.
See, this just doesn’t smell like Occam’s Razor to me.
Gov’t employees above all else want their salaries paid and particularly their pensions paid. We should probably take a look at NoDak gov’t employment, because of all influences on things — if that number is way up then they WILL choke production.
They sheer number of influences accumulating . . . flaring excess, awareness of ZIRP drill financing, harsh winters that make it clear steady results are not possible, and vague suspicion that all is not peaches and cream in the years to come . . . all this leads them down some well rationalized path to choke production. That’s how you can get 30 years of inflation indexed pensions for state employees to fund their retirement condos on Barbados.
That doesn’t happen spiking production and letting it fall. Better they intercede now. Stretch it out. Soooo easy to rationalize those condos. “Hey, look, who says we have to get it all out now. Look at the flaring, look at our highways, and who doesn’t think price is going up. Save it until we can get $150/barrel X whatever royalty is”.
That looks a lot like Occam’s Razor.
The smart ones will be buying their condos in Quebec or maybe Maine or Vermont.LOL
I guess I could come to love North Dakota if I lived there long enough but I somehow doubt it will ever be a favored retirement destination.The people with money enough will surely leave when they can.
Procedure is relocate to South Dakota for 6 months, establish a PO Box address, and presto, no state income tax on the pension.
SoDak has none. NoDak has 3% (unless SS and pension excluded).
Where you guys been? The scientists say we have to get off carbon fuels or we will ruin our planet.
So, question- what’s the cost of oil?
Answer- everything.
That OK with you?
Wimbi
We don’t believe in all that global warming Hocus Pocus.
Stebe
Odd fact. Global warming goes on at ever faster rate whether we believe in it or not.
GW not a faith-based phenomenon.
Of course it is!
Funny you say so. All that Hokus pokus physics behind the understanding of global warming helps predict your weather, cool down your nuclear reactors, improve your gasoline makers at the refineries (FCC), design your car aerodynamics. Yet Hokus pokus right?
Sad….
Hmm. I must ask, what other science do you perforce reject? Is Biology not okay, when it points to drawbacks of having nearly extinctified the whales, or perhaps to over-grazing, or to the hasty evolution of disease-resistant critters due to the absurd use of antibiotics in bovates, or to the collapse of the bees? Many stores in America now sell honey that is not identifiable as honey, the label aside. Is Geology not okay, or perhaps like a small child you pick greedily at the oil dessert, while ignoring the less palatable aquifer draw-downs and soil erosion and other findings? What about Oceanography, the dead zones and algal blooms and acidification, also rejected, rows upon rows of blinking warning lights, all ignored? So, is it just climate science, or what? If not, where does your rejection of science begin and end?
I might suspect that such a rejection of science might stem more from the drunken fratboy model of economic development, the one where we lay to waste as many natural resources and as quickly as possible. How about Physics? There was a physicist who recently talked about the exponential function; is that also to be ignored in the lust for oil? Or, ah, gold? How about those arsenic-laced mine tailings busy killing off the only true wealth on the planet? Or are all these things to be rejected and ignored while there is so much lucre to be made?
GLOBAL WARMING WACKOS,
When there is FIAT MONEY to be made, everything else comes second. If you can’t stand the HEAT then get out of the Kitchen. That’s what I say.
Lastly, sometimes I like to be a bit sarcastic. I have been posting on Ron’s site since DAY 1. Those who know me realize I believe in PEAK OIL & CLIMATE CHANGE.
So every once in a while I bring out the CONSPIRACY GADFLY to add a bit of sarcasm to a situation that is quite GRIM if you ask my opinion.
Not only do I believe in Climate change, I believe we head into a NON-LINEAR RAPID HEATING EVENT that will even make Rush Limbaugh wanna-bes wake up and smell the Methane (blowing out of the Arctic).
GOD HATH A SENSE OF HUMOR….
Stebe
Steve,
They may have been responding to Coolreit who does not agree with you on Climate change, Euan Mearns also disagrees on this matter, though I believe his position is more nuanced, I don’t think he disputes that there may be a small level of climate change, but believes that climate sensitivity is at the low end of the peer reviewed literature.
He can correct me if I have misunderstood his position.
Dennis,
Everyone has an opinion. I realize that I am making opinions myself, so I can include that my views on rapid climate change can be complete FOS. However, the rate of change in areas such as the Arctic go above and beyond the notion that “climate sensitivity is at the low end of peer reviewed literature.”
All I can say is that we have to agree to disagree on this issue. That being said, if it is true that we do head into a RAPID NON-LINEAR CLIMATE WARMING EVENT… then those who were more conservative in their estimates get to experience firsthand the biggest BRAIN ENEMA of their life.
It’s one thing to get a Peak Oil forecast wrong by a few years, and another thing entirely to miss diagnose the climate that could become the next great extinction level event.
steve
and another thing entirely to miss diagnose the climate that could become the next great extinction level event.
Why? Wrong or right there is not one damn thing you can do about it.
Ron,
That’s correct… well done. So I gather if that is the case, then we should tell the FED to really print money so we can ramp up as much expensive oil production as we can.
If we are going to GOT OUT WITH A BANG… we might as well show the rest of the supposed more intelligent species in the Universe just how good we are at doing that.
correct?
steve
Steve, a couple of points. It really doesn’t matter what we tell the fed, they are not going to listen to a word we say.
Point #2. The money the fed prints they do not give to the oil companies. The money these most of guys use they must borrow at very high “junk bond” rates.
I am not going to show the rest of the world anything but even if I did they would not pay a damn bit of attention to me. They never have, why on earth would I think they would start now?
Hi Steve,
I do not agree with Euan’s assessment, though keep in mind that when anyone mentions climate sensitivity they usually are referring to global climate rather than local climate.
I do disagree on the rapid methane scenario, that is just the flip side of the low equilibrium climate sensitivity and pushing the high end of the peer reviewed literature, nobody knows for sure and the best guess from the majority of climate scientists is the mean estimate of around 3 C equilibrium global temperature increase for a doubling of atmospheric CO2 above 1750 levels.
James Hansen (based on paleoclimate data) think the very long-term climate sensitivity is about 6 degree C when vegetation change and abedo effects are taken into account.
Will post more on peak oil later.
Hi PE,
I am well aware of Hansen’s opinion, but it is not a mainstream view and it takes about 500 to 1000 years to reach that long term so action could be taken to reduce atmospheric carbon dioxide over such a long term, it is the ECS(equilibrium climate sensitivity) that is the most relevant metric in my opinion. And that is 3 C for a doubling of CO2 above 1750 levels (280 ppm).
Pulled a Poe. Got it. Difficult to recognized nowadays. Sorry for being so jumpy….
Go find me an electric 450 horsepower tractor.
Don’t quibble about “do you need 450”. 450 horsepower. Find it. That’s what it takes to get 10,000 acres done before planting season, and later harvesting season, is done.
Watcher it is obvious you are not a farmer. 10,000 acres is 15.6 square miles. No tractor, not a dozen tractors, is capable of that task.
Hmm. JD site says their biggest tractor can plow an acre in 5 minutes (probably in a straight line times the width of the disc harrow in the back).
Here is a cool site.
http://stuffaboutstates.com/agriculture/farm_by_average_size.htm
Those are average sizes. South Dak 1400 acres of I guess wheat or corn. That’s the SD average. One would think the bigger ones get to 10K?
Not gonna lean on Wyoming’s 3700 average. No telling if that is ranchland or farmland.
btw you’re somewhat right. It would take two JDs to do the 800+ hours of work. Around the clock, 2 weeks.
It doesn’t matter if its just 100 acres, your argument still applies. Bottom line, Diesel and Petro Agra Chemicals (Fertilizer, Pesticides) delivers food to the dinner plate. Remove Fossil fuels from agriculture, and either the worlds population needs to shrink less than 2 Billion or 60% to 80% of the population needs to become tenant farmers. Actually is probably both (less than 2B and 60-80% tenant farmers)
Looked at this some time ago. There just is no arguing with the math for a sharp population drop.
60-80% tenant farmers is a LOT of sewer systems being laid in farmland.
Much easier to ask for population decrease volunteers.
Yair . . . Watcher and others who obviously don’t have much idea about farming. . . rice is a widely consumed grain and a large percentage of the world rice crop is grown with water buffalo and millions of pairs of little brown hands and I can bloody well assure you that no sewer systems are laid in their farmland.
Cheers.
It rains a lot there, providing the enormous water requirement of rice. Rice has a lot of calories per acre, too, without requiring powered irrigation.
Hard to do that with wheat.
Watcher,
Why assume a powerful electric tractor is an impossibility?
https://mining.cat.com/products/surface-mining/electric-rope-shovels
Also worth recognizing that over forty percent of the U.S. Corn crop goest produce ethanol with it’s dismal EROI and much of the remaining corn goes t fattening cattle on feedlots.
The transition to an energy constrained world doesn’t have to replicate all the dumb choices we’ve made. We won’t have the energy to be stupid, we’ll have just enough energy to be clever and resourceful… and no more.
This was cool. Came across it searching electric mining vehicles…
http://m.youtube.com/user/PapaBravoInnovations
Check out the EV pulling a diesel pickup in deep snow!
http://papabravoinnovations.com/products/
Air quality in underground mines is highly valued. The value proposition for EVs in underground mines is based on the fact that the less combustion underground the less air that needs to be pumped deep underground to keep miners safe. CFMs require lots of electricity.
Concerning air quality, What do you mean do you mean that the air contains the right proportion of oxygen nitrogen and the one percent of all the other gases. they do too a certain extent, but if the ventilation is good it falls to second place, what mainly worries them is the amount of combustible dust in the air and that is a function of air flow. Diesel engines in mines especially coal mines is usually a non problem being large they are usually confined to the main road which are usually the main airways which have the largest airflow any exhaust gases are quickly dispersed. By the way air is not pumped underground in mines it is drawn out by massive fans.
The manufacturer explains the value of EV trucks in underground mines (potash in this case).
Video: PapaBravo Innovations
As for “Concerning air quality, What do you mean do you mean”
I mean that the underground air won’t kill the miner, immediately, or in the future because of cumulative effects. The video covers this nicely.
Powerful electric motors are common place now. A Tesla must have pretty close to four hundred horsepower considering the weight of the car and the elapsed time it can do at the drag strip.
Batteries capable of supplying them with juice for more than a few minutes have unfortunately not yet been invented however.
With the right combination of technologies which can be made to work quite well we could actually farm with a hell of a lot less diesel than we do nowadays. But cutting back on the farm itself won’t solve the transportation and packaging and storage and processing problems between the farm gate and the dinner table.
It would be possible however to run farm equipment on biofuels produced on American farms without increasing food prices very much if we had to do so.
But that leaves the fertilizer problem to be solved ; fertilizer is an extremely energy intensive product.
And it leaves the problem of drying the grain unsolved; that sucks up a lot of energy too.
Nevertheless we could eat using biofuels to farm.There is an enormous amount of energy wasted in the production of food in terms of growing food to survive versus growing food to please our vanities.
Potatoes can be delivered for a small fraction of the price of potato chips and chicken costs a quarter or less what beef costs for a very good reason- chickens are easily raised on far less food and water per pound of edible meat in the carcass.
There are good diesel engines that will run mostly on ethanol on the market using just a little diesel for ignition of the moonshine and we could easily put the ethanol we are using now in cars in tractor and combine fuel tanks by upping the fuel efficiency standards for new cars.
Unfortunately poorly drawn environmental regs prevent the import of these engines into the US.
We need not starve at least in the short to middle term as the result of oil and gas depletion- not in a country such as the US at least.
Now in a country such as Egypt where food already consumes a huge portion of a typical person’s income and they eat very little meat or highly processed food anyway…. things are going to be very very grim.
I could get you an electric tractor that would go from 0 to 100 in 3 seconds before needing to go back to the charger 😉
Hi Euan,
For large farms, electric tractors cannot work, but for smaller farms I found the following article which seems to think electric tractors might work for smaller farms (though not defined in the article, one farmer had an 8 acre farm, which is pretty small.)
http://www.eeevee.com/tractors/TNF_article.html
We could do some minor farming , the sort of stuff Americans used to the way we do things call gardening , with electric tractors.
But they are totally impractical and totally uneconomic for ” serious” work for now and are likely to remain so for a very long time.
IF you want to understand why, consider the fact that somebody is desperate enough for performance to put regenerative braking on a machine with a top speed of five mph.If you push the clutch pedal in or kick her in neutral a farm tractor will generally stop almost dead in its tracks in field conditions.With a plow in the ground it will stop inside a foot or two at the most.
Thanks OFM,
I had hoped you would weigh in because you know something about farming (quite a lot I imagine) whereas I know very little about farming.
“With a plow in the ground it will stop inside a foot or two at the most.”
And that’s why they make them with serious horsepower.
Exactly. A tractor in the field on a big farm is usually running pretty close to flat out. There is only a little work that gets done at part throttle.
The implements are matched to the size of the tractor which optimizes costs all the way around.
You want to keep the engine pulling as hard as it can with maybe just a little reserve just the same way you would want to keep the rooms of a hotel full.
A car or light truck is grossly overpowered compared to a tractor or combine or bulldozer or similar machine.
Larger trucks are also over powered compared to tractors since they usually have enough horsepower to maintain max legal speed on moderate uphill grades with a full load and therefore can run at part throttle most of the time.
Not many people will drive a car that takes a full minute to get up to the speed limit on an open highway from a dead stop but most heavy trucks take close to a minute to get up to sixty or seventy with a full load on a level road.
The biggest (legitimate) objection to cutting emissions is that imposing a cap and decreasing from there in the near-term would cost developed economies dearly and condemn developing economies to not being able to grow and advance to that level.
Imposing a declining global cap on oil consumption is harsher still than anything that has been seriously proposed for CO2 emissions. But that is a very real possibility with the extended plateau we’ve been on and HOW we’ve managed to stay on that plateau. We’re running out of tricks on oil extraction and we have already run out of major new discoveries.
If we can’t ever go higher than this, the emissions projections are going to have to be redone. But that’s probably a secondary issue at that point…
The developed countries were supposed to lead off by reducing their emissions first. They shirked their responsibility. They were too busy being rich to bother to build in any resilience.
For the Record, I am a very strong believer in anthropogenic climate change. However, and this is very important, there is nothing we can do that will have any great effect on even slowing down the process. China and India will not stop building new coal fired power plants. We will continue to burn coal until it is all gone. We will continue to burn fossil fuel until it is all gone.
I watch with amusement as people talk about “doing something” about global warming. Then I shake my head almost in disbelief and think “they really believe that shit.”
All that being said, climate change will not be the cause, or even be a great contributor, to the collapse of civilization as we know it. A minor contributor… perhaps. Civilization as we know it will collapse because of the decline of fossil energy and the destruction of the biosphere in our attempt to replace it… and of course the civil disorder that will tear at the fabric of society as economic conditions become unbearable for masses of people.
Hi Ron,
As fossil fuel depletes, prices will rise, alternatives to fossil fuels will become more competitive and may replace most uses of fossil fuels, when coal depletes to the point that it is no longer more cost effective than renewables then less will be mined.
There are places where climate change is taken seriously, not all countries are like the US in this regard.
We will continue to disagree, once society becomes aware of peak fossil fuel things will change and I know that you think it will be for the worse. I think it will be bad, but the sooner the decline begins the better.
Dennis, I think you’re perfectly correct to say that as fossil fuels are depleted, their “prices” will rise.
Eventually, of course renewables will replace fossil fuels. But will that happen at the current (already high) energy prices or at some price level that will suffocate the globa economy? That’s the question.
I believe that at a small scale, it’s possible for wind and solar etc to provide substitution for fossil fuesl at somewhat more expensive but not outrageous price levels. But at a much large scale, because of land, minerals, and storage constraints, the price level will be so high that unlimited economic growth will be impossible.
It should be pointed out that within economics, there is a lot of confusion on what “prices” exactly mean. What exactly does one dollar, or one thousand dollars, or one million dollars represent? Most modern economists no longer bother to understand that. The classical approach is labor theory of value which tries to understand “price” by the direct and indirect labor time embodied in commodities.
A similar approach could be applied in energy studies. The “price” of energy can be understood as the total direct and indirect energy required to produce one unit of energy. This, of course, is just another way to calculate the EROEI. If the “price” of energy is too high, that just means EROEI is too low.
Therefore, if renewables can only be competitive at a very high “price” (a very low EROEI) if we need it to provide an energy supply greater than, say, 10 billion tons of oil equivalent. That will not help.
By the way, while I agree with Ron for the most part on climate change, I do think that climate change will be one of the major factors contributing to civilization collapse. There is a chance that if global warming exceeds 5-6 degrees C, much of the world may no longer be inhabitable.
I think we’re likely to have the worst of both worlds. We’ll on the one hand deplete fossil fuels too fast to sustain economic growth over the 21st century and on the other hand burn enough fossil fuels to cause major climate catastrophes over the second half of the century and beyond.
The global economy runs on energy. 80% of global energy is fossil. The economy has become progressively more energy efficient over the last century, but the gains are only 1-2% a year iirc. We can probably absorb oil decline rates of 1-2% of net oil energy through efficiency and substitution with still expanding fossil sources, but beyond that, the global economy is in lock step with the fossil energy supply. Even if we expand renewables (other than hydro ) at 5% a year globally, they provide only 1-2% of energy flows now, so they will only replace 0.1% of the fossil supply each year. Too slow. Peak net fossil energy is peak global economy and peak economy will collapse the ponzi debt mountain, all major fiat currencies and international trade until trust can be restored. That may not be until after a major population decline.
Hi PE,
I am quite familiar with the labor theory of value and have read quite a bit of political economy.
What a positive outlook you have!
The EROEI is quite good for wind and solar and as fossil fuel depletes the EROEI will be better for wind and solar than for fossil fuels. If we include all the external costs of fossil fuels (switching to the more familiar subjective value used in mainstream economics) so that we take account of the risks of climate change, wind and solar become more competitive. If efficiency (real GDP per barrel of oil) continues to improve, a 3% annual rise in real oil prices could be handled with continued economic growth. Population growth is slowing down with total fertility ratios(TFR) likely to reach replacement levels worldwide by mid century, so world real GDP can begin to slow down as population reaches a peak and begins to decline.
Mark Twain wrote a sad but still hilarious scene into one of his classic novels where in the hero was transported back to medieval times and tried to explain inflation to a local citizen who could not get it thru his head that he would be worse off if his wages doubled but prices went up three times.
It is perfectly obvious to me that renewables are not going to support anything like current day business as usual but this does not in my opinion NECESSARILY mean collapse.
For one thing we have an awesome amount of built infrastructure that will last for millennia such as roads- although they will go back to gravel they will still be there if needed. After the gravel becomes too expensive they will be paved with rocks from the fields or just raked smooth when dry after heavy rains.
Lots of other stuff will last for centuries including most modern houses if they are cared for.The electrical grid – the transmission portion of it- consists of aluminum cable strung on wooden posts in by part of the world. Transformers have a life expectancy of decades only but that cable is for centuries and posts are nothing but trees. Expanding the lines may be impossible but keeping them up and serviceable is not going to be an impossible job.
I believe the generation equipment can be built using nothing but coal fired electricity and some synthetic coal based liquid fuels if necessary.
When the fecal matter hits the fan people will very gladly do without a lot of other things to pay for more expensive electricity.
The older working people in the US have spent a fortune on automobiles over their lifetimes.Given the choice between an air conditioned and heated house and a nice car the typical consumer going forward will choose a very cheap car – or no car at all- and pay for heat and air-conditioning.
Triple paned windows and a truck load of insulated vinyl siding are going to look pretty good compared to fly there and back vacation in the sun or snow once depletion really starts to bite.
Growth in the usual sense of growth as we normally understand that work is off the table for sure. Contraction is the new name of the game but at some point contraction could stop as efficiency and conservation and changing lifestyles reduce our per capita energy use and Mother Nature is going to take care of our ” per capita” problem by getting rid of most of us.
Things can reset to a new normal with a far smaller population using far less energy per capita.
From that point forward things could improve in a real sense but perhaps not by the metrics commonly used to measure growth these days.
My brother built a field stone root cellar into the hillside behind his house that will last a thousand years barring a truly nasty earthquake. If the next generation makes a similar improvement- perhaps a small pond gravity fed by water ditched from a nearby stream- there will be a pleasant new spot to enjoy a nice day outside and a few fish occasionally fort the table to boot.
I planted some old time apple trees close by that will bear fruit with very little attention for three generations of men at least.There are pecan trees now about ready to bear. He could and did build nice rustic furniture from rough sawn local lumber- furniture that brought a pretty impressive price and that will still be in use hundreds of years from now.It won’t break or wear out; it will last until it either rots from exposure or it burns in a fire.
People can have a very good time cooking a chicken or two over a wood fire and drinking some homemade wine and playing their own music or playing horseshoes. I have owned the same set of horseshoes for over fifty years and they are still just like new.
Given that they will last more or less forever it really doesn’t matter if a set of horseshoes cost a days pay or an hours pay- the per game cost will approach close enough to zero that it is effectively zero over any extended time frame.Ditto a quality chess set – a set that is a pleasure to handle and to look at.
We won’t necessarily lose the knowledge we have accumulated and we can and will eat better in many respects even if we have less variety and income.
With more exercise and less pollution and healthier food we can live as long or longer as we do now on average, and enjoy living more, without the expensive interventions such as organ transplants and major surgeries.
Now this is not a ” growth scenario ” in the usual sense of the word. But it is a pretty nice vision of the future compared to mad max.
Saudi proverb. “My father rode a camel. I drive a car. My son flies a jet airplane. His son will ride a camel.”
Anonymous Saudi Sheik – 1982
http://www.godlikeproductions.com/forum1/message432587/pg1
[…] A Closer Look at Saudi Arabia » Peak Oil BarrelPeak Oil Barrel. […]
Off Post topic….but it speaks for itself:
Tesla debt downgraded to junk status.
They are also trying to raise funds for new battery plant. Call me wrong, but I have always believed these are over priced gimmick cars. Too complicated. Unaffordable. We need extremely simple, no frills, highly efficient soultions to transition transportation into one day using renewables, or pedal power as required.
I couldn’t haul my tools around on a bike, but I sure could haul them in a 4 banger import PU which i do now, Anyway, the market speaks on this issue better than I.
http://money.cnn.com/2014/05/28/investing/tesla-junk-bond-rating/index.html?iid=HP_LN
I’ve always thought it somewhat incongruous that we had super high tech expensive electric cars, combined with crumbling infrastructure. It would I suppose be the ultimate irony if some unfortunate soul were driving his brand new Tesla across a bridge, just as the bridge failed.
Let us suppose that due to necessity we simply have to build a dirt cheap battery powered car . A car with very thin seats no carpet no electricals except headlights and taillights and wipers and the drive train. It will seat two fore and aft with room for groceries. It will go forty five mph max and if it were equipped with a very small diesel engine it would get over a hundred mpg easily at a steady forty five.
But it is going to be equipped with Tesla technology and it is going to have a real working range of sixty miles.
People say nobody will buy an electric car because they can’t take an unplanned for side trip after work and still make it home before the battery goes dead.
But those who take the bus or subway can’t take unplanned side trips either because buses and subways don’t go all that many places any way and they don’t run all that often except at peak hours anyway.
I am willing to lay a bet that such a car could be built in present day money ten years from now for no more than the cost of the cheapest gasoline powered new cars sold in most countries.
People would buy them in a flash before they would give up the mcmansion and move into a cramped apartment close to work if they had no other viable choice.
Peak oil may mean they won’t have any other viable choice.
“We need extremely simple, no frills, highly efficient soultions to transition transportation into one day using renewables”
How do people not see the simpler solution is to have fewer people?
The good Reverend Malthus was a great thinker but a couple of centuries ahead of his time – just as most peak oilers have so far been ahead of their time.
Famine and pestilence and the sword will surely be abroad on the grand scale.I don’t believe peak oil necessarily means the end of industrial civilization but it surely means the end of it on the current scale.
Shakeout Threatens Shale Patch as Frackers Go for Broke
http://www.bloomberg.com/news/2014-05-26/shakeout-threatens-shale-patch-as-frackers-go-for-broke.html
Hi Rune,
You follow the financial stuff much closer than I do. The impression I have gotten from many of your posts on the Bakken is that at present price levels and average well output(EUR) and well costs that drilling for oil should be profitable on a point forward basis. Perhaps I misinterpreted.
On a full cycle basis are a lot of the larger players in the Bakken doing very poorly or does the article conflate the shale gas producers with the LTO producers?
Dennis,
The article I posted a link to clearly describes both gas and LTO.
On a ”point forward” basis most of the wells in Bakken is doing very good and have the prospects to provide good returns.
A full lifecycle analysis (for some companies in Bakken) shows a more worrisome prospect as these now have the prospect of zero to slightly negative returns (oil price at $95/b).
I have an update in the pipeline about developments in Bakken (inclusive Montana, Elm Coulee) to be posted on Fractional Flow in the next few days. There are some interesting developments. The harsh weather this winter curtailed some production (wells shut in) and slowed the addition of new producing wells.
I posted something 1 ronpost ago on this from google’s array of CLR and EOG’s financials.
CLR is laying on debt. EOG is not.
Hi Rune,
I read the article. It talked of both shale gas and LTO, but I was not familiar with any of the companies (none of the top 10 LTO producers in the Bakken were mentioned, except Hess, but they were associated with a company that was in trouble in the Eagle Ford and had severed ties with Zaza)
My guess is the companies that are doing well will buy up the better prospects and the others will go bankrupt, not really news in the oil business as I understand it.
It seems there is not a lot happening in the Elm Coulee, is that where companies were having problems with profitability?
ZeroHedge picked up this story
http://www.zerohedge.com/news/2014-05-28/shale-boom-goes-bust-costs-soar
”So is there a limit to what excessively low credit risk premia will stand? Is there a limit to what the market will bear? It seems so… but the day of creative destruction in America appears to be over as nothing has consequences. The best case sceanrio is some major shakeout in the “black gold” rush, leaving stronger sustainable companies non-reliant on ultra-low interest rates to maintain their business model (or else energy prices must soar to maintain these companies)… be careful what you wish for from the Fed.”
anybody got any ideas whay the saudis are supporting neocon shenangigans in syria?
it’s kinda interesting…
first, putin probably saved the saudis bacon by repossessing russian oil from the russian neocons… the neocons were depending on russian oil to tide them over while they rearranged the middle east oil patch, but by neocon lights, russia became an unreliable supplier once the oil left russian neocon control
…and then putin turns around and gives obama an excuse to put off the invasion of syria… which kinda works against saudi interests… saudi needing stability in syria so pipeline can be built frin tge gulf to the med
meanwhile, enduring turmoil in syria and iraq are just what the doctor ordered for israel, and while everyone jplayed up the supposed “alliance” between saudi and israel, saudi and israel have different goals for the end state in syr;ia…
for instance, what happens if israel gets its war with iran before pipelines can be rebuilt through syria? …so israel wants enduring turmoil, saudis want stability
regime change is necessary in syria to install a regine that will knuckle under to neocon/israeli demands, which include permanent israeli possession of syria’s golan heights
i mean, how you gonna deal with global warming and sea level rise if you dont own the heights, fer cryin’ out loud?
.
and now maybe they’ve decided to save the iran war for the grand finale…
we dont know yet how the cold civil war in the US is gonna turn out… but the american siloviki have a lot rougher row to hoe than the russian siloviki did when they installed putin
it anyone’s gonna salvage the situation, it will probably be the big oil companies, who probably wont see much sense in wrecking the world to humor infantile neocon fantasies of global hegemony
but those pipelines through syria make a lot of sense… they’d bypass the hormuz, bab el madeb and suez chokepoints, eliminate a long tanker trip around africa if the oil’s headed west on a VLCC that’s too big for suez…
and those big tankers burn almost a hundred tons of oil a day
what we need here is a little common sense, but i spose comon sense, like justice, is out of the question, isnt it?
From Electric Power Monthly, on megawatts of Electricity Generating Summer Capacity, when looking at net change January-March 2014, the US actually reduced total electricity generation capacity.
+1224 MW Renewables (put on line)
-2041 MW Fossil Fuels (taken off line, mostly coal and petroleum liquids)
-128 MW nuclear (taken off line)
Of course this is all just tinkering at the margins of total US electrical generation capacity of 1,064,382 MW. In the next twelve months 13,334MW of capacity additions are planned. However, very little of the fossil fuel capacity additions previously planned for Jan-March of 2014 actually happened. (Maybe higher nat gas prices had something to do with it?)
The US seems to be in some kind of near stasis on the electrical front. If we put effort into efficiency and waste reduction (we arguably waste/squander 50% of our electricity compared to other countries with comparable standards of living) we could possibly continue a few years with no net new capacity, but our grid needs updating since 70% of our transmission lines and power transformers are over 25 years old and much of it needs significant upgrades to withstand more frequent, severe weather events. (Estimated cost $25 billion/year for these upgrades, not all that much in large scheme of things.) Medium-term if we want to transition to heat pumps to replace natural gas for space heating, electrolysis to replace natural gas in fertilizer production and electrified rail to replace diesel/trucking for freight and private intercity travel (I don’t see private electric cars being widely adopted near or medium-term–bicycling, transit and people moving out of decaying, far-flung suburbs to walking distance of goods and services are more likely) we will have to add net new electrical capacity at some point. We have a lot of work ahead of us.
http://karenlynnallen.blogspot.com/2014/05/the-great-transition-welcome-to-decade.html
nice job Karen. I think you are too optimistic, but I appreciate the optimism.
US electricity generation.
Behold, economic decline.
The “conventional thermal” includes nuclear
We would be making a real Three Stooges Rube Goldberg level mistake if we try to make fertilizers (meaning nitrates) by electrolysis for so long as natural gas is still available and still being burned to generate electricity.
At some point in time it may be necessary to go the electrolysis route but we will never get nitrates in the quantities we need them that way due to the high costs.
We aren’t going to feed nine or ten billion people without natural gas as the nitrates feedstock.When it is gone or too expensive ENOUGH of them will starve to balance the books .. unless something else gets them sooner.
HI OFM,
What about using human waste as fertilizer? It seems that in the face of natural gas shortages (and very high prices) that this would be technically feasible. Send the stuff to a fertilizer factory and they can process it into something that is usable by the farmers.
Trucks!!
The potential is enormous but the political and economic considerations are staggering.
You can read ” Farmer’s of Forty Centuries” free online and I strongly urge anybody interested in sustainability to do so.
The question boils down to social acceptance and costs.
My personal opinion is that when other alternatives become more costly and food is getting scarce and prohibitively expensive that we will be using plenty of human wastes in farm operations. But I really don’t have any firm idea how far down the road this might be . Sometime after peak oil and gas start to pinch really hard.
The costs of processing it and distributing it are so high that it won’t happen on a large scale until natural gas and phosphate rock deposits and such are much worse depleted than at present.
It might be possible to eventually use wind and solar power to manufacture limited amounts of nitrates since transporting them is not too energy intensive and the manufacturing plants could be built almost any place the wind and or solar resource is excellent.
I don’t know hardly anything at all about the actual manufacturing plants but if they will run intermittently without excessive problems then I suppose we will have some fully synthetic nitrates.
Phosphorus and potassium are going to have to be recycled eventually, there is no way around that.
A fairly large city with a source of irrigation water could grow most of its own food within a hundred miles or so if the land is available and the climate good with humanure .
You can really make things grow like crazy with plenty of water and manure of almost any kind and lots of sun and warm weather.
The soil in this scenario hardly even matters so long as there is some to work with.
The one thing we will not do is move the people back to the land in a country such as the US.
I just don’t believe it could be done under any circumstances.
Switching to a renewables based economy would be a piece of cake compared to trying to move a couple of hundred million city folks to non existent rural housing and forcing them to become subsistence farmers.
So- if the manure dispenser positioned at the end of the digestive tract can’t be relocated to the land then it’s output will have to be – sooner or later.
Is Canada headed for a pipeline bubble?
Will the TransMountain pipeline expansion still be needed if the world takes significant action on climate change?
Andrew Leach, May 27, 2014
Andrew Leach is the Enbridge Professor of Energy Policy at the University of Alberta, where he teaches courses on energy markets, energy investments and environmental policy. Leach’s primary research areas are climate change policy, oil sands regulation and clean energy innovation and policy.
The North Sea’s decline is a problem for the whole of the UK, not just Scotland
Nick Butler | FT.com | May 28 06:00
Pieter Schelte decommissioning platforms
http://www.youtube.com/watch?v=Lv4h7UPZCG4
.
peitre schelte is also scheduled to lay the south stream pipe
http://www.youtube.com/watch?v=Dc2i06331qQ
.
.
there’s something very sad about all this
Talisman’s North Sea assets keep stock price adrift
Jeffrey Jones and Carrie Tait, CALGARY — The Globe and Mail, Published Monday, May. 26 2014
The answer to that is support Scottish independence. Then it’s their problem.
Something Is Seriously Wrong on the East Coast—and It’s Killing All the Baby Puffins
Disappearing puffins, stray whales, invading sailfish: The North Atlantic is in a bad way. Here’s why.
—By Rowan Jacobsen, Mother Jones, May/June 2014 Issue
James Lovelock has written extensively about how important cool north Atlantic water temps are for phytoplankton growth, and how GW would lead to higher ocean temps that would decimate the food chain, from small to the largest species. Guess it’s just another step in this extinction event.
I did a Hubbert Linearization analysis of Saudi Arabia’s crude oil (include leased condensate) using EIA monthly data.
Saudi Arabia’s cumulative production up to December 1999 was 89.4 billion barrels and up to December 2013 was 135.0 billion barrels.
The trend from January 2000 to December 2013 points to an utlimately recoverable amount of 302 billion barrels (R-square 0.491).
That trend won’t hold. As they are using lots of horizontal drilling to maintain production. They are sweeping up the last of the oil trapped in pockets. The problem with HL is that its based upon production and does not include any modeling for newer Tech that postponed production decline, but at a cost of much severe depletion curve. If Horizontal drilling and other advanced recovery methods used production would have declined close to a decade ago. KSA started Horizontal drilling I around 2006 , if I recall correctly, to offset declines.
Thanks. I just want to show what the current trend indicates. Let’s see if the trend holds in the coming months.
Hi PE,
You should try it on an annual basis, rather than monthly, that is the typical method.
Also you should show all data from 1990 to 2013 so people can see that 2000 looks like a logical starting point for the HL. I did that in the chart below, an earlier starting point such as 1995-2013 reduces URR to 250 Gb, but to my eye the data bends at about 1999-2000 and your choice of 2000-2013 is best in my opinion.
A big problem with HL is that these choices (where to start the trendline) are rather arbitrary. Chart below.
Dennis, thanks for the nice chart above. About the annual data, I am sure you know that I did it already in some of the previous posts and in the guest post you kindly invited me to put together.
I agree with you HL analysis can be arbitrary. The fun part is to see how the trend can be updated when a new round of data come in. In the process, you develop a better understanding.
I guess the advantage with the monthly data is that now I can update it every month in stead of waiting for EIA or BP for an entire year.
Again, by trying different methods, hopefully we can move a bit closer to the underlying truth.
Hi PE,
I believe your previous annual analysis was for C+C+NGL, the above analysis was for C+C only.
The current trend suggests that Saudi Arabia will stay on a high plateau from now to the end of 2020.
The trend indicates a theoretical peak in August 2018, with a peak production level of 9.8 million barrels per day. The currently observed peak was in August 2013, with a production level of 10.2 million barrels per day.
“The current trend suggests that Saudi Arabia will stay on a high plateau from now to the end of 2020.”
Possibly, but for many years on the oil drum and other websites on the topic, there have been innumerable projections of an projected date for SA oil descent, none of which turned out to be correct. I’ve since stopped wondering if they may be right and will just wait patiently to see what happens. I’m at the same point too with Russia which has also bucked dire predictions. When these countries see the writing on the wall of an imminent descent, they somehow keep coming up with new sites to draw from or employ infield drilling. That’s human nature to scramble around to find ways to keep things going. I’m sure both countries will eventually descend from a peak, but when? – who knows.
But CNE (Cumulative Net Exports) depletion marches on.
As noted up the thread, the Saudi ECI Ratio* fell from 5.7 in 2005 to 4.0 in 2012, despite a small increase in production relative to 2005. Based on the seven year (2005 t0 2012) rate of decline in their ECI Ratio, I put estimated post-2005 Saudi CNE at about 55 Gb (total petroleum liquids + other liquids), with 18.5 Gb having been shipped from 2006 to 2012 inclusive. Saudi net exports have (so far) been below their 2005 annual rate of 9.1 mbpd (through 2012).
Based on the 2007 to 2012 rate of decline in the Russian ECI ratio, I estimate that post-2007 Russian CNE are about 72 Gb (billion barrels), with 13 Gb having been shipped from 2008 to 2012 inclusive, implying that Russia shipped about 18% of post-2007 CNE in only five years (through 2012). Russian net exports have (so far) been at or below their 2007 annual rate of 7.2 mbpd (through 2012).
As also noted up the thread, a similar estimate for the Six County Case History**, based on the seven year (1995 to 2002) rate of decline in the ECI Ratio, proved to be to optimistic. The following chart shows normalized production, net export, ECI and remaining post-1995 CNE by year for 1995 to 2002 (1995 values = 100%). As I have previously noted, as their production increased slightly from 1995 to 1999 (by 2%), they shipped 54% of post-1995 CNE.
*ECI Ratio = Production to consumption ratio, production = total petroleum liquids + other liquids (EIA) or total petroleum liquids (BP), consumption = total liquids
**Major net exporters that hit or approached zero net exports from 1980 to 2010, excluding China
And a similar Saudi slide, showing actual normalized values for production, ECI Ratio and net exports, and estimated* remaining post-2005 CNE by year.
*Based on 2005 to 2012 rate of decline in the Saudi ECI Ratio.
I wouldn’t pay much attention to monthly production estimates. In addition to the overall data quality issues, reported monthly production numbers are distorted by inventory changes.
Following is what the EIA shows for annual Saudi C+C production for 2002 to 2013. Note that 2012 and 2013 just barely exceed the 2005 rate of 9.6 mbpd, and the average production rate for 2006 to 2013 inclusive was 9.1 mbpd. At the 2002 to 2005 rate of increase in Saudi C+C production, they would have been at about 18 mbpd in 2013.
Ron can weigh in on his opinions regarding the data quality issues, but I would put the uncertainty regarding Saudi production in at least the 3% to 5% range.
In any case, the bottom line is that 2005 marked, at a minimum, a major inflection point in Saudi production.
Annual Saudi C+C Production (EIA):
2002: 7.6 mbd
2003: 8.8
2004: 9.1
2005: 9.6
2006: 9.2
2007: 8.7
2008: 9.3
2009: 8.3
2010: 8.9
2011: 9.5
2012: 9.8
2013: 9.7
Hi Jeff,
Yes there was no significant rise in production, and ELM may prove correct if we assume your 6 country case matches the world.
There have been people that thought that Saudi decline was imminent back in 2006, Ron may be correct this time, eventually Saudi Arabian oil production will decline. In 2007 it was believed that the other fields in Saudi Arabia such as Manifa could not offset the declines from the older fields such as Ghawar.
Many at the Oil Drum had a lot of faith in the ability of Hubbert Linearization to indicate a likely URR, and in 2006 the expected URR for Saudi Arabia was 186 Gb with 2005 cumulative output at 58% of the URR (2005 was the expected peak with declining output to follow.
Using the current HL for Saudi Arabia with a URR of 300 Gb (I don’t think this will be correct, I think there are better ways to estimate URR) and 58% cumulative output as the likely peak we would arrive at the peak around 2024.
Using a lower URR of 250 Gb and assuming 58% of cumulative output will be the peak would mean another 10 Gb of output to reach the peak which would be 2016.
So one possible estimate for Saudi peak would be 2016 to 2024.
If we assume the peak will be at 50% of cumulative, then if URR is 250 Gb peak should have been 2011, if URR is 300 Gb, peak would be expected in 2017, the average of these two cases or 2014 would match Ron’s forecast. I would give a range of 2014 to 2020, with 2017 as a best guess based on HL. There has been a tendency for HL to underestimate the URR (based on 2006 estimates).
Again I do not think 2024 is likely, but there is the possibility that the plateau that began around 2003 for Saudi C+C output may continue for another 2 to 5 years, or Ron may be correct and the HL may be wrong.
Chart below showing a 2006 HL plot by Sam Foucher.
Of course, the ELM, or what I call “Net Export Math,” is an irrefutable mathematical observation. Production declines in net oil exporting countries are inevitable, and given an ongoing production decline in a net oil exporting country, unless they cut their consumption at the same rate as the rate of decline in production, or at a faster rate, the resulting net export decline rate will exceed the production decline rate and the net export decline rate will accelerate with time.
In any case, the Global (2005 Top 33 Net Exporters) data for 2005 to 2012, shown below, look remarkably similar to the 1995 to 1999 Six Country data, i.e., a 2% increase in production, with declining net exports and a declining ECI Ratio. The Top 33 post-2005 CNE values are estimated using the 2005 to 2012 rate of decline in the Top 33 ECI ratio, but as noted above, the estimation method was too optimistic for the Six Country Case History.
A difference for the world case is that oil prices are likely to behave differently than in the 6 country case, when oil prices rise behaviors change. For example, the exporters may stop subsidizing oil to the same extent and consumption growth may slow down or even reverse. In fact as National Oil Companies get more and more of their revenue from domestic consumption they will need to raise domestic oil prices or will no longer be able to invest in oil production.
The dynamics of the World case will be very different from the 6 country case especially as net exports approach zero.
So what is your estimate of when World net exports hit zero, if you assume that the world behaves the same as the 6 country case (taking into account the overoptimistic initial estimate and apply the error to the World case)?
Based on the 2005 to 2012 rate of decline in the Top 33 ECI Ratio, they would collectively approach zero net oil exports around the year 2071 (2005 + 66 years). But IMO a focus on the endgame is misplaced, because the biggest volumetric depletion in post-export peak CNE tends to be early in the decline phase. A rough, but consistent rule of thumb suggests that about half of post-export peak CNE are shipped about one-third of the way into the net export decline period.
And rising oil prices also tend to offset volumetric declines in net exports, resulting in stable to rising cash flows for many net oil exporters, at least initially, even as net exports decline–which will make it difficult to curtail consumption. But again, given an ongoing production decline, unless a net oil exporting country cuts their oil consumption at the same rate as the rate of decline in production, or at a faster rate, it’s a mathematical certainty that the resulting net export decline rate will exceed the production decline rate and that the net export decline rate will accelerate with time.
Denmark is a case history of a net oil exporter, showing a production decline, that taxes fuel consumption and that has successfully cut their consumption. Denmark’s 2004 to 2012 rate of change numbers (EIA):
(P = Production, C = Consumption, NE = Net Exports.)
P: -8.0%/year
C: -1.9%/year
NE: -18.7%/year
ECI Ratio (P/C): -6.0%/year
In Denmark’s case, their 2004 to 2005 net export decline rate was 4.5%/year, while their 2004 to 2012 net export decline rate accelerated to 18.7%/year.
In simple percentage terms, a 47% decline in production from 2004 to 2012 resulted in a 78% decline in net exports, even as consumption fell by 14%.
IMO, the major weakness of the HL method is that it can’t “see” undeveloped plays and major shut-in oil fields, but I think that it does a decent job of estimating URR production from developed producing areas and as such, I think that it’s a decent tool for predicting major inflection points in production.
And I think that, at a minimum, Sam (and I) nailed a major inflection point in Saudi production, given that their C+C production increased by 2 mbpd, from 7.6 mbpd in 2002 to 9.6 mbpd in 2005, in response to a doubling in annual Brent crude oil prices, but they averaged only 9.1 mbpd for 2006 to 2013 inclusive, as annual Brent crude oil prices doubled from $55 in 2005 to the $108 to $112 range in 2011 to 2013–although 2012 and 2013 production was slightly in excess of the 2005 production rate.
In a similar fashion, I think that Deffeyes nailed a major inflection point in global C+C production, and as we have discussed, if we subtract out estimated condensate production, it appears likely that actual global crude oil production has not yet materially exceeded the 2005 annual rate.
In both cases, Saudi Arabia and globally, average C+C production, rounded off to two significant figures, has not yet exceeded the 2005 annual rates. As I said, at a minimum, these are major inflection points.
Always helps to read what I wrote:
In both cases, Saudi Arabia and globally, average C+C production, rounded off to two significant figures, has not yet exceeded the 2005 annual rates. As I said, at a minimum, these are major inflection points.
Saudi 2005 C+C: 9.6
Average for 2006 to 2013 inclusive: 9.1
Global 2005 C+C: 74
Average for 2006 to 2013 inclusive: 74
As annual Brent crude oil prices doubled from $55 in 2005 to the $108 to $112 range in 2011 to 2013, versus large production increases in both cases as annual Brent crude oil prices doubled from $25 in 2002 to $55 in 2005.
Hi Jeff,
That is a pretty strange way to do the comparison if you are going to compare apples with apples you would need to compare the average C+C output for 2006 to 2013 (8 year period) with the 1998 to 2005 average C+C output. You really have to do some contortions to get 2005 as your peak (or inflection point.) Also note that in 2005 Deffeyes was talking about the peak, not about inflection points.
The 2005 “peak” was exceeded on an annual basis in 2012 and 2013 for both the World and for Saudi Arabia. The average world output for the 8 year period up to and including 2005 was 69 million b/d. We could take 2005 to 2008 (74 MMb/d avg) and compare with 2010 to 2013 (75 MMb/d avg), leaving out 2009 (first time since Great Depression that World Real GDP actually contracted).
I agree that there was indeed a change in 2005 as growth in oil output slowed, and I also agree that output will decline at some point.
I would caution against making bold predictions as some have done in the past about decline in oil output arriving next year. Deffeyes seemed pretty confident that he had nailed the peak in 2005, he was wrong.
Another issue that we might want to consider is how we define a plateau.
Hirsch as uses 4% as the limit to where the plateau ends. I have always interpreted this as 4% below whatever the maximum 12 month average output has been over the course of the plateau. I also would be looking for the 12 month average C+C output to fall below this maximum level.
Currently the maximum 12 month average C+C output has been 76 MMb/d and 4% less than this would be 73 MMb/d. When we round to two significant digits we have been on a plateau by the 4% definition since 2004 with average 12 month output between 73 an 76 million b/d.
So that we don’t jump the gun on declaring that the decline has arrived, we might want to agree that until average 12 month C+C falls below 72.5 million b/d (because this would be rounded to 73 MMb/d) that we are just continuing the plateau that started in 2004 (I have used 12 month trailing averages). Or we could look at 8 year averages 🙂 , but I think we want something that will move a little more quickly. Chart with trailing 12 month C+C averages from Dec 2004 to Dec 2013 below.
Hi Dennis, Jeffrey,
I think it would be better if the global oil production per capita would be more closely followed. Although it is sometimes mentioned, the per capita numbers are shown much less often, while probably few will argue that they are less important. Given that oil consumption is subsidized in many oil exporting countries, and their limited population, I think an even more important metric is the available oil in importing countries per capita. That shows the average oil available to most people on earth. It’s not so difficult to track that number, so I wonder why even on this site we see a focus on the former one. That also will halt all the discussions about the exact peak. It was in the past.
Enno,
“available oil in importing countries per capita” Really? Who has this information? Frankly, I don’t even know what this means; isn’t oil a global commodity? What is the available oil in the US or the UK, for example. Perhaps you mean indigenous supply?
Doug
Doug,
That was not so clear indeed. With “availabele oil in importing countries”, I meant global oil production minus the oil consumed in oil exporting countries. That is a single metric. Makes sense?
Enno I would very much like to see per capita data graphed, gross or importing countries only.
Per capita measures are a way to add the population issue directly into the resource issue. For example here is a recent US VMT chart from dshort.com , per capita:
/Users/patrickreynolds/Desktop/US VMT 2014.gif
http://usa.streetsblog.org/2014/05/28/while-the-economy-grows-americans-continue-to-drive-less/
Hi Patrick,
Not really what you are looking for, just oil output per year per capita.
Thanks Dennis, exactly.
Given that all oil is used directly by, or in the service of people, who would disagree that this is the more important metric to follow? I see the other one I mentioned as a slight enhancement, which however needs a bit more explanation.
Another nice graph will the per capita spend on this oil.
So, now that it is undeniably clear that the peak is behind us, the world economies are hurting by the ever increasing cost of the remaining oil, it’s time to ponder what we’ll do about it.
Well, heavens, clearly you just have to have a talk with China and India and ask them if they really need to live the American lifestyle or GDP (more the GDP than the lifestyle) fueled by 16 mbpd. If they say yes, you just have to talk to them some more. Eventually they will agree to accept a lesser life.
http://mazamascience.com/OilExport/
Dropdown China and India. Look at those lovely black lines.
Read this carefully:
Great Wall Motor (2333) Co., China’s biggest maker of SUVs, tumbled the most in more than five years in Hong Kong trading today after pushing back sales of its flagship Haval H8 vehicle for the second time this year.
The company, led by billionaire Chairman Wei Jianjun, said yesterday it suspended sales of the H8 after customers reported hearing “knocking noises” in the transmission system when driving at high speeds.
haha They drive SUVs at high speeds. Very green of them.
That black line is not going to flatten. If those 1.2 billion people want to consume oil like Americans, or better (why, after all, play for a tie), we’re talking about needing another 50 million bpd, and let’s not make extreme demands.
Any time within, say, 18 months will suffice.
I can guarantee you, that black line is going to flatten.
Sure, there will be more waste. Sure, the incentives to reduce waste will increase.
One thing we can do immediately about this is to track the right metrics, and communicate about them, especially whenever another peak oil discussion comes up. There are too few “Peak oil has passed” articles, while, as Dennis showed, the peak consumption per capita was at least 20% higher than the current one, and more than 30 years ago. The trend doesn’t really improve, while the spend on oil is ever increasing (per capita & overall).
Hi Enno,
The important metric is oil spending per dollar of real GDP, we could do that on a per capita basis as well. I may come back to this later. Note that Over the 1980 to 1983 period output per capita dropped by 5% per year, this was in response to a spike in prices which sent the economy down the tubes. Prices dropped and stayed pretty low until 2005 then we had a run up in prices followed by a sharp drop and then a rise to stable levels over the last couple of years.
When the decline hits oil prices will rise and another recession will result (if they rise quickly), oil consumption per capita will have to go down. The decline in oil per capita has been so slow since 1988 (about 0.3% per year from 1988 to 2009 on average) that it has been imperceptible.
Thanks Dennis, yes this is essentially a measure of oil intensity. And what a stubborn line it is to move!
I agree that China and India will not continue their oil consumption growth of recent decades, and the west will continue to shed theirs. Price will drive it. And we are surely due price growth; it feels like pressure is building at the 100/110 USD point despite traders and industry’s repeated predictions of lower prices.
The response from the public having been feed the abundance story will be of conspiracy again. Flat to falling Russia and/or Shale production will eventually break through the discourse though surely?
Agree with Enno that per capita charts are best way to illustrate sustained or rising price.
Ya, get a graph for China and India, too.
Then send the Green people to Beijing and Mumbai and have them explain that Chinese and Indians will be entirely content and happy and have a better life than Americans if they just accept they will never have GDP at US levels. Those Green folks can explain the joys of lower GDP and consequent tax revenue that funds the well being of local welfare recipient, or recipient wannabes.
After China and India agree to let their poor continue to die at age 47 for lack of GDP or tax funded healthcare, then the Green folks can return to America and find joy in knowing those China and Indian consumption graphs are now flat forever.
Enno,
Yup, got it. Thanks.
Doug
Hi doug,
I think Enno’s point is a good one, though you are correct that the number would be more difficult to track. If I under stand him correctly, I believe that he would deduct the oil consumed by oil exporting nations from total production. It would probably be simpler to just do per capita oil output and this was definitely in the past, though I am not sure when it occurred because I don’t track that I watch C+C output.
I looked at this very quickly. Barrels per person fell from 4.9 in 1980 to about 4 in 1993 and then was on a plateau until 2008 at between 3.97 and 4.16. In 2008 b/person was 4.03 and has fallen to 3.91 b/capita in 2013, the low point from 1980 to 2013 was 2009 at 3.90 barrels per capita. All of these are barrels per year per person. I took annual C+C annual output in BBO and divided by world population in billions. For comparison, US consumption is about 17 barrels per person per year assuming 15 million b/d C+C input to refineries and 318 million in US population.
Dennis,
Fair enough, I just didn’t understand what Enno meant. It makes sense to me now.
Any suggestions, recommendations or attempts at making things more accurate, representative, understandable and so forth is appreciated.
Tip of the hat, incidentally, to those fleshing out this kind of info and offering commentary regarding it, its associations and implications, etcetera.
Hi Jeff,
I think you are wrong about World C+C based on EIA data. In 2005 annual world C+C was 74 million b/d in 2013 it was 76 million b/d.
Also Saudi Arabia has exceeded the 2005 annual rate
2005 C+C= 9.6 MMb/d
2012 C+C= 9.8 MMb/d
Your estimate of World condensate output may or may not be correct, but Deffeyes was estimating the peak in C+C production not crude only. His estimate was based on a World URR of 2000 Gb, currently Jean Laherrere’s estimate for World C+C (including extra heavy oil) is 2700 Gb. An HL using EIA crude plus condensate data for 1994 to 2013 is 2600 Gb, less than Jean Laherrere’s estimate, but Jean uses creaming curves and discovery data to get a more reliable estimate, he does not rely on the Hubbert linearization technique alone. HL Chart below.
The sum up the last few posts:
(1) US tight oil may be peaking within a few years
(2) Russia may be peaking right now
(3) Saudi Arabia may be peaking right now
These are the three biggest oil producers in the world at the moment. Who’s going to make up for the short fall:
(1) Canada and Irak? probably not enough t make up for the decline of the top three
(2) Brazil? not likely
(3) Kazakhstan? this ones questionable
(4) Venezuela, Nigeria, Angola? no
(5) The rest of the middle east? not a chance
Well it’s not just making up for these three countries, it’s all the other countries that are in decline. Below is a graph of all the world’s geographical areas except North America and the Middle East. The combined production of Eurasia, Central and South America, Asia & Oceania, Europe and Africa peaked in January of 2011 and are down 2.4 million barrels per day since then.
Of course Russia is included in this chart, Eurasia which is basically the Former Soviet Union. But even with the slight increase in Russia the group as a whole are in decline and will now decline much faster now that Russia has peaked. I don’t think there is any doubt about it, we are sitting on the peak of world oil production right now.
Ron,
Of course, while production declines (or remains stable) internal consumption keep increasing: Especially in Saudi Arabia and Russia. This is an important point in Jeff’s commentary but not always present in other discussions. The last time I looked the Saudis were using about 25% of their production internally.
Doug
The observed 2005 to 2012 rates of change in (2005) Top 33 Net Exporters’ ECI Ratios (Ratio of production to consumption). Here’s out global net export supply base, by country. 26 of the (2005) Top 33 net exporters are trending toward zero net exports (when their ECI Ratio would be 1.0, i.e., production = consumption).
Great chart and excellent point. I agree we are on the cusp of peak oil also!
Hi Frugal,
All of these peaks may be just around the corner. How quickly will output decline?
There are many who think it will be dramatic, if that is not the case the decline in Russian and Saudi Arabian oil output may be offset by rising production from Brazil, US, Canada, Iran, Libya, or Iraq. A plateau might be maintained or the decline in World output might be gradual at first, it would be better if it were more dramatic so we would get off our collective butts and try to work on a plan B, unfortunately the gradual World decline is the more likely scenario.
If I am correct there may still be an increase in oil prices which may get thing moving in the right direction (greater energy efficiency and investment in alternatives to fossil fuel).
nobody’s willing ot admit that the so-called Pland A response to peak oil was a military response
why is that?
.
well, maybe that’s pretty easy to figure out, too… if peak oil was the reason the boys and girls at PNAC needed a new pearl harbor, and was the reason their new pearl harbor happened after they got powerful enough tot make it happen
i mean, if you committed the worst terrorist false flag in memory in response to peak oil, you’re probably gonna deny the existence of peak oil, arent you?
what we need here is a gentleman’s agreement with ladies’ auxiliary…
“we will rigorously persue the truth and examine every jot and tittle of oil production statistics… we will be fanatically honest and painstaking in our rpeorting and we will use the most reliable information to make our predictions, and we will make predictions and projections til they’re coming out our goddamned ears,..
“but we will not, on pain of excommunication,, face the basic truth”
“iwe swear to god… or whatever passes for it”
“amen and pass the ammunition”
Excellent points and note that the largest oil producer in the world, Russia has had declining oil production for 4 straight months now. In addition, over the weekend, Russia’s largest oil company Rosneft signed an agreement with Seadrill’s NADL to intensify the search for oil by exploring the Arctic. Until this point, Rosneft had focused nearly exclusively for oil resources on land. Why the switch to the most expensive, difficult and dangerous oil exploration in the Arctic?
Also, note the true nature of shale:
US Shale Debt Increases as Drillers Push to Maintain Gains
by Robin Dupre|Rigzone Staff|Wednesday, May 28, 2014
change text size
Printer Friendly Version
Email this Page
Save to Favorites
More
Share: Facebook Twitter Google+ Reddit
Article title
Companies are spending more money and drilling more wells causing shale debt to double over the past four years.
Shale debt has reportedly doubled over the past four years, according to a Bloomberg News analysis of 61 shale drillers, while revenue has increased just 5.6 percent. Many are spending at least 10 percent of their sales on interest compared with Exxon Mobil Corp.’s .1 percent, the news agency reported.
As the struggle to keep pace with the increased spending is needed to unearth these resources, some investors are selling their assets at a loss. Loews Corp. subsidiary, HighMount Exploration & Production, announced May 23 that it is pursuing strategic alternatives, including a potential sale of the business. HighMount, primarily comprised of natural gas and oil reserves, has assets in the Sonora field within the Permian Basin in West Texas. The company reportedly lost $20 million in the first three months of 2014 and was not profitably successful over the past two years.
“The list of companies that are financially stressed is considerable,” told Benjamin Dell, managing partner of Kimmeridge Energy, a New York-based alternative asset manager focused on energy, to Bloomberg. “Not everyone is going to survive. We’ve seen it before.”
Financial problems might stagnate production growth, according to Ivan Sandrea, an Oxford Institute for Energy Studies (OIES) research associate and senior partner of Ernst & Young London. Fifteen of the main operators have wrote off $35 billion worth of assets since the shale boom started.
“What is not clear from higher-level company data is if the industry (both large players and independents) can run a cash flow-positive business in both top-quality and in more marginal plays and whether the positive cash flow could be maintained when the industry scales up its operations,” he noted.
“While most of the companies that have made write-downs are not quitting, many players in this industry have already noted that the revolution is not as technically and financially attractive as they expected,” the analyst writes. “However, to deem the [business] model flawed due to the investment write-downs of some large companies would be misleading and too early in the evolution of the business for some players.”
Furthermore, independent producers will spend $1.50 on drilling this year for every dollar in return, Bloomberg noted in February. Producers will have to drill 2,500 new wells a year just to sustain output of 1 million barrels per day in the Bakken, according to International Energy Agency.
Recent analysis by Energy Aspects show 6 years of progressively worsening financial performance by 35 independent companies focused on shale gas and tight oil plays in the United States.
“This is despite showing production growth and shifting a large portion of their activity to oil since 2010, presumably to chase a higher-margin business,” he added. Oil and gas production by the companies represented 40 percent of output in unconventional plays in last year’s third quarter.
– See more at: http://www.rigzone.com/news/oil_gas/a/133303/US_Shale_Debt_Increases_as_Drillers_Push_to_Maintain_Gains/?all=HG2#sthash.MVLASmWt.dpuf
1. Canada, maybe another million over a decade if they expand production aggressively. Iraq is a huge question mark between the security issues and what their reserves actually are.
http://www.businessweek.com/news/2014-05-27/iraq-oil-revival-stalls-again-as-violence-pinches-growth-energy
2. Brazil can’t produce what they could on paper because of real world problems. Both geologic/tech and political:
http://www.csmonitor.com/Environment/Energy-Voices/2014/0507/How-Brazil-s-oil-boom-went-bust
3. Kazakhstan? Forget about it. Kashagan just got delayed another two years. It might not get up and running at 1m+ bpd until 2020 at this rate.
4 &5. Yeah, all of those are in serious decline and/or too small to matter when we’re talking millions of barrels of legacy “cheap” oil being replaced with US shale and Canadian tar sands. No one has spare capacity. Venezuela shouldn’t be in decline, but their political problems are unsolvable.
Now let’s look at Russia again. The HL analysis using EIA monthly data of crude oil and leased condensate for the period Jan 2004-Dec 2013 indicates an ultimately recoverable amount of 497 billion barrels (R-square 0.477).
I assume that Russia’s cumulative production of crude oil up to the end of 1991 was 102 billion barrels (based on Aleklett’s estimate that Russia’s cumulative production up to 2010 was 155 billion barrels). Given the assumption, the cumulative production up to the end of 1999 was 120 billion barrels and up to the end of 2013 was 166 billion barrels.
The current trend indicates that Russia’s crude oil production will grom from 10.1 million barrels per day in December 2013 to 10.8 million barrels per day in December 2020. The theoretical peak will be in October 2034.
I am sure Ron will again disagree with me. But I am just reporting what the current trend shows.
Dennis, do you think this is an overestimate of Russia’s recoverable amount of oil? It might be. But if that’s the case, it would suggest HL does not always underestimate ultimately recoverable amount and it could overestimate as well. In that case, it might give us greater confidence when we add up many individual regions as positive errors might be offset by negative errors.
The HL analysis uses EIA data so the last observed data point is in December 2013. Ron used JODI data showing that Russia oil production might have declined over the first four months of 2014. If that is confirmed by EIA, the trend may be changed. But it will probably take many adjustments for the HL-indicated peak to move from 2034 to 2014. We will see.
I corrected your typo. Yes I did use JODI to make that determination but I also used Russia’s own data from CDU TEK” to show that Russia declined the first five months, though it has slightly leveled off in May, only slightly below April. And I will guarantee you that will be confirmed by the EIA because the EIA gets their data directly from CDU TEK, though the EIA can get the monthly data I can only get the daily data.
Below is the CDU TEK daily chart. I only have data from the last date in 2013.
The label is wrong, it should be Thousand Tons per Day.
Thanks Ron. I’m looking foward to the Russian peak
The problem with doing trend lines with Russia is WHAT they have been doing to get the reported production in the past five years. They have an enormous infill drilling spend; you can see it with Samotlor on Google maps. They also have been bringing their last big Soviet era field online and ramping it to full production.
Neither of those two tactics are sustainable. Once you run out of good real estate, you’re done. Same problem as the massive drilling effort needed to keep shale oil increasing in the US in the face of first year bpd declines of over 60%.
Hi PE,
I think this HL shows that the method is flawed, I think a method that allows one to pick the results one is looking for is not a particularly good method.
We could easily imagine two different people with different agendas arriving at very different conclusions using HL.
If we are going to claim that the method is not that reliable, but when we apply it to the World as a whole that the positive and negative errors balance out at the World level, we still have the obvious problem that Deffeyes was using HL to estimate a World URR of 2000 Gb and a peak of 2006 back in 2005. Currently HL points to 2600 Gb for C+C (using EIA annual data and Deffeyes cumulative estimate of 982 Gb at the end of 2004), so my earlier statement about Hubbert linearization underestimating URR refers to the tendency for the World URR estimate to increase over time (in this case by 30% in 8 years.
Hi Dennis,
“I think this HL shows that the method is flawed.”
I might have said: I think this PROVES HL is flawed (Russian case). Of course not mathematically proven but it’s certainly “demonstrated” as being flawed. My wife would freak out if I didn’t qualify my statement. [I suppose I’m supposed to insert one of those yellow faces here.]
Doug
Dennis, every statistical method is flawed to some degree.
I don’t think it’s particularly useful for someone to use HL to pick a result simply to be disproved a few months later. Certainly that’s not my interest. In fact, I believe with your model, it is also possible to produce a range of results based on different assumptions.
HL is just one of many ways to present the data. So long as the method/assumptions are stated clearly, I don’t see the method to be particularly flawed.
Deffeyes failed to predict correctly the world URR. That’s because he only had the data up to 2005 available to him. Now it’s 2014. So arguably we’re one step closer to truth.
You’re absolutely correct that in the past, there was a tendency for HL exercises to predict increasingly higher URRs. But that by itself could be a useful piece of information (by observing how the predicted URRs have increased over time). The failure of HL was at least partly due to the US shale oil boom. If you take away the US, HL predictions for the rest of the world may have been relatively stable. (I’ll later take a look at the rest of the world)
And of course, the predicted URR will not increase forever as the true URR must be finite. Thus, as more data are accumulated, we can at least have some assurance that we will move closer to truth step by step. Of course, if any large-scale unexpected development (like shale oil) happens, be ready to reassess the whole analysis based on alternative information.
On the other hand, in the Russian case, we might actualy see declining predicted URRs as more data become available. If that turns out to be true, it would demonstrate that HL does not simply have a one-sided bias to underestimate.
(Odd that this thread was shifted.)
In any case, I was not asserting that 2005 was the global C+C peak. I simply pointed out that after increasing from 67 mbpd to 2002 to 74 mbpd in 2005, global C+C production has averaged 74 mbpd for the next 8 years. It’s true that Deffeyes was wrong about the absolute C+C peak, but this was one hell of an accurate prediction in regard to global C+C supplies, especially when one considers the likelihood that virtually all of the actual post-2005 increase in C+C was from a byproduct of rising natural gas production, i.e., condensate. Circa 2005, Yergin was predicting a continued 3%/year rate of increase in production, which would have put global C+C production at about 94 mbpd in 2013. Who most accurately predicted post-2005 global C+C production?
In an similar fashion, and using the same HL approach, it’s interesting that after increasing from 7.6 mbpd in 2002 to 9.6 mbpd in 2005, Saudi C+C production has averaged 9.1 mbpd for the next 8 years.
Test post, in reply to my 1:30 PM comment.
Hi Jeff,
Saudi Arabia has indeed remained on a plateau (roughly speaking since 2005) and they have adjusted their output up and down as they see fit over time (or maybe they have been producing flat out, I don’t really know). It was expected that output would decline and it has not.
You are correct that the optimistic projections were wrong, it is also correct that the pessimistic predictions were also wrong. Deffeyes hubbert curve from 2006 would have current output at 66 million b/d, which is clearly not correct. Yergin seems to miss the mark by a much wider margin, but keep in mind that Yergin talks in terms of all liquids (at about 87 MMb/d in 2010) and productive capacity which is usually higher by 5 MMb/d (based on IEA figures) so that would be 92 MMb/d of capacity in 2010 in Yergin-speak, which is not that far from his 2005 prediction of 101 MMb/d of capacity in 2010. Basically both predictions were wrong by about 10 MMb/d.
Saudi Arabia has indeed remained on a plateau (roughly speaking since 2005) and they have adjusted their output up and down as they see fit over time.
No they have not done that at all. They have gone from flat out to cutting production, then back to flat out to cutting again, and now back to flat out. They have adjusted production down when they saw fit but they have never adjusted production up from flat out, or when they were producing between 9.5 and 10 million bpd.
It was expected that output would decline and it has not.
Now just a cotton picking minute here. Did you not even bother to read my post. No, I would not have expected production to decline after they put Shaybah on line. No, I would not have expected production to decline after Khurais was put on line. No, I would not have expected production to decline after they put Manifa on line.
They have done exactly as I would have expected them to do. They brought on line, one by one, old mothballed fields, and kept their production at or around 9.5 million barrels per day.
Now they don’t have any more old mothballed fields to bring on line. Now they are drilling in two kilometers of water, through 7,000 feet of salt in a desperate attempt to find some more oil. Now they are injecting CO2 into Ghawar in an attempt to squeeze a few more barrels out of that tired old super giant.
Now I do expect them to decline. Maybe not this year but by sometime next year they will start to decline.
Saudi Arabia actually declined in the critical phase 2005 – mid 2007. Your graph above shows it. It contributed to rising oil prices and the US recession which started end 2007. At the time I wrote this article in the oildrum with Gail the Actuary
9/10/2007
Did Katrina hide the real peak in world oil production?
http://www.theoildrum.com/node/3052
22/7/2013
US oil demand peak was in 2007
http://crudeoilpeak.info/us-oil-demand-peak-was-in-2007
In 2008 there was an oil demand shock (extra demand for Chinese Olympic Games). Saudi production increase was NOT enough to keep oil prices down.
In 2007 it was totally irrelevant that US shale production went up later. What matters is that at all times, the oil supply must be sufficient.
So 2007 was the prelude for the financial crisis while the economy had a pre-condition of accumulated debt.
Matt Simmons’ warning “The coming Saudi oil shock and the world economy” was spot on.
and, as I recall Deffeyes said nat gas peak was a long distance AFTER peak oil.
This “free sharing” of inoofmatirn seems too good to be true. Like communism.
[…] Patterson. May 27, 2014. A Closer Look at Saudi Arabia. […]
I very much like Enno’s suggestion. An (easy!) way to measure this is to divide the total oil consumption of all the oil importing Nations by their total population size and plot over time. I strongly suspect this graph points strongly downwards, because, as Enno has already pointed out, we are already effectively living in post peak oil world.
Thanks Ed. In 2 weeks the BP Statistical Review is out, and with that updated data I plan to do such an exercise. Should be easy indeed.
[…] Die Wirtschaftswoche schreibt, Saudi Arabiens Zukunft stünde auf Messers Schneide und Ron Patterson sieht das weltgrößte Ölfeld Ghawar als erschöpft an. Investitionen in diese Weltregion sollen den Energiezufluss […]
[…] the Saudis have made up for declines in old oilfields by bringing new ones on line, they’ve run out of new fields to develop. So it looks as if that risk of higher oil prices is quite a strong one. A “what-me-worry?” […]
[…] while the Saudis have made up for declines in old oilfields by bringing new ones on line, they’ve run out of new fields to develop. So it looks as if that risk of higher oil prices is quite a strong […]
[…] while the Saudis have made up for declines in old oilfields by bringing new ones on line,they’ve run out of new fields to develop. So it looks as if that risk of higher oil prices is quite a strong […]
[…] el declive de los viejos campos de petróleo poniendo en producción nuevos, se están quedando sin nuevos campos a desarrollar. Así que parece que el riesgo de precios de petróleo más altos es bastante […]
[…] el declive de los viejos campos de petróleo poniendo en producción nuevos, se están quedando sin nuevos campos a desarrollar. Así que parece que el riesgo de precios de petróleo más altos es bastante […]
[…] Saudyjczycy nadrobili spadki wydobywcze ze starych pól naftowych dzięki uruchomieniu nowych, więcej pól roponośnych do eksploatacji już nie mają. Zatem niebezpieczeństwo wyższych cen ropy naftowej jest bardzo […]
[…] ist, die sogenannte verbesserte Erdölförderung (EOR) einen Gang hochzuschalten. Statt Salzwasser presst man nun Kohlendioxid in die Bohrlöcher, das über Pipeline von einem 70 Kilometer entfernten Gaskraftwerk herangeschafft […]
[…] el declive de los viejos campos de petróleo poniendo en producción nuevos, se están quedando sin nuevos campos a desarrollar. Así que parece que el riesgo de precios de petróleo más altos es bastante […]
[…] el declive de los viejos campos de petróleo poniendo en producción nuevos, se están quedando sin nuevos campos a desarrollar. Así que parece que el riesgo de precios de petróleo más altos es bastante […]
[…] the Saudis have made up for declines in old oilfields by bringing new ones on line, they’ve run out of new fields to develop. So it looks as if that risk of higher oil prices is quite a strong […]
[…] while the Saudis have made up for declines in old oilfields by bringing new ones on line, they’ve run out of new fields to develop. So it looks as if that risk of higher oil prices is quite a strong one. A “what-me-worry?” […]
[…] arsenal. Surely, they would not use it and there are suggestions that they do not even have the capacity to do so. But the truth is that when it comes to exploiting tight oil resources the world needs […]