Steve Kopits, in his recent presentation at Columbia University, ridiculed the IEA’s often used term a “Call on OPEC“. That is, the IEA looks at the world oil supply and if they see a supply shortage looming on the horizon they then issue a “Call on OPEC” to supply x number of extra barrels and fill that gap. But the next time the IEA issues such a call can OPEC deliver? Or, is OPEC already producing every barrel they possibly can.
One thing for sure, there are eight OPEC countries that are definitely producing every barrel they possibly can, those countries are Algeria, Angola, Ecuador, Iran, Libya, Nigeria, Qatar and Venezuela. The chart below is the combined production of those 8 nations.
All charts in this post are “Crude Only” in kb/d with the last data point Jan. 2014.
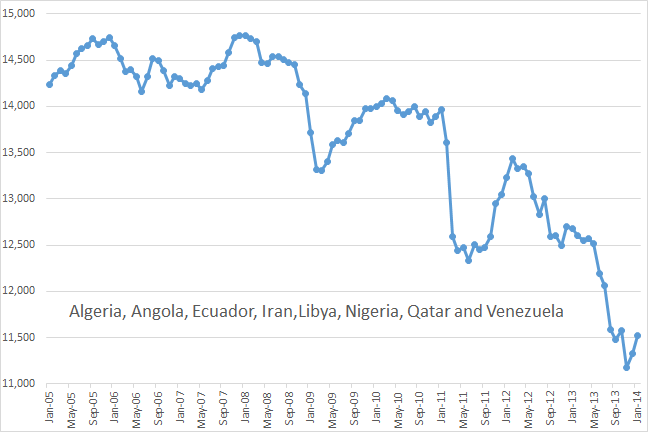
There can be no doubt that all eight of these OPEC countries are producing every barrel they possibly can. While it is true that Iran and Libya have political problems that is holding their production back, but political problems in that part of the world are likely to get worse rather than better.
But what about the other four OPEC nations. The chart below shows the combined production of Iraq, Kuwait, Saudi Arabia and the UAE.
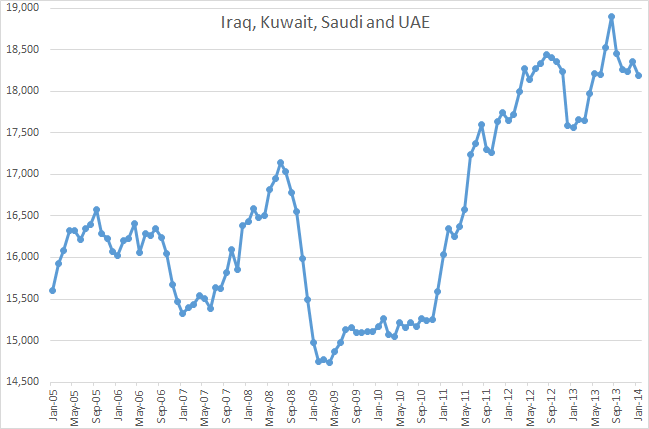
It is my contention that not only are these four OPEC nations producing every barrel they possibly can but that they have little prospect of producing much more. I will examine each country one by one.
Iraq has not been subject to OPEC quotas since the the beginning of Mr. Bush’s war and make no bones about producing every barrel they can and hope to produce more, a lot more.
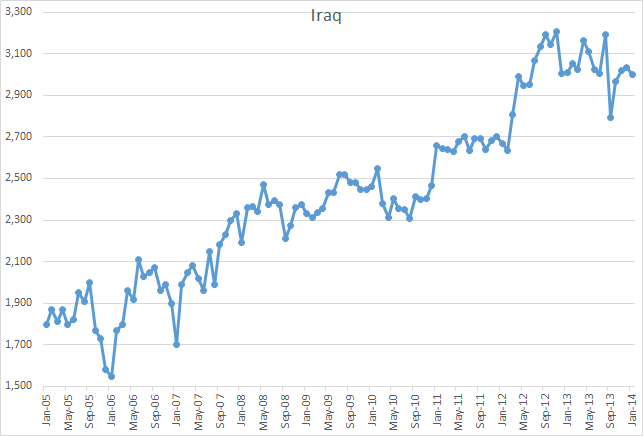
But their production has been relatively flat for almost two years. They may be able to squeeze out a few more barrels in the future but any increase will be very slow in coming.
But what about the other three. First Kuwait.
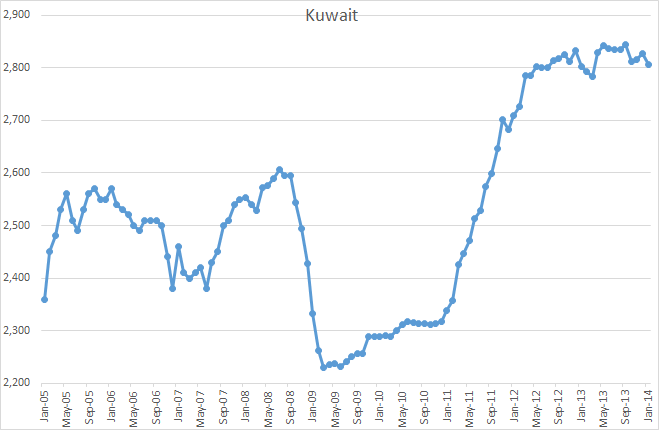
Kuwait initiated Project Kuwait in 1997 in hopes of slowing the decline of Burgen and increasing production in their northern fields. The project was delayed by political bickering about bringing in outside contractors but finally got underway in early 2007 only to be delayed a year later by the crash. But the project, really a massive infill drilling program, got underway again in early 2011 and has managed to increase their production by some 200,000 bp/d over their 2008 peak. That simply means more infill drilling. But they are clearly at peak right now.
However their production has been flat for almost two years. Recently they announced an effort to increase their “Production Capacity” by another 150 kb/d. Like all other OPEC countries they claim to be able to produce a few more barrels than they are actually producing.
The United Arab Emirates?
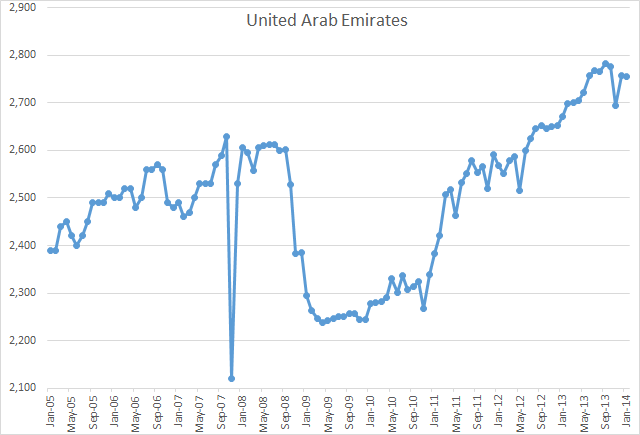
The UAE has learned the same trick as every other nation with tired old fields. That is if you drill new horizontal wells that run along the length of the top of the reservoir, they can increase production slightly or at least slow the decline rate. They are looking toppy right now and can expect decline to set in soon.
That leaves Saudi Arabia.
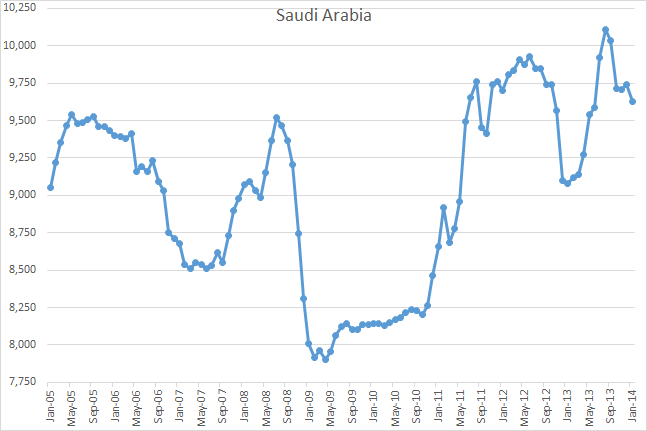
Saudi Arabia was among the first nations in the world to initiate new infill drilling programs. Before they they did this their decline rate of their old fields was averaging 8% per year. They claimed, with that drilling program, they got that decline rate down to almost 2% per year. But that was over eight years ago. I suspect that the decline rate has increased considerably since then.
Saudi has however, been able to keep from declining in net production by bringing on new fields, or rather old mothballed fields back on line. The most recent being Khurais which was brought on line in 2009 and Manifa which came on line last year with 500,000 bp/d and is ramping up to its full capacity of 900,000 bp/d this year. The spike you see in 2013 is Manifa ramping up.
Saudi may be able to produce a few more barrels but not very many. But as, Sadad Al Husseini a former executive at Aramco, said in 2012 “Saudi is producing flat out”. If they did manage to squeeze out a few more barrels it would be only temporary. Saudi is about to go into decline, or at least that is my opinion.
Any “call on OPEC” by the IEA would likely produce about as much new oil as a call on their grandma.
Note: I send out an email notification to about 100 people when I have published a new post. If you would like to be added to that list, or your name removed from it, please notify me at: DarwinianOne at Gmail.com
278 responses to “Can we depend on a “Call on OPEC”, or has OPEC peaked?”
OPEC 12 net exports increased at 6.6%/year and their ECI Ratio* increased at 2.0%/year from 2002 to 2005, as annual Brent crude oil prices approximately doubled from $25 in 2002 to $55 in 2005.
Their net exports were essentially flat from 2005 to 2012 (28.3 mbpd in 2005 and 28.0 mbpd in 2012), as annual Brent crude oil prices doubled from $55 in 2005 to $112 in 2012. Their ECI ratio fell from 5.37 in 2005 to 4.34 in 2012, a rate of decline of 3%/year.
Based on the 2005 to 2012 rate of decline in the OPEC 12 ECI Ratio, I estimate that they have shipped about 25% of their post-2005 Cumulative Net Exports (CNE).
Based on the seven year (1995 to 2002) decline in the Six Country** ECI ratio, their estimated post-1995 CNE were 9.0 Gb. Actual post-1995 CNE were 7.3 Gb.
*Ratio of production to consumption
**The six major net oil exporters that hit or approached zero net exports from 1980 to 2010, excluding China
The following chart showing normalized production, ECI ratio, net exports and remaining post-1995 CNE by year for the Six Country Case History (1995 = 100%).
OPEC 12 net export volumes are total petroleum liquids + other liquids (EIA).
I fully expect Aramco to annouce a production increase of about 400k-600k bpd in the coming months as they do every year in the spring. What gets missed is that the increase will go for electrical generation for the summer cooling season. So the IEA will issue the call, Aramco will comply, they will issue a statement of the increased new production and no new oil will hit the market.
Slightly edited copy of a Peakoil.com post:
Re: Annual 2013 Saudi net exports
Here are the 2012 Saudi EIA data:
(Total petroleum liquids production + other liquids production) – (liquids consumption) = net exports
11.53 – 2.86 = 8.68 mbpd (versus 9.1 mbpd in 2005)
If we take the monthly EIA data for 2013 at face value, Saudi Arabia averaged 11.5 mbpd through October. I estimate that the preliminary annual production number for 2013 will be between 11.5 and 11.6 mbpd. Note that the Saudis are reporting a small decline in crude oil production from 2012 to 2013.
In any case, if we assume Saudi consumption of about 3.0 mbpd, their 2013 net exports would be 8.5 to 8.6 mbpd. The bottom line is that that since the Saudis themselves are reporting a decline in crude oil production, absent a very significant decline in consumption in 2013, I don’t see how their 2013 net exports could be above 9.1 mbpd (the 2005 rate).
Again assuming consumption of 3 mbpd and production of 11.5 to 11.6 mbpd, their ECI Ratio (ratio of production to consumption) for 2013 would be 3.83 to 3.87. Based on the 2005 to 2012 rate of decline in the Saudi ECI ratio, their ECI ratio would be at about 3.84 for 2013.
Incidentally, one interesting aspect of “Net Export Math” is that given a declining ECI ratio, the year over year rate of depletion in remaining CNE (Cumulative Net Exports) tends to accelerate with time. For example, assuming post-2005 Saudi CNE of about 56 Gb, the 2005 to 2006 estimated year over year rate of depletion in remaining post-2005 CNE was 5.7%/year. Assuming 2013 net exports of 8.6 mbpd, their 2012 to 2013 estimated year over year rate of depletion in remaining post-2005 CNE was 9.0%/year, as estimated remaining post-2005 Saudi CNE fell from 35 Gb at the end of 2012 to 32 Gb at the end of 2013.
If we look at a similar time period for the Six Country Case History*, 1995 to 2002, the actual 1995 to 1996 year over year rate of depletion in remaining post-1995 CNE was 19.6%/year. The actual Six Country 2001 to 2002 year over year rate of depletion remaining post-1995 CNE was 46%/year.
This is why I think almost everyone is missing the point about net export declines. When a net exporter might approach zero net exports is pretty much irrelevant, since the biggest volumetric CNE depletions tend to occur early in the net export decline phase. A rough, but pretty consistent, rule of thumb is that if we look at the time period from peak net exports to zero net exports, about half of post-peak CNE are shipped about one third of the way into the net export decline period.
*The six major net exporters, excluding China, that hit or approached zero net exports from 1980 to 2010
Jeff,
Would you mind expanding a bit more on what you stated here:
This is why I think almost everyone is missing the point about net export declines. When a net exporter might approach zero net exports is pretty much irrelevant, since the biggest volumetric CNE depletions tend to occur early in the net export decline phase.
———-
So, according to your calculations, the Saudi’s have approximately 32 Gb remaining of net oil exports.
steve
If you look at the Six Country chart above, they hit Peak Exports in 1995.
Four years later, at the end of 1999, their production was 2% higher than 1995, their ECI ratio was down by 5% relative to 1995, their net exports were down by 6% relative to 1995, but by the end of 1999 they had already shipped 54% of post-1995 CNE (Cumulative Net Exports).
To estimate post-Peak Exports CNE, using the rate of decline in the ECI ratio, I use “Cowboy Integration.”
For example, the Six Country Case History again. The Six Countries’ production virtually stopped increasing in 1995. They showed a steady decline in their ECI Ratio after 1995. Based on the 1995 to 2002 rate of decline in the Six Country ECI ratio, they would hit an ECI Ratio of 1.0, and thus zero net oil exports in 20 years (around 2015).
Net export declines tend to show a “Shark Fin,” or triangular shape. Six Country net exports at peak (in 1995) were 1.0 Gb/year. So, estimated post-1995 Six Country CNE were 1.0 Gb/year X 20 years X 0.5 (area under a triangle), less 1.0 (net exports in 1995), for an estimate of 9 Gb.
Actual Six Country post-1995 CNE were 7.3 Gb, since they hit zero net exports in 2007 (instead of 2015).
Using a similar analysis, based on the 2005 to 2012 rate of decline in the Saudi ECI ratio, I estimate that post-2005 Saudi CNE are about 56 Gb.
Ugo Bardi has an article on Yemen:
Post peak countries: the collapse of Yemen
http://www.resilience.org/stories/2014-03-05/post-peak-countries-the-collapse-of-yemen
2002 to 2012 Exponential Rates of change for Yemen*:
Production: -10.5%/year
Consumption: +2.0%/year
Net Exports: -30%/year (327,000 bpd in 2002 to 17,000 bpd in 2012)
In simple percentage terms over a 10 year period, a 65% decline in production and a 22% increase in consumption resulted in a 95% decline in net exports.
In regard to Cumulative Net Exports, in the nine year period from 2003 to 2012 inclusive, Yemen shipped 648,000 million barrels of cumulative net exports. They shipped 48% of this volume in the first three years, from 2003 to 2005 inclusive, which is consistent with other net export declines, i.e., a rough, but fairly consistent, rule of thumb is that half of post-peak cumulative net exports are shipped about one-third of the way into the net export decline period.
And of course, the Yemen data are completely consistent with the mathematical model, and the data show the same kind of net export decline that we saw with the Six Country Case History.
*Total petroleum liquids + other liquids for production, total liquids for consumption, EIA
Should read: ” In regard to Cumulative Net Exports, in the 10 year period from 2003 to 2012 inclusive”
Again assuming consumption of 3 mbpd and production of 11.5 to 11.6 mbpd, their ECI Ratio (ratio of production to consumption) for 2013 would be 3.83 to 3.87
Assume KSA 2013 production of 11.5 mb/d and net exports of 8.5 mb/d. The ECI (PCR) is 3.83.
In 2011 KSA production was 11.26 mb/d and net exports were 8.448 mb/d. The ECI (PCR) was 4.00. Relative to 2011 the 2013 ECI (PCR) declined by 4.3% but net exports increased by 0.6%.
http://www.eia.gov/countries/country-data.cfm?fips=sa
In this example, the ECI (PCR) says nada about net exports.
The (so far) peak net export year* for Saudi Arabia was 2005, when they (net) exported 9.1 mbpd, with an ECI ratio of 5.65, versus net exports of 8.7 mbpd in 2012, with an ECI ratio of 4.03. Based on the 2005 to 2012 rate of decline in the ECI ratio, they would be at about 3.84 in 2013, which as noted above, seems to be in the ballpark for 2013 (absent a material decline in consumption).
The Six Country case history showed a net export peak and ECI peak in 1995, although production did not drop below their 1995 rate until the year 2000. From 1997 to 1998 they showed a slight increase in production and net exports, with a slight decline in consumption, and their ECI ratio rose slightly, but their 1998 net export volume and ECI ratio remained below the 1995 values (in much the same way that I suspect that Saudi net exports and the ECI value in 2013 remained below the 2005 values). In other words, in both cases they showed an “Undulating decline” relative to their respective peak net export years. You can see the slight oscillations from 1998 to 1998 in the Six Country normalized values, on the following chart.
However, as the Six Country net exports and ECI ratio rose from 1997 to 1998, they shipped (in one year, in 1998) 19% of remaining post-1995 CNE (Cumulative Net Exports). In other words, depletion marches on.
In a similar fashion, I estimate that Saudi Arabia, in 2013, shipped about 9% of remaining post-2005 CNE.
*I believe that the absolute Saudi net export peak was some time around 1980 or so.
Should read, “slight oscillations from 1997 to 1998.”
The (so far) peak net export year* for Saudi Arabia was 2005, when they (net) exported 9.1 mbpd, with an ECI ratio of 5.65, versus net exports of 8.7 mbpd in 2012, with an ECI ratio of 4.03
So from 2005 through to the estimated 2013 data, KSA’s PCR declined 32% and net exports declined 7%.
On the other side of the import=export accounting identity, what is U.S. PCR rise and net import decline from 2005 through to the estimated 2013 data?
Guesstimate as the net export identity: KSA down o.5, U.S. up 5.0 mb/d. An order of magnitude difference.
Incidentally, as I noted another thread, regarding what I call “Net Export Math,” almost everyone is on a continuum, from ignorance to denial, and a surprising number of Peak Oilers are in the Denial Camp. Basically, almost no one is aware of the concept, and most people who are aware of the concept are in some stage of denial.
I don’t know how many times I have read about an “Undulating” production plateau not being such a bad thing, when the Six Country Case History showed a four year remaining post-1995 CNE (Cumulative Net Exports) volumetric depletion of 54%, as their production rose slightly from 1995 to 1999.
Production declines in net oil exporting countries are inevitable, and given an ongoing production decline, unless they cut their domestic consumption at the same rate as, or at a rate faster than, the production decline rate, the resulting net export decline rate will exceed the production decline rate and the net export decline rate will accelerate with time. Furthermore, if the rate of increase in consumption exceeds the rate of increase in production, a net exporter can become a net importer prior to a production peak, e.g., the US and China.
An added observation is that net export declines tend to be “front-end” loaded, i.e., a rough rule of thumb is that half of post-net export peak CNE tend to be shipped about one-third of the way into the net export decline period, as demonstrated by the latest country to be on the verge of joining OFPEC–Organization of Former Petroleum Exporting Countries–Yemen.
I estimate that we depleted post-2005 Top 33* CNE (Cumulative Net Exports) by about 21% from 2006 to 2012 inclusive. The estimated year over year depletion rate in remaining post-2005 Top 33 CNE was 3% in 2006, which accelerated to an estimated percentage of 3.7% in 2012.
The irony of the current euphoria over the rebound in US crude oil production, as a result of intense drilling in very high decline rate tight/shale plays, is that the “solution” to the ongoing depletion in remaining post-2005 Top 33 CNE is to accelerate the rate of depletion in remaining US recoverable oil reserves.
*Top 33 net oil exporters in 2005
It’s nice work, Ron. I get the sense from this and from Kopits that this is correct. IOW, we have an oil free market. The problem is increased demand (e.g. China) which has outstripped low cost supply. Thus, price is being set by the marginal production (at this point, Bakken oil, thank God or we’d be even worse off).
I would love to see a little more discussion/analysis. For instance, what do those who think there is a functioning cartel have to say for themselves? Do they really think there is a call on OPEC or are they predicating a more generous picture of new production behind their predictions.
Then there is the funny futures market…
Hi Nony,
You ask,
“For instance, what do those who think there is a functioning cartel have to say for themselves?”
What is the purpose of a producers cartel? Is its primary purpose to keep the price of its product low? Or is it the reverse? If it is the latter, it is fine if all members are producing flat out as long as prices do not fall, if prices fall they cut back on production so that prices rise.
In my mind, that would be a functioning cartel. Perhaps you define a cartel differently than me, in the sense that it must be able to both raise and lower prices, if that is the correct definition of a cartel, then you are correct.
We could easily call OPEC something else, “a non-functioning” cartel, but I think for OPEC member states, it is more important to be able to raise prices than it is to lower them. If I am correct, they really don’t care what you call them as long as you have the money to pay for the oil 🙂
The purpose of the cartel is to raise price by colluding to withhold supply. OPEC has been effective at times (70s) and ineffective at other times (80s, 90s). The reason why cartels can be ineffective is that individual members have an incentive to cheat. If enough of that happens, you end up back at free competition price.
So the question is, are we functioning now in a cartel situation (IOW OPEC is keeping the price high) or is it free competition and they are pumping all out and the world just doesn’t have enough oil to keep price below $100. It’s actually a better situation if the price is high because of OPEC, because it leaves the hope that we can break cartel discipline again.
You can’t really have it both ways though. Typically peakers believe that we are pumping full out and that price is high because supply has been depleted. In another thread, you said “what use is free competition economics analysis when cartel is setting price”. But you can’t have it both ways…
Capisce? 😉
Perhaps the situation is that there really is potentially greater daily production capability in OPEC, but that they have chosen not to make the investments that would be needed to bring it online. I can’t help but believe that if Saudi Arabia went into an all-out in-fill drilling frenzy, and they surely have the money to do it, they could increase their daily production greatly, albeit at the expense of total recovery.
But why would they? The marginal price of oil has been over $100 per bbl for several years. I’m pretty sure the Saudis now see this as a floor price that they have no incentive to disturb by raising production. If Iraq or Iran come on strong they may have to cut back a little to maintain that price. But what will they do if the price just keeps on drifting up? They have obviously given up on keeping oil at $28 per bbl. Why not keep production relatively constant and get either the same or more revenue as the rest of the world declines?
I think the bigger probability is that sooner or later some producer will discover that by reducing their production 5%, they can raise the price of oil by 10%. This because there will be nobody else that can increase production. I don’t think we can count on everyone being as stupid as the British, who sold off their oil as fast as they could with prices under $20 per bbl.
To the extent that resource depletion acts as an incentive for conservation among producers, it helps all producers act like a cartel even if they would rather not join one. With every producer now seeing the downslope of world oil production just ahead, they have every incentive to conserve production for later. Whether voluntarily or not, OPEC production has peaked.
Joe,
You make a number of excellent points. When you say: “I think the bigger probability is that sooner or later some producer will discover that by reducing their production 5%, they can raise the price of oil by 10%. This because there will be nobody else that can increase production. I don’t think we can count on everyone being as stupid as the British, who sold off their oil as fast as they could with prices under $20 per bbl…” I think you’ve hit a nail on its head, I share this view and I expect it will come about sooner than later.
Doug
Joe,
P.S. Let me add. I’ve expressed your views (in general) before and been quickly shot down for my efforts. However, my highly educated Norwegian wife asks: “why are we racing to exploit our North Sea oil at the highest possible speed? We don’t need this oil right now, we are one of the richest countries in the world and we’re saving nothing for our grandchildren.” This isn’t strictly correct since Norway has a huge sovereign wealth fund. But then, look at the UK, who, as you say sold off the bulk of their oil at $20/bbl and are now importing at five times that price. I guess the question should be: Is black gold in hand better than a portfolio of stocks? I don’t know.
Oil=stocks=money only as long as the world financial system is intact. While it may not happen soon, I do believe that resource depletion will eventually raise havoc with global capitalism and the debt financing that underpins the global economy. I also believe that carbon emissions are a real danger to the climate.
If the Norwegian powers-that-be thought as I do, they would sell oil only to finance the complete conversion of their economy to renewables and then stop selling oil. Since they are well along in doing that already (almost all of their electricity is from hydro), they should spend down their sovereign wealth fund as far as necessary to complete the conversion. If that fund is likely to be sufficient to do the job, they should stop producing oil immediately.
Hi Nony,
You should really not take things out of context when making an argument.
You said, in response to Jeff Brown’s analysis about net exports:
“You seem to be laboring under the assumption that lowered imports will not hurt exporters. Your (implicit, false) rationale seems to be that exporters will still dump their product on the market somewhere. Well, maybe…but:
1. The price will drop. So their $$ value of exports will drop. Remember that is what they care about, not how much volume they send out.
2. The higher cost production (marginal barrels) will leave the market with lowering price. So those exports will drop. This is elementary supply and demand.
3. You really are making a mistake thinking lowered imports don’t affect net exporters. Really, if you follow your rational EVEN IF WE become a net exporter, you could still claim that it doesn’t hurt exporters (they could still dump product).
***
Instead of getting all tied up in TLAs and ratios, consider the classical microeconomics. Look at how commodities like steel, aluminum, etc. work. when demand is lessened.”
I responded as follows:
“Last time I checked there were not any important world cartels in the steel or aluminum industry.
In the oil industry, OPEC responds to a drop in oil price by cutting back on oil supplied to World markets. The argument that OPEC is producing flat out (which is difficult to verify) mostly means (if it is correct)that OPEC would not have the power to reduce world oil prices (because they would be unable to increase supply).
I think that Mr. Brown assumes that OPEC will not let oil prices drop very far before they cut supplies.
For this reason economic arguments based on perfectly competitive markets do not apply very well.”
You then responded to this that you agree,
“To they extent there is a functioning cartel, yes you are right.
[snip] I agree that arguments based off of free competition do not apply if there is not free competition.” [snip perfectly competitive model is good to know(Dennis Coyne agrees on that point, but notes that some people assume that an unregulated market is always best, which is not the case when markets are not perfectly competitive and when there are externalities)]
and
“And also I thought Mr. Brown was saying they would dump their oil, not withhold it. If they withhold it, definitely net exports go down significantly.”
Not sure how this is having both ways. When or if OPEC is producing flat out, I agree that we can treat the oil market as being close to perfectly competitive.
When OPEC withholds supplies, the oil market is no longer modeled well by using a perfectly competitive model.
And I understand this quite well.
OK. BTW, I can understand you, but not this Jeff guy.
Can you tell me how there is no economic impact on other oil producers if the US (largest market) both reduces consumption AND increases self-supply? But then magically it does have an impact on the day when we start net exports? [Jeff’s view.]
I go back to thinking about diaper paper. P&G is a major consumer of this resource. They have some plants of their own, but also buy on the merchant market (i.e. are partially vertically integrated). Georgia Pacific is a major supplier. If P&G starts doing more internal supply (e.g. adds shifts at their mills, debottlenecks by adding capital, etc. etc.) then how is that not hurting GP?
I mean I can draw the supply and demand curves and really disconnect the issue of net exports. Added supply hurts other suppliers. Reduced demand hurts other suppliers. And it’s irrelevant if the country itself is a net exporter.
P.s. I think your view where OPEC is not functioning as a cartel now (all out), but will function if price drops is very very knife edge. Why would they not function now, to go to 120? Why think they will be efficacious in acting at 80 if they don’t act now? [I really, really don’t know if they are functioning or not. I’d like it better if they were a functioning cartel…we cracked that in 1980s with US oil as the marginal wedge and then enjoyed 20 years of cornie bliss cheap oil. If that were possible again, would be awesome for the Western world. I am a little more worried that we really do have a peak oil dynamic and OPEC is not functioning (or poised to function.)]
Hi Nony,
I would love it if oil prices dropped because substitutes had become so competitive that the demand curve for oil shifted significantly to the left [I know you prefer shifts to the right, but I am not talking politics here 😉 ]. This is exactly the reason that OPEC is not trying to push prices higher, I think that it is their belief that $120/barrel would cause such a shift to begin (they are probably wrong, but $150/barrel (2013$) might get the ball rolling.
Personally I am glad that it is unlikely that we will take the steps backwards that happened in the 80’s and 90s. When peak oil does finally hit, a lot of people (not you, but others) will look back at 1985 to 2013 and say, “What were they thinking?”
Note also it is Ron, not me that is convinced that OPEC is producing flat out, I don’t know, if they are and while they are use micro 101 all you want.
Keep in mind that an increase in US output only hurts net exporters if it causes a drop in world oil prices. One could argue that the increased US output and or reduced demand hurts from the perspective of lower oil prices than if US output was lower or demand was higher. I agree on that point.
Consider the possibility that all oil producers are actually concerned that if oil prices are too high, then substitutes will become competitive, the demand curve will shift left and oil prices will fall. If that is the case, then all oil producers are happy when enough is produced to keep prices at some preferred band (90 to 110 dollars per barrel at present) where profits can be made, but the unwitting are still happy to purchase Ford Expeditions (in the US and Canada at least.)
It certainly seems to me that OPEC functioned quite well from Jan 2009 to Sept 2010 as a cartel, since that time, there has been no reason for OPEC to cut back on output. The next time there is either a recession or an oil price spike followed by a recession and oil price crash, we will find out if OPEC is functioning as a cartel. Currently there is no evidence that they are not.
I think Ron’s post makes a pretty good case that everyone is producing all out with the possible exception of SA. I just would like some more smart people’s views on this economists or analysts. People not just in the peak oil website clique. I’m not even sure how to look for the KPIs (;)) of cartelishness. But I think it would be interesting to explore.
P.s. How about shifting to NG as a substitute?
P.s.s. You are a very good natured, cool guy…for a liberal.* Would buy you a beer.
*Meant in the spirit of “smart…for a Marine”. 😉
Hi Nony,
Here is another way of thinking about Jeff Brown’s Export land model.
Imagine that World demand for oil is perfectly inelastic, so the demand curve is a vertical line on the typical q vs p diagram with p on the vertical axis (drives natural scientists and engineers crazy, because economists usually talk in terms of p being the independent variable in the perfectly competitive model so it should be on the horizontal axis.) We will assume the supply curve has a positive slope.
For the moment lets say the US increases supply by developing LTO and shifts supply to the right. Prices should drop, how much depends on both the amount of the shift and the slope of the world oil supply curve, lately (since 2010) world supply has not been very responsive to price so we would expect the oil supply curve to be pretty steep (relatively inelastic), but that would suggest that there should have been a large drop in oil prices due to the increase in US oil production (there was a small drop in real oil prices since 2011). The world demand curve for oil should continually be shifting to the right as the world economy grows (if efficiency of oil use is unchanged), so perhaps the current growth of world output of oil (mostly US LTO) has just barely kept pace with the increased demand for oil.
So we would have to imagine a shifting world supply curve which is exactly matched by a shifting world demand curve. Talk about a knife edge argument, this is it.
If this has any basis in reality (it is only a theoretical economics argument), it could explain how an increase in US output (supply curve shift from S1 to S2 in diagram) could leave prices unchanged at $100/barrel (vertical axis) while quantity supplied and demanded increases from 80 MMb/d to 100 MMb/d (horizontal axis) due to a shift in the demand curve from D1 to D2. The equilibrium moves from E1 to E2. Vertical demand curves were used for simplicity, both supply and demand curves are pretty steep in the short run with both quantity supplied and quantity demanded not reacting very much to price changes.
In the real world changes in income affect demand for oil which makes it difficult to untangle price changes, income changes, and changes in quantity demanded.
Price as the dependent is correct.
DC, there’s still been a beneficial impact from US changes then. If you say that world GDP expanded and Chinese demand made up the US decrease, you’re just invoking another factor. But we would have been even worse off (higher price) without the US demand drop (that is if you think the curve actually dropped, not a price response) and definitely worse off without the LTO supply.
Just look at your curves: D2-S1 down to D2-S2 is what happens with LTO added. Isolating one change, that’s what you see 140 to 100.
If US demand actually dropped (not just a price response but the curve actually changing), then D2 goes to D1 and intersections change from D2-s1 to D1-S1 (again 140 down to 100).
If both effects occur, you go to D1-S2. And end up at $60.
finally, these exercises should show you pretty clearly that it is irrelevant if the US is a net exporter or net importer.
Nony,
Imagine a world where oil supplies become constrained and most countries have the same oil export rules as the United states.
In such a world, it makes a big difference whether you are a net importer or exporter of oil.
The curves in the chart are world demand, and indeed if world demand drops, prices will drop if supply is unchanged.
If demand increases with no shift in the suppy curve, prices will increase.
I was simply creating a scenario that explains the increase in supply (curve shift) and that prices have not changed much, which could be explained by a shift in demand.
Let’s ignore price for a moment and assume that OPEC still can keep prices from falling and may (in the long run) be able to keep them from rising (as in the Libya crisis). Your point about the increase in US output is correct, as far as the quantity of net exports available on the world market.
If the US imports 10 MMb/d and there are 55 MMb/d of net exports on the world market, that leaves 45 MMb/d for the rest of the world net importing countries. Now assume that the increased US output reduces imports to 7 MMb/d, this would increase the available net exports for countries other than the US by 3 MMb/d to 48 MMb/d (assuming world net exports remain at 55 MMb/d).
Mr. Brown argues that these extra available net exports are absorbed by China and India. For this reason there is no drop in prices.
I believe that you are saying that there would still be the demand for oil from India and China whether LTO in the US increased or not.
If we assume that OPEC is producing flat out and the 3 MMb/d of extra US LTO vanished, then oil prices would be higher. In my chart if we assume the demand shift from D1 to D2, but supply remains at S1 (no shift), then prices would go from 100 to 140. This may not look realistic, but the demand shift in the diagram was large (20 MMb/d) a demand increase of 3 MMb/d would likely lead to a smaller price increase, maybe to $106/barrel or a 6% increase in real oil prices in this artificial economic model.
Here is a simple explanation of the ELM (from up the thread), which is really just a statement of mathematical facts:
“Production declines in net oil exporting countries are inevitable, and given an ongoing production decline, unless they cut their domestic consumption at the same rate as, or at a rate faster than, the production decline rate, the resulting net export decline rate will exceed the production decline rate and the net export decline rate will accelerate with time. Furthermore, if the rate of increase in consumption exceeds the rate of increase in production, a net exporter can become a net importer prior to a production peak, e.g., the US and China.”
As the supply of Global Net Exports of oil (GNE*) are allocated to to net importers, I have pointed out that fluctuations in production and consumption in net oil importing countries like the US have no direct impact on the supply of GNE. At most, fluctuations in production and consumption in net oil importing countries have an effect on the demand for GNE, but that is against the context of the increase in demand for GNE from developing countries, led by China.
The fact remains that what the data show, at least through 2012, is that developed net oil importing countries like the US were gradually being priced out of the market for GNE, as the supply of GNE available to importers other than China & India fell from 41 mbpd in 2005 to 35 mbpd in 2012.
And the $64 trillion question is to what extent that the trends on the following consumption versus price chart continue for another 10 years or so. At the 2005 to 2012 rate of decline in the ratio of GNE to CNI (Chindia’s Net Imports), in 16 years China & India alone would theoretically consume 100% of GNE.
*Top 33 net oil exporters in 2005, total petroleum liquids + other liquids (EIA)
Hi Jeff,
I believe Nony may be focusing on Available Net Exports. If GNE=50 MMb/d and country X reduces its net imports then the available net exports to all other countries is increased.
You seem to be arguing past each other on this point.
Nony doesn’t care about GNE, whatever it is, if one country imports less there is more oil for everyone else. No?
I agree that production and consumption fluctuations in net oil importing countries affect the demand for GNE, but one has to view this in the context of increasing demand for GNE from developing countries.
As I have noted, what the data show is that developed net oil importing countries like the US were–at least through 2012–gradually being forced out of the global market for exported oil, as the supply of GNE available to importers other than China & India fell from 41 mbpd in 2005 to 35 mbpd in 2012.
And as I have discussed, the $64 Trillion question is to what extent these trends continue in future years.
And the GNE/CNI graph, with the extrapolation based on the 2005 to 2012 rate of decline.
Dennis,
Incidentally, if you want to contemplate some crazy looking numbers, consider what the extrapolated rate of decline in the GNE/CNI ratio suggests for estimated post-2005 Available CNE (the estimated post-2005 cumulative supply of Global Net Exports of oil available to importers other than China & India).
I estimate that post-2005 Available CNE are about 175 Gb. Net importers other than China & India consumed about 95 Gb of net imports from 2006 to 2012 inclusive, implying that the remaining supply of post-2005 Cumulative Net Exports available to importers other than China & India is about 80 Gb, again based on the 2005 to 2012 rate of decline in the GNE/CNI Ratio*.
Do I think that China & India will be consuming 100% of GNE in 2030? No, but it’s going to be one hell of an interesting ride.
For what it’s worth, following is an explanation of what I call “Cowboy Integration,” which as noted below was too optimistic for the Six Country case history, based on the seven year 1995 to 2002 rate of decline in their ECI Ratio (which is analogous to the GNE/CNI Ratio).
In my opinion, focusing on supply & demand fluctuations in developed net oil importing countries like the US–given the realities of “Net Export Math,” in the context of increasing demand from developing countries–is roughly analogous to someone on the Titanic discussing dinner plans after their arrival in New York, oblivious to the
fact that ship would sink in a little over two hours. Around midnight, after hitting the iceberg, perhaps three people on the Titanic (about 0.1% of the people on the ship) knew that the ship would sink, but that did not mean that the ship was not sinking.
To estimate post-Peak Exports CNE, using the rate of decline in the ECI ratio, I use “Cowboy Integration.”
For example, the Six Country Case History again. The Six Countries’ production virtually stopped increasing in 1995. They showed a steady decline in their ECI Ratio after 1995. Based on the 1995 to 2002 rate of decline in the Six Country ECI ratio, they would hit an ECI Ratio of 1.0, and thus zero net oil exports in 20 years (around 2015).
Net export declines tend to show a “Shark Fin,” or triangular shape. Six Country net exports at peak (in 1995) were 1.0 Gb/year. So, estimated post-1995 Six Country CNE were 1.0 Gb/year X 20 years X 0.5 (area under a triangle), less 1.0 (net exports in 1995), for an estimate of 9 Gb.
Actual Six Country post-1995 CNE were 7.3 Gb, since they hit zero net exports in 2007 (instead of 2015).
*GNE = Combined net exports from (2005) Top 33 net exporters (total petroleum liquids + other liquids, EIA)
CNI = Chindia’s Net Imports (China + India, total petroleum liquids + other liquids, EIA)
Jeff,
The situation is dire. Economics is useful though.
Things may change when oil becomes more and more scarce. For example lets take KSA. Currently prices for petroleum product are very low and there is a great deal of inefficiency in oil use. As oil becomes more expensive on the world market it may become harder to justify the low energy prices within the country, if prices of petroleum products are allowed to rise to profitable levels (where refineries are charged the world market price for their inputs in KSA), then demand for oil goes down in KSA, maybe natural gas is imported to run power plants, more investment is solar power, etc.
Your 6 country case probably does not take this into account and may not represent what will happen in the future.
In the period covered by your 6 county case, nobody in those countries believed in peak oil. Current OPEC countries might behave differently because they see the writing on the wall.
Mostly I agree with your analysis, but I think it might be improved by including the economics.
Dennis,
On some days, I think that there might be a dozen people in the world that understand–and accept–what I call “Net Export Math.” Almost everyone is located somewhere on a continuum from ignorance to denial, including to some degree of course, myself.
I frequently compare Indonesia and the UK.
As you know, Indonesia subsidized consumption, as their production and net exports declined, while the UK heavily taxed consumption, as their production and net exports declined. In neither case did consumption fall at the same rate as, or at a rate faster than, the rate of decline in production, therefore, in both cases the resulting net export decline rate exceeded the production decline rate, and the net export decline rate accelerated with time.
Consider a relatively poor country like Yemen. I profiled them up the thread, and their net export decline profile–as annual Brent crude oil prices rose at an average rate of 15%/year from 2002 to 2012–exactly followed the same accelerating net export decline rate trend as the ELM and the Six Country Case History data.
I constantly get qualitative objections to what is a quantitative mathematical observation:
“Production declines in net oil exporting countries are inevitable, and given an ongoing production decline, unless they cut their domestic consumption at the same rate as, or at a rate faster than, the production decline rate, the resulting net export decline rate will exceed the production decline rate and the net export decline rate will accelerate with time. Furthermore, if the rate of increase in consumption exceeds the rate of increase in production, a net exporter can become a net importer prior to a production peak, e.g., the US and China.”
A couple of stories.
Circa 2008, I was contacted by a research scientist at Sandia Labs. They had an informal Peak Oil working group, and he said that they were stunned when they worked through the implications of “Net Export Math.” A few months later, I was invited to make a presentation on net exports at Sandia (I had to pass a security background check to get on to the facility).
In any case, I made my presentation at Sandia, which was shown via video link to other national labs (Los Alamos, etc.), to what has to be my most intimidating audience ever. There was no real argument over the model, since they very quickly understood the simple math. I understand that a contingent of scientists from Sandia subsequently approached senior DOE/EIA executives about their concerns about net exports, and the scientists were told that the higher ups didn’t want to hear it.
Fast forward to late 2012. I was part of an ASPO-USA delegation that briefed senior EIA and DOE personnel in Washington D.C. (including the EIA administrator) on Peak Oil and Peak Exports (at least they were willing to listen). I made a brief presentation on net exports, in the context of increasing demand from developing countries, and the first question I asked them was if anyone at the EIA was modeling future Global Net Exports of oil, assuming a continuing increase in consumption in net oil exporting countries. The answer was “No.”
DC:
1. If OPEC is functioning as a cartel (not at all a proven), then they could keep price up if US LTO comes on market by withholding supply. They are still very much affected then by less total revenue and this has different affect than what Jeff says (no change in their exports). Withholding 3 MM bpd, sure as heck is a change for them.
2. There’s NO magic about if we cross the line of being an exporter or just add barrels of supply and become less of an importer. NO DIFFERENCE. No math difference, no economic difference, no change to the cartel’s options. A marginal million barrels per day added to supply is exactly that.
3. I’m pretty much not interested in further discussion with Jeff. He doesn’t do good analysis and throws up wads of chaff. Enno >>> Jeff if you get my drift. 😉
Nony,
As previously noted, things do look better when one persists in ignoring both factual supply data and fundamental mathematical facts, but as previously noted, you are certainly representative of the “Net Export Math” continuum, which tends to run from ignorance to denial.
Hi Jeff,
You compare UK and Indonesia, noting that the UK did not subsidize petroleum products.
Was there a difference between the two countries in the rate of increase in consumption of petroleum products? Keep in mind that you would also need to account for economic growth. So if one country was growing at 2 % per year and the other was growing at 4% per year, the country that was growing faster would be expected to increase its petroleum consumption at a faster rate than the other.
In order to properly account for the relative increase in petroleum consumtion we would have to look at the economics in detail, the relative size of the two economies, the % of income spent on petroleum products and the growth rate of the two economies.
We might find (I haven’t done the analysis), that UK growth in petroleum consumption (when accounting for any differences in growth rates, the size of the economy and % of petroleum consumption in the economy was much less than Indonesia.
If that were the case, it would lend support to the idea that net exporters might significantly reduce consumption in the face of higher oil prices.
There is nothing in the definition or theory of cartels that says a cartel cannot both intentionally withhold production to raise prices and also raise production to cut prices although deliberate price cuts on the part of cartels are not common.
A cartel of let us say Florida citrus growers might for instance decide to cut the price of orange juice if we apple growers start advertising apple juice real hard and cutting seriously into the sale of orange juice.
Having said this much it is possible for a the members of a cartel to be satisfied with the going price and allow any members that desire to do so to produce at max.
In this case the cartel might not have the ability to raise production enough to cut prices but it would sure as you know where have the ability to cut production and raise prices.
Given this situation it might be fair to call OPEC a ”voluntarily disbanded until further notice ” cartel.
It actually would take only one or two members of OPEC to decide on a cut in production if Ron and some others here are right about all the OPEC members producing flat out. It isn’t possible to cheat and produce more when you are already pedal to the metal.
Personally I think Ron is either in the ten ring or very close to it . There may be a little spare capacity in a couple of OPEC countries but it can’t amount to much.
It’s worth being aware that the Iraqi government claims that Iraqi production increased by 500,000 barrels per day in February:
http://uk.reuters.com/article/2014/03/01/iraq-oil-exports-idUKL6N0LY05L20140301
http://www.reuters.com/article/2014/03/05/iraq-oil-idUSL6N0M22P120140305
There is of course still a lot of oil left in Iraq, but who knows if this production increase, if it did in fact happen at all, will be sustained given all the ongoing fighting.
Note that the numbers are exports/sales. Production is higher, 3.4ish mbpd. Production in 2012 was 3.2 mbpd and less last year as I recall. 500K bpd is being held up by disagreement with the Kurds.
Viewed against the 2012 production number, this is a 200K bpd increase or a bit less than 10% over 2 years. If they get the Kurds to agree with whatever they will have a solid year of growth, but it’s best to view this in the context of some of the old projections of 17 million bpd by 2017 that was flung around maybe 5 years ago.
The latest is 4.5 mbpd by 2020.
I’m looking for a panel video discussion I saw a while ago on the internet. It was about an hour long and I think there were 3 panelists. Art Berman was one of them. It was all about shale and future energy policy and all.
Maybe this one …… https://www.youtube.com/watch?v=ZKRyq5RubOY
Close. But not the one. There was one guy who was pretty interesting…I remember him talking about ‘lots of people drill wells and they do it for different reasons. Some of them do it because they’re stupid. Some do it because they know more than you do. Some do it to lock down leases”. there was another fellow (I think an econ professor) who made a point about scale ‘The main thing to realize about energy is scale. I have students ask me “why don’t we use more nuclear like France”, but then I ask them how big they think our nuclear industry is compared to France’s…and the answer is that it is two and half times as big’.
I think it was some group at Rice or somewhere in Texas. One the left was the econ prof, middle was the interesting guy, right was Berman.
I used to see it all the time when I did video searches, but now I can’t find it when I want it!!!
Found it:
https://www.youtube.com/watch?v=ds8eek0e8qM
re: “they hit Peak Exports in 1995”.
And the room full of elephants is that pesky increase in domestic consumption including desalination needs for increasing population.
Paulo
Speaking of the Brits and their stupidity in running down their North Sea endowment for seemingly little long term game, I do watch the increasingly precarious energy situation my former homeland is getting into:
http://www.telegraph.co.uk/finance/newsbysector/energy/10678417/UK-energy-security-at-risk-as-gas-imports-surge-Centrica.html
– 38% collapse in oil and gas production from the North Sea in just 3 years
– 70% of gas to be imported by 2020
This is punching an enormous hole in the UK’s trade deficit which is getting increasingly worse – the markets seem to be blindingly ignoring this (as they are in thrall to the money printing of the BoE) but one day the fact that the UK cannot pay its way in the world is going to hit home big time. The UK’s roll out of renewables seems to be being stymied by various pressure groups, and its attempts to re-start nuclear looks too little, too late. As for fracking…….well we will wait and see. I am glad I pulled all of my assets out of the UK some time ago, as unfortunately I think it is not going to be a happy place in the near future……..
Why were the British so short-sighted in regards to the North Sea supplies and energy in general? (I suppose most countries have been though to be fair!)
I see UK population is still rising due to immigration, do the politicians have any idea that this may become a major liability in the future?
‘Why were the British so short-sighted in regards to the North Sea supplies…?”
Well Thatcher rushed production in order to break the coal miners’ union by converting coal power plants to oil fired, although it was just good luck from her point of view that the NS resource was coming on when she arrived at No.10.
But more generally it was because they believed the abundance meme that is still around today… why would oil be worth more later seen there’s so much of it about?
It is ironic that the three fields that broke or at least reduced OPEC’s power in the 1980s; North Sea, North Slope, and Cantarell, are all now in secular decline, yet we still not only misread the present but also continue to mis understand the past…
More here on UK oil, thanks mostly to Jonathan Callahan:
http://transportblog.co.nz/2013/04/12/oil-dependancy-and-the-wealth-of-nations/
Patrick,
Excellent and well presented information. The one thing I would disagree with is Norway doing a wonderful job. Their planning/engineering is certainly very good but in the long run they’re going the same direction as everyone else, just taking a slower path.
Yes the real difference between Norway and UK is population. Much easier for Norway to bank the cash from its FF treasure with only 10% of the number of citizens. Still it is very hard not to conclude that the UK North Sea boon has been basically pissed away for only very short term gain, now all but over.
UK energy situation is both very desperate and very poorly managed. That nuclear deal with the French is uber crazy. As has been the privatisation programme there: if government ownership is so bad how is ownership by someone else’s government is better?
“Why were the British so short-sighted in regards to the North Sea supplies and energy in general? (I suppose most countries have been though to be fair!)”
It’s not voluntary. The words “relentless” and “destined” and “inevitable” all mean the same thing for these matters. They pumped it and burned it because that’s where GDP comes from and without GDP, the population starves.
Descent is coming. It will be permanent.
Seems they might o’ be’n ‘fluffing’ that Bakken BCO!
Too Much Propane Could Be a Factor in Exploding Oil Trains
By Marcus Stern and Sebastian Jones, InsideClimateNews.org via Bloomberg, Mar 5, 2014 4:58 PM ET
Dennis, Rune, Enno et al,
You might need to revise your models. What portion of those Bakken barrels really were oil?
aws.
This is a significant item.
The much ballyhooed API rating of Bakken that allows it to be called “oil” is very probably measured after separation of NGLs. Of course, if you don’t separate them, then per unit volume that API would climb right up there outside the “crude” definition.
This is quite significant. Of course no company is going to want to separate, pressurize and commission a truck to carry the NGLs. They are worth less, and in that great video of 1000s of rail cars waiting to carry crude, you can just see the accountants not wanting to pay for a car to carry lower price NGL. The probably do leave it in the crude. I wonder what the refinery does.
I could see an occasional operator doing that. But the refineries are going to know what goes in the oil. If the amount of propane is so much that it “fluffs” the oil to extent that you don’t get good products out of it, the refineries would not pay for it. If it’s just a minor annoyance, big deal. (there are always some light ends in the oil regardless, it’s not perfect separation.) All the evidence I’ve seen has been that Bakken oil is competitive at refinery doors (e.g. see EOG’s CBRed Bakken crude to Gulf Coast which competes with LLS.)
Somehow peakers want to say any new oil is “bad”. But they have not proven this with assays. Just little stupid whispering. EF oil is a lot more variable and lot more NGLish. But Bakken Oil is equivalent to WTI/LLS.
LLS is probably not the right yardstick. Bonny Light is. And there’s very little WTI being pumped anymore.
And of course maybe the refineries don’t pay for it. Maybe this more than transport costs is why the price is lower.
Eagleford output is widely known to be condensate and not crude.
There is an RBNsomething or other link some months back I’m not gonna look for that addressed the kerosene/diesel lack in Eagleford.
Propane uncompressed is gaseous. I don’t recall hearing talk of compressors at wellsites to liquify it and then commission trucks for it. Surely we would have heard of NGL supplement revenue for the companies producing by now if it was happening. We do know there is a lot of flaring from the night photos. But now . . . if they flare they get fined.
Probably, probably, probably. Show me some data instead of your rumors. The refineries know what they’ve gotten after they refine it.
The RBNenergy blog has gone subscription and even the archives are not accessible.
The Eagleford blogs (http://eaglefordforum.com) are peopled by land owners complaining about their decreasing revenues and price received. There is talk of API 55 product flowing.
And this:
“The San Antonio paper had an article on truck traffic in the Eagle Ford today. Quoting figures from the state, they estimate 1,184 truck trips to bring a well into production, 353 trips a year to maintain the well and 997 trips every 5 years to “re-fracture the well”. First I’ve heard of re-fracturing. Is this something we should expect?”
The replies from mineral owners say it’s wishful thinking and media error and that no refracking has happened on their land. Those truck counts are a little surprising in that I thought they had more pipelines in the Eagleford than the Bakken. Apparently it’s the same thing. Trucks, not pipes.
Slightly amusing tone to the comments . . . much like Argentina. They float things “they heard” suggesting attempts to collect gas rather than flare it. It’s all about royalty revenue and they don’t care if it’s profitable to the company. Just like Argentina.
http://eaglefordforum.com/forum/topics/eagle-ford-well-production-decline-rates
Lotsa talk of Chokes. Moves taking place to choke back initial flow to “maintain pressure and improve EUR”. There were some oblique comments about expected future higher price as further choke motivation.
It’s hard work to get thru that forum but there is gold in there. Trucks don’t ship gas. A LOT of flaring going on and there are a few comments about NGLs and condensate mixtures as well as some incredulous talk about quoted API for the whole field when all the posters have land that doesn’t produce that.
The Eagle Ford has a lot more variability. From oil to wet gas to dry gas. API of the liquids is quite variable and there is some that is very light. I don’t debate it. Bakken oil is another kettle of fish.
Okay some data is emerging as to the cause of the terminal slowing in late Feb.
It was about the flammability of the rail content, aka NGLs in the crude.
Feb 28 (Reuters) – Oil shipments by rail from the booming Bakken shale in North Dakota have slowed over the past two days, data showed on Friday, but a U.S. regulator knocked down rumors that some terminals have been shut down due to new rules.
The ability to test those cars apparently is weak and slowed shipments. The gov’t immediately backed off.
(Reuters) – U.S. regulators on Thursday modified rules governing the testing of crude transported by rail following concerns that an emergency order one week ago could stymie deliveries from North Dakota’s Bakken shale to U.S. refiners.
The Department of Transportation narrowed the scope of testing requirements laid out in its Feb. 25 order, saying that shippers must determine the flash point and boiling point of crude oil cargoes, but would not need to measure additional specifications provided they were familiar with the oil.
Sounds like it’s not all oil.
http://in.reuters.com/article/2014/03/06/usa-rail-order-idINL1N0M31DA20140306
Fluff then ruffle…
BP Splitter Refinery Seen Skirting U.S. Oil Export Ban
By Alex Nussbaum and Bradley Olson, Bloomberg, Mar 6, 2014 4:22 PM ET
From IEA’s January 2014 OMR (pdf)
North American Refining: Changing Crude Supply & Qualities
Presentation by Michael Leger at the COQA in Dallas, TX, on November 7, 2013.
Some other presentations that may be of interest… here
Getting lighter and lighter…
Nony,
I kind of think this settles the discussion?
BTW, also check out slides 17 & 18. The yield of middle distillates (diesel) from Canadian Heavy (WCS – dilbit) is set to decline! Not surprising as growth from the tar sands is from Steam Assisted Gravity Drainage (SAGD) operations as what’s left is too deep to mine. Even in the tar sands the easy stuff has already been exploited.
What’s going to do the heavy lifting when the diesel yields decline?
Give me a link to that presentation please. I’ve put up other slides and links that said Bakken was near identical to WTI. Also, EOG claims to get favorable pricing over LLS at Gulf Coast refinery doors. (Costs more to CBR it there of course.) In fact I gave like 7 links and didn’t get a single comment.
The first and third slide i posted both had the link to the presentation.
OK, I looked at it. Thank you. Presentation seems fine. No info in there to call Bakken oil undesirable. It is kissing cousins with WTI. Transport is an issue and the US mismatch of refineries (and export ban), which is why we see the WTI-Brent differential.
Nony,
I posted this a while ago, and I believe Watcher has mentioned this before too.
Processing shale oils in FCC: Challenges and opportunities
09.01.2013 | Bryden, K. J., Grace Catalysts Technologies, Columbia, Maryland; Habib Jr., E. T., Grace Catalysts Technologies, Columbia, Maryland; Topete, O. A., Grace Catalysts Technologies, Houston, Texas
It is worth noting in the table that published data indicates Bakken API to be > 41, not 41 but the more undefined greater than 41, unlike WTI which is defined as having an API of 40.
Notably Bakken LTO’s API is way lower than Louisiana Light Sweet and yields much less diesel.
The key point the presentation is making is that the API gravity of the crude being refined in the U.S. has, and will continue, to become lighter. This will mean less diesel yield for the volume of crude refined in the U.S.
Bear in mind cars in Europe run on diesel.
I suspect the declining refinery yield of diesel explains in part the premium diesel is getting over gasoline.
As I have said before diesel, at present, does the heavy lifting in this world. I don’t see this temporary glut of LTO lowering the price of diesel.
Yeah, we’ve discussed that paper and I’ve posted that chart too That paper definitely does not say Bakken oil has worse yields than WTI. Yes, you will get less diesel, but more gasoline.
I posted the links by Continental showing refinery netbacks and discussion of differentials. I don’t know anyone except y’all here who is saying that Bakken gets less $$ at the refinery door than WTI. Everyone else considers transport to be the issue. I posted several links in last thread.
Alberta Regulator Quietly Halts Steam Bitumen Mining Near Fort Mac
After several leaks, production frozen while technical review is conducted.
By Andrew Nikiforuk, Today, TheTyee.ca
The Loophole Big Oil Uses to Pump More Crude
Companies apply for capacity below a project’s potential, then jack it up later, under less scrutiny.
By Robyn Allan, 3 Mar 2014, TheTyee.ca
Here’s a line or two about tight oil and gas that is from a Reuter’s article.
The Mr Bott is the president of Continental Resources.
Some experts say the boom will not last, as shale wells have high decline rates shortly after production starts. However, Bott challenged that view, saying that while initial decline rates may be steep, production will continue at lower levels for a long time.
“It has a really long tail,” he said. “It’s that tail you’re counting on.”
It is my impression that most wells of this sort decline right on down to stripper status within five or six years.
Doe any body know how low the production can go on a tight oil well before it becomes unprofitable to keep pumping it ?
From the trucks perspective, note that you can fire most of the drivers and have them take their trucks elsewhere. One 200 barrel truck can visit several stripper wells each day and load up. So in terms of overhead, that particular item is not fixed.
However, the well count is going to grow.
Wikipedia defines a stripper well as 10 barrels per day (google “stripper well”). This equates to 300 barrels per month. According to USGS*, the average Bakken/TF well is doing about 1000 barrels/month at 5 years and about 600 barrels/month at 10 years. So it’s probably not a stripper well until about 20 years.
*See http://pubs.usgs.gov/of/2013/1109/OF13-1109.pdf (I used figure 7. note that captions for 6 and 7 appear mislabeled as TF/Bakken curve should be in between the higher Bakken and lower TF curves.)
Hi Nony,
That is a great link, but the best chart to use in my opinion is figure 6 which gives the average well for all of the Bakken/Three Forks. In that chart the average well has an output of 400 barrels per month at 10 years. If we assume the well has reached the exponential decline phase at 10 years and assume a 10% annual decline for subsequent years. this average well would be at 139 barrels per month or 4.6 barrels per day at 20 years, a 7 % exponential decline would get us to about 194 b/month at the 20 year point or 6.5 barrels per day.
I disagree about the charts being mislabeled, in every instance in the report, the reference points to the charts being where they are supposed to be. It is not a huge difference, and beyond 3 to 4 years it is just an educated guess any way. Enno’s data points to about 910 b/ month at month 120. If we assume a 9.5 % decline rate (which gives us a EUR30=360 kb) we would be at 335 b/month at year 20 so close to stripper status.
Perhaps you can tell me mathematically how this is possible:
Average of A > average of B > average of A and B
🙂
Hi Nony,
Ok I think I have it. When you look at wells in the Bakken/Three Forks and how they are classified by the NDIC some are labeled Bakken, some are labeled Bakken/Three Forks and some are labeled Three Forks.
In North Dakota see
https://www.dmr.nd.gov/oilgas/stats/2012Formation.pdf
where you will see that most wells as of year end 2012 were Bakken wells 5218 Bakken wells and 16 Bakken/Three Forks or Three Forks wells. So it turns out that we were both incorrect, figure 5 would probably reflect the average well most closely rather than figure 6 ( as I suggested earlier) or figure 7 (which I believe that you think is best).
Also it may be coincidence but figure 5 seems to match Enno’s data pretty well.
So figure 6 is not what we initially assumed, but if it were you would be correct that my logic was flawed.
Do you know what the last chart is “upper Bakken”. Tyler? I looked at the other USGS fact sheet but could not figure it out. Really, the whole thing does not seem to have been well written up.
Here is another popular article, in case you have not seen it:
http://digital.ogj.com/ogjournal/20140106?sub_id=lZSFuEXcNEir#pg54
I thought of the upper bakken as older wells, but I could be totally wrong on that. The short answer, I don’t have a clue.
http://www.ndoil.org/oil_can_2/faq/faq_results/?offset=5&advancedmode=1&category=Bakken%20Basics
Heads up. A Q&A from something called the North Dakota Petroleum Council.
Two A’s are semi new info:
“The distance into the formation a fracture stimulation extends depends on the mechanical properties of the rock as well as the rate, pressure, and physical properties of the fracturing fluid. The typical current Bakken fracture stimulation creates cracks that may be as long as 1,000-1,200 feet.”
That’s an eyebrow raiser contrasted with that presentation on more narrow horizontal spacing. I think that spacing was less than this number.
The second A:
“Engineering analysis of the new Bakken wells indicates they will produce for about 30 years. Most new Bakken wells have been frac’d twice and many three times.”
Noting from the Eagleford forum, the land owners sneer at talk of refracking. They say it is widely talked about and more or less never done.
The interaction distance is 2000, agreed. Has been written about.
They will downspace anyway at 100/bbl. It’s still worth the $$$ to add an additional 3X of wells and go to 500 ft spacing. Even if the new ones produce at 70% old ones. (Obviously those are made up numbers, and specifics will be calculated of what is the optimal amount…but that’s the general tradeoff they look at.)
I don’t see any evidence of refracking going on, yet. The only ones being refracked are wells where they messed up the first time and had a problem or did a single stage or the like. They may (or may not) decide to refrack later (depends on declines, pricing, and how much it helps), but it’s not happening in the working bulk of the play, now.
Good sleuthing. Nice that you figured out what the labels were based on the ND data.
Using Enno’s data I get a well profile with EUR30 (30 year) about 360 kb when I fit a hyperbolic to the average of the 2008 to 2013 data. Hyperbolic out to 86 months (about 7 years) and then using the month 86 decline rate and then an exponential decline from month 87 to month 360 (about a 9.5% annual decline rate from year8 to year 30).
Chart is below and an explanation of the hyperbolic.
Math(s) warning, ignore the following if you don’t like mathematics:
For the math inclined the hyperbolic equation is q=qi/[1+D*b*t]**(1/b) where q is output in barrels per month, t is time in months (I use t=0.5, 1.5, …, 359.5) and qi, D, and b are constants. (* stands for multiplication and ** stand for exponentiation in the equation above). The best fit was using qi=11,534, b=1.4, and D=0.19.
Beautiful analysis. However, I caution against a pure hyperbolic. Perhaps that will occur, but it is not the normal wisdom. A lot of the work on shale gasses really has seen these turning points where it slows to exponential. Even with shale oil, there have been a few wells drilled from a long time ago (e.g. vertical fracks in the 90s IN THE SHALE) that show more of a two-step model. I haven’t parsed the data personally, but it’s definitely more than just companies saying this, some academics and USGS also.
I think that what will happen is that well IP will go down over time (with downspacing). I’m not sure how USGS models this. The current population has some different dynamics than the later population (or even the current population after someone starts “stealing their milkshake”.
Hi Nony,
I guess this was poorly worded.
“Hyperbolic out to 86 months (about 7 years) and then using the month 86 decline rate and then an exponential decline from month 87 to month 360 (about a 9.5% annual decline rate from year8 to year 30).”
The curve is hyperbolic for the first 7 years, then exponential thereafter with a 9.5 % exponential decline rate.
I agree that the IP will probably decrease as the sweet spots run out and/or downspacing occurs.
Also note that using a pure hyperbolic gives a higher EUR rather than a lower EUR compared to exponential decline.
In fact for the model to make sense with b>1, the model has to switch to exponential decline to make physical sense because a hyperbolic well profile with b>1 will result in an infinite cumulative output.
So the model presented is the two step model you describe (hyperbolic for 7 years followed by exponential decline from year 8 to year 30).
What is not obvious is when the switch from hyberbolic to exponential occurs, one way to determine this is to do a log(output) vs time chart and see where the plot starts to become linear. The chart below does this and adds a trendline for 36 to 64 months, the slope is -0.0155 indicating a 17% annual decline rate over the 3 to 6 year period, I used a much more conservative 9.5% annual decline rate from year 7 so my well profile may be too optimistic.
Good stuff, DC.
Even ten thousand wells at twenty barrels a day is only two hundred thousand barrels.
That long tail looks pretty skinny to me considering
the long term.
Man up and drill, baby, drill. Let the testosterone flow.
http://www.miataturbo.net/attachments/race-prep-75/58905d1351878745-should-i-drill-hole-my-engine-block-sarah-palin-drill-baby-drill-jpg
OFM,
A lot depends on prices, and when and how fast the EUR declines, NDIC predicts 40,000 wells so at 10 years and 25 b/d per well we would have 1 MMb/d.
Note that it is not this simple because we don’t have 40,000 well coming on line each month, that’s the reason I do my models to try to approximate 165 wells per month coming online and then guessing at EUR decrease over time (which is completely unknown, but will happen eventually at a rate which is also unknown).
I use the USGS estimates as a guide to total TRR to make more reasonable guesses, but they are guesses nonetheless.
I agree the tail is not very fat.
I had another look at the North Dakota data, as I was interested in 2 KPI’s:
1) Number of wells starting production per month (first time > 0 oil production)
2) Average well peak production per month (min 1000 barrels, and next month has to decline). I am only looking at the oil number (aws. might say it’s not all oil..:)
Others have looked at this as well (e.g. Ron, Ovi), but this is extracted directly from the details of the monthly reports. As others (e.g. Nony) has mentioned, these are 2 KPI’s to follow as early indicators of how the trend will play out. I am looking here at all North Dakota wells, that are reported as single wells, and have no errors in the reporting (e.g. double reporting).
Note that because of the definition of the 2nd KPI (next month has to decline), there is one data point at the end missing. Also, in each month the wells are not the same (starting first production versus wells having their peak production).
This shows that although indeed during the last few months the average peak output has increased again, it’s not significantly higher than in the past. The number of new wells still seems to increase (besides a bad December). I think it is reasonable to expect that this will still continue in 2014, but it will be interesting to see for how long.
Enno,
Great information. So over the period you have data, the average peak monthly output for new wells has been around 14 kb +/- 2kb, roughly? Actually the average is 13.7 kb/month based on data you shared with me, with a range of 13.3 kb/month in 2011 to 14.2 kb/month in 2013. Very interesting chart, especially the relative stability during 2012 and the relative instability over 2013 with output jumping from 12 kb/month early in the year to 16 kb/month late in the year. Thanks.
What is a KPI?
A KPI is a Key Performance Indicator. It’s basically a value that reveals the condition of something you want to measure. When you want to know, e.g. the performance of a company, your personal financial situation, global climate change, or anything else, it helps to think about which indicators could give an easy but accurate picture of the true condition (typically the true underlying condition cannot be measured directly).
In this case, the number of new wells, and the quality of new wells, are 2 simple to measure, but accurate indicators of whether investment in ND is growing/declining, and on the success of that investment, from which we can make quite accurate short term predictions.
I only measured these KPI’s from 2010 onwards, as it was already clear that until 2010 the quality of new wells was improving. Indeed output of the peak month keeps falling in the 14+/-2 range. The data you have should be very similar (except for the minor changes in the definition of the peak month, and only Bakken/TF).
Hi Enno,
Maybe a better KPI would be cumulative 6 month output?
Hi Dennis,
For sure. Unfortunately that will also result into some delay. Therefore, I intend to track both this first monthly figure, and the longer cumulative trend.
Hi Enno,
Rune Likvern follows the 12 month cumulative as a KPI, I suggested 6 months to reduce the delay by 6 monhs (from what Mr. Likvern has used), you could use 3 months, when you look at the longer term cumulative trend, a chart like your chart above with 12 month cumulative or 24 month cumulative (or whatever longer term cumulative that you think is best, would be interesting (I think 12 or 24 months would work), but the month by month change (or perhaps quarter by quarter change) over time (as in your chart above) would be instructive.
I’d be interested in the average time to produce without pump. And how variable that is, is it correlated to IP, etc. (I guess obviously it would correlate to choke also). I’ve seen written that you have to have several months after AL (artificial lift before you can really call the IP.
Anyhow, it’s just interesting to know if there are any wells that just gush for a long time.
Killer analysis, Enno. Love your stuff.
I don’t know if you can easily normalize for lateral length? Just kind of a nit and I doubt it changes the answer.
I’m thinking that a subscription to ND “premium services” as well as the Drilling Info analytics suite would make this a lot easier. Although we do pretty damned well just using Google and Excel and brains.
Hi Nony,
Enno’s brains are what has given us this treasure trove of data, even the Basic subscription might give us a little more information. My understanding is that Enno has used his programming skills to pull this data from the freely available monthly reports at the NDIC.
Enno has data on about 4680 Bakken/Three Forks wells with 12 months or more data and 2868 wells with 24 months of data or more starting production between Jan 2008 and Dec 2011. If we use only 2010 to 2013 data there are of course fewer wells and the 12 month total is reduced to 3800 wells and the 24 month total to 1980 wells.
I am pretty sure that we don’t have info on lateral lengths or fracking stages.
Great “adapt and overcome” with the data extraction.
https://www.youtube.com/watch?v=gyPI438nGjI
🙂
Enno:
I think your 2 KPIs are all we need and that lateral length is already implicitly included in the average IP. So, if laterals got longer, that would just show up in the higher IP. IOW, it’s almost like better completions from fracking changes. I guess there are some other interesting reasons to look at it (e.g. is more of the land being exploited).
There is some writing about EOG and Whiting shifting to shorter laterals and more frack length, higher proppant content as a strategy. But probably hard to really look at this without looking only at their wells.
It’s not difficult to distinguish between different companies, as that’s all in the free data. But indeed other info like lateral lengths etc is not. I’ve thought about those premium services, but expect that it will require quite some additional effort to correctly extract & interpret that data as well, and will increase the data size. So far I was not yet sufficiently interested in it 🙂
Ron,
When predicting the future it’s not sensible to divorce peak oil (including gas and coal) from global warming. It may be a simplistic metaphor but Australia seems to be the future arrived: a country reliant on energy exports even as it is being baked into a desert. There’s an applicable item to this on today’s BBC world news entitled “Carbon Bubble Threatens Stock Markets” The premise of this is that much of our coal, oil and gas may have to be left in the ground to combat climate change, implying that a percentage of booked reserves are bogus.
So, financial stability is threatened if shares in fossil fuel companies turn out to be overvalued because the bulk of their oil, coal and gas reserves cannot be burnt without further destabilizing the climate. Meanwhile, the current business model assumes that there are no emissions limits; there will never be emission limits. But, the United Nations Framework Convention on Climate Change hopes to successfully conclude a comprehensive global deal by the end of 2015 which has the potential to have implications for investors the world over — by limiting fuel emissions.
Given the choice between baking the world into an uninhabitable dessert, or not keeping industrial society going another 30 years, then the people with power on this earth will chose the former without even a twinge of regret. The world is run by the banks, and bankers understand the bottom line and nothing else.
DC, if you haven’t already done so, I recommend to watch this video and some of the discussions on b factor and in particular natural gas. Also, the Ralph guy really has been a big whig in the investment decisions. He’s seen it go down. And some remarks about Simmons along the way (and they liked him fine, just thought he was too much a bear).
https://www.youtube.com/watch?v=iWD9YD_C8IM
This is also a good one (someone else linked it, I think):
https://www.youtube.com/watch?v=ZKRyq5RubOY
Note that Art Berman talks first…so you will hear the geologist-pessimist view, you are familiar with. Then the middle guy talks Marcellus. And he’s not a Seeking Alpha stock tout. Not even a company person. But a PSU academic. He as some good insights on b factors and on the Marcellus success. Lastly there’s a finance guy. Maybe at first he seems like a goober, but watch a while and he comes over as pretty savvy.
Just for you, big man (DC). Make sure you read to the end.
Really kind of a killer chart showing higher wells drilled/rig in the recent history. Not sure how much this is learning and how much it is just the different “mining” nature of shale plays. But it’s something…
http://www.rigzone.com/news/oil_gas/a/131943/Musings_Fewer_December_Bakken_Wells_Point_Out_Shale_Challenge
Hi Nony,
Probably the shale plays, where less time is spent exploring and all drilling is development drilling.
I think that chart is probably oil and gas rigs because Baker Hughes shows about 1800 total rigs operating in the US, very roughly we get about 4 wells per rig each month (8000/2000). I don’t know where all these wells are being drilled because in the Bakken and Eagle Ford we only have 400/month at most, maybe 800/ month in the Permian so 1200 wells per month, we will add another 800 oil wells per month in other plays in the US to bring the total to 2000 wells per month.
So that would indicate 6000 natural gas wells drilled per month? Something doesn’t add up.
I actually looked further, the 8000 well part of the chart is bogus, it should be more like 3700 wells per month in 2012 see
http://www.ogj.com/articles/print/volume-111/issue-1/special-report-forecast-review/slower-drilling-pace-likely-in-us.html
Elsewhere they said completions were up 5 % in 2013 so 3800 wells per month in 2013, up from about 2800/month in 2010 (EIA data).
Trust but verify.
hmm…wonder how they got it so wrong. great check.
I wonder if you plot the data right if their point is still made. (That drilling is happening faster because of a greater percentage of pad drilling.)
I think their point is correct, the graph just overstates it by a factor of 2, about 4000 wells with 2000 rigs or 2 wells per month, instead of 4 wells per month, there is definitely an increase in rig efficiency and it is likely a combination of pad drilling, walking rigs, and shale plays where less exploratory drilling is needed.
If we are getting four wells per month from 1800 rigs that is not a long way from a hundred thousand wells per years and so we may be seeing that many drilled annually in the fairly near future.
This brings up the question of how long it take a drilling contractor to put his hands on a new rig once he makes the decision to buy it.
There can’t be very many companies capable of building them and ramping up the production of new rigs is apt to be pretty slow.
Somebody here probably knows a lot about this constraint on production and hopefully will say a little about it and maybe post a few relevant links.
Thanks in advance as usual.
There were some stories I saw about new rigs being built. There is a market for them and turnover of rigs. Presumably the new ones have some ways that they are better, but I’ve heard that rigs built in the 60s are still active. There are different kinds (obviously onshore and offshore) and some optimizations for arctic drilling. I had heard a snippet to the effect that total number was declining. Sorry, that’s all loosey goosey, but you can just google it yourself:
Old Farmer Mac,
I think it is 2 wells per rig per month so about 43,000 wells per year. I am not sure we need a lot more rigs, some replacement of older rigs, yes.
Likely 43,000 wells per year is enough, and as EUR starts to decrease in the LTO plays, profitability concerns will lead to a reduction in this number, unless oil prices increase by quite a bit (starting around 2017 or 2018), say by 5 % per year or so.
Some (more) Berman negatism:
http://oilprice.com/Interviews/Shale-the-Last-Oil-and-Gas-Train-Interview-with-Arthur-Berman.html
What is a ”b factor”?
Hi OFM,
A hyperbola is y=1/x, for wells we use q=1/t (q is oil output, t is time). It is modified so it doesn’t blow up at t=0 to q=1/(1+t).
The b factor is related to an exponent on the (1+t) in the denominator of our hyperbolic equation.
If we think of (1+t)**a, where ** stands for exponentiation (as in x**2 is x squared), then b=1/a so if a is 2, b is 0.5 and if a is 0.5, then b is 2.
The b factor just changes the shape of the hyperbola, larger values of b result in a slower decline than small values. See chart (pictures are worth lots of words).
Here are some Barnett type curves.
http://info.drillinginfo.com/wp-content/uploads/2010/06/Blog-11-Chart-21.png
I wonder how tight oil and tight gas type curves compare.
Dennis,
With all due respect would you please explain to me (us) how the above equation(s) contributes to the discussion about peak oil, Bakken, or anything. For one thing, and correct me if I’m wrong, this is merely a case of (simple) curve fitting, the kind of exercise a bored professor might assign to a collection of not very bright first year students so he could get on with something interesting. Playing with exponential values to make an equation look like real data was a little bit of a challenge 40 odd years ago – before personal computers. Not now. If you were going back to first principals of fluid dynamics and applying non linear differential equations to give us something original I (we) might be impressed. Not with this kind of stuff; common man.
On the other hand, perhaps I’m just missing the boat. It’s true, I’m an old guy now, probably not too bright, and need really clear explanations. Indulge me, please.
Someone asked what a b factor was. There are some people who don’t follow mathematics very well, I was not attempting to impress, but to explain.
If you would like higher level mathematical expositions try
http://contextearth.com/2014/02/21/soim-and-the-paul-trap/
it is not about peak oil, but climate change. If you follow that discussion of the Southern Oscillation Index and attempts to model it, perhaps you can explain it to me here 🙂
Dennis, OK but please don’t get carried away and let’s not confuse “simple curve fitting” with mathematics. In addition, don’t you dare say that when the exponent is not a whole number this justifies your nomenclature because, though strictly speaking it’s true, there’s no intellect whatsoever involved in adjusting garden variety curves to fit some dots on a piece of paper and looking up equations in a book. So let’s move on, kiss and make up?
Doug
Doug,
I don’t get what your issue is.
It’s not at all abnormal how DC is discussing the curves. The actual curves are the result of rather complex fluid dynamics problems. The curves are descriptions of natural results that lack the clarity of Keppler’s laws or the like. There are some microscopical explanations, but still it’s easiest to just think of the curves as observational. So what. Lot’s of science in this world proceeds by observation…look at chemistry and zoology. Heck even solid state physics has some issues like this (e.g. weak localization of electrons, described parametrically in materials that are not perfect semiconductors or perfect metals).
The point about describing the model (hyperbolic, or hyperbolic-exponential) and then labeling the parameters is that we are using limited data to estimate the behavior of a POPULATION and in the future. So it’s completely relevant to say what your model is, what your b factors are. This enables discussion of “is it reasonable or not”.
Nony,
“I don’t get what your issue is.” And here I thought it was so obvious but let me say it once again: A graph generated via curve fitting isn’t science and adding a simplistic equation to the curve doesn’t add credibility, or make graphs more useful, or more understandable. It’s just a curve! I also said, let’s move on but if you insist I will add: there are no end of examples of people generating equations and using them to (supposedly) add authority to some argument or other. But, unless the math comes from basic principles, it’s just pseudo intellectual smoke. Of course, oh never mind…….
Kepler came up with his laws of planetary motion solely based on observation and then was able to use them to make accurate predictions of the future. That is exactly how science works. When Newton showed that he could derive the same rules based on the inverse square law of gravitation that was icing on the cake. Once Newton validated his inverse square law against Kepler’s empirical rules it was off to the races.
Kepler’s teasing out how to “fit curves” to observations was much more than pseudo intellectual smoke.
Nony,
Right, so by extension Dennis is the next Kepler and you become the new Newton. Or is it the other way around? Man, I’m so confused these days. Still, it’s really encouraging to find out that a person can be equated a great scientist by employing a bit of high school math — or arithmetic!
Nony,
P.S. Just for the Hell of it, and being uber-contrary, I’ve (sort of) reproduced Dennis’ curves using Bernoulli’s equation combined with famous the one-dimensional continuity equation, a relatively common procedure used by people who do this stuff. How useful is this? None, no use whatsoever! I simply played with some variables until curves that looked like (are) exponential decays emerged.
Must say, it all looks quite impressive though. There is, of course, a Bernoulli equation for incompressible fluids which might actually have some real applications here and no doubt have been applied by many but, the math is beyond me these days.
I’d send it all along for your review but I don’t have the faintest idea how to incorporate math symbols into text in a way that wouldn’t arrive garbled. I don’t even know how to add that round yellow smiling face. Anyway, let’s just move on shall we?
Doug:
I appreciate your good heartedness. I don’t want to argue since this is basically an open kimono type thing. It IS curve fitting. No one is trying to say that the hyperbolic, b factor, step to exponential is anything but a parameterized curve.
Yeah, everyone knows the theory of fluid flow and there are even discussions of the regime of flow (diffusive, desorption, etc.) At the end of the day, though, you are talking macro systems with tiny cracks. It’s not an idealized throat of a nozzle. It’s not even a material with uniform porosity. But there are still characteristic curves based on the types of rocks and their characteristic microstructures.
Nony,
“everyone knows the theory of fluid flow” No, I don’t think so. Not everyone.
Doug
As i said before I am not trying to impress you or anyone else. How do you define maths? Algebra does not count?
You are correct there is little science involved. Once you’ve got the science you still need to match theory with the world.
sa
Dennis,
That’s quite a good question and it would take a mathematician to give a rigorous answer. In my mind algebra can generate exponentials as long as you stick to whole (and positive and real) numbers. Of course you’re not restricting yourself this way so your work qualifies as math.
And Dennis, please don’t let my tirades get you down. Believe it or not, we’re all on the exact same side here!
Doug, I am a bit surprised about your criticism to Dennis. His posts never seemed boasting/trying to impress to me, and very much educational. Also, making models about how these shale wells produce seem to me very relevant in getting more understanding how these new developments impact the peak oil situation, and I much appreciate his attempts. I don’t see how “complex” curve fitting would add more value than “simple” curve fitting.
ENNO, Actually, I’m not criticizing Dennis who I recognize has, and is, making an first-rate contribution to the Peak Oil discussion. Even Nony comes up with a useful comment, on rare occasions. What I don’t like (and will not apologize for), is people throwing about mathematical equations as if they add weight to an argument — when they don’t. Yes, we’re all familiar with decline curves here. But, my point is, any respectable scientist, engineer or mathematics buff can generate a vast, some would say infinite, array of equations that can be “forced” to fit Nature’s curves. The equations DON’T CONTRIBUTE TO THE DISCUSSION unless they are a coming from theory or pure logic.
Hi Doug,
I think what you don’t like is seemingly arbitrary equations being thrown around as if they add some weight to an argument.
I agree.
http://www.hamiltongroup.org/documents/Decline%20Curves%20-%20Dr%20Stephen%20Poston.pdf
The link above explains some of the decline curve analysis, which as you correctly point out is mostly a curve fitting exercise and not particularly “scientific”.
As I pointed out earlier I was attempting to explain what a “b factor” was to those not familiar with the Arps equations (which have been used for decline curve analysis for about 60 years or so).
I only introduce these concepts, so that those like myself, who would like to take the analysis further can easily do so.
When I (or someone else) posts a chart, it is very difficult to pull the numbers together to verify the analysis. The “mathematical equations”, which you object to simply serve as a shorthand to communicate this information to others.
For example, if there was some significant concept (kinetic energy, say if it was a novel concept) that might be presented as the chart below, or we could simply use a shorthand such as KE=1/2m*v**2.
So if m= 1 kg, KE(kinetic energy) is one half velocity squared which is just a convenient shorthand for the chart below.
The “mathematical equation” is simply a shorthand so that others (that have an interest)can reproduce the chart with less work using a spreadsheet. That is all I am attempting to do when I provide the qi, D, and b parameters that I use to fit an Arps hyperbolic to the data provided by Enno,
if it is uninteresting, then simply ignore it.
Thanks Dennis
My last close encounter with any math more complicated that common arithmetic was back in the dark ages.
I did get a couple of years of the real stuff in college but I have forgotten too much of it to solve problems of the sort you are working on but I can still appreciate the graphs and what they tell us.
Thx old farmer mac, I am a little less sophisticated than Mr Leighton and can’t really do a lot beyond basic calculus. Sometimes people get confused by a hyperbolic, but you may not be one of those people.
http://www.bloomberg.com/news/2014-03-06/argentina-oil-s-bonanza-helping-too-few-led-by-political-friends.html
This link is to an article that goes into considerable depth concerning the politics of oil in Argentina.
It’s the longest Bloomberg article I can remember.
It appears at first glance that nobody has anything on the Argentines when it comes to corruption.
My guess after reading it is that while Argentina probably does have a potential bonanza of tight oil it is extremely unlikely that more than a trickle of new production will find it’s way out of the ground within the easily foreseeable future.
Argentina might with a little luck turn the political situation around in a decade or so and after that it would still take a few more years to get production off the ground.
By then we are apt to be well past acknowledged peak oil.
Vaca Muerto. Dead Cow. It’s their shale region. It will be explored soon and developed if there’s anything there. Then suddenly we’ll hear about the Argentina political miracle.
A bit like sports. Fights in the locker room stop if you’re winning.
The Bakken researchers here might want to check out https://www.dmr.nd.gov/oilgas/presentations/NDIC030314_100.pdf, a presentation given a few days ago and since posted on the North Dakota Industrial Commission website. The main theme is flaring, and how to go about reducing the number of wells flaring natural gas, but there is other information included all throughout that I do not recall seeing presented before. One thing in particular is the figures for well economics on page 17.
Indeed quite an interesting report.
It’s amazing to me to see how they seem to have the economics of a typical well completely wrong (page 17):
1) The biggest issue is the flow rate. The average ND well produces about 85 K barrels of oil during the first year, instead of 170 K. I belief my data is correct, as I take this from the NDIC monthly report details, and the totals of the details also match with the reported numbers. They still seem to use the incorrect graph (page 16). I belief they also only count oil as otherwise the oil price they use ($86) should be much lower.
2) Another big issue is the EUR. They use 677K barrels in the 1st scenario. I am not sure whether this includes gas as well, but this is extremely optimistic: Dennis, and the USGS come up with much lower EUR’s (around 300-350, which I view as more realistic), while even the largest Bakken producer Continental Resources only claims 603K (BOE, thus including gas).
3) They seem to confuse profits with cash flow, and only look at the ND expenses, e.g. administrative overhead is not included. If the well economics were as good as they report, many companies were already cash flow positive, which is not the case (many still need additional financing through loans/share issues)
No wonder the operators strongly object against the implementations of these regulations(page 19), it would in my eyes completely kill the actual well economics (for wells that cannot meet the new regulations). Very interesting to see how this will play out. Thanks for the link.
Hi Enno,
The economics look pretty good on a point forward basis, but I need to investigate full cycle costs. I would think we could get a rough idea from looking at annual reports.
Let’s say company x reports 100 kb/d of oil output and they sell their oil for $85/barrel, we will assume there is no net income due to natural gas sales and will just ignore natural gas income (and assume it offsets other costs of operations). So total revenue from oil sales is about $3.1 billion and reported GAAP net income is $750 million, so full cycle costs would be 2.35 billion dollars(3100-750=2350) or $64/barrel.
Does this method make sense for a quick and dirty estimate of full cycle costs?
I can get these numbers from Continental Resources, but I am not sure how standard their presentation is. A lot of companies combine their oil and gas into boe, so this type of calculation may not work for other companies.
Note for CLR this full cycle cost (using the method outlined above) comes out to $68/barrel for 2013.
My point forward estimates would give $12/barrel for transport, $4/barrel for OPEX, and $19/barrel for royalties and taxes or $35/ barrel or roughly half of the full cycle cost.
Maybe I am missing something here.
Hi Dennis,
I think we talk about different things. Please look at the link from MTI3, page 16 and 17. Look at the assumed oil, and cumulative oil production per year. They assume 423 k barrels oil (excl gas) in the 1st 10 years of a typical Bakken well. Does that match your data & prediction?
With such an assumption the economics indeed look great, and if it were true I would also join the party.
I don’t fault their model so much, mostly their assumed oil production from a typical well which is the main input, and shown in page 16. Do you agree?
Yes. I hoped you might have some insight on the economics. Typical ndic well is not the same as average well.
Hi Dennis,
I don’t think I have something valuable to add regarding the economics. I don’t know about point forward basis, or full cycle cost, although of course all expenses, especially cash expenses, should be considered in making a valuation analysis.
I think what makes it somewhat difficult to say something about the economics are the capital expenditures (capex) of these companies, the claim that they will provide returns for a very long time (30-50 years), and how to make a realistic estimation of their impact on earnings. The capex of some of these companies are huge (e.g. Continental Resources spent more on capex than it’s total revenue during the last 4 years!), while in the earnings calculation they only deduct a very small part of that as depreciation. Whether that is correct or not depends all on what the future will hold, and therefore I think it is very difficult to say anything definite about it. On the other hand, an increasing part of their net assets are deferred income taxes, which basically is an interest-free loan from the government, and therefore the true cost of that is probably significantly less than what it is accounted for.
How does deferred income taxes work? What’s that?
P.s. I was under the impression that CAPEX has a bad tax impact in that you can generally only claim the depreciated part as an expense for taxes when in reality, you paid all the money out (so free cash flow impacted).
P.s.s. Nice stock curve: http://finance.yahoo.com/q/bc?t=my&s=CLR&l=off&z=l&q=l&c=&ql=1&c=%5EDJI
I also don’t know the details, and could not find a good link. However, from what I have read it seems that a company like Continental can delay payment of most (90% or so) of their income taxes to a much later date. These are of course real costs and liabilities, but the value of the delayed payment is of course also of value for these cash-hungry companies.
Its stock performance is impressive, no argument there. But, it is also clear that it is all about future cash flows, as all recent years were cash flow negative.
Thanks.
On CLR, wow!
It looks like they are accessing the bond markets for growth. Over a billion borrowed in 2013 and 2 billion in 2012. [Hey, getting closer to breakeven…joking, but actually it is true. ;)] .
The stock can handle that debt load (equity climbing). I guess Hamm prefers to not dilute his control by raising more equity and it appears capital markets feel reasonably confident lending (it’s not a dotcom or a biotech.). Agreed, it is a huge amount of investment going on.
http://finance.yahoo.com/q/cf?s=CLR+Cash+Flow&annual
It does look like if they put down the drill bit (no capex next year) that there would be enough money to be profitable and pay the interest on debt for a few years although the Red Queen would take a bite out of future revenues…
Looking at the 10K now. I don’t understand some things like the sizable other expenses in Yahoo’s income statement. I’m not really good at financial statements, either. (I’m intuitive, not a detail person). 😉
From the issues above re flaring, the NGLs are gaseous at standard temp and pressure. I’m curious about the entire issue that shut down shipments 10 days ago as regulations triggered to keep NGLs out of the railcars (that were thought to cause explosions more readily).
What this says about the proper measure of production is a separate issue but since you guys are talking economics, the separation task on these wells and the commissioning of separate trucks to carry the NGLs (assuming anti flaring regulations are imposed) is going to hit the money, and particularly in the out years. When the flow rate is too low to pay the salaries of not just one or two guys but also separation guys and both the oil and the the NGL truck driver, these wells plug and abandon sooner than we thought.
Sure (to the extent that this is actually happening, yes, agreed). Just don’t make too much soup from one onion. If you’re right (for the population, not just a few bad apples), we should see a marked change in the NGL production from the play. Maybe we can compare a month’s ratio of NGL to crude.
Also, I wonder if it is possible to flare the NGLs (they are gasses). You lose their value, but you don’t have to bother with NGL truck coming by.
Nony, the NGL are just mixed in with the rest of the natural gas, or methane. They do not condense out like condensate does. They must be separated from the methane by a cooling train at a gas plant. Then they are not just loaded on a truck unless it hauls a pressurized container.
NGLs are just bottled gas. If the gas is flared they are flared.
Thanks, makes sense. Got myself confused.
So, the 3 ø separator separates out oil, gas and water. Need a natural gas processing plant to clean out the NGLs.
This issue becomes an issue as anti flaring regulations get (or have gotten) imposed. Then they HAVE to get a truck to come take it away.
Orrrrrr, just stick it in the crude truck and put it on the train, and blow it up.
Which means the volume in the crude oil production is not all crude oil and the measurements are not valid.
http://www.eliomotors.com
I don’t know if these will sell or not in the very near future.
The company may run out of money before in can get into production and achieve an an adequate sales volume .
But I have long believed that whoever is in the market with an affordable super high mileage commuter car when gasoline jumps another couple of bucks again will be able to sell them as easily as ice water in hell.
People are not willingly going to give up on suburbia. They don’t want to and they can’t afford to in most cases anyway.This is why I am so optimistic about the future sales of plug in hybrids such as the Volt and pure electrics such as the Leaf. Tesla’s too but they aren’t ever going to sell like Chevy’s unless Musk decides to add a poor working mans model to his lineup.Maybe he will do that eventually but if he does it may have a different badge on it.
But I doubt any electric capable of a sixty mile round trip can be sold in the very low five’s within the next few years and this company looks safe to get to market in the high fours.
A car -motorcycle legally in some states since it is three wheeler- that gets eighty miles or better per gallon and costs less than a third of the price of the cheapest electric on the road is going to be tough to beat on a cost to work and home again basis.
Unfortunately in my opinion in is as ugly as sin and I am afraid that the public is badly prejudiced against three wheelers.
But necessity is a tough boss and people will buy what they must to avoid giving up the Mcmansion.
Maybe I am crazy but I don’t think that the cheap gas meme is going to last in the US like it has in Venezuela. We aren’t angels but we do have a somewhat functional democracy and as more and more people drive less and less the political calculus will change substantially in favor of non drivers.
Some sort of rationing and much higher gas tax will probably be implemented.
Poor people who have the vote will insist on those better off sharing their misery and I can’t say that I blame them. If I were a populist politician my current trademark initiative would be a tax on jet fuel at least equal to the tax on gasoline.
Most people either don’t fly at all or fly only at long intervals and there is no way the public could see this as anything but fair to those of us who don’t fly.
The ire and desires of non drivers are going to become ever more powerful forces in domestic politics in this country and the political calculus may play out in unexpected ways.
A suburban or urban professional who will never voluntarily give up his Audi for a bus seat may well be willing to pay an extra fifty cents or even a buck if the tax is dedicated to getting some of the rabble off his ”free” way and the streets near his office and into buses or street cars or subways.
I think it looks cool. Get to park in motorcycle parking also.
Some US Natgas Numbers, Huge production numbers*
*But huge volumes of production lost to declines from existing wells
Using 24 TCF for 2012 and 2013 US dry processed natgas production, based on the EIA data this is roughly equivalent to the combined dry processed production from the following five countries countries (2012 data, EIA):
Iran: 5.6 TCF
Qatar: 5.5
Canada: 5.1
Norway: 4.2
Netherlands: 2.8
Total: 23.2 TCF
A 2013 Citi Research report estimates that the decline rate from existing US natgas production is about 24%/year, since such a high percentage of production comes from high decline rate tight/shale plays. This implies that the US has to put on line close to 6 TCF of new gas production every single year, just to maintain a production rate of 24 TCF/year.
Or in round numbers, based on the Citi Research report, in about four years–in order to maintain a production rate of 24 TCF/year–we need to replace the productive equivalent of the combined 2012 dry processed natural gas production from: Iran + Qatar + Canada + Norway + Netherlands.
The EIA has this projection for US natural gas imports and exports. I can only assume the folks at the EIA go to work and then take some kind of psychotropics that allow them to hallucinate wildly. (I am hoping the attached graph comes through so my comment makes sense! Wish there were a preview function.)
When the revised data come in, I suspect that we will see a decline in US dry processed natgas production, from 2012 to 2013.
In any case, did the EIA do a projection of US production and consumption of natgas?
The only discussion the MSM currently seems to be to what extent that oil and natgas exports from the US, which is currently a net oil and gas importer, will affect Russia’s oil and gas net exporters. Of course, I am advocating that the US boost crude oil imports by 2 mbpd from Russia, so that we can export 2 mbpd of crude oil to Western Europe, thereby cutting their dependence on Russian crude oil.
Here is a chart showing their projection of US energy production by fuel.
I am to the point I say go ahead and export all we like of US fossil fuels. Do it now; do it fast. It will show the US energy emperor has no clothes that much sooner, and this realization will be to the good. It’s only once we face this reality that we have any chance of mitigating its worst impacts. (Unfortunately the same dynamic does not hold true for climate change. If we bring it on faster, we only doom ourselves faster.)
The oil production is low because there is nowhere for it to go. Price is low. At 5, definitely at 6, lots of gas drilling occurs. We really are very rich in natural gas.
As far as oil, the idea to export that is just a swap. We have refineries optimized for heavy sour crude. But we have a lot of new oil that is light sweet. We send it overseas until WTI is driven up to Brent prices. We’re not losing anything. Heavy sour comes into replace what we send out. The only people losing are some refineries optimized for light crude making bank off of captive supply and Warren Buffet’s railroads.
First para should be “gas production”.
Karen,
This is a rather cynical view that you’re putting forward, downright UN-American some might say. Maybe we’ll come up with a solution before Apocalypse arrives, batteries running on water, something like that. Why be against burning all that fuel, our grandchildren can just bloody well look after themselves as far as I’m concerned.
Doug
I was sort of wild for a few years back in my younger days and never found anything as good making me see things that weren’ t there as this but I did see a few pink elephants and I met some talking gorillas and talked back to them too.;-)
I am afraid drugs just aren’t that good at stretching the imagination.
The solution is probably that being bureaucrats they just find out what their bosses want and cook it up and go back to surfing the net and talking to their wives and girlfriends.
Maybe they are right. Maybe there will be a revolution in the drilling technology that will allow all that gas the gas to be recovered at prices the world can pay.But that involves accepting another technocopian wet dream- that the economy can continue to grow pretty fast in the face of the depletion of so many one time thru natural resources in the face of growing population and an ever more degraded environment.
There isn’t actually preventing us from living as well as we do on half the energy we consume now per capita other than our own bad ingrained habits and we could pay twice as much and still live quite well -if we only were willing to do so.
There may actually be a time coming when the typical middle class person will be willing to drive a very cheap car such as an Elio so he can put an extra five or six hundred a month in making his Mcmansion more energy efficient.
If that were to happen we might actually be able to pay double and triple what are paying now for fossil fuels since we would be using so much less of them.
I could build a new house for an extra ten or fifteen grand that would use half or less as much energy as so called energy smart typical new house.That is peanuts compared to the costs of utilities for century and any house built to a modern codes should last at least that long with routine maintenance such as a new roof every twenty to thirty years etc.
And if I were still working I could be driving a Volt or Leaf to work and charging it mostly with a few thousand dollars worth of pv panels instead of buying ten gallons of gas to get back and forth to work every week.
I wonder how long it will be before somebody builds a compact plug in hybrid pickup truck that will go thirty miles or more on a charge using it as a commuter vehicle.
Cost conscious small business people would buy a lot of them if the subsidies currently allowed for cars apply. A hardware store that delivers for instance could probably keep one mostly charged up by plugging it in every time it returns to the loading dock for a few minutes to an hour or more between trips.
Mac,
Here’s one for you: “Building three “Great Walls” across Tornado Alley in the US could eliminate the disasters, a physicist says. The barriers – 980ft high and up to 100 miles long – would act like hill ranges, softening winds before twisters can form. They would cost $16bn (£9.6bn) to build but save billions of dollars of damage each year, said Prof Rongjia Tao, of Temple University, Philadelphia…” See, you just need innovation. And, at 980 feet high we’d get some bragging rights on the Chinese, I think!
Doug
A GENERAL QUESTION REGARDING THE EXPORT LAND MODEL (ELM)
I usually get qualitative objections to what is a quantitative mathematical observation about what I call “Net Export Math.” However, insofar as I know, our friend Nony has not directly addressed this mathematical observation. So, I would like to ask Nony–and everyone else–if you can identify any factual errors in the following statements. Note that I have added an ANE corollary.
EXPORT LAND MODEL (ELM)
“Production declines in net oil exporting countries are inevitable, and given an ongoing production decline, unless they cut their domestic consumption at the same rate as, or at a rate faster than, the production decline rate, the resulting net export decline rate will exceed the production decline rate and the net export decline rate will accelerate with time. Furthermore, if the rate of increase in consumption exceeds the rate of increase in production, a net exporter can become a net importer prior to a production peak, e.g., the US and China.”
ANE* COROLLARY
A decline in GNE* is inevitable (we have already seen, through 2012, a post-2005 decline in GNE), and given an ongoing production decline in GNE, unless China & India cut their net imports at the same rate as, or at a rate faster than, the GNE decline rate, the resulting ANE decline rate will exceed the GNE decline rate and the ANE decline rate will accelerate with time.
*GNE = Global Net Exports of oil, (2005) Top 33 net oil exporters, total petroleum liquids + other liquids (EIA)
ANE = Available Net Exports = GNE less Chindia’s Net Imports (CNI) = Supply of GNE available to importers other than China & India
We saw a very small increase in (2005) Top 33 Exporters’ production from 2005 to 2012 (a rate of change of +0.3%/year), but consumption (a rate of change of +2.2%/year) outpaced production, and GNE fell slightly, with a rate of change of -0.5%/year, from 45.5 mbpd in 2005 to 43.9 mbpd in 2012, as annual Brent crude prices doubled from $55 in 2005 to $112 in 2012.
Following is the GNE “Gap Chart.”
Regarding ANE, as noted above the observed rate of change in GNE from 2005 to 2012 was -0.5%/year. Chindia’s combined net imports (CNI) did not decline at the same rate, they of course increased, and the rate of change in CNI was +8.7%/year, from 2005 to 2012. Therefore, ANE (or GNE less CNI) fell from 40.7 mbpd in 2005 to 34.9 mbpd, a rate of change in ANE of -2.2%/year. In other words, ANE fell about four times faster than the observed rate of decline in GNE.
Following is the ANE “Gap Chart.”
I think the Export Land Model is a very useful model to understand the predicament that oil importing countries are in, which I have followed with great interest the last couple of years. I think it is very worrying that despite large price increases recently, the amount of global supply from exporting countries has stayed rather flat, especially when it is clear that large amounts of oil are still being wasted in some of those exporting countries to keep the population under control. I have nothing against keeping the population happy, but if that means using heavily subsidized fuel, then I think there are probably better economic uses for that.
My personal view is that your message would perhaps be easier absorbed with the use of less acronyms, as most people are not familiar with them, and I don’t think they add much to your message.
I do think you somewhat too easily dismissed Nony’s comment about the oil production in importing countries, e.g. the US, as although they might not increase net exports, I also belief that that did have a not so small impact on the global market.
Thanks for you comments.
In regard to subsidies in net oil exporting countries, I frequently compare Indonesia and the UK (as noted up the thread).
Indonesia subsidized consumption, as their production and net exports declined, while the UK heavily taxed consumption, as their production and net exports declined. In neither case did consumption fall at the same rate as, or at a rate faster than, the rate of decline in production, therefore, in both cases the resulting net export decline rate exceeded the production decline rate, and the net export decline rate accelerated with time.
And consider a relatively poor country like Yemen, which–like many other countries–is on the verge of joining OFPEC (Organization of Former Petroleum Exporting Countries). I profiled them up the thread, and their net export decline profile–as annual Brent crude oil prices rose at an average rate of 15%/year from 2002 to 2012–exactly followed the same accelerating net export decline rate trend as the ELM and the Six Country Case History data.
In regard to the US, I agree that fluctuations in production in consumption in developed net oil importing countries like the US have an effect on the demand for Global Net Exports of oil (GNE), but that is against the context of the increase in demand for GNE from developing countries, led by China. The fact remains that what the data show, at least through 2012, is that developed net oil importing countries like the US were gradually being priced out of the market for GNE, as the supply of GNE available to importers other than China & India (what I define as ANE, or Available Net Exports) fell from 41 mbpd in 2005 to 35 mbpd in 2012.
As noted above, when the inevitable sustained decline in GNE sets it, the only way we will not see an accelerating rate of decline in ANE is if China & India reduce their net imports at the same rate as, or at a rate faster than, the rate of decline in GNE. As also noted above, already with just a -0.5%year rate of change in GNE from 2005 to 2012, combined with rising imports into China & India (what I call CNI), we have seen a -2.2%year rate of change in ANE from 2005 to 2012. And an extrapolation of the 2005 to 2012 rate of decline in the GNE/CNI Ratio suggest that China & India alone would theoretically consume 100% of GNE in only 16 years.
I don’t think that China & India alone will be consuming 100% of GNE in 16 years, but consider some scenarios.
First, China’s production has stagnated of late. When US crude oil production peaked in 1970, our rate of increase in net imports went from a long term rate of 11%/year to a rate of increase of 14%/year from 1970 to 1977.
Second, let’s assume that the rate of change in GNE goes from the 2005 to 2012 -0.5%/year rate of change to -1.0%/year from 2012 to 2022. And let’s assume that Chindia’s rate of increase in consumption slows somewhat, but their production also declines, so there is no change in the (2005 to 2012) rate of change in their net imports (+8.7%/year), which you will note is actually well below the long term US rate of increase in net imports from 1948 to 1977.
In any case, based on those scenarios (GNE falls at 1.0%/year, CNI increases at 8.7%/year), GNE in 2022 would be down to 40 mbpd, while Chindia’s Net Imports (CNI) would be up to 21 mbpd, resulting in ANE of 19 mbpd in 2022, versus 35 mbpd in 2012. Based on the foregoing, the rate of change in ANE would accelerate from the -2.2%year rate of change that we saw from 2005 to 2012 to -6.1%/year from 2012 to 2022.
As noted above, it is a mathematical certainty that given an ongoing decline in GNE, the only way we will not see an accelerating rate of decline in ANE is if China and India cut their net imports at the same rate as, or at a rate faster than, the rate of decline in GNE.
In regard to consumption versus oil prices for China, India, the (2005) Top 33 net oil exporters and the US, we know what happened from 2002 to 2012, but as noted above, the $64 Trillion question is what happens from 2012 to 2022 (and in future years)?
Your model(s) is absurd. It doesn’t pass the economic sniff test, to wit 21 mb/d ANE “gaps”, ECI ratios that are divorced from volumes, yada, yada. The ANE chart is a particular howler! You actually subscribe to the view that the 2005 top 33 net exporters will be zero net exporters in 2029. Good grief.
Normalize the consumption volumes. My guesstimate: since 2005 through 2013 the consumption volume decreases in the U.S.* and EU have completely offset the consumption volume increases in the 33 net exporters and India with a bit to spare for China whose consumption has been topped up with increased global production.
*Before you go all doomer, U.S. real gross domestic product (GDP) increased 12% since 2005 while all liquids consumption (ALC) declined 10%. It’s amazing that the standard of living (GDP being the proxy) can rise through efficiency, substitution and adaptation with a declining ALC.
Another goofy chart is the normalized liquids consumption graph overwhelmed by the Brent “red” price bar.
You realize that there is an fundamental arithmetic error on the chart. China consumption rose 94% not 194%. Ditto for India and the top 33 exporters. The U.S. number appears, without quibbling, to be correct.
Congrats on another nonsensical post.
In any case, Chinese consumption in 2012 was 194% of its 2002 value (to get 2012 consumption, you multiply 2002 consumption by 1.94).
By the same token, US consumption in 2012 was 94% of its 2002 value (to get 2012 consumption, you multiply 2002 by 0.94).
1.94 is a 94% gain.
100% is a X2. So 2.0X = 100% gain. Thus 1.94 is 94% gain.
It’s even more deceptive above 200%. That’s a 3.x increase.
This same math awkwardness btw is why losses are more powerful than gains.
You have a dollar and lose 50% of it. Then you have a 50% gain. Do you have your dollar back? No. You have 75 cents.
A 100% gain is a X 2. You have a dollar and get a 100% gain, you have 2 dollars. You have a dollar and do a 1.94 on it to get $1.94, that’s a 94% gain.
One of the easiest errors to make I have ever seen.
Incidentally, in regard to oil production in developed net oil importing countries, why only focus on the US, what about countries like the UK?
Since 2005, the UK’s oil production (total petroleum liquids + other liquids, EIA) fell from 1.8 mbpd in 2005 to 0.95 mbpd in 2012, and consumption fell from 1.8 mbpd in 2005 to 1.5 mbpd in 2012.
Neither the fact that the US has shown rising production and falling consumption nor the fact that the UK has shown falling production and falling consumption–nor the fact that we have seen production and consumption fluctuations in other developed net oil importing countries–alters the fundamental reality that we are experiencing a global net export supply crisis, to-wit, based on the 2005 to 2012 rate of decline in the ratio of Global Net Exports of oil to Chindia’s Net Imports, there would be zero net oil exports available to importers other than China and India in only 16 years.
The upper Bakken shale is non-fossiliferous. The Lodgepole formation is above the Upper Bakken shale and is pooled Bakken Formation oil.
The Three Forks/Sanish is under the Lower Bakken Shale, also non-fossiliferous, and is pooled mature Bakken oil. Gravity tells you that there is probably more oil beneath the Lower Bakken Shale than there is above the Upper Bakken Shale, if the logic holds true.
The BNSF weekly report shows a lower petroleum tank car volume of about 400 cars, which would probably be 598 x 400 = 239 200.
9600 plus tank car by rail shipments is going to be 598 x 9600 = 5 740 800 barrels of petroleum shipped by BNSF in week nine of 2014. Times 4 is going to reach a volume of 22 963 200 barrels shipped in a 4 week period by BNSF. Maybe not all Bakken crude, but a percentage greater than 90 percent is a good guess. The February 2014 North Dakota crude shipment will probably report a decline of 1 million barrels, looks as though that might happen.
http://www.bnsf.com/about-bnsf/financial-information/weekly-carload-reports/pdf/20140301.pdf
As you can see, it remains 1 percent above 2013 shipments.
Bakken crude is shipped to Canada to be refined for ethane which is then shipped to the Athabasca Tar Sands to extract the tar sand oil from the sand.
Blending tar sand oil and Bakken crude could be a solution to the Bakken crude volatility conundrum and a pipeline system to accommodate Bakken crude with fewer shipment problems would reflect a solid systems management scenario. jmho.
Competition for pipeline space can be eliminated by increased pipeline space.
Think of it as another addition of another 500 miles of the Great Wall of China or another 100 miles of Roman aqueducts.
The Keystone XL can’t be all bad.
Roman Aqueducts are still in use today.
We can count upon the oceans for water, one way or another.
Can’t possibly be Peak Water, unless Fukushima proves otherwise.
Have to depend upon oil while it is still here in abundance. The bounty will one day come to an end. The numbers make the math easy.
9600 plus tank car by rail shipments is going to be 598 x 9600 = 5 740 800 barrels of petroleum shipped by BNSF in week nine of 2014. Times 4 is going to reach a volume of 22 963 200 barrels shipped in a 4 week period by BNSF.
Feb is a short month. 5740800/7 = 821K bpd, a sharp decline.
The typical tank car used for hauling Bakken oil can carry approximately 700 barrels of Bakken oil. I emphasize Bakken oil because the maximum amount of liquid a tank car can hold is dependent not only, of course, on the size of the car, but also the density of the liquid as each car has a maximum weight limit. Bakken oil is generally of low enough density that the tank cars carrying the crude can be more or less fully loaded with about 29,000-30,000 US gallons, or in the area of 700 barrels per car. BNSF crude oil unit trains mostly contain 100 to 118 tank cars, meaning the entire train consists of around 70,000 barrels, give or take 10,000 barrels or so for the most part. The much lower number of crude oil unit trains loaded on the Canadian Pacific in North Dakota can have the same number of cars but historically have had many fewer due to the configurations and capacities of the loading sites along that railroad.
I too have been using the BNSF carload reports to track the weekly number of petroleum carloads carried on the BNSF network. Attached to this comment is a graph I made charting the carload count since the second half of 2009. I have also included the average WTI-Brent spread for each week during the time period (using FRED data, http://research.stlouisfed.org/fred2/categories/32217) because, as has been mentioned in various oil industry and economic articles, there is an association between the magnitude of the WTI-Brent spread and the propensity of the oil companies to use rail to haul crude out of the Bakken. The greater the spread, the more crude travels out of the region by rail. On the other hand, when the spread has been lower (primarily a $10/bbl difference or less), a greater share of the crude has traveled via pipeline.
The oil companies can be flexible in the method they use to ship oil out of the Bakken because according to data from the North Dakota Industrial Commission and the North Dakota Pipeline Authority there is more than 1.5 million bbl/d of capacity currently available to export oil out of North Dakota when all the rail, pipeline, and refinery options are added together. More than 500,000 bbl/d of this capacity is via pipeline, but there are plans for an additional 200,000 bbl/d of pipeline capacity to come online within the next year. Furthermore, the Enbridge Sandpiper pipeline, which is currently in the permitting phase but has been subject to relatively little opposition or holdups, is anticipated to be completed in 2016, bringing an extra 225,000 bbl/d of pipeline capacity to the Bakken (this will be the largest single pipeline transporting North Dakota oil out of the state – that honor currently goes to an existing Enbridge pipeline with 210,000 bbl/d of capacity).
The more I think about it, it’s the railroads making a killing from this whole gold rush. And you even have crony capitalist Buffet placing orders for upgraded cars and then trying to pass legislation to require their use. Let’s see how things look for him if Keystone gets built and then after these shale plays are over, but the coal doesn’t come back. But he’s minting it now…
He and Gates are close buddies. A few years ago, and maybe still, the number 1 non Microsoft holding in Gates’ portfolio was said to be Canadian National Railroad. And of course Buffett owns BNSF.
Brings a new meaning of the Blue Screen of Death to our railroads.
Maybe that is why we are having regular crashes and loss of life?
No, those appear to be from NGLs in the tankcars. Lower ignition temp.
I wish there were more crony capitalists like Buffett.
He’s my favorite one. 😉 At least he’s not from Goldman.
Nice chart, Watcher. You can definitely see the effect of Bakken volume on WTI (OK) pricing (captive light crude US market).
I don’t do charts. I don’t believe most data.
Apparently the Romans were not acquainted with the concept of net present value and thirty year financing. That being the case they built as well as they could rather than well enough to last as long as the payments.
But for what it is worth there are some pipelines under construction that go to the Bakken.
Earlier in the comment thread I noted some articles of a few days ago referring to what is in those rail cars. It is apparently not all oil, and testing regimens were objected to as soon as they were imposed. This has profound significance for the published production numbers. Non crude liquids can’t get in those cars unless they got into the trucks coming to fill those cars, and there’s only one place the trucks could get it.
If you go looking for them there are stories out there about new pipelines being built to serve the Bakken and it appears that the companies in the pipeline business are indeed sure that they are going to make some money –meaning they are confident that production is going to hold up for a good long while
This one talks about switching an existing gas line over to crude.
http://finance.yahoo.com/news/energy-transfer-partners-plans-bakken-204839011.html;_ylt=AwrBEiR4bxpTRSkA5ijQtDMD
This looks like a new one. We’ll see. I would wait until they get commercial commitments.
Some projects are going forward and others aren’t. Sandpiper is advancing but a competing project by Koch was shelved. I read some analysis elsewhere that gave some of the reasons for why Sandpiper won and Koch didn’t (first mover, following existing line, and most importantly better tie in to other pipelines (in essence, better destination).
https://rbnenergy.com/the-night-they-drove-old-dakota-express-down-crude-pipeline-wars-in-the-bakken
I have been trying to try on some cornucopian clothing today just to see how it looks an an old peak oil pessimist because it’s just good sense to double check your assumptions once in a while.
Drill riggs aren’t something we seem to spend a lot of time on but they are never the less the key piece of equipment in the oil business and there is a real revolution going on in the drill rig industry.
This article is over year old but it is chock full of useful information about what is changing about the rigs in use and it is so short that it can be read in only a couple of minutes.
http://uk.reuters.com/article/2012/12/20/landdrillers-rigs-idUKL4N09L4UU20121220
The newer rigs appear to be much much faster and cheaper to run too. Diesel rigs are obviously on the way out but I have not yet learned where the newer electric rigs get their juice.
Large on site generators powered by diesel or natural gas seem the only likely source and the natural gas may be obtainable right on site or within a mile or two max making the delivery of it practical via a temporary pipeline laid on the ground rather than buried. Such generators are usually mounted on trailers and thus can be moved easily.
It will be a hoot if the electrical generating industry in North Dakota is able to string enough new transmission lines to supply the drillers with wind generated juice to do a good bit of their work.
Nice article, mac
Mac,
I think we have a bit of reporters licence here. Drilling rigs used to be direct drive via gears and clutches and called compound rigs. These were basically out of service before I started in the business, though some were still in use on small land rigs. The legacy rigs that this article would be referring to will diesel driven DC (direct current) electric rigs. The standard DC electric motor was a GE 752, which was the work horse for the rail road industry and working through a SCR system.
During the 1990’s VFDs (Variable Frequency Drives) started to be used in top drives and then finally to all the main traction motors, mud pumps and draw works, on new build drilling rigs with allowed joy stick control and fully programmable logic to be used, along with more automated equipment such as iron roughnecks and the like. The power to drive them still mostly comes from diesel, though in the US land market Natural gas is starting to be used. No doubt any new rig meant for the US land market will be at least, dual fuel to take advantage of the cheap natural gas available in the areas of operation.
With the computer control comes the electronic recording systems, which can and are beamed straight to the board room computer screen in real time. So these days the maintenance crew is not typically a grease cover mechanic but a conspicuously clean electronics tech with a laptop tucked under his arm, and drillers aren’t picked by who can swing the heaviest sledge hammer, but who can best work their way through the pages of information on the computer screen in front of their joy stick.
It’s great to see you posting here Toolpush!
(I have appointed myself the unofficial welcome committee for anybody I remember from TOD days.)
About reporter’s license -yes !
Ron has made it clear that he is happy with comments so long as they are reasonably relevant to the peak oil discussion even though they may not be closely related to the topic of the day.
Unfortunately there is no way to separate comments into different threads with this blog setup. Being able to do that requires spending some serious money for tech support.
So we just have to add a comment as we can at the end usually.
This breaks up the continuity of the conversation but it can’t be helped.
My opinion for what it is worth is that the more comments there are the better.
Those of us who are interested specifically in main subject of the day can skip over comments like mine easily enough. This leaves the rest of us free to link to articles relevant to oil and energy supplies and speculate little about how the future will play out.
Most of what little I know about drill rigs and actual drilling I owe to you and Rockman.
Do you know if the wells in a field such as the Bakken are close enough together to actually use a serious amount of grid sourced electricity?
I am guessing but my guess for what it is worth is that oil field operators working on private lands are able to do pretty much whatever they please when it comes to erecting some power lines. It doesn’t require all that much expertise and since these lines would be temporary in most cases there might not even be a permit needed.
Railroads operate this way- they are allowed to do pretty much as they please in respect to their own electrical needs without calling the building inspector or asking for permits.
So–if the local electric utility runs a high capacity line thru an oil field and provides service drops say every mile or so it might be very cost efficient for the oil field contractors to run either temporary or permanent lines from these drops out to the individual wells.
Again I am guessing but a drill rig must have at least a couple of thousand horsepower motors and this implies some serious amps and voltage…A big generator on site may be the only solution to this problem since running permanent lines for a month or two is no doubt out of the question on a cost basis.
But once a well is finished it still needs pumps and lights and heaters and various other electrical equipment powered up more or less continuously for ten or more years, maybe for twenty years or more.
Grid juice should win out easily over such a long time frame compared to maintaining and fueling generators even if the utility has to string some short runs of new transmission lines.
?????
Mac,
I know it sounds logical to hook up power lines to a drilling rig in a civilized part of the world, but Russia or should I say USSR, as it was a long time ago, is the only place I remember seeing pictures of rigs being hooked to the grid.
A drilling rig takes a lot of power, over 5000hp, for a two motor draw works and two mud pumps. Offshore these days 3 motor draw works an 3 mud pumps are more the norm. If you were going to hook up to grid power, you would be talking about 10 to 25kv lines dedicated to the drilling rigs. Once the drilling is complete and the well is on production, then very little electricity is required. The electric rail systems in Europe run 25 kv lines. The other thing with a drilling rig, is the power fluctuates significantly, unlike a train system. eg when the blocks are running to collect a stand of pipe, the power is fully on, for the draw works motors. Stand is screwed into the stump, and then run in the hole. On an AC system this produces electricity. So, the power goes from full on to full generation 40 times an hour. Not very good for a stable grid. I don’t think the power companies would like it. There maybe other reasons, it is mainly flexibility and the shear amount of power a drilling rid requires, is why they stay independent of the grid.
PS Thanks for the welcome, but I have been around here for a little while, but only post when I can add some value.
Gotcha
I underestimated ,guessed really the power needed by more that fifty percent.
Now if bunch of rigs all in the same neighbor hood were drawing off the same high capacity line the variations in the load would average out but a little thought indicates that although wells may be under a mile apart the rigs are probably mostly a lot farther apart maybe even ten miles or more.
Now once the well is finished and the pumps are the only large load left is it then practical to hook a given well to the grid if a line is close by?
Mac, Strange that you posted this…about comments…as I was wondering how I could ask this question without being to far off topic. I came across this article recently and this is the only place I know of where I can count on the feedback to be rational and well thought out rather than emotional. The article is clear and self explanatory but I find it difficult to believe that these price increases could be implemented in such a short period of time without enormous blowback from the public. Here is http://www.foxnews.com/opinion/2012/05/22/obamas-war-on-coal-hits-your-e… link . Well, I guess I fouled that up a bit. Is this for real or just hype? I would like to say a big hats off to Ron and all the regular posters here for all the great info and comments.
EIA NG Storage Report
At 1,196 Bcf, total working gas is [38.8%] below the 5-year historical range.
http://www.arabnews.com/news/536386
aerticle discussing the mismatch of corporate culture for shales by supermajors
Not Bakken, but some insights on decline curves and economic feasibility calculation:
http://www.slb.com/~/media/Files/dcs/industry_articles/201105_aogr_shale_baihly.ashx
http://www.reuters.com/article/2014/03/08/us-libya-oil-idUSBREA2709K20140308
This article indicates that Libyan production is off over a million barrels a day in the last nine months or so.
It is literally impossible to say what might happen in Libya other than that a peaceful resolution of their problems is extremely unlikely in the short term.
U.S. Trade Deals From the 90’s Set Up China as a Pollution Haven
Even while trade agreements brokered under Clinton helped China’s economy to boom and brought Americans cheap goods, both nations have paid dearly.
By William J. Kelly, InsideClimate News, Mar 6, 2014
Yeah .
And if a lot of people including hypocritical well off conservatives and boneheaded liberals want to call me a jingo fool I will wear that dunce cap proudly.
I do not begrudge the people of China their new found prosperity but this old world is a Darwinian place.It has always been a Darwinian place and so far as I can see will remain so for as far as the eye can see although I do recognize that there is a slight possibility (About ONE over infinity imo but nevertheless NOT zero) that we will change our ways and all start loving each other.
The Koch brother and Al Gore may give up their mansions for cramped efficieny apartments and ride buses and eat beans and rice instead of filet of beef and lobster and truffles. Right.
This is not racism I am talking about. The people in my own family don’t believe in acting this way towards each other.I have a sister who is well into the one per center class and she contributes maybe one day a years income to me to help me since I have had no job for many years due to looking after our very elderly father and now deceased mother. Plenty of wars have been fought between brothers and cousins of all colors and creeds.
If it were not for globalization we would be in a substantially better position both as Yankees, and probably as a species too.
Don’t get me wrong, I own several thousand dollars worth of Asian made power tools and electronics and I have owned Japanese cars and trucks because they were better vehicles than our domestic makes.
I appreciate that the views from the Blue Ridge Parkway a short hike from my little farm are getting better because the air is cleaner that it used to be. We actually lived in an industrial haze here for several decades that blew in on the wind from the Ohio valley.
But I also appreciate that the wind disperses co2 world wide and that extraditing the coal monster to Asia has not solved the global warming problem.
I have no doubt I would be better off in an America with more expensive cars and trucks and consumer goods and a substantially smaller welfare class.I know dozens of people personally who have lost relatively decent jobs because of globalization.I have no doubt that America would be better off.
Every dozen people out of work means one more burglar and dope dealer and the need for one more ”almost parasite ”in the form of an otherwise unneeded jailer judge criminal lawyer or cop.
And any body who is dumb enough to believe that the people who ordinarily hold the unskilled and semiskilled jobs in factories and construction that are mostly gone and still disappearing can be retrained is to naive to even talk to him on an adult level.
We are barely able to train kids well enough to function in community colleges these days given the state of our schools. Maybe one out of every couple of dozen dismight make it thru a program that will enable him or her to hold knowledge based job.
The taxes I must pay to support those who are no longer able to support themselves cost me a hell of a lot more than American made cameras and computers and consumer goods would ever cost me.
A backwards Asia would not be much of a threat to us allowing us to get by with a substantially smaller military industrial complex.
A smaller world economy implies slower technological growth but science and technology would still be growing and we would have a substantially larger window of opportunity to actually do something about pollution in general, recycling of non renewable resources , and deploying renewable energy on the massive scale required to move away from fossil fuels.
The thing about targeted basic research is not that it can’t or doesn’t get results but that it is awesomely inefficient in doing so compared to just basic research being funded right across the board.
Take a modern wind turbine for instance. It utilizes a world of components and technology created by people uninterested in wind power. Heavy equipment manufacturers such as Catepillar are constantly working on making better and larger gears and bearings able to carry larger and larger loads, as are shipbuilders.Aircraft companies are working on super strong lightweight materials such as carbon fiber, ditto auto manufacturers.There would never be a big wind turbine if the wind believers had to invent all this stuff themselves.
(And this is why there will not be a be a working fusion power plant built within the next fifty years at least. There are too many unsolved problems between todays technology and what is needed for the people working on fusion to solve all of them.But after another fifty years of business as usual a whole lot of these problems would be solved by other engineers and inventors and the job of building a fusion plant would be much easier.Da Vinci could probably have built a helicopter that would have gotten of the ground if he had had the Wright brothers machine shop.
Every body depends on the computer and electronics industries to invent and commercialize the technology that is then adapted to use in their own products.GM didn’t invent microprocessors nor the machine tools used to manufacture engines nor electric arc welding.
My point is this:
If nobody had ever attempted to build a large wind turbine, until this year, within a very short time maybe only three or four years wind turbine builders would reach the state of the art today which has taken decades of research and development.
The only thing that is good for the world taken as a whole–as opposed to the winners — about globalization is that there is a good argument to be made that trading partners are less likely to go to war. But that cuts both ways.A medieval China could not possibly go to war and threaten the modern west.An industrial China can and might although it is to be hoped that she won’t.
History indicates that she will if and when she grows powerful enough to attempt it.We are ourselves more or less constantly involved in one war right after another aren’t we?
Hi Old Farmer Mac,
I often hear these kinds of arguments and people wish things could be like “the old days”.
How do you propose we go back? Why do you think things changed?
Let’s take automobiles. Should there be large import tariffs on foreign cars? You realize, of course that US auto manufacturers export vehicles, so the tariffs imposed by the US would be matched by other countries.
Also many of the foreign cars are assembled in the US (the parts are probably made outside the US however).
A much larger problem is that there is a much greater share of robotics used in the manufacturing process, eliminating the need for as many workers. Creating trade barrriers (which both liberal and conservative economists would agree is a bad idea), does very little to solve that problem.
It is not always simply a zero sum game, in some cases the pie grows bigger (not so much with energy, unless wind, solar, and geothermal can eventually replace fossil fuels as they become more costly to produce.)
Even with energy. Think how stupid it is that we won’t export light sweet crude when our refineries are optomizzed for heavy sour and the WTI-Brent has a differential. Think about people putting steel in the ground to make splitters just to get around this issue. A waste of capital.
Uhm, where is it you think tanks are filling with light sweet crude awaiting refining?
I don’t think that. WTI-Brent differential. That tells the story.
It would seem to tell the story of there being no overflowing tanks of WTI awaiting refining.
There’s no overflowing tanks of anything! Inventories are irrelevant (so tiny). What matters is price.
I reject price. Price derives from a central bank’s whimsy. For Brent and WTI you have multiple whimsy’s.
Count the joules. Then you know something.
We could try import duties but that would be counterproductive at this late stage of the game as you suggest.
Globalization has been a winning game for a lot of people especially in some of the poorer parts of the world where people are actually enjoying the results of industrialization such as electrification and public water and sewer and higher incomes that enable better diets and so forth.
Globalization has enriched many people in the US as well.
But it has not enriched us as much society wide as it has cost us in loss of employment and the subsequent arise of the welfare state.
And as you point out a lot of the jobs that have been exported would have disappeared due to automation anyway.
We just took the little candy bar when the decision was made because we human children almost always take the little candy bar immediately instead of the bigger one later when the choice is offered.
The ones of us who have suffered the most from globalization are the ones who are not politically sophisticated enough and organized to stand up for ourselves for the most part.
Paradoxically some others were too well organized and to successful at looking after themselves in one sense.
The auto workers worked their golden goose to death and forced the industry to move to right to work states for instance but the UAW guys in their glory days made as much or more than a lot of small town lawyers and engineers and a hell of a lot more than say a Chevy dealer mechanic who possessed infinitely greater and more sophisticated skills.
We –some of us any way – won in the short and medium term when we went for globalization.
But most of us in the rich western countries are longer term losers.
Now we are competing with an industrial Asia for an ever shrinking stock of irreplaceable one time gift of nature resources such as oil.That competition would have come to pass any way but we gave it a serious leg up worth one or two generations or maybe even longer.
But going back?
No – that is no more possible than stopping on a ski jump and skiing back to the top and getting off without making the jump.
The mistake is irreversible.
The consequences of a serious effort to turn the clock back now would probably be even worse than allowing the process to run it’s course.The least of these consequences would likely be hot wars that might very well go nuclear.
If we had we understood our own long term enlightened best interests and acted accordingly we would have stayed away from the ski jump.
But we are seldom guilty of considering our own long term best interests when we make long term decisions.
If I were by some means to become the all powerful dictator of the US I would start taxing gasoline an extra quarter this year and add a quarter every year until we got up to European prices and slap a big tax on gross weight and so forth for noncommercial vehicles.
But the chance of such taxes being put into effect are just about zero because we refuse to understand a subject as simple as oil depletion.
Why should we be expected to understand a more subtly issue such as globalization?
Hi OFM,
I agree on the gas tax. I am not sure how we might have prevented globalization, unless we did not allow capital to move out of the US (as in a multi-national corporation investing outside the US) and/or inposed tariffs on imported goods. The main point is that you lose jobs by the resulting trade wars if there are tariffs, you may have fewer imports, but that is balanced by fewer exports. So even if we could go back in time and do things correctly, we would find that the best course has already been taken. Capitalism is not perfect, just better than any other system we have come up with so far.
The welfare state is not perfect, would we be better off with no government help for those who actually need it, go back to 1930, where people, especially in cities were in very dire straights. Fix and improve the present system, maybe recreate a WPA for those who are able bodied and cannot find work after 52 weeks.
China Bear Stearns Moment Seen by BofA in Solar Default
http://www.bloomberg.com/news/2014-03-05/chaori-s-default-may-be-china-s-bear-stearns-moment-bofa-says.html
The country’s first-ever bond default could potentially reshape the entire financial sector.
Chaori’s potential failure to pay investors would mark the first bond default in Asia’s largest economy, highlighting the strain in China’s $4.2 trillion bond market after a trust product issued by China Credit Trust Co. was bailed out in January. There haven’t been any defaults in China’s publicly traded domestic debt market since the central bank started regulating it in 1997, according to Moody’s Investors Service.
China’s corporate bond market totaled 8.7 trillion yuan at the end of January, compared with 800 billion yuan at the end of 2007, Bank of America estimates.
The corporate bond market has multiplied 10.5 fold since 2007 and it is likely that the total bond market including local government and municipal bonds has multiplied even more. That is where China’s growth has come from. There are 60 million empty apartments in China. The vast majority of them will never see an occupant because the poor, which still make up the vast majority of Chinese, simply cannot afford them.
The bond investors have never feared because they knew the government would bail them out… until now.
China Gets 1st Onshore Bond Default as Chaori Doesn’t Pay
Default happened…“signaling the government will back off its practice of bailing out companies with bad debt.”
Will there be more?
“There will be more defaults in China’s onshore bond market,” said Qiu Xinhong, a bond fund manager in Guangzhou at Golden Eagle Asset Management Co., which oversees 13.9 billion yuan in assets. “The next default will be likely to happen in overcapacity industries, such as steel, nonferrous metals and coal. Bond investors will shun private companies with heavy debt burdens because they’re the most at risk.”
Looks like it. Will there be a Lehman-like collapse? At least one person doesn’t think so.
“This will likely be the first of many defaults, although I don’t think it’s going to cause a cascading effect,” said Brian Coulton, a global emerging-market strategist in London at Legal & General Investment Management, which manages some 450 billion pounds ($753 billion) globally. “Short term, we’re likely to see higher bond yields, but in the long term this will create a better market for pricing credit risk.”
The Chinese economy is still a mystery to me.
While the Chinese have their problems, the Western Media has exaggerated them quite a bit… that is, compared to the RAT-HOLE the West is about to enter into.
The Chinese, Russians & BRIC countries have been working on a new trade-settlement system to by-pass the U.S. Dollar. This stunt by the West to over-throw the democratically elected Ukrainian Govt may be the trigger that gets the ball rolling.
This new trade-settlement system will have some sort of physical backing.. and it looks like GOLD will play a major part. That is why the Chinese have been buying gold like crazy.
At the end of Feb, the Chinese imported another 418 metric tons of gold … year to date: http://www.ingoldwetrust.ch/chinese-gold-demand-418-mt-ytd-west-in-deny
The biggest BOND THREAT in the world are not the Chinese bonds, but rather the U.S. Treasuries. On Friday, the 10 -year U.S. Treasury shot up 15 basis points in one day. That’s a huge move.
We don’t know why that was so because the broader stock markets did not increase substantially. Normally, when the stock market heads higher, the Bond yields decline… and the opposite is true.
It could be a sign that the world is starting to DUMP U.S.Ttreasuries…. or certain countries may be. According to the TIC data, China dumped $48 billion of U.S. Treasuries in the month of Dec 2013.
Time is running out for the U.S. Dollar and its sidekick, the U.S. Treasury Market. When that day arrives, Americans will finally understand what it’s like to live as a THIRD-WORLD country.
steve
The 10 year T moved 16 bp over an entire week, not Friday.
http://www.news-journal.com/business/natural-gas-booms-as-demand-roars/article_57942e86-9c23-5844-8b34-480091457e02.html
”HOUSTON — Even the U.S. natural gas surge won’t keep up with growing demand from Chinese power generators and American manufacturers in coming years, a cast of energy executives said last week at a major energy summit focused on the superstar fossil fuel”
There is speculation in this article that there will not be enough available capital to build all the export terminals needed to supply world markets.
The basic tone is gas cornucopianism run wild.
But I have noticed recently that a lot of these articles have a line two in them intended for the reader with the brains and initiative to do a little fact checking before he swallows the ”gas out the kazoo from here on out story ”hook , line and sinker.
Here it is:
“What is becoming increasingly clear is that not all land is created equal,” said Bobby Tudor, chief executive of Tudor, Pickering, Holt & Co.
This is obviously in reference to sweet spots and pink eyeglasses and should be all that is needed for an open minded reader to understand that all is not as it is painted to be by the cornucopian cheerleaders.
Unfortunately ” open minded” does not apply to the public.
Ron,
I’d like to throw in something about oil in Kuwait, more specifically Burgan. We probably all know the supergiant Burgan is an onshore field located in the desert of southeastern Kuwait. Burgan can also refer to the Greater Burgan, a group of three closely spaced fields, which includes Burgan field itself, as well as the much smaller Magwa and Ahmadi. Greater Burgan is the world’s largest sandstone oil field, and the second largest overall, after Ghawar. Production began in 1946. There are facts and figures readily available via Wikipedia, etc. There is an excellent paper entitled: “3 – D Geological Modeling of the World’s Largest Siliciclastic Reservoirs: Greater Burgan Field, Kuwait” that doesn’t require geological training to follow on the web (a PDF file). Beyond that is seismic reservoir characterization which, to actually comprehend, requires math skills, specifically a facility with Fourier analysis, the domain of geophysics. I mention this not because I expect your followers to start doing their own reserve calculations but because, amazingly, the information is actually out there.
So, what’s my point? A good friend of mine, a geologist, just returned here from Kuwait and I asked him for a heads up on the situation there. In a nut shell it’s pretty much what you’ve been suggesting all along. Production is being maintained, not by accessing new reserves, as if there were any, (the deposits are stacked, true) but via infill drilling.
My dilemma is this: it’s not possible to disclose sources so this information has to come under the category of hearsay; in America whistle blowers are merely fired and vilified but it’s not like that everywhere. Nevertheless, and this is my point, oil production being maintained by just adding more wells, unless disclosed as such, is, to my mind, fraud by another name. Perhaps this isn’t true in the business world but one has to wonder about this in an ethical sense – especially when depletion rates suddenly go from one to two figure numbers.
“Production is being maintained, not by accessing new reserves, as if there were any, (the deposits are stacked, true) but via infill drilling.”
Translation: Production is being maintained by increasing the rate of depletion of remaining recoverable oil reserves.
Consider a simple example. A 2 mb (million barrel) oil field. The first 100,000 barrels of oil produced from the field would be 5% of remaining reserves, but at the 50% depletion mark, the next 100,000 barrels of oil produced from the field would be 10% of remaining reserves.
Of course, the Saudis for example are arguing that they vastly increase the recovery factor and thus boost the long term EUR. However, one recurring question is to what degree that horizontal wells in an oil reservoir boost the recovery factor, or just boost the short term production rate (and thus accelerate the depletion of the reservoir).
This topic was addressed in the following 2004 NYT story, which is noteworthy because it documents how the chairman of a major international oil company misrepresented how well the company was doing with techniques like horizontal drilling in conventional reservoirs:
http://www.nytimes.com/2004/04/08/business/oman-s-oil-yield-long-in-decline-shell-data-show.html
However, horizontal drilling in tight/shale plays is a different topic, but I think that the key problems there are the low average and median production rates (at little over a 100 bpd and less than 100 bpd respectively for Bakken last year), combined with very rapid decline rates. I would think that these factors will make it very difficult for tight/shale well economics to work in higher cost producing areas.
Of course, if you want to see some real depletion numbers, consider the Six Country Case History, and what my projections show for estimated rate of depletion in remaining post-2005 Global Cumulative Net Exports of oil (up the thread), which I estimate were about one-fifth depleted in just seven years.
Doug, thanks for this post, it is very informative.
Yes production in the Middle East as well as in perhaps all the world’s giant and super giant fields is being maintained by infill horizontal drilling along the very top of the reservoir. However I don’t think anyone is trying to hide this fact but it is a kind of lie by omission. People seeing the production numbers just assume that things are fine and dandy and that production can continue at this rate for decades.
What people don’t realize is that this will change the depletion curve rather drastically. Instead of a bell curve it will look like a shark fin curve. When the water hits those horizontal wells at the top of the reservoir then production will drop drastically.
But in what country will this shark fin decline curve hit first? I am predicting that it will hit first in the world’s two largest producers, Saudi Arabia and Russia.
Are the Russians using horizontal drilling? I thought they weren’t that advanced.
No, horizontal drilling is not advanced at all, it has been around for over half a century. Widespread use of horizontal wells placed only along the top of the reservoirs is rather recent however. Saudi Arabia has been doing that only for about 15 years.
I found no .pdf with fourier analysis in it? Do we have a link?
Watcher,
Watcher,
PDF refers to the file format of the cited paper. Fourier analysis encompasses a spectrum of math but in my limited experience it involved decomposing function(s) as opposed to the operation of rebuilding a function(s) from pieces, known as Fourier synthesis. Analogue seismic data is always broken down into manageable bits employing this mathematical process. If you really wish to pursue this there are reams of reference books floating about. However, unless you’re especially keen, and have a specific data set to play with, I don’t recommend it.
Here’s the link:
http://www.searchanddiscovery.com/pdfz/documents/2012/20169filak/ndx_filak.pdf.html
Fourier analysis is not specifically described although perhaps it is a part of some of the standard analyses (it is common in analytical instruments).
For someone who wants to say that other people are trying to act smart (when they’re not, just being descriptive), Doug sure likes to flex the Fourier term as if it were something fancy. It’s just a means of parameterizing complex curves, many of which don’t have a simple microscopic basis or empirical formula…
Nony,
Are you a complete moron? The Fourier transform translates between convolution and multiplication of functions. It nothing whatsoever with curve fitting.
A Fourier analysis is just a summation of sine waves to describe a function, often one that lacks an easy empirical equation or a simple microscopic explanation:
https://encrypted.google.com/search?hl=en&q=fourier%20analysis%20curve%20fitting
No its not. Fourier analysis encompasses a vast spectrum of mathematics. The one you mention is a relatively early process that was developed to analyze spatial frequencies.
Hi Doug,
I believe that Nony is correct about Fourier analysis see
http://en.wikipedia.org/wiki/Fourier_analysis
The whine goes away after you get old (watch to the end of the video):
https://www.youtube.com/watch?v=u1Lz8pm2npQ
Nony,
If you’re interested (unlikely) I recommend “Fourier Series and Integrals (Probability and Mathematical Statistics)” by H. Dym and H. P. McKean: Academic Press, 1972. This book describes how the ideas of Fourier made their way into every branch of mathematics and mathematical physics, from the theory of numbers to quantum mechanics. It concentrates on the power and flexibility of Fourier’s basic series and integrals and on the astonishing variety of applications in which it is the chief tool. It offers a mathematical explanation of Fourier’s ideas on the circle and the line, on finite commutative groups, and on important non-commutative groups.
I realize that the thing you care about is having the last word. Fair enough, have it, I’ve better things to think about.
Aw man. Don’t be like that (last word). You’re a nice guy and I have a trollish bone in my body. I concede.
I know there are a lot of people that love Fourier, but I never liked it much or learned it much. I really preferred in diff e q course, when we got a good exact method of solving things. Something some Frenchman from the 1800s came up with. Fourier always looked a little messy to me, too close to numerical methods. 😉
Nothing in the .pdf about frequency domain.
But there could be. Dunno how the seismic signals are sent and received. One would guess they could chirp inside the pulse. It’s done for ground penetrating radars but pretty shallow from oil’s perspective.
I’m really fascinated by all of the widespread reporting in the media about how exports of oil and natural gas from the US to Western Europe could reduce Western Europe’s dependence on energy imports from Russia.
Of course, one small, itsy-bitsy, tiny little problem is that the US is a net importer of both crude oil and natural gas. But why let a fact like that get in the way of a good story?
Jeff,
Here is an interesting chart that I just put together. U.S. natural gas marketed production has increased nicely from 2006-2012. Unfortunately, 2013 wasn’t such a banner year compared to previous years.
As we can see from the chart, marketed gas production in the states increased at least 2.4% each year and in 2011 & 2012 it was up 7.1% & 5.4% respectively. However, estimated marketed gas production only increased 300 Bcf to 25.6 Tcf which is only a 1.2% growth rate compared to 2012.
I believe the reason gas production increased so much in 2011 was due to the increases from most shale has fields as well as the ramp-up of the Marcellus. However, in 2012 several of the shale fields such as the Barnett, Haynesville and Fayetteville peaked.
In 2013, the only real growth came from the Marcellus including a tad from the Eagle Ford. It will be interesting to see if the industry will be able to continue increasing overall production in the states with that 24% annual decline rate.
Furthermore, the industry doesn’t seem to be adding many new gas rigs to take advantage of the much higher NatGas price.
steve
One small clarification that I would add is that marketed natgas production include NGL’s, which are also counted as total liquids production. Dry (processed) natgas production is a better indication of the volume of actual natgas delivered to consumers. Dry natgas production has basically been flat at about 66 BCF/day since late 2011. However, the EIA appears to have revised downward their initial 2012 production estimate, and they are currently showing both 2012 and 2013 at about 24 TCF (dry processed). Assuming a similar downward revision for 2013, it’s entirely possible that we actually had a decline in dry natgas production from 2012 to 2013.
And as noted up the thread, Citi Research estimates that we have to replace 100% of current US natgas production (24 TCF/year in 2013) in about 4 years, just to maintain current US natgas production for 4 years. Or in round numbers, based on the Citi Research estimate, in about 4 years–in order to maintain a production rate of 24 TCF/year–we need to replace the productive equivalent of the combined 2012 dry processed natural gas production from: Iran + Qatar + Canada + Norway + Netherlands.
Jeff,
1. 5 years ago you predicted Saudi oil production would decline. So did a lot of your peaker compatriots. “Twilight in the Desert.” Saudis seem to be hanging in there.
2. Our imports come from Canada. Currently, we don’t export except back to Canada or a little back and forth with Mexico. It’s a closed system. If you open up exports and allow price to rise to 5.50 or so, there is a lot of capacity available. Just look at all the rigs that moved off of gas because of the glut. What you see happening is shale gas displacing some Canadian, some US conventional, even see cheaper shales displacing other shales. But it’s all trapped production now.
(For 2, gas imports)
Nony, nobody really gives a crap what people predicted 5 years ago. What did you predict 5 years ago?
Anyway we were all correct about Saudi declining. Every saudi field that was in production 5 years ago, with the possible exception of Shaybah has declined, and perhaps declined quite a bit. We all knew five years ago that Saudi had both Khurais and Manifa was soon to come on line, Khurais with a possible 1.2 mb/d and Manifa with a possible .9 mb/d. Were it not for these two fields it would be obvious to the world that Saudi is in steep decline. Now there are no more fields to be brought on line, we will soon see what happens when Saudi has no more fields to bring on line.
So please knock this crap off about reminding people what they predicted 5 years ago. No one really gives a crap.
I wouldn’t grind someone for being wrong if they learned from it and if they reflected on it honestly.
But I will leave him alone. Just the TLAs, splatted charts, and misunderstood econ 101 is enough reason to ignore him. I bet he bores his own side. (Even if you are sticking up for your tribemate. ;-))
Nony,
While I admire an individual who can play “Devil’s Advocate” well, your method comes across as rather petty. You seem to look at those who have been forecasting a quicker PEAK as “negative” (Art Berman for example) and those who believe in unlimited growth forever as being more “Positive.”
I believe a good percentage of recent (and present) global oil production has been stolen from the future. Even though technology has slowed the decline rate in many fields throughout the world, it has sped up the overall depletion rate.
Regardless… the NOTION that we can continue increasing oil & gas production as being a “Positive” aspect of human engineering fails miserably if certain forecasts for global warming come true.
The chart below shows a forecast of global warming based on a exponential trend now due to 28+ self-reinforcing feedback loops.
4 in 2011
6 in 2012
18 in 2012
Nony… if you like to brag that the peak oil CORNUCOPIANS got it wrong by a few years…. maybe they were wrong for the right reasons. Reasons more important than the world continuing to manufacture and buy crap that they really don’t need.
steve
correction
18 in 2013
Steve,
I thought I recommended you be shot for bringing up stuff like the above chart. Why are you still here? That’s not scary, that’s bloody terrifying. Shame on you.
Doug
Doug,
I know… life of the party, aye? By the way, I am glad that you found Dr. Paul Craig Roberts interview interesting. I am still amazed just how many Americans fall for the MSM “Putin is the blame” mentality.
As it pertains to global warming, I had no idea just how hot the Arctic has become in the past few years. The methane releases from the Arctic are scary indeed.
However, East Siberian Arctic Shelf research scientists, Natalia Shakhova & Igor Semiletov believe we could see a 50 giga-ton methane burb at any time in the future.
That would nearly be the equivalent of all the carbon released since the beginning of the industrial revolution.
That light red line on the chart shows the Arctic temperature which has increased 4-6 times the rate of the globe.
The 28+ self-reinforcing feedback loops are what really have me concerned. It looks like there is no way of turning off this thing.
As a rapid warming is now….. IN THE CARDS
steve
Where can I find all the warming feedback loops all in one place?
Old farmer mac,
You can find them in this huge document if you scroll down at this link below:
http://guymcpherson.com/2013/01/climate-change-summary-and-update/
steve
MacPherson is seen as a bit of a crank by the real pros…
I suggest you follow RealClimate.org
and if you like, pose a question in the Unforced Variations thread
http://www.realclimate.org/index.php/archives/2014/03/unforced-variations-mar-2014/
Who know, maybe Michael Mann himself will reply…
Things are scary enough without straining credulity….
Flakmeister,
You have made a seriously incorrect assumption on Mcpherson as well as Realclimate.org. Paul Beckwith who is one of the leading Climate scientists out of Ottawa, Canada explains in several interviews that the changes and data coming from the Arctic are occurring much more rapidly than what the climate scientists on Realclimate.org have either forecasted or modeled.
There are many REAL PROS who do not view Mcpherson as a crank. I believe the scientists at Realclimate.org are not paying attention to the actual data that is coming from the field scientists.
Mcpherson only uses actual “Scientific Papers” in his speeches and presentations. Furthermore, there are at least another dozen climate scientists who believe a rapid warming is possible.
Furthermore, the Russian scientists studying the East Siberian Arctic Shelf are very worried about the changes they are seeing within the last few years.
https://www.youtube.com/watch?v=kx1Jxk6kjbQ
I believe RealClimate.org tends to behave more like the EIA & IEA.
steve
OFM.
Realclimate is very good.
Webhubbletelescope is also doing some interesting stuff at his blog “context earth”.
He does not have the climate science credentials of the people at real climate though.
It’s been established that an enormous amount of money is being spent to fund climate change denial. I suspect a few years from now we will hear a certain amount has also been going towards peak oil denial.
http://www.theguardian.com/environment/2013/feb/14/funding-climate-change-denial-thinktanks-network
It’s only logical that some of this money goes towards paying people to disrupt websites and blogs that explore these issues so as to discredit and cast doubt on the ideas and data being examined. If I had millions of dollars to spend on denial/disruption of this type, it would be an insignificant part of my budget to hire a few dozen people to do this from home part time in their pajamas.
Other than being paid, there is no reason to spend hours each day as a gadfly on a peak oil issues site. If someone is sure Peak Oil (or peak energy) is not going to happen no way, no how for at least the next hundred years, then life is easy! Do nothing! The energy will continue to flow, the US will squander vast amounts, and though the planet may eventually become a crispy tostada, the fact that a few people worried about Peak Oil in 2014 will have absolutely no impact. It’s not like the US is doing anything at all about Peak Oil. No one (except maybe the military) is making any kind of preparation that might have significant effect. Those individuals that take Peak Oil seriously might be putting some solar panels on their houses, planting vegetable gardens, riding bicycles, boring their friends and family with their data and concerns, etc., but it’s not as if any of this will keep cheap oil (or gas) from being pumped out of the ground if the oil/gas is indeed there to be pumped cheaply.
I’m not saying to censor anybody who comes to this website. And from what I’ve seen here, if someone has genuinely made a miscalculation or read the data the wrong way, they are happy to receive a correction so that their analysis/model will be stronger in the future.
But for anyone convinced that Peak Oil is entirely wrong, you really don’t have to argue or do anything about it at all. All US policy, infrastructure and culture is already on your side. Rest easy, buy a new car, go play with your dog. Let Peak Oilers fret and stew–they aren’t really harming anybody. Time will tell who is right soon enough.
In a way, paid blog disrupters are validation of Peak Oil theory. It’s only if Peak Oil is close and the need for adaptive strategies is growing clearer that so much money and energy needs to be spent obscuring it.
Karen,
Interesting observation.
That being said… I wonder how things unfold from here on out in the next decade. I believe there is a good chance that economic events & climate-weather conditions move from a “linear” to more “rapid” change.
I have been toying with the idea of getting out of Dodge and moving to a more simple life on one of the Hawaiian Islands where my wife’s family is located.
I will continue to research and write on the internet for the foreseeable future, but I believe we will make a move within the next 1-2 years.
Even though I enjoy sitting in front of this computer for hours on end doing research for my website… I’d much rather be in a more natural and healthy environment.
steve
Karen,
If I had read your comment here a few years ago it would have been tempting to label you as delusional. We do live in the free world after all. However, since that time I’ve seen innumerable articles and papers discussing global warming, many of which had provision for reader’s comments. Scanning comments, in general, it’s almost rare to find anyone doing anything other than poring scorn on the very idea; it does make you wonder.
Doug
I’m getting $1500/day. My clients are satisfied that I’m FUDding well.
Unfortunately, I don’t think they’re going to pay for much more time since the popular media is onboard and TOD is dead.
I might have to go back to tobacco and guns. Way less science fun.
You’re very good at Fear, Uncertainty and Doubt.
Brilliant! Bravo!
Our friend Nony helpfully pointed out that after my first article on net oil exports was posted (in early 2006), the rate of change in Saudi production, relative to 2005, only stayed negative for five years, before increasing to an estimated rate of change of +0.6%/year in 2013, relative to 2005 (versus +7.7%/year for 2002 to 2005), although the post-2005 average Saudi production rate remains below the 2005 rate (total petroleum liquids + other liquids, EIA).
However, Nony remains curiously silent about the post-2005 negative rates of change, relative to 2005, in Saudi and Global Net Exports of oil ( see info down the thread).
And following is a copy of a question I asked up the thread:
I usually get qualitative objections to what is a quantitative mathematical observation about what I call “Net Export Math.” However, insofar as I know, our friend Nony has not directly addressed this mathematical observation. So, I would like to ask Nony–and everyone else–if you can identify any factual errors in the following statements. Note that I have added an ANE corollary.
EXPORT LAND MODEL (ELM)
“Production declines in net oil exporting countries are inevitable, and given an ongoing production decline, unless they cut their domestic consumption at the same rate as, or at a rate faster than, the production decline rate, the resulting net export decline rate will exceed the production decline rate and the net export decline rate will accelerate with time. Furthermore, if the rate of increase in consumption exceeds the rate of increase in production, a net exporter can become a net importer prior to a production peak, e.g., the US and China.”
ANE* COROLLARY
A decline in GNE* is inevitable (we have already seen, through 2012, a post-2005 decline in GNE), and given an ongoing production decline in GNE, unless China & India cut their net imports at the same rate as, or at a rate faster than, the GNE decline rate, the resulting ANE decline rate will exceed the GNE decline rate and the ANE decline rate will accelerate with time.
*GNE = Global Net Exports of oil, (2005) Top 33 net oil exporters, total petroleum liquids + other liquids (EIA)
ANE = Available Net Exports = GNE less Chindia’s Net Imports
(CNI) = Supply of GNE available to importers other than China & India
For what it’s worth, I actually suggested 8 years ago (in early 2006) that Saudi Arabia was on the verge of a permanent and irreversible decline in production. At the time, Saudi total petroleum liquids + other liquids production was increasing at 7.7%/year (EIA, 2002 to 2005). Since 2005, Saudi production was below their 2005 rate of 11.1 mbpd for five years, 2006 to 2010 inclusive, and then above their 2005 rate for three years (through 2013). Assuming a production rate of about 11.6 mbpd for 2013, their 8 year average production rate would be about 10.8 mbpd versus 11.1 mbpd in 2005. Again, assuming a 2013 production rate of 11.6 mbpd, the 2005 to 2013 rate of increase in production would be 0.6%/year, versus 7.7%/year from 2002 to 2005.
In any case, my subsequent prediction was that 2005 was more likely than not the final production peak for Saudi Arabia, but it was very unlikely that Saudi Arabia would ever again exceed their 2005 net exports rate of 9.1 mbpd, and it would appear that 2013 was the eighth year in a row that Saudi net exports were below 9.1 mbpd (total petroleum liquids + other liquids).
Following is a link to my first article on net exports, focusing on the three top net exporters at the time (Saudi Arabia, Russia & Norway) where I introduced the ELM concept, which is just a simple mathematical model to help me understand, and then explain, “Net Export Math,” (to those not in denial about fundamental mathematical facts).
In retrospect, I was too pessimistic about Saudi and Russian production, but on the other hand, Saudi net exports have been below their 2005 rate for (probably) eight straight years, and Russian net exports stopped increasing in 2007, with Russian net exports in subsequent years being at or below their 2007 net export rate. As expected, Norway’s net exports continued to decline. The bottom line is that after combined (Top Three) net exports increased sharply from 2002 to 2005, their combined net exports were below their 2005 rate through 2012, which of course contributed to the post-2005 decline in Global Net Exports of oil.
And regarding production increases versus depletion, the Six Country Case History shows that as their production increased at 0.5%/year from 1995 to 1999, their remaining supply of post-1995 Cumulative Net Exports (CNE) fell by 54%.
In a similar fashion, I estimate that, as Saudi production increased at about 0.6%/year from 2005 to 2013, they may have already shipped about 40% of their post-2005 CNE.
Here is the link to, and the concluding paragraph to, my early 2006 essay on net exports, and following is the 2002 to 2012 “Gap Chart” For Global Net Exports of oil (Top 33 net oil exporters in 2005).
You will note the rate of increase in GNE (2002 to 2005), that we were experiencing when I wrote my short essay on net exports in early 2006.
Hubbert Linearization Analysis of the Top Three Net Oil Exporters
(January, 2006)
http://www.theoildrum.com/story/2006/1/27/14471/5832
Excerpt:
“As predicted by Hubbert Linearization, two of the three top net oil exporters are producing below their peak production level. The third country, Saudi Arabia, is probably on the verge of a permanent and irreversible decline. Both Russia and Saudi Arabia are probably going to show significant increases in consumption going forward. It would seem from this case that these factors could interact this year produce to an unprecedented–and probably permanent–net oil export crisis.
And the 2002 to 2012 Saudi ECI Ratio (Ratio of production to consumption):
Who’s predictions were better?
Reasons for Decision In the Matter of Enbridge Pipelines Inc.
Application dated 29 November 2012 for the Line 9B Reversal and Line 9 Capacity Expansion Project
p. 68 of document, 85/158 of pdf
Limited liability means a corporation is just a bankruptcy away from not cleaning up any mess they might make.
Hat tip: Mike De Souza
Few charts that would be interesting:
1. Bakken: rig count by year versus 2012. IOW, 2012 rigs=zero. the reason is that I follow the Million Dollar Way blog and daily rig count is posted and there is an interesting pattern. 2013 definitely down from 2012, but 2014 up.
2. Global supply/demand crude expectations: Would like to see the 5 year futures outlook versus time. 2000 to current. Perhaps also plot the spot crude price. Would like to see when backwarded, how consistent the outlook, etc. Could annotate the chart with some things like Gulf spill, recession, 9-11 or other prominent demand/supply shocks. Probably Brent is the best one to post since WTI shows effects of US trapped crude and transport issues within the US.
3. Regional gas supply/demand outlook: 5 year futures, Henry Hub. 2000 to current. Also the spot price. Purpose is to allow us to see when the market changed outlook on supply/demand (shale gale). [I think the future price shows pretty clearly that the market does not buy the Berman view, touted since 2009) that shale gas is a production bubble. It’s pretty hard for prices and expectations of prices to stay low for so long if the stuff was really so overpromised, declining too fast, etc.]
I guess (1) is only interesting if there is an issue of seasonality with drilling. If they can drill any weather, it makes more sense to just look at the time series itself.
There is some three forks exploration drilling going on that didn’t in 2013. Dedicated rigs.
Somewhat irrelevant when drill time is a week or so and frack time is multiple months and there is such a large inventory of holes awaiting fracking.
Maybe so. I guess we could still discuss the changes in types of drilling. Maybe normalize by number of holes drilled? Presumably pad drilling is more efficient than exploratory. that said, if both are occurring (more), could counteract each other. I donno…was just an idea I had rattling around.
I guess either way you cut it, it’s more investment into the area (exploratory or infilling, or normal spacing). but if completed wells are the real metric, maybe just wells versus time is the key metric. Shows how much people are investing, whether that is diminishing returns milking or speculative exploration.
I don’t know. Going to go exercise outside. Internet makes me cranky sometimes. Sunshine and sweat make me feel good inside.
”It’s pretty hard for prices and expectations of prices to stay low for so long if the stuff was really so overpromised, declining too fast, etc.”
This remark carries more weight than most of what you have to say in my humble opinion.
But maybe it just seems that way.
I find it hard myself to understand how the investment industry could be so wrong for so long on a losing bet but on the other hand that industry has been wrong before about things as big and as important such as the housing bubble and subprime loans.
People are incredibly good at believing what they want to believe in spite of any amount of contrary evidence.Most of us are unable to do any thinking for ourselves and rely on the conventional wisdom as it is put forth by the mainstream media and the msm are utterly worthless when it comes to bad news involving the owners of that same media. Telling any unpleasant truths about such things as oil and gas on the business pages is no more tolerated than cussing in church.
In the end I have to conclude that four or five years isn’t that long in terms of public perceptions.
The eventual bankruptcy of General Motors was obvious to anybody who cared to look at the evidence many years before it finally happened.The democrats mostly get it right on the environment and some personal liberty issues for instance but it is hard to find a democrat (among my acquaintances at least) that is willing to even consider the long term math of government employee bennies. But anybody who cares to look at the evidence must conclude that a lot of localities and even states have promised more already than they could can ever possibly hope to pay and also pay future current expenses.
The only people in this country who are telling the unvarnished truth about this are the tea party types and they are so wrong about so many other things that they have no credibility on the few things they are getting right.
We are evolved to understand and react to things on time scales relevant to people living in small bands close to nature.But the world is too big for that frame of reference to work well for us in a lot of cases because even though five years seems like a long time to us as individuals it is only an eye blink in terms of nature and the world economy . Five years is maybe only two blinks of the eye in terms of the American economy.
This is why it seems like peak oil is playing out so slowly to us.
But a historian five hundred years from now will look at this past decade and the next one the same way as we look at a couple of decades five hundred years ago.
Mac,
One day an aged Chinese scholar was asked what he thought was the main effect of the French revolution. His reply: “Actually, it’s too soon to say”. By contrast, now we’re producing a generation that can’t sit down to lunch without checking their i-something 14 times. So if old fools like us think five years is nothing in the grand scheme, we’re in the (tiny) minority.
Doug
Another interesting investor presentation:
http://www.oasispetroleum.com/wp-content/uploads/2014/02/2014-3-OAS-IR-Presentation.pdf
It’s a Bakken pure play (CLR is about 20% Oklahoma) and pretty sizable operator there. IPOed 4 years ago. Stock chart is nice.
I don’t get all the acronyms (maybe some can be deduced from 10-K, not read yet). But some insights (slide #):
4. More than 80% of the acreage is held by production already. (Not the case of needing to hold leases [e.g. Berman’s comments on shale gas glut.) Activity will be development, not lease holding.
5. 17 years of drilling planned.
5. Promising comment about the downspacing, but I would like to see data. Also, this requires some good analysis, since at the end it’s a trade-off. More total oil out, the more you downspace, but diminishing returns as more capital invested because of well interference. (2000 ft spacing gives no interference.)
6. Most of the drilling is development (multi-well pads) rather than exploration.
9. EURs seem higher than USGS and similar to CLR. Is this over-rosy company view versus conservative USGS? (e.g. hyperbolic versis hyperbolic-exponential)? Or lateral length difference (it’s about a 2X difference). Or that they are reporting EURs of current (non downspaced) population, while USGS is extrapolating to EURs for the final downspaced group?
12. Definitely a debt-financed undertaking. D/TEV is about 0.4, so it seems not that crazy. I approve of maintaining the B bond rating.
15. I don’t understand hedging or how to evaluate it. Other than they seem to hedge out about a year or two. So after that the stock has volatility implications of price (affects beta). Perhaps this makes sense operationally. (In worst case, if there is a price crash, the thing is liquidated a year or two out, but allows planning for a year or two, buying frack trucks etc.) Also, I suppose there are costs to hedging independent of the risk (margin amounts, etc.) so no reason to overdo it. [Some purists say not to hedge at all, as the equity owner doesn’t care about volatility.]
16. Little more on the type curves. Would like to know the analysis behind this. Also, is it just their acreage or overall basin?
20. Not sure I understand this. Are these wells already drilled or are these projected wells? Only 25% are proven (PUD) reserves.
22. Differential to WTI is interesting. My impression is that this is transport difference, but I would like to see a good discussion of how WTI and Bakken compete at a refineries door. From the CLR presentation, seems that it would be comparable or even better for the Bakken. Also, all the independent discussions about the differential refer to transport issues, not to quality. But Rune and Watcher are suspicious that the oil is not as good (it is a peaker meme that any new oil sources developed will be “low quality”. This was the rap in mid 2000s when sands was the cornies hopes, before we even had shale on our radar screens. But there’s no intrinsic reason why high quality (high cost) new sources can’t emerge when price moves high for a long time.) The difference does get very close to zero a couple times, but also WTI itself has some transport issues, measured in OK, not at refinery door.
Wait a second. Quality is an amorphous word.
The questions about the shale oil have to do with two items. 1) Is there diesel and kerosene in Eagleford oil in the same proportions as exist in Nigeria’s Bonny Light? 2) Is what’s in the rail cars from the Bakken all crude or are NGLs occupying some of the barrels/day being quoted as crude.
Item 2 is not a quality issue. It’s a measurement issue.
The EFS is mainly API>45 condensate which implies distillate yield is lower…
According to this (pg 23)
http://inside.mines.edu/~jjechura/Refining/02_Feedstocks_&_Products.pdf
and
http://www.hydrocarbonprocessing.com/Article/3250397/Processing-shale-oils-in-FCC-Challenges-and-opportunities.html
Bakken and WTI have pretty similar assays…
LLS is real deal when it comes to diesel…
In the interests of scholarly purity, I looked up Bonny Light’s diesel content. It said 21% (source is an alibaba listing pimping a shipment).
The LLS content is quoted by Platts in something Ron found, or maybe not. The heading of that column said “EF % by volume” and was talking about Eagleford this and that in other places of the table. Regardless, the reading was 27%, suggesting LLS has more diesel than Nigerian — which is contrary to vague recall of things read, but oh well.
The only parts I understand:
“Any forward-looking statement speaks only as of the date on which such statement is made and the Company undertakes no obligation to correct or update any forward-looking statement, whether as a result of new information, future events or otherwise, except as required by applicable law.”
“Our production forecasts and expectations for future periods are dependent upon many assumptions, including estimates of production decline rates from existing wells and the undertaking and outcome of future drilling activity, which may be affected by significant commodity price declines or drilling cost increases. ”
Yup, let the fairy tale begin.
Six years after having seismic testing on my small ten acre property in Cumberland county Illinois, I’ve been approached by a land management operation, Legacy Energy, offering to lease the mineral rights to my land. Talk about scraping the bottom of the barrel. There have been exploration wells drilled in my county but almost all of them that I have looked at on the Illinois State Geological Survey almost all are dry holes. But hope springs eternal at finding a Silurian reef structure that pays off big.
Spending on exploration and production outside North America have tripled, and the production… (check the link).
http://peakoilbarrel.com/wp-content/uploads/2013/12/World-Les-US-Canada.png
But peak oil is dead, LOL.
This link has news on some planned pipelines.
http://www.sacbee.com/2014/03/10/6224691/officials-canadian-oil-wont-hurt.html